Article

Comparison and Analysis of Macro Energy Scenarios in China and a Decomposition-Based Approach to Quantifying the Impacts of Economic and Social Development

State Key Lab of Power Systems, Department of Thermal Engineering, Tsinghua University, Beijing 100084, China
*
Author to whom correspondence should be addressed.
Energies 2013, 6(7), 3444-3465; https://doi.org/10.3390/en6073444
Submission received: 21 May 2013 / Revised: 8 July 2013 / Accepted: 8 July 2013 / Published: 15 July 2013

Abstract

:
China has been experiencing a rapid urbanization and industrialization progress with continuous increase in primary energy consumption. Meanwhile, China’s changing economic and society structure also introduces huge uncertainty to its future energy demand. Many energy research institutes periodically publish projections of macro energy scenarios of China up to 2030 and 2050, but these projections differ from one another in terms of total amount of energy consumption and energy flows amongst sectors. In this work, we firstly illustrate major differences between existing scenarios based on a literature survey. We then compare and analyze the different projection methods, key policy assumptions, and other boundary conditions adopted in obtaining these scenarios. Then an index decomposition method is introduced with the purpose of decoupling the impacts of economic growth and population growth on the projection to energy consumption and greenhouse gas emissions. Our results illustrate that projections from domestic research institutes tend to be more optimistic regarding clean and sustainable utilization of coal in the future. Also, projections on energy consumption in China are exclusively linearly dependent on projections of economic and population growth in most scenarios, whilst in some other scenarios the impacts of oil price, international trade, and other drivers are also rather significant.

1. Introduction—Macro Energy Scenarios of China in Published Reports
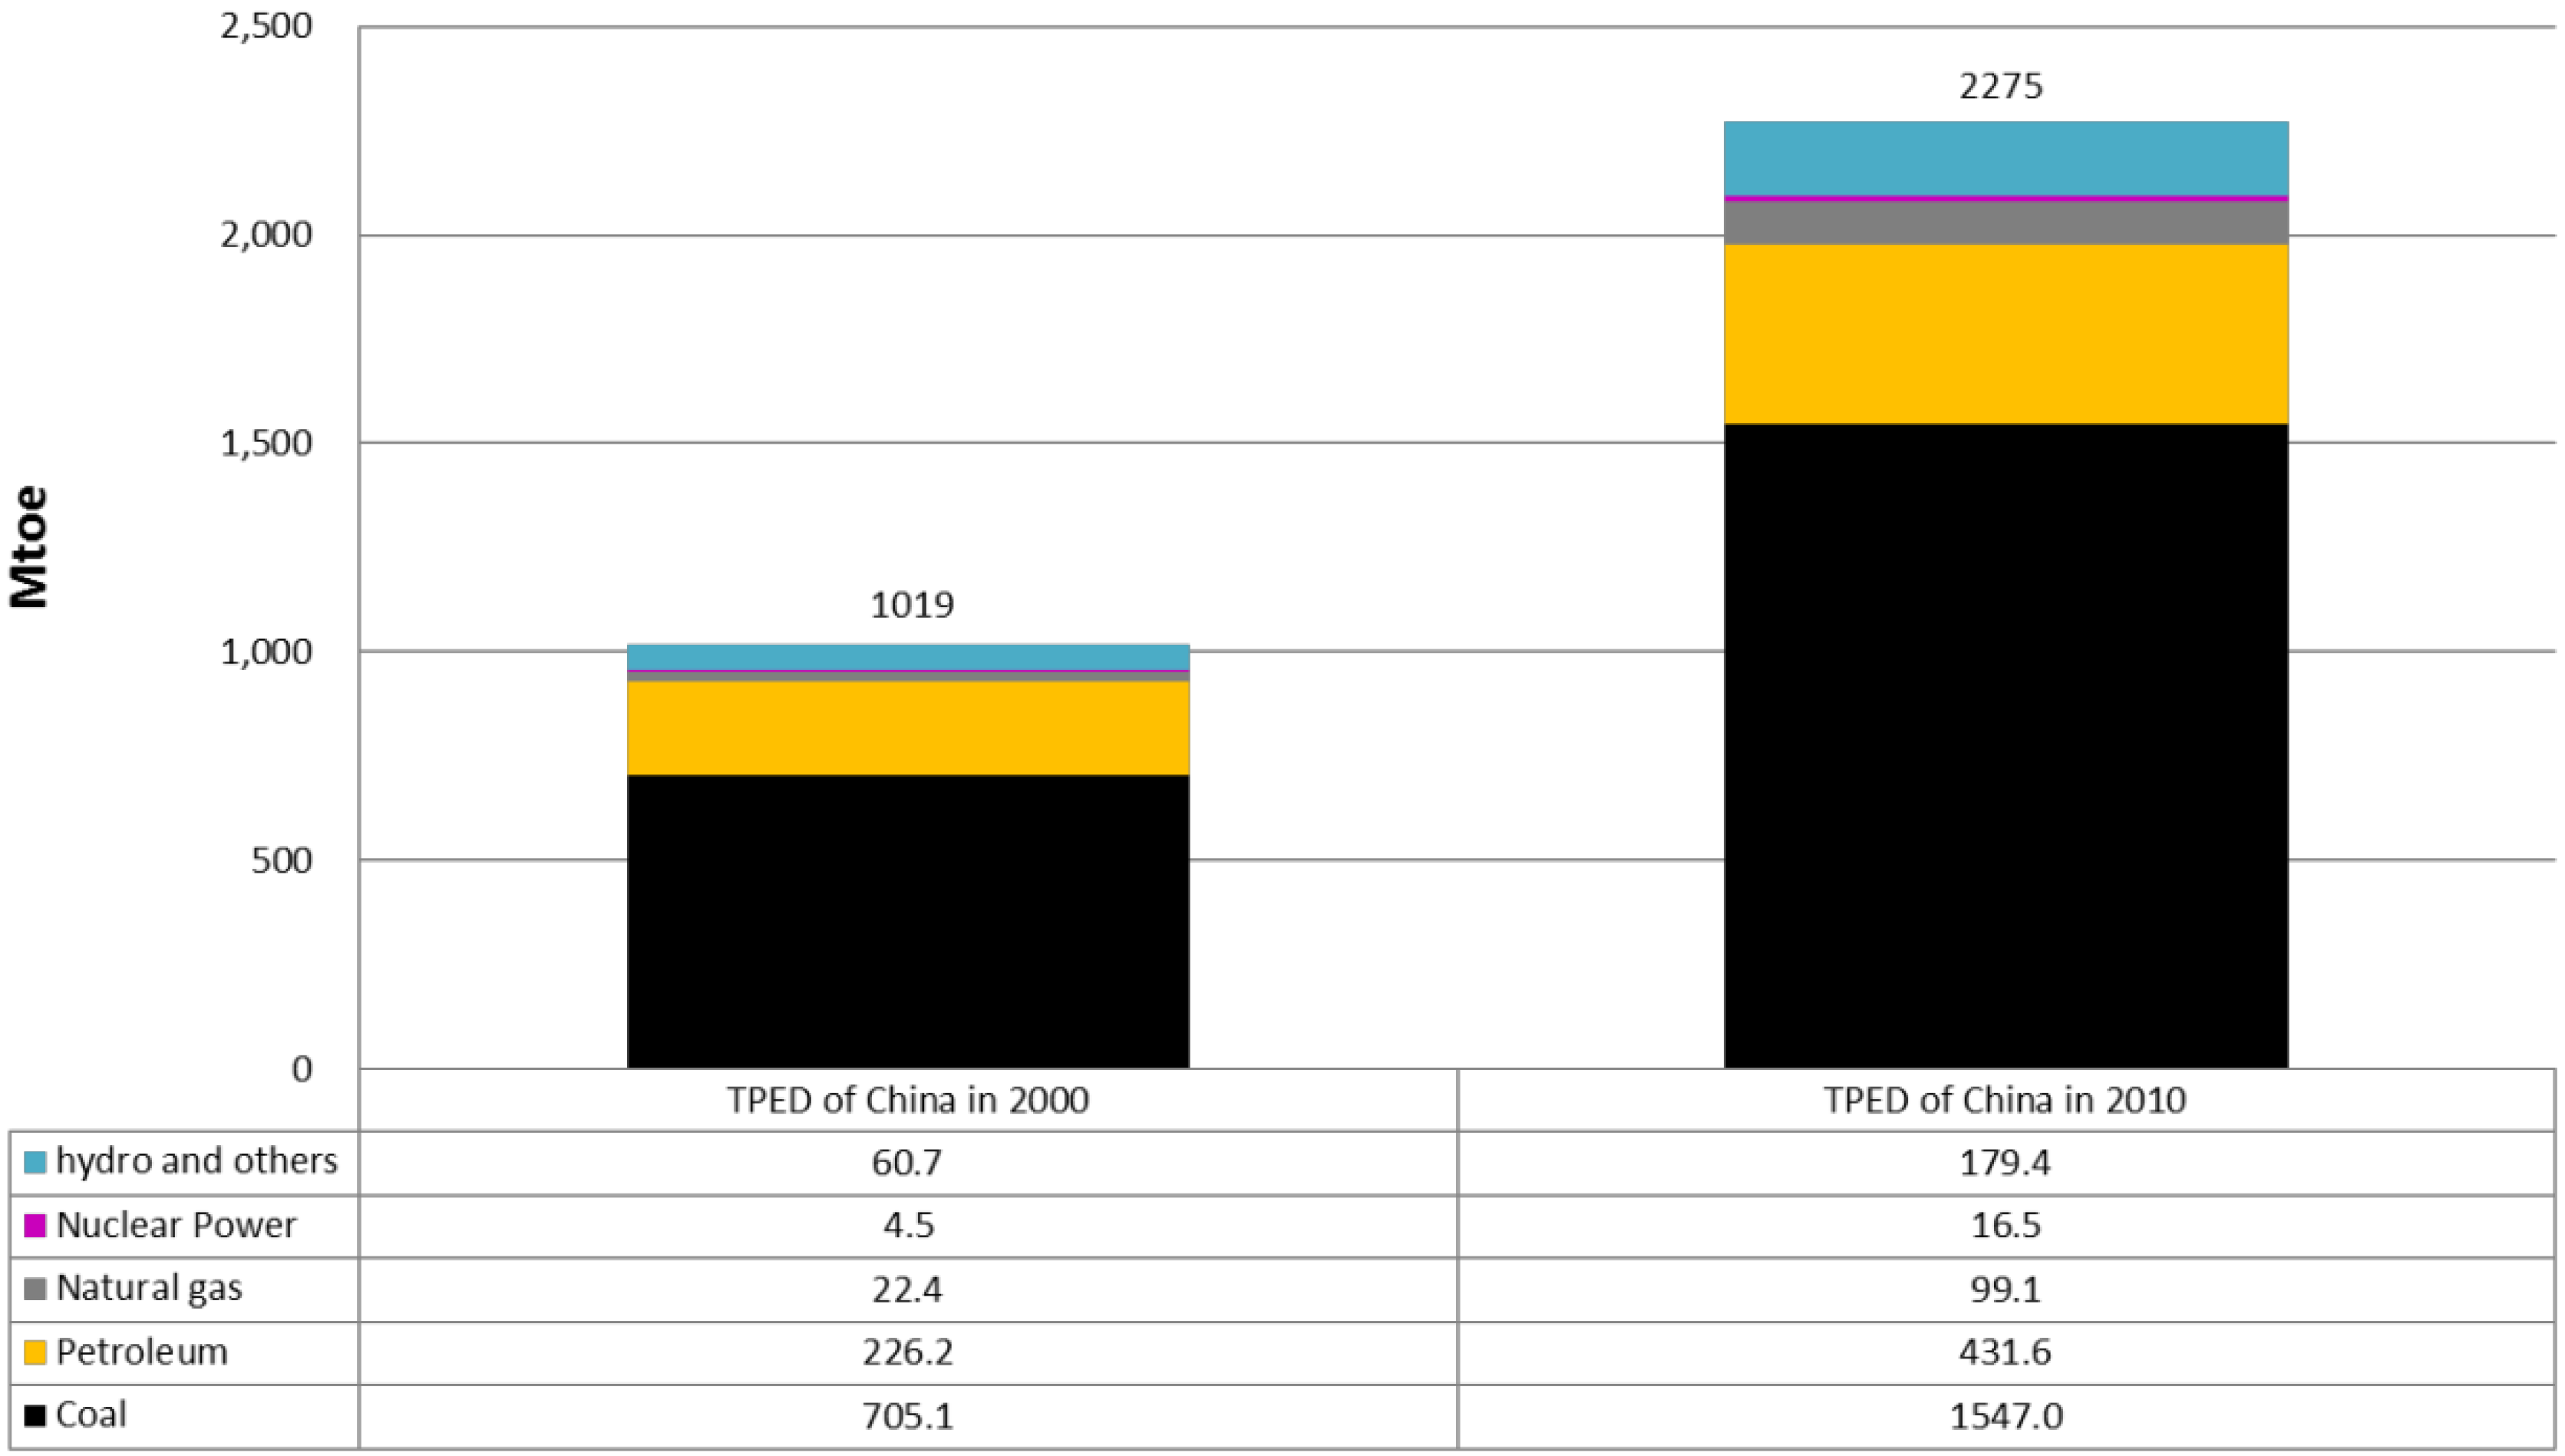
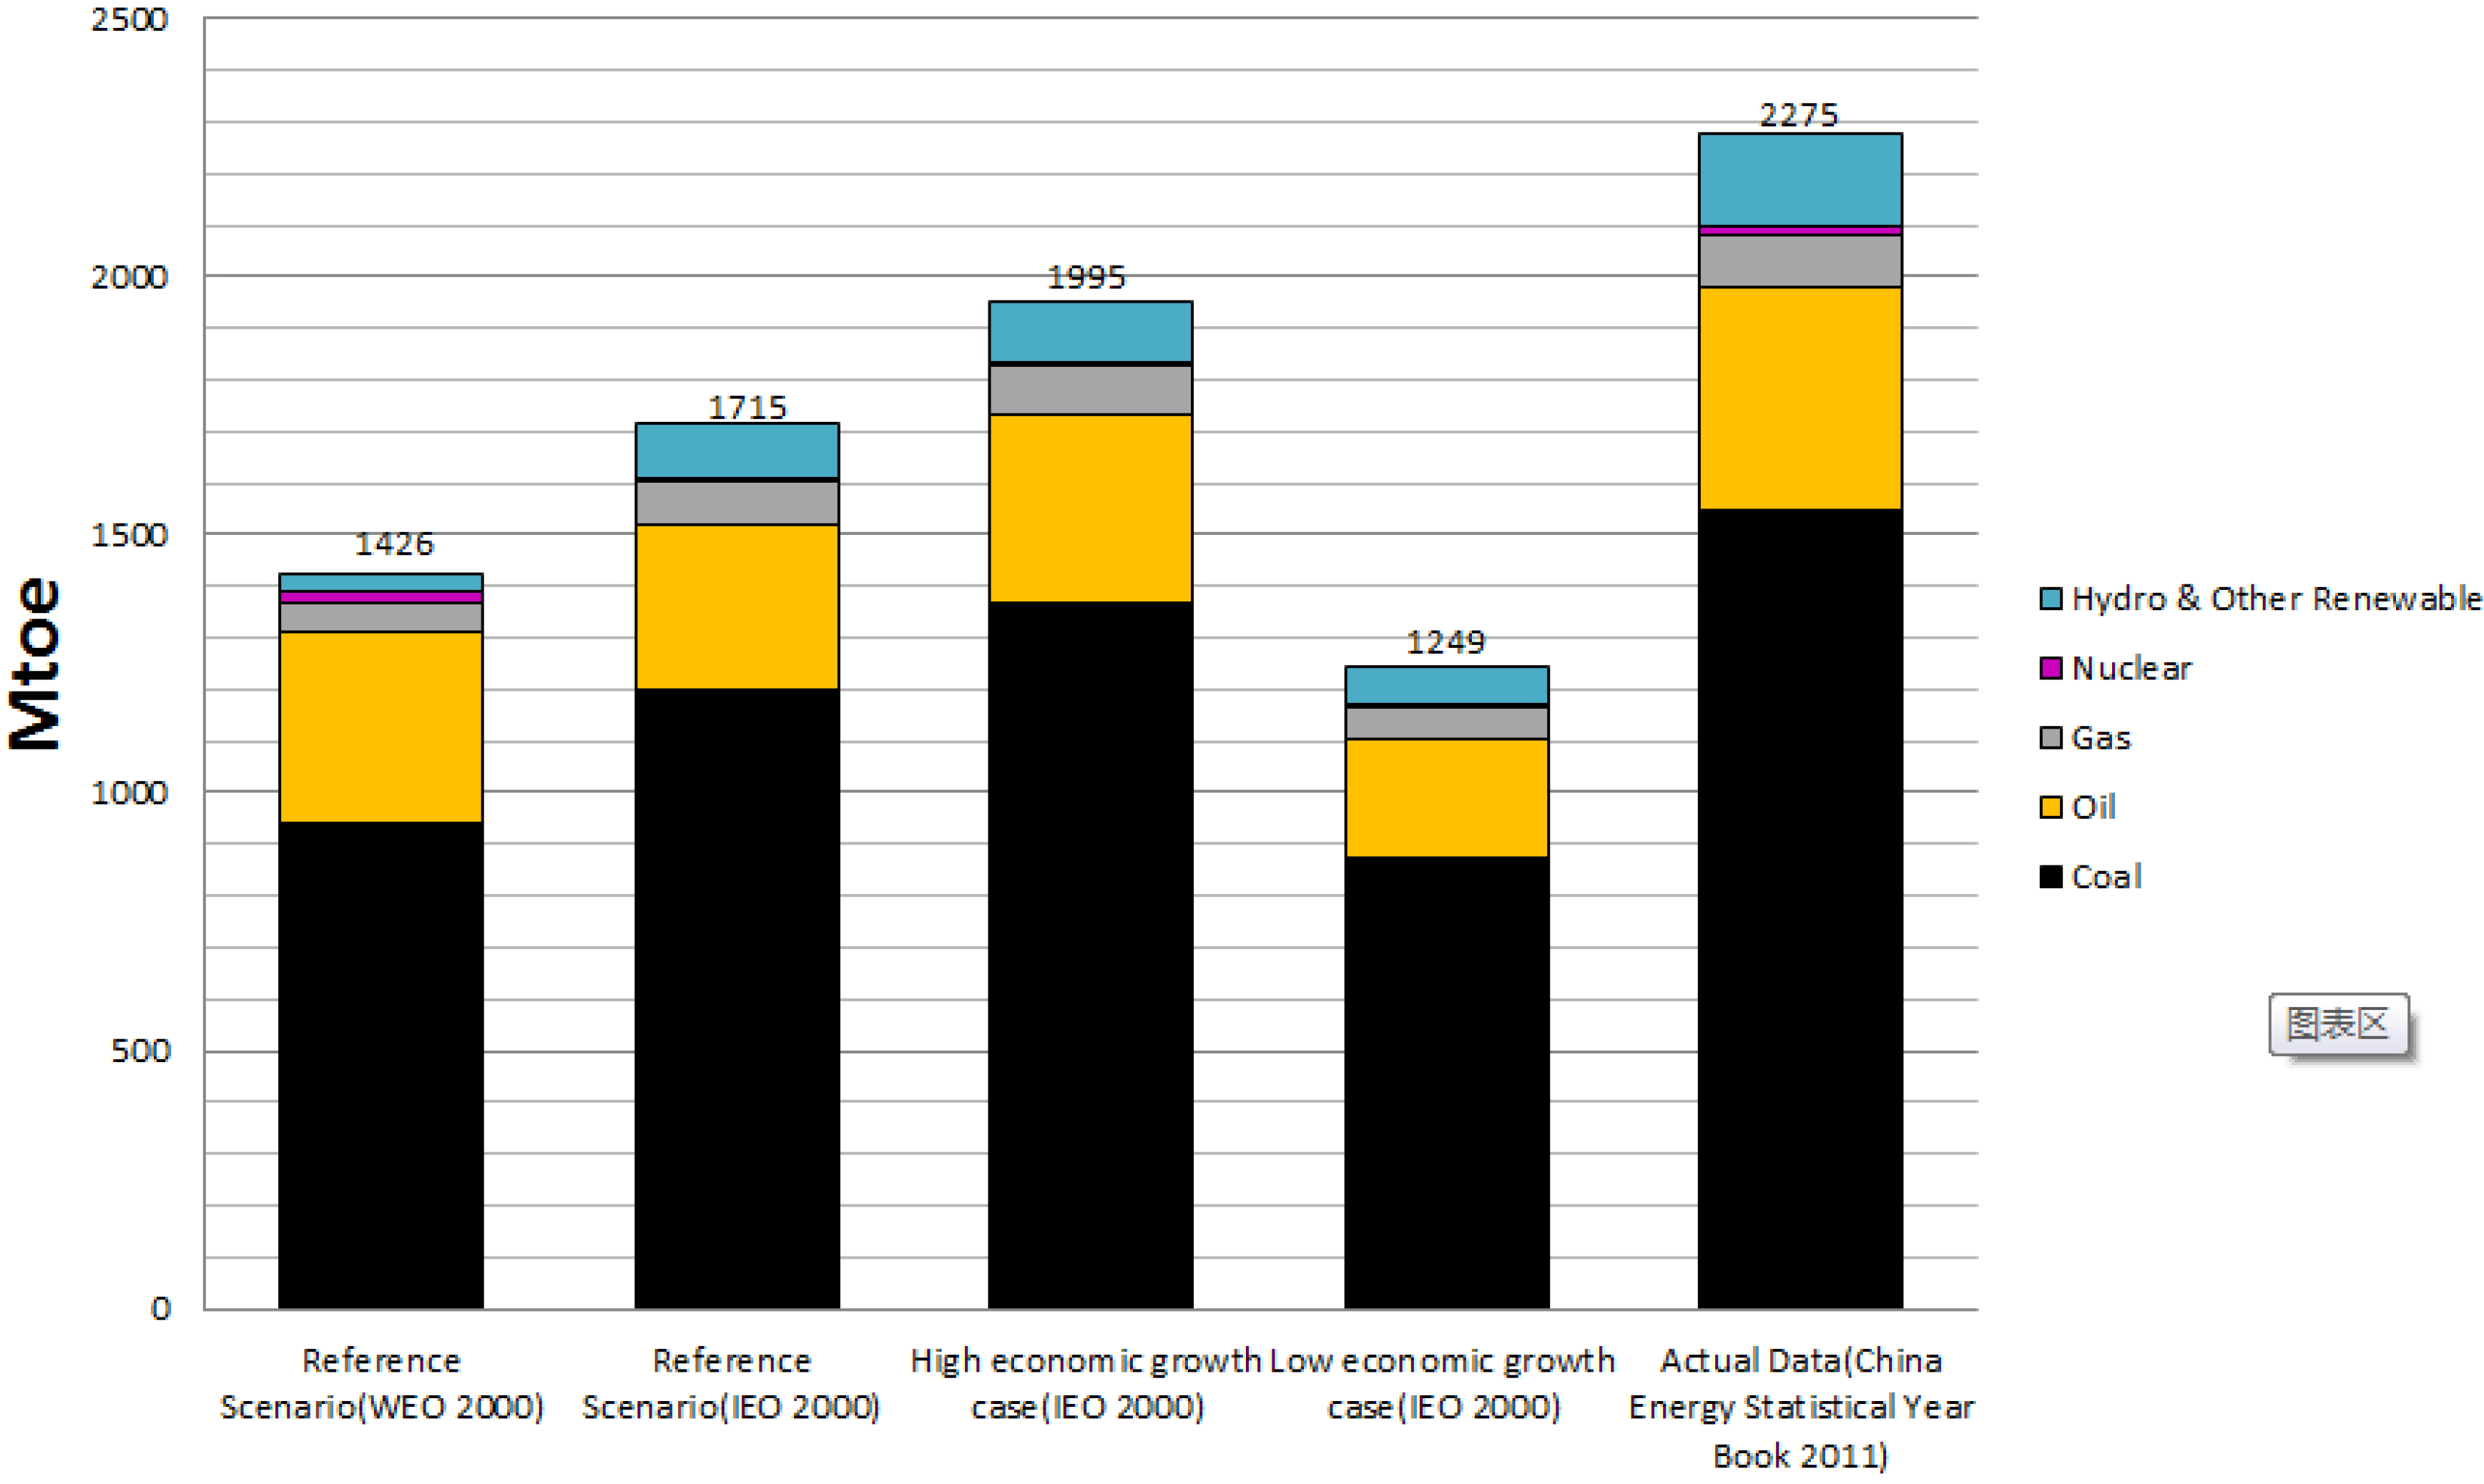
China has been experiencing a rapid economic growth during the last decade, and its energy consumption has also been increasing in a proportional manner. During the period between 2000 and 2010, China’s primary energy increased by 123%, from 1019 million tonne oil equivalent (Mtoe) to 2275 Mtoe, when its coal consumption increased by 119%, oil consumption increased by 91%, and natural gas consumption increased by 342%, as shown in Figure 1 [1]. In 2009, China’s primary energy consumption accounted for 18.7% of the global energy consumption, and its coal, oil, natural gas consumption accounted for 46.3%, 9.6%, and 3.1% respectively [2]. This rapid increasing trend is widely projected to continue in a foreseeable future as a result of an optimistic expectation of China’s economy. This indicates that energy consumption is not only of great importance to China, but also to the whole world in the aspect of energy-related greenhouse gas (GHG) emission control.
Figure 1. China’s primary energy consumption in 2000 and 2010.
Energies 06 03444 g001
The projections to energy consumption and energy-related GHG emissions of China have already drawn the attention of many energy research institutes. Particularly, the U.S. Department of Energy and the International Energy Agency publishes and updates projections to the World’s energy consumption, including China’s, in a regular manner. The projections to China’s energy consumption have been a major part of their reports, for instance, International Energy Outlook (IEO) and World Energy Outlook (WEO) [3,4], ever since 1990s. In 2000, both institutes published projections to the total amount of primary energy consumption of China by 2010, but the accuracy of these projections is not satisfactory compared with the actual historical data. In all the projected scenarios, even the one with the highest expectation of economic growth, the projected primary energy consumption is much lower than the actual consumption in 2010, as shown in Figure 2 [3,4,5]. This is largely due to the inaccurate estimates of economic growth rate, population growth rate, and fuel prices. The inaccurate projections to China’s energy consumption also led to the inaccuracy of projections to the world energy consumption to a large extent. For instance, in WEO 2009 [6], the difference between the projected energy consumption of China in 2010 and the actual one is 849 Mtoe, whilst this value for the whole world is merely 900 Mtoe. Therefore, obtaining a more accurate projection to China’s energy consumption is also of great significance to the whole world.
Figure 2. Projection and actual primary energy consumption of China in 2010.
Energies 06 03444 g002
However, due to various projection methods, policy assumptions and other key scenarios settings, these macro energy projections of China differ, sometimes greatly, from one another in terms of total energy consumption, energy consumption by sector, and energy flows between sectors.
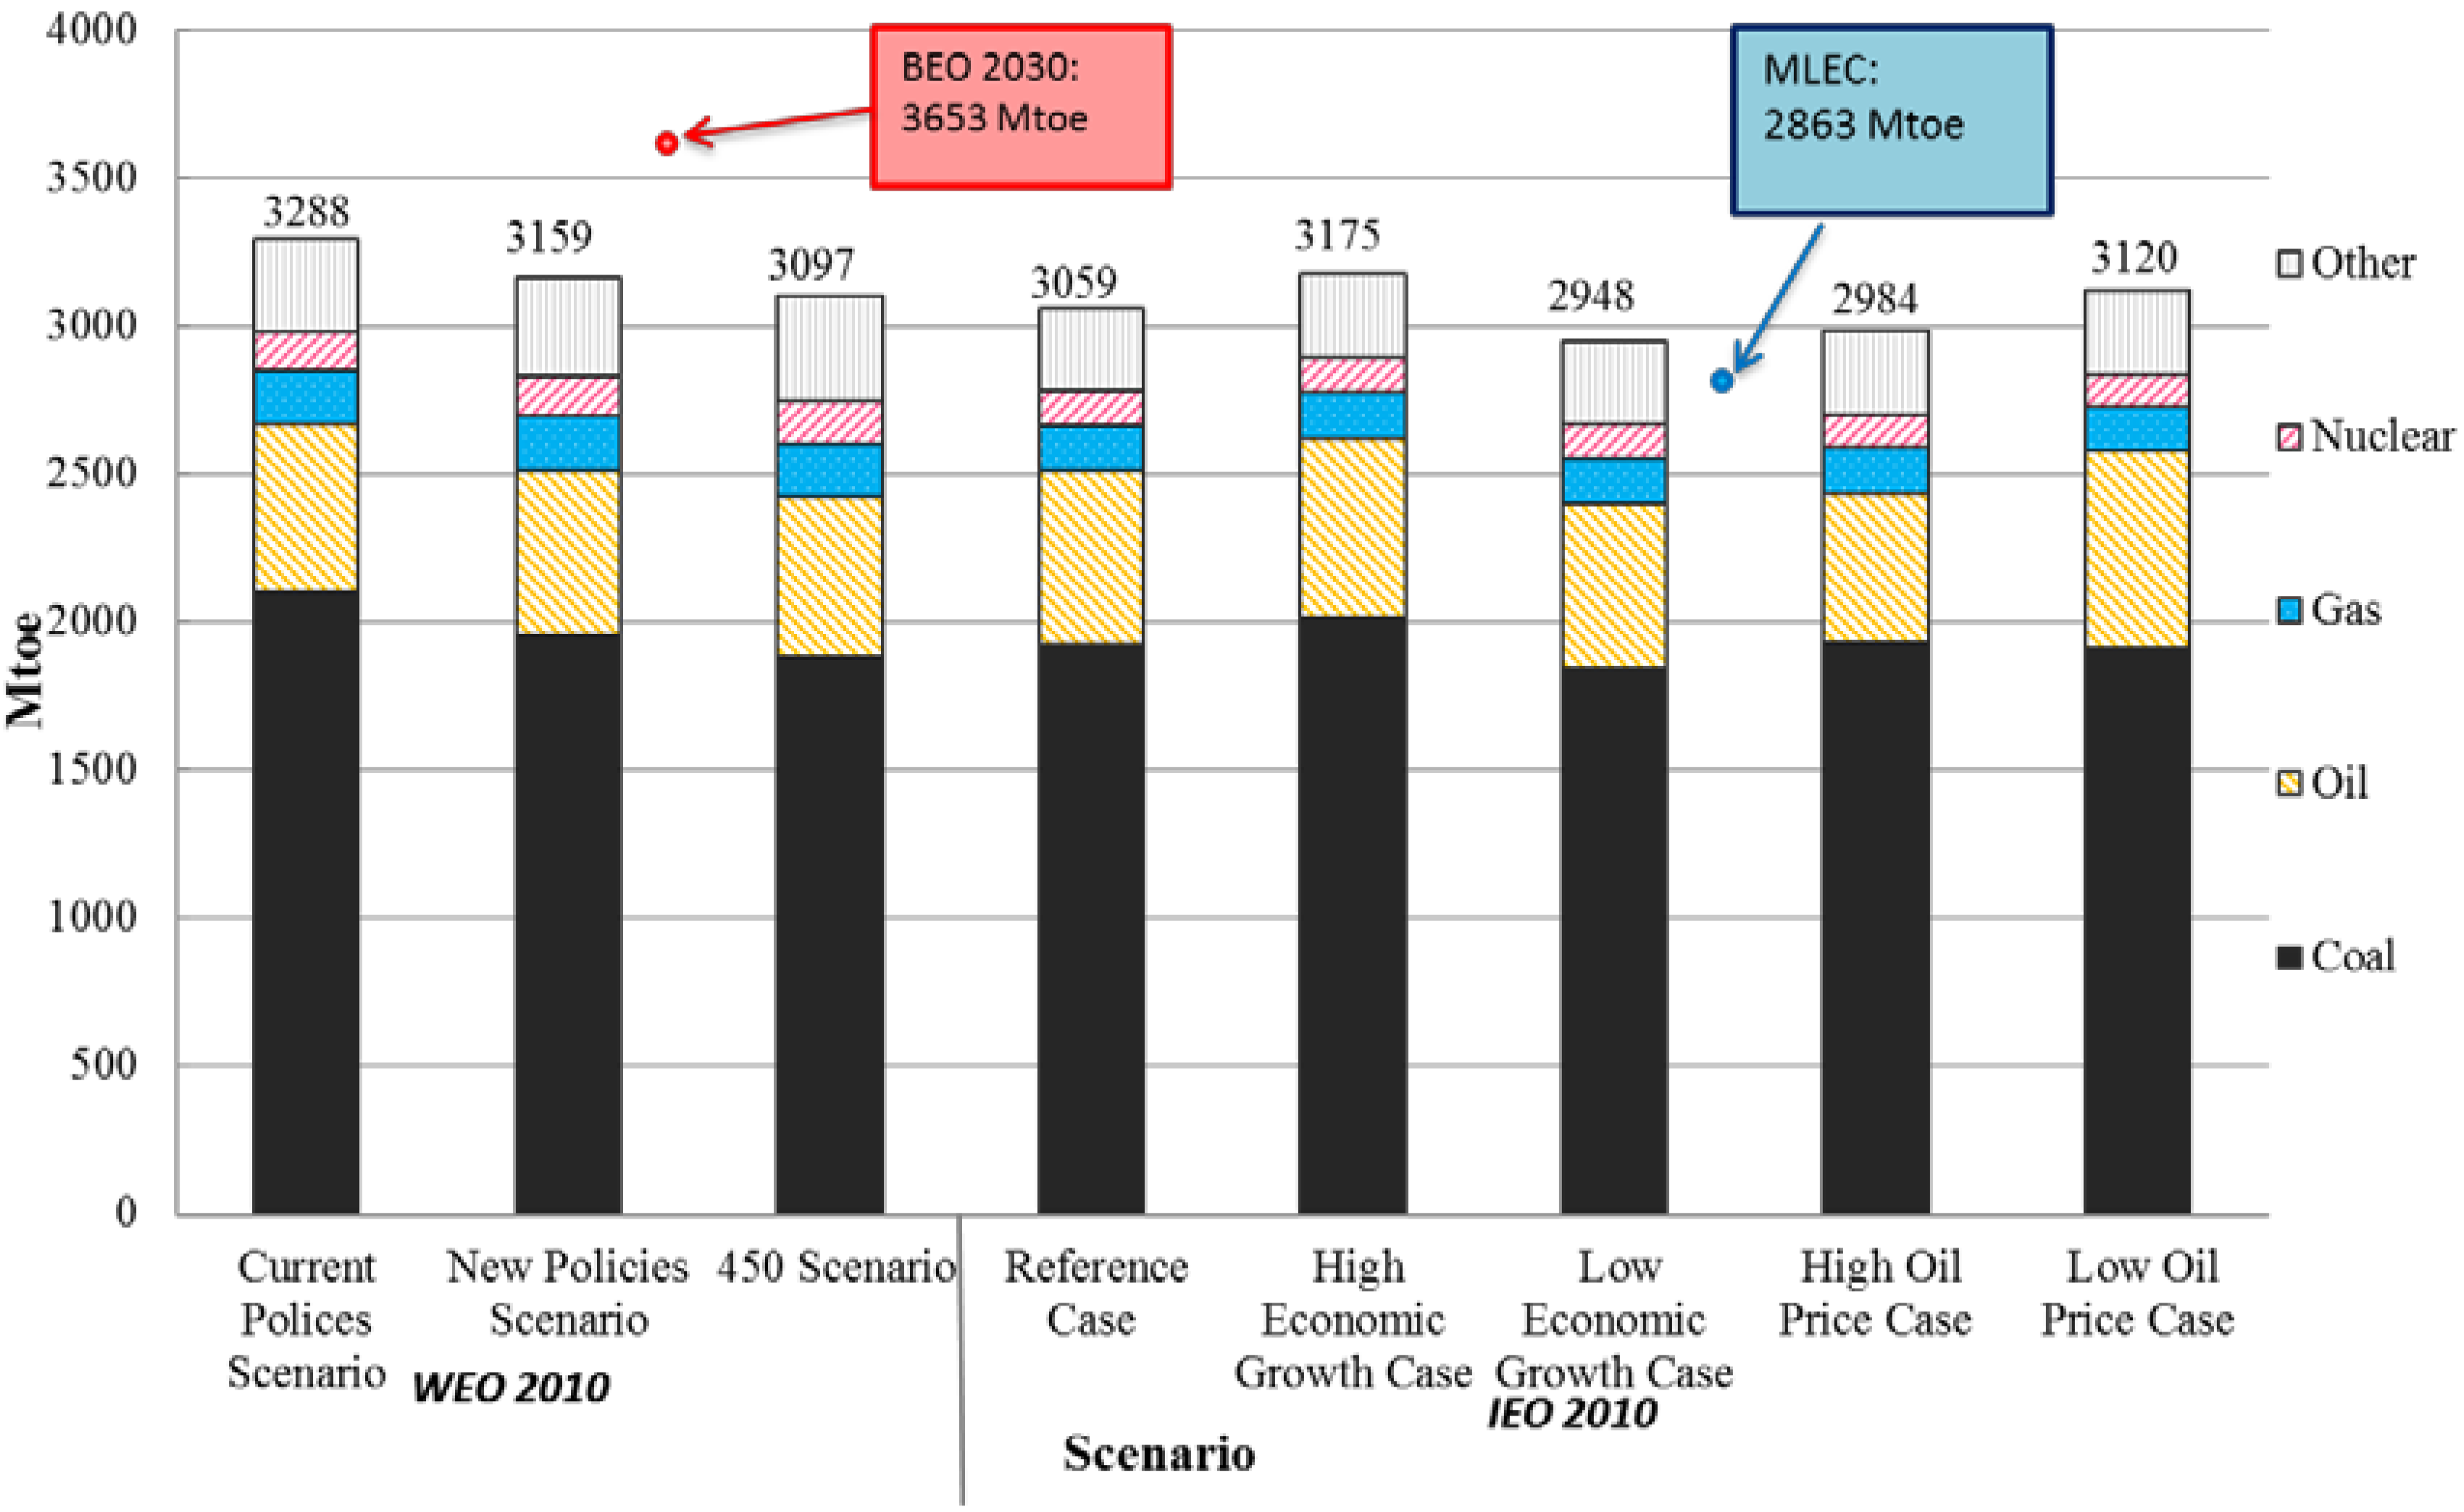
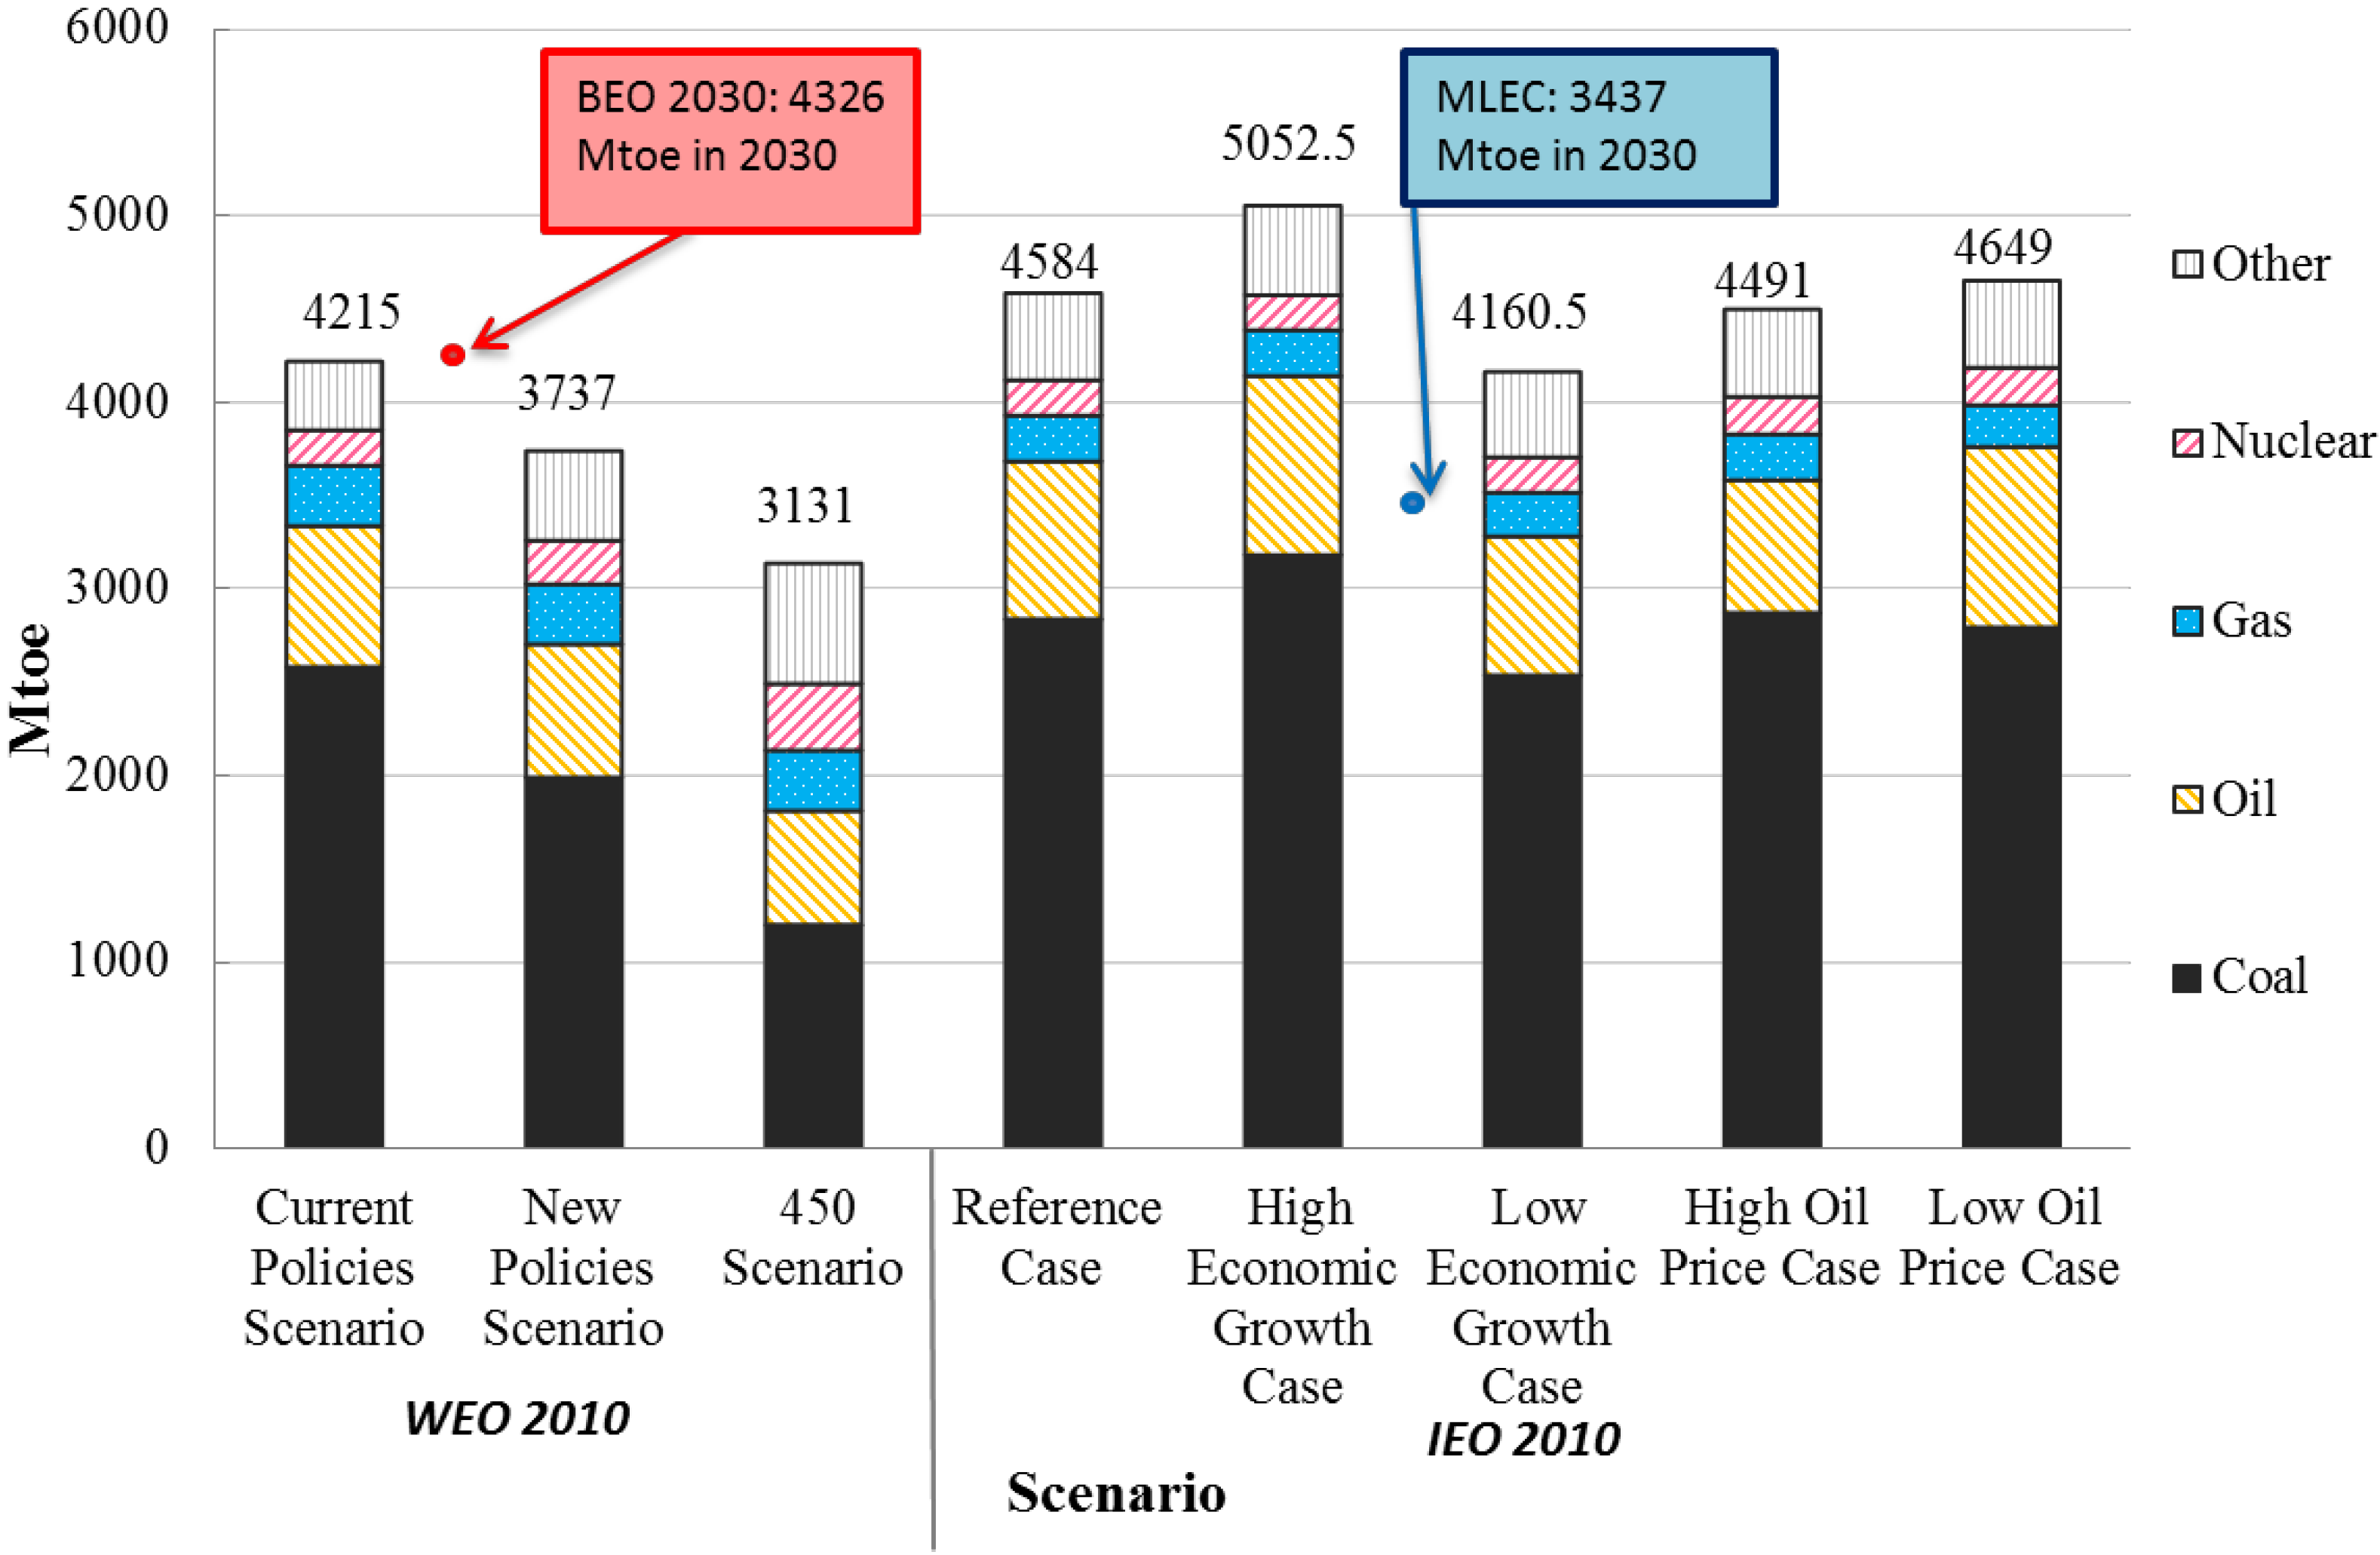
The existing reports on macro energy scenarios discussed in this work include: World Energy Outlook 2010 (WEO 2010) [7], published by International Energy Agency (IEA); International Energy Outlook 2010 (IEO 2010) [8], published by U.S. Energy Information Administration (EIA); BP Energy Outlook 2030 (BEO 2030) [9], published by BP; The Mid-term and Long-term Energy Development Strategy of China (2030, 2050) (MLEC) [10], published by the Chinese Academy of Engineering (CAE). In WEO 2010, the world energy trend up to 2035 is projected in three scenarios. In IEO 2010 [8], the world energy trend up to 2035 is projected in five scenarios. In BEO 2030 [9], only one scenario is set based on “the best of knowledge” rather than “business as usual” extrapolation, projecting the world energy trend to 2030. In the MLEC [10], projection to China’s energy consumption up to 2050 is provided based on interviews of experts. These projections differ from one another in a large scale, and a comparison of energy demand projections in these scenarios are illustrated in Figure 3 and Figure 4 [7,8,9,10].
Figure 3 and Figure 4 illustrate the primary energy demand of China in 2020 and 2035 in the afore-mentioned scenarios. The Current Policies Scenario, New Policies Scenario and 450 Scenario are provided by WEO 2010 [7], the Reference Case, High Economic Growth Case, Low Economic Growth Case, High Oil Price Case and Low Oil Price Case are provided by IEO 2010 [8]. BEO 2030 [9] represents BP’s projections and MLEC represents CAE’s projections. It shows that the differences between various projections for 2020 are rather large, and these differences become larger when projecting China’s energy demand in 2035.
Figure 3. A comparison of projections of primary energy demand of China, 2020.
Energies 06 03444 g003
Figure 4. A comparison of projections of primary energy demand of China, 2035.
Energies 06 03444 g004
The methodologies, policy assumptions, technical accuracies and scenario settings adopted in generating the scenarios are discussed below. By comparing these criteria, major differences between these scenarios are illustrated.

2. Methodology Descriptions

2.1. World Energy Outlook 2010

IEA provides medium to long-term energy projections using a World Energy Model (WEM). The model is designed to project how energy markets function, and it is the major tool used to generate detailed sector-by-sector and region-by-region projections in all scenarios [11]. The model consists of six main modules: final energy demand (with sub-models covering residential, services, agriculture, industry, transport and non-energy use), power generation and heat, refinery/petrochemicals and other transformation, fossil-fuel supply, CO2 emissions and investment.
The model is designed to address the following issues:
(1)
Global energy prospects: including trends of demand, supply availability and constraints, international trade and energy balances by sector and by fuel type to 2035;
(2)
Environmental impacts of energy use: CO2 emissions are derived from detailed projections of energy consumption;
(3)
Effects of policy and technology improvement on both the supply and demand sides;
(4)
Investment in the energy sector: evaluating investment required for the entire energy supply, conversion, and consumption chain to meet the energy demand up to 2035.

2.2. International Energy Outlook 2010

In IEO2010 [8], projections to the world energy supply and demand are obtained using EIA’s World Energy Projections Plus (WEPS+) model. WEPS+ consists of sector-based energy sub-models, and it adopts an integrated iterative solution process to converge energy demand and energy price to an equilibrium solution [12].
The sub-models of WEPS+ share the same database and communicate with each other in an iterative manner. In WEPS+, end-use demand sub-models (residential, commercial, industrial, and transportation) are used to project major primary energy consumption, including petroleum, natural gas, coal, nuclear power, hydropower, wind, geothermal, and other renewable sources. Projection to electricity demand is also provided by the end-use demand sectors.
Policy assumptions in IEO2010 [8] are mainly based on the existing laws, policies, and regulations as of the beginning of 2010. The impacts of pending or proposed legislation, regulations, and standards are not considered in the projections [12].

2.3. BP Energy Outlook 2030

The BP Energy Outlook [9] is not a “business as usual” extrapolation, or an attempt to model policy targets. Instead it is built “to the best of knowledge” [9], reflecting the judgment of the likely path of global energy markets to 2030.
Assumptions on changes in policy, technology and the economy are based on internal and external consultations. In BP Energy Outlook [9], an alternative case is built up to assess the impact of possible policy changes on energy production and consumption. Scenarios in the BP Energy Outlook are used to explore uncertainty of projections, but they do not attempt to forecast long-term energy markets.

2.4. The Mid-Term and Long-Term Energy Development Strategy of China (2030, 2050)

This program [10] was conducted by CAE with the purpose of delivering mid-term to long-term forecast of China’s primary energy consumption. It comprises of six work streams, including energy savings, coal, gas, nuclear, electricity, and renewable energy. Different from other scenario studies, the program sets a series of amount control targets for primary energy consumption. To meet these targets, the program takes into account of constrains of resources and environment, applies a CGE (Computable General Equilibrium) model to the modeling system, and provides a suggestion of possible development rate, industrial structure, power-generation mix and consumption style of the sustainable energy development pathway for China.

3. Policy Assumptions

Policies play a significant role in scenario analysis, and have great impacts both on demand side and supply side of energy, as well as the energy market. The four institutions set some rather different policy scenarios in their projection reports. The policy setting in WEO 2010 is mainly about carbon mitigation, whilst in IEO 2010, policies are based to the extent possible on the U.S. and foreign laws, regulations, and standards in effect as of the beginning of 2010. In BEO 2030 and MLEC, the policy change assumptions are based on internal and external consultations. The detailed policy assumptions are listed in Table 1.
To compare these policy assumptions with the actual policy implemented in China, we investigated the newly issued Twelfth Five-Year Plan for Energy, where energy development targets of China during 2010 to 2015 are officially announced, as shown in Table 2.
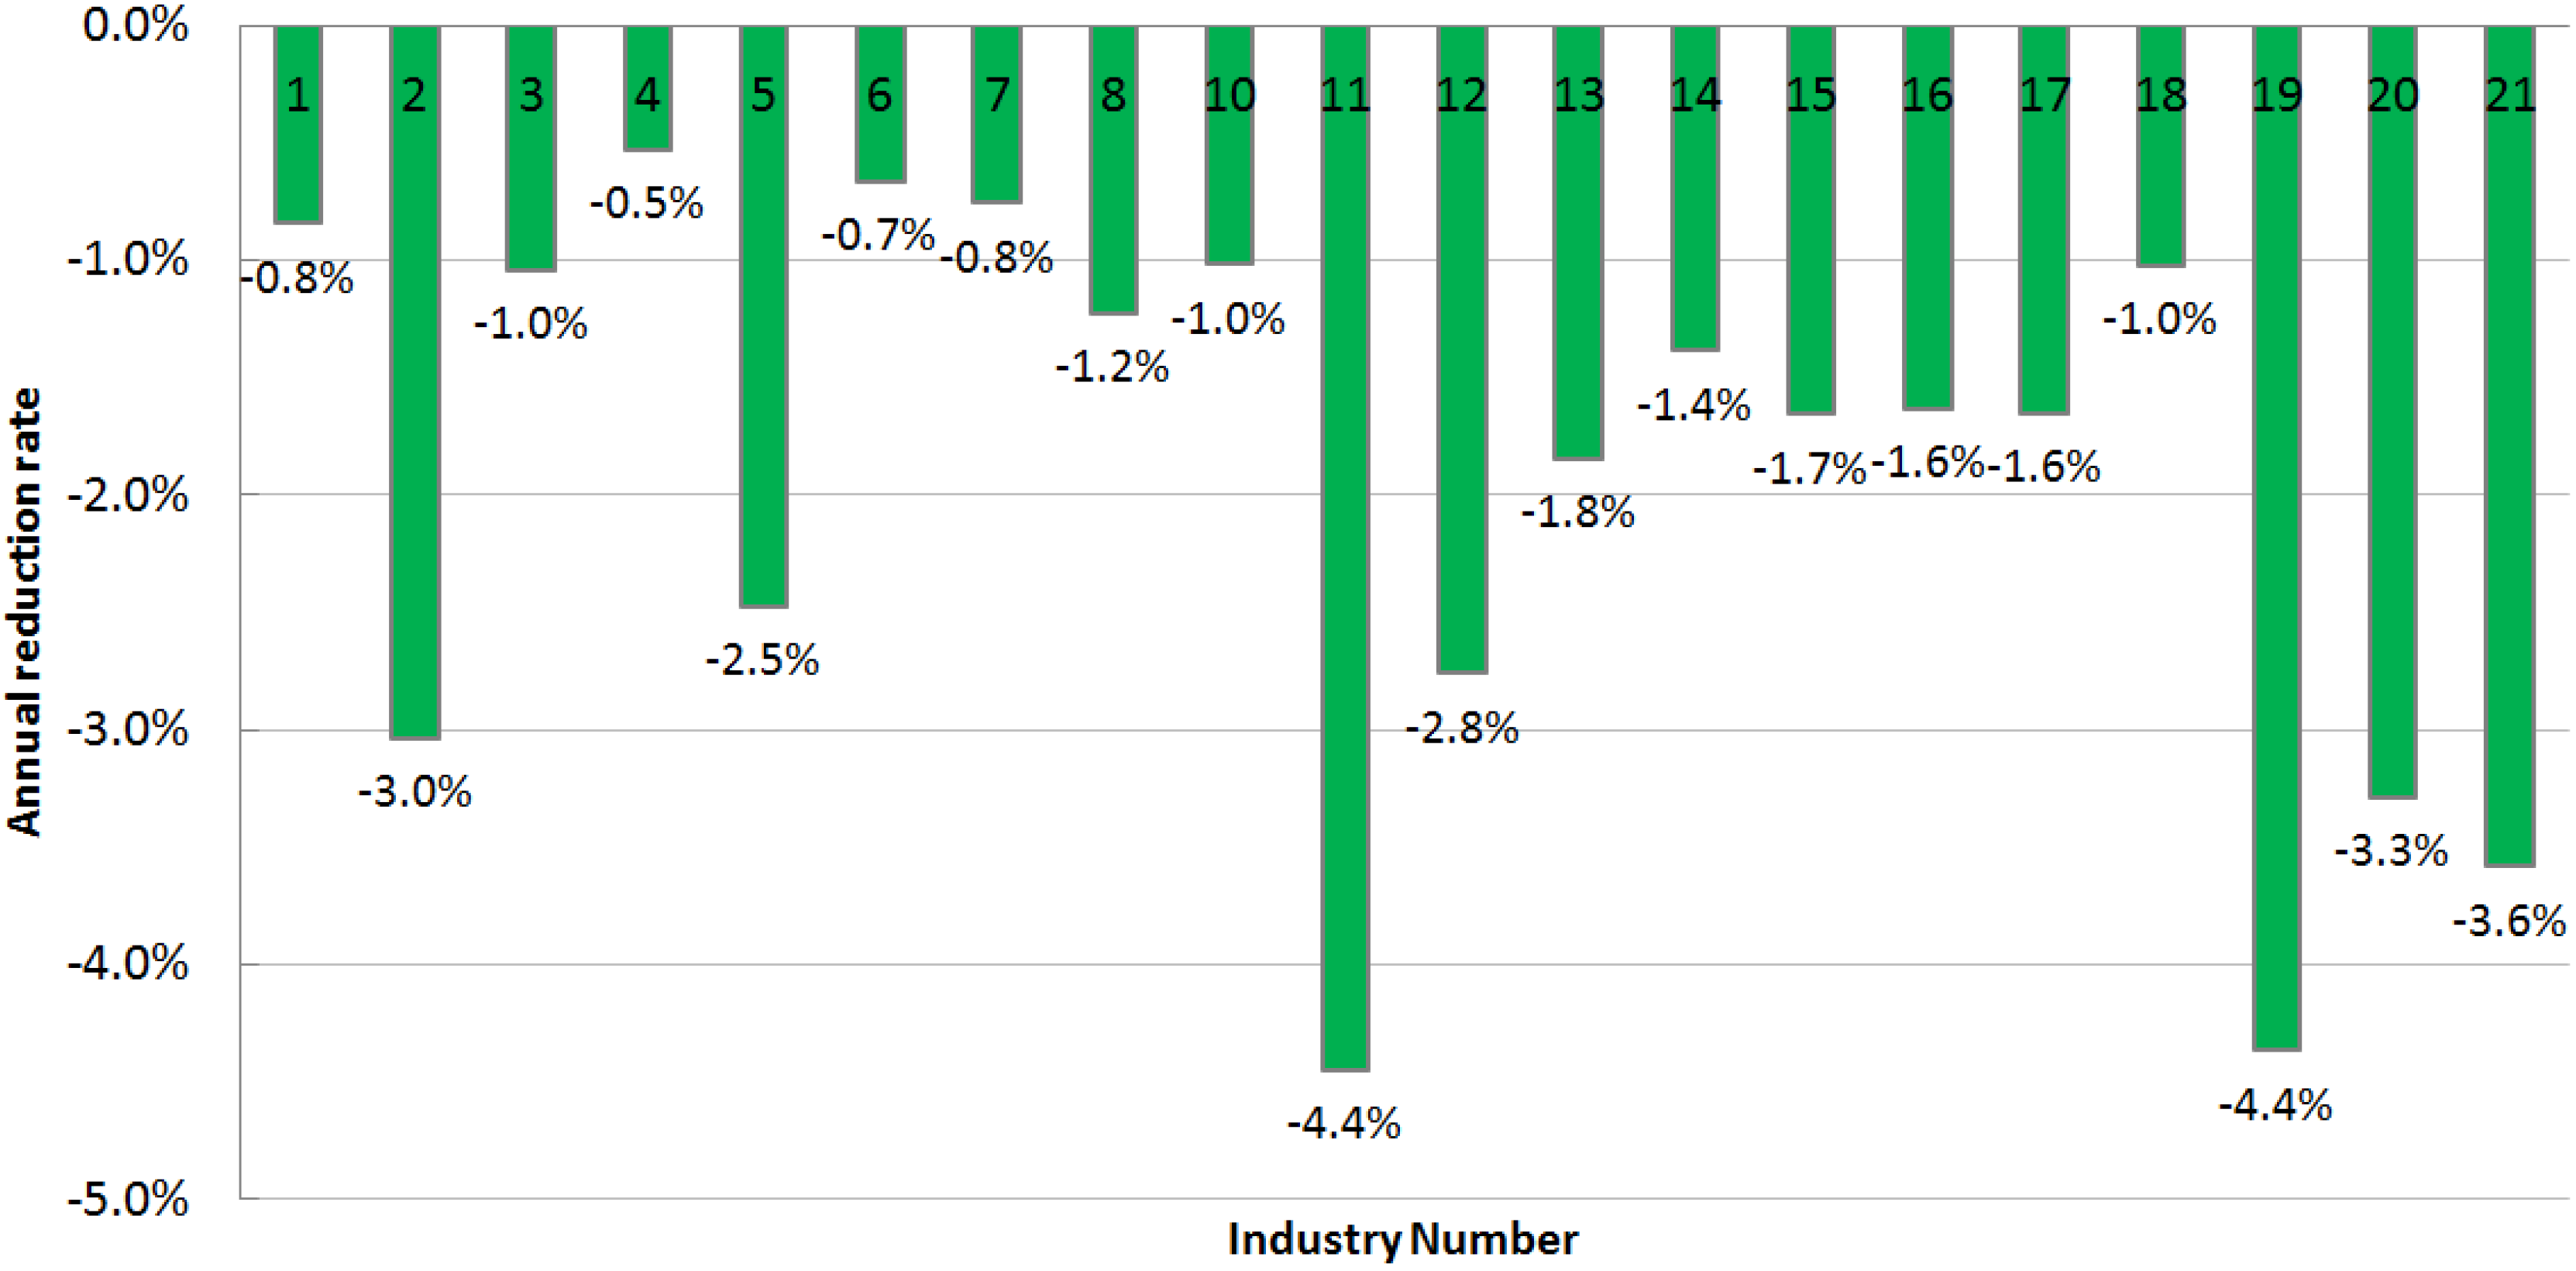
To meet these targets, the energy-intensive industries should reduce their energy consumption in a consecutive manner, and an average annual reduction rate for each industry is illustrated in Figure 5.
Figure 5 indicates that paper industry and casting production have the highest ambition to reduce their energy consumption, at about 4.4% annually. Copper metallurgy, flat glass production, household glass production and polycrystalline silicon production are also targeted to make significant improvement in energy efficiency, with their annual energy consumption reduction rate higher than 2%. Although the absolute amount of energy consumed in steel and cement industry is rather large (see Figure 6, steel and cement production accounted for 11% and 6% of the total energy consumption in 2009, respectively), their energy efficiencies are not expected to have great improvement during the 12th Five Year.
According to the 12th Five-Year Plans of construction materials and steel industry, the cement production will increase from 1.88 billion tonne in 2010 to 2.2 billion tonne in 2015, and steel production will increase from 630 million tonne in 2010 to 750 million tonne in 2015. From 2011 to 2015, a small increase (around 0.5% annually) in energy efficiency of the cement industry is expected. However, due to the foreseeable large increase (around 17% by 2015) in the total production of the cement sector, the overall energy consumption in the sector is expected to increase by 14% by 2015. Similarly, the energy efficiency of the steel industry is expected to increase 0.8% annually. However, due to the foreseeable large increase (around 19% by 2015) in the total production of the steel sector, the overall energy consumption in the sector is expected to increase by 14% by 2015.
In conclusion, a number of energy-intensive industries plan to improve their energy efficiencies, particularly the paper industry, casting industry and copper metallurgy industry. Meanwhile, the largest energy-consuming industries, typically steel industry and cement industry, are not expected to have great improvements in energy efficiency.
Table 1. Scenario policy assumptions.
ReportScenarioPolicy Assumptions
WEO 2010 (IEA) [7]Current Policies ScenarioServe as a baseline against which the impact of new policies can be assessed.
No change in policies is assumed:
Takes into account those measures that governments had formally adopted by the middle of 2010 in response to and in pursuit of energy and environmental policies.
Takes no account of any future changes in government policies.
Does not include measures to meet any energy or climate policy targets or commitments that have not yet been adopted or fully implemented.
New Policies ScenarioOverall targets and policies:
40% reduction in CO2 intensity by 2020 compared with 2005 (2009).
Rebalancing of the economy from industry towards services (2009).
Further implementation of the directives of the Renewable Energy Law (2005).
Detailed sector policies of power, transport, industry and building sectors.
IEO 2010 (EIA) [8]450 ScenarioOverall targets and policies:
45% reduction in CO2 intensity by 2020 compared with 2005.
15% share of non-fossil energy in primary energy consumption by 2020.
Detailed sector policies of power, transport, industry and building sectors.
Based to the extent possible on U.S. and foreign laws, regulations, and standards in effect at the start of 2010.
The potential impacts of pending or proposed legislation, regulations, and standards are not reflected in the projections, nor are the impacts of legislation for which the implementing mechanisms have not yet been announced.
Mechanisms whose implementation cannot be modeled given current capabilities or whose impacts on the energy sector are unclear are not included.
IEO2010 [8] focuses exclusively on marketed energy.
Non-marketed energy sources, which continue to play an important role in some developing countries, are not included in the estimates.
BP Energy Outlook 2030 (BP) [9]“To the best of knowledge”Assumptions on changes in policy, technology and the economy are based on extensive internal and external consultations.
The Mid-term and Long-term Energy Development Strategy of China (“MLEC” for short) (CAE) [10]Save energy and control the total energy consumption.
Utilize coal in a scientific, clean and high-efficient way.
Assure the strategic positions of oil and natural gas, consider natural gas as one of the key resources to adjust the energy structure.
Accelerate the development of hydro power and other renewable energy.
Take great efforts to develop nuclear power.
Develop smart-grid systems.
Table 2. Energy consumption targets for energy-intensive industries.
No.IndustryUnit20102015
1Steel productionkgce/t605580
2Copper metallurgykgce/t350300
3Aluminum metallurgykWh/t14,01313,300
4Cement productionkgce/t115112
5Flat glass productionkgce/loaded van1715
6Ethylene productionkgce/t886857
7Synthetic ammonia productionkgce/t1,4021,350
8Sodium hydroxide production (Membrane process, 30%)kgce/t351330
9Sodium carbonate productionkgce/t320
10Calcium carbide productionkgce/t1,1051,050
11Paper industrykgce/t1,130900
12Household glass productionkgce/t437380
13Fermented productkgce/t900820
14Domestic ceramic productionkgce/t1,1901,110
15Dyeing clothkgce/104 m2,2982,114
16Yarn productionkgce/t368339
17Cloth productionKgce/104 m1,8171,672
18Viscose fiber production (filament)kgce/t4,7134,477
19Casting productionkgce/t qualified castings600480
20Polycrystalline silicon production (high-temperature hydrogenation)kgce/t39,00033,000
21Polycrystalline silicon production (low-temperature hydrogenation)kgce/t36,00030,000
Figure 5. Annual energy consumption reduction rates needed by energy-intensive industries.
Energies 06 03444 g005
Figure 6. Industrial energy consumption of China, 2009 (Data source: [1]).
Energies 06 03444 g006

4. Technical Accuracy

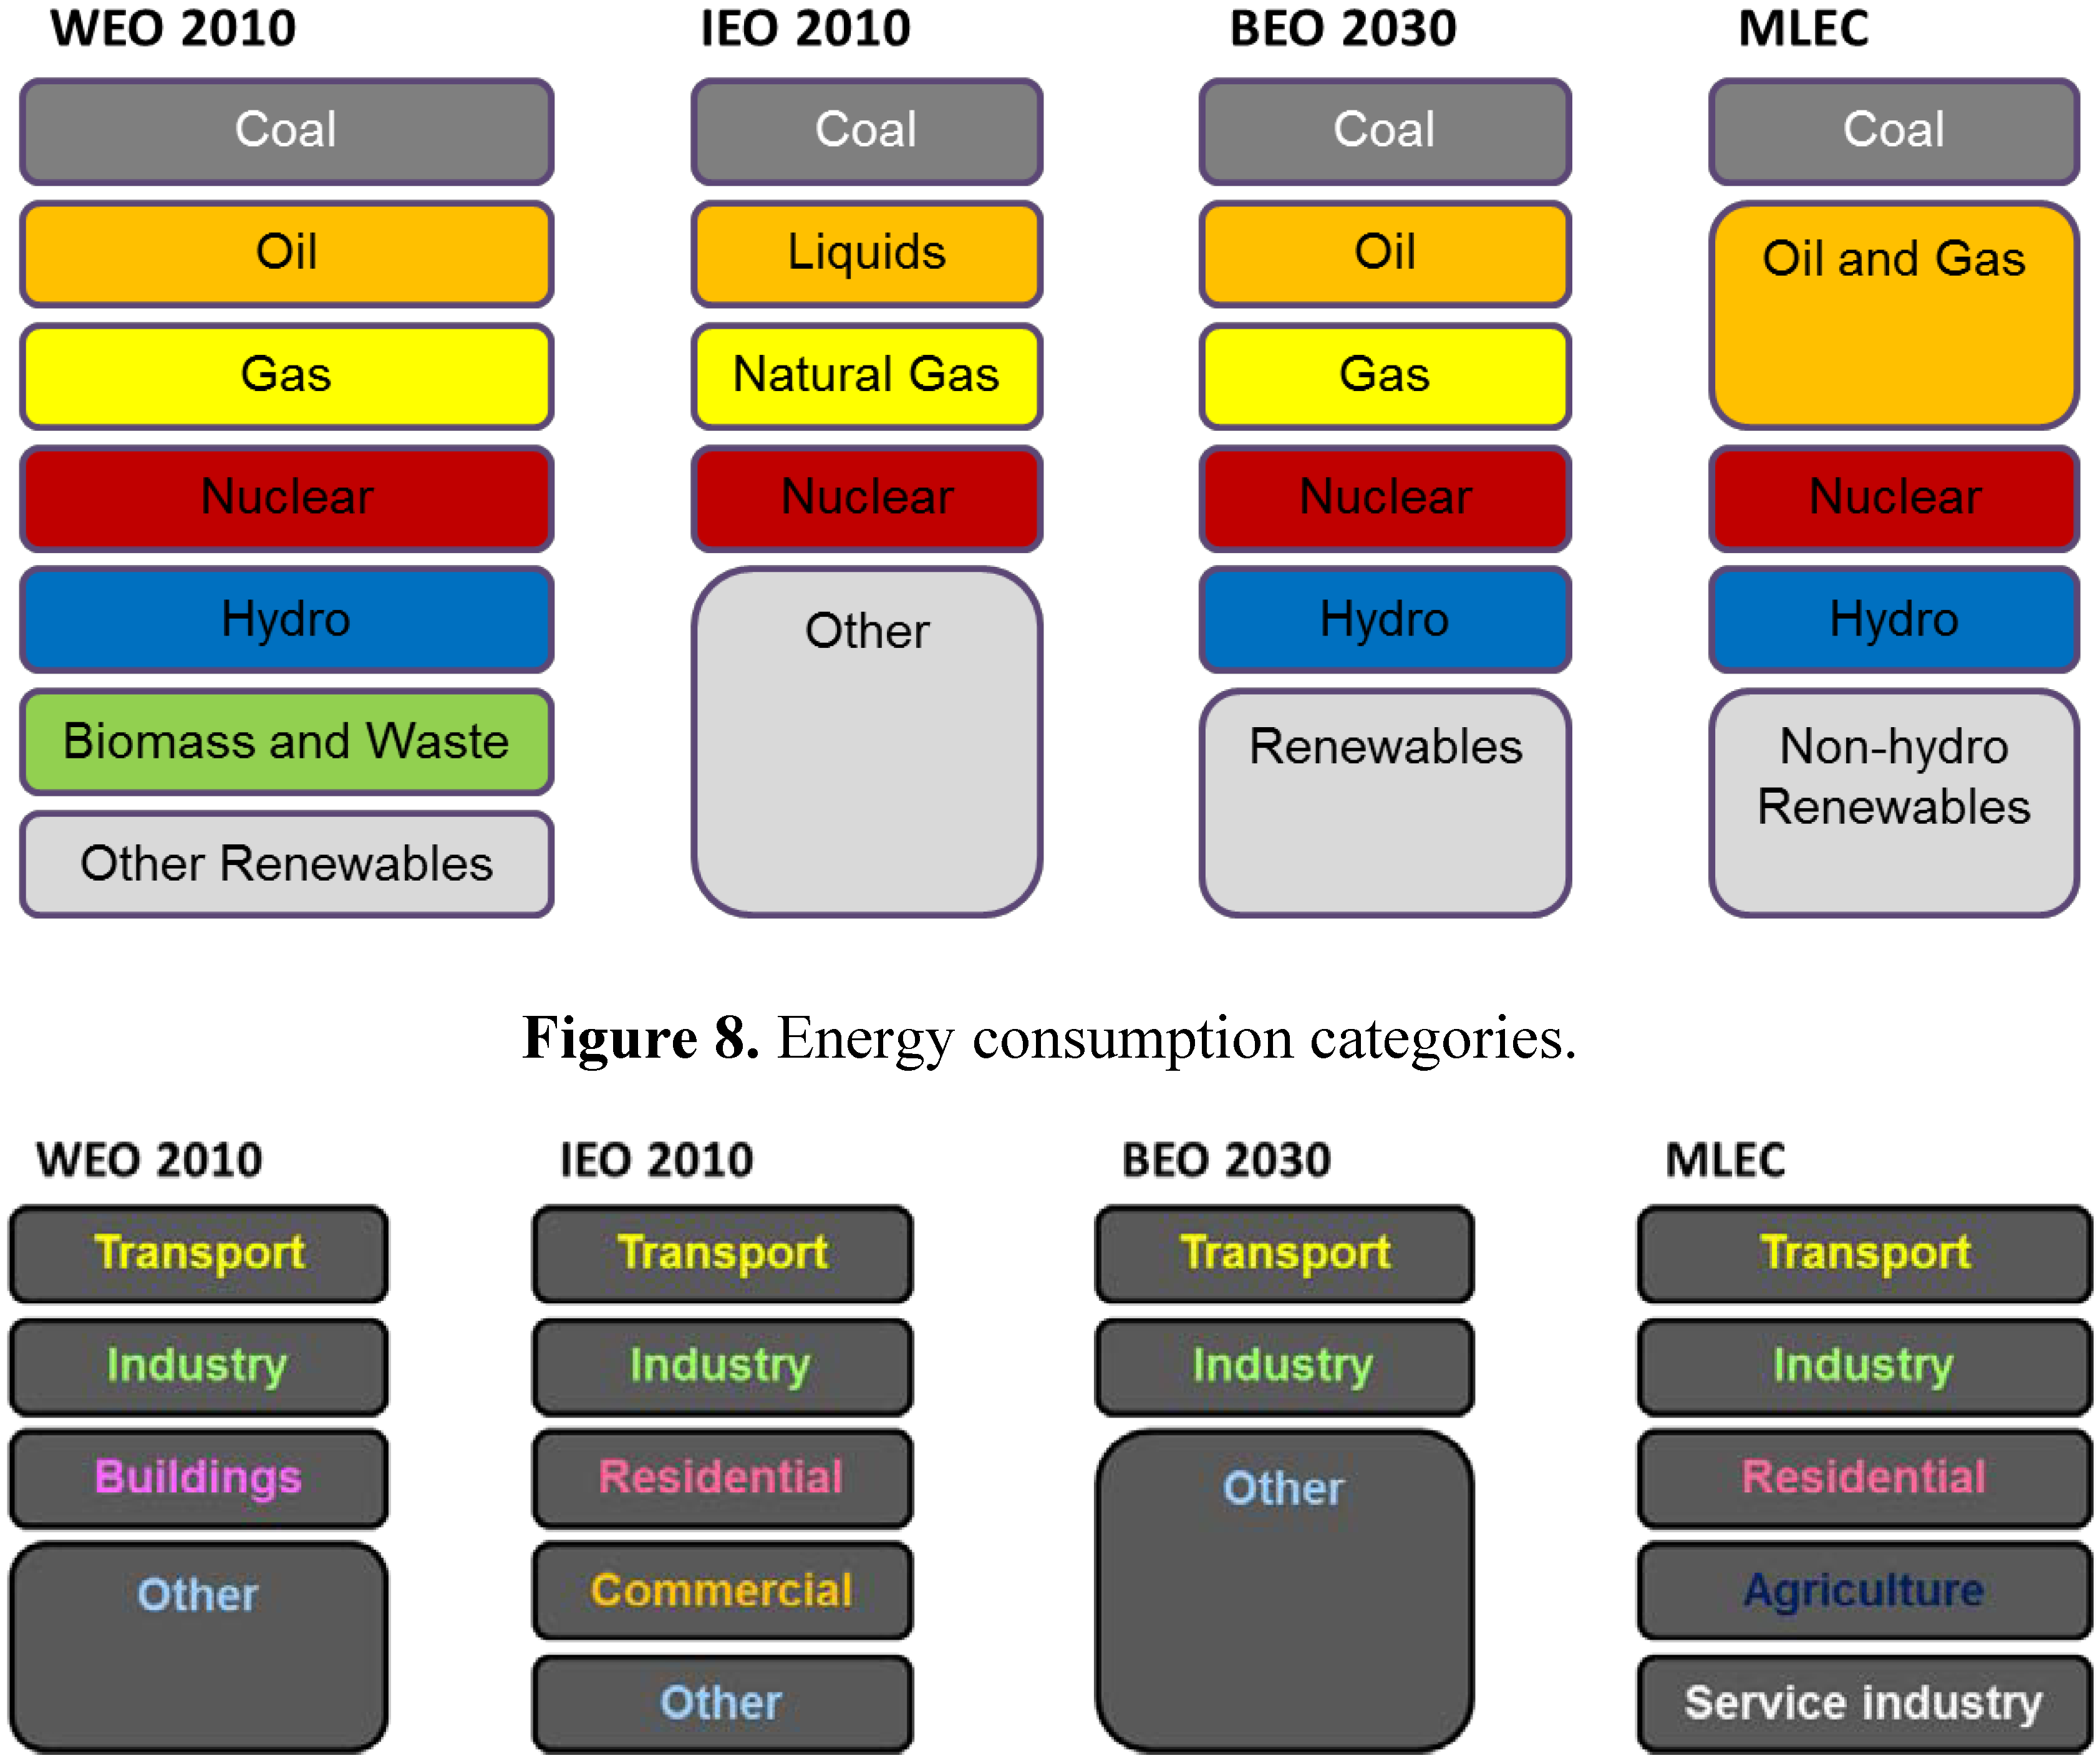
The four reports on macro energy scenarios discussed above have rather different technical accuracy on primary energy demand and consumption categories, as shown in Figure 7 and Figure 8.
Figure 7. Primary energy categories.
Energies 06 03444 g007
Figure 8. Energy consumption categories.
Energies 06 03444 g008
Figure 7 illustrates the primary energy categories in the aforementioned four scenarios. Coal, gas and nuclear are explicitly categorized. The three oversea institutes analyze oil (or liquids) and natural gas separately, whilst CAE [10] combines oil and gas to analyze their demand. Hydropower is explicitly analyzed all scenarios except IEO 2010 [8].
Figure 8 illustrates the energy consumption categories in the four aforementioned scenarios. Besides transport and industry, WEO 2010 also considers energy consumption for buildings, IEO 2010 [8] and MLEC [10] consider residential energy consumption, IEO 2010 [8] considers commercial energy consumption, and MLEC [10] considers energy consumptions of agriculture and service industry.

5. Scenario Settings

The four reports discussed above have rather complicated assumptions and scenario settings for their scenario designs, including population, economic growth, oil and carbon price, technology development, as well as policy assumptions. A detailed description of these settings is presented in this section.

5.1. General Scenario Settings in Different Scenarios

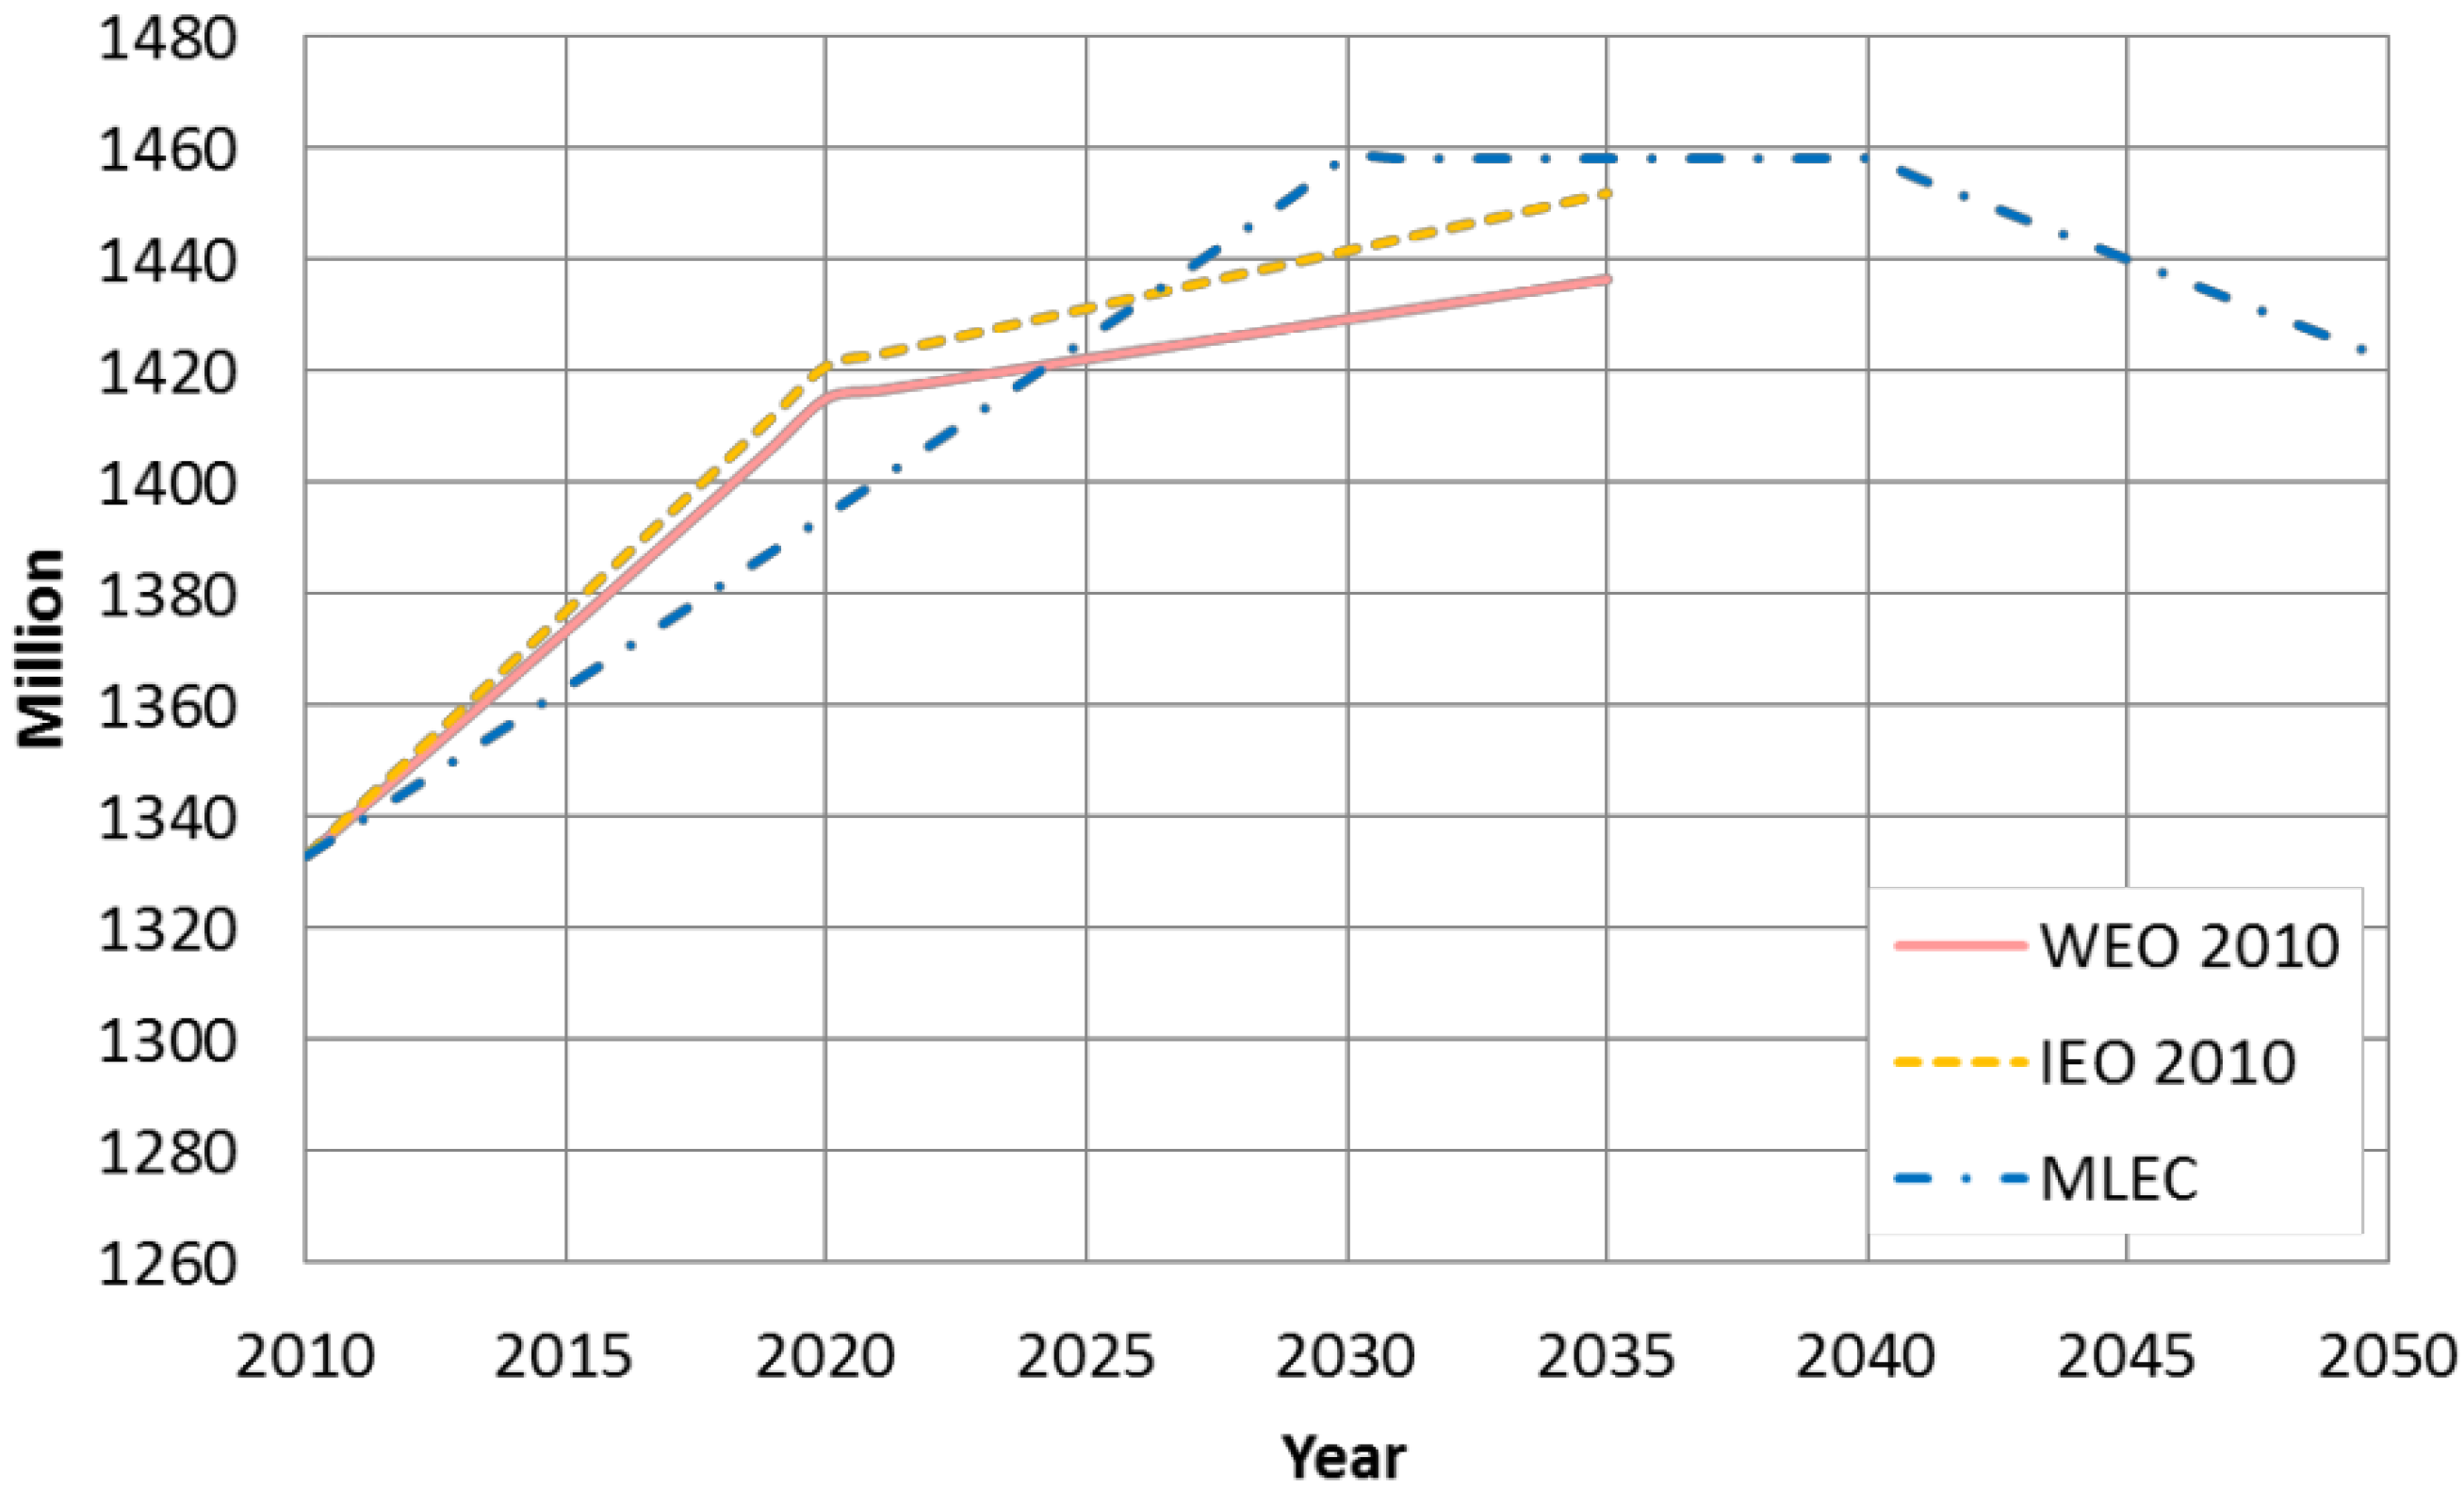
The key scenario settings that influence the scenario analysis are listed in Table 3. As shown in Figure 9, the WEO 2010 [7], IEO 2010 [8] and MLEC [10] have set specific population growth rates of China for the scenario analysis. In WEO 2010 [7], the Chinese population is assumed to grow at a constant annual rate of 0.6% from 2008 to 2020, and 0.1% from 2020 to 2035. The annual average growth rate from 2008 to 2035 is 0.3%. The rates of population growth assumed in all the three scenarios are based on the most recent projections by the United Nations [13]. Population growth slows down gradually, in line with past trends. In IEO 2010, China’s population is projected to be 1421 million in 2020, 1452 million in 2035, and the annual growth rate is 0.3% from 2007 to 2035. In MLEC, the annual population growth rate of China is 4.5‰ from 2010 to 2030, nearly 0‰ from 2030 to 2040, and −2.5‰ from 2040 to 2050. The annual average growth rate is 0.36% from 2010 to 2035, and 0.16% from 2010 to 2050.
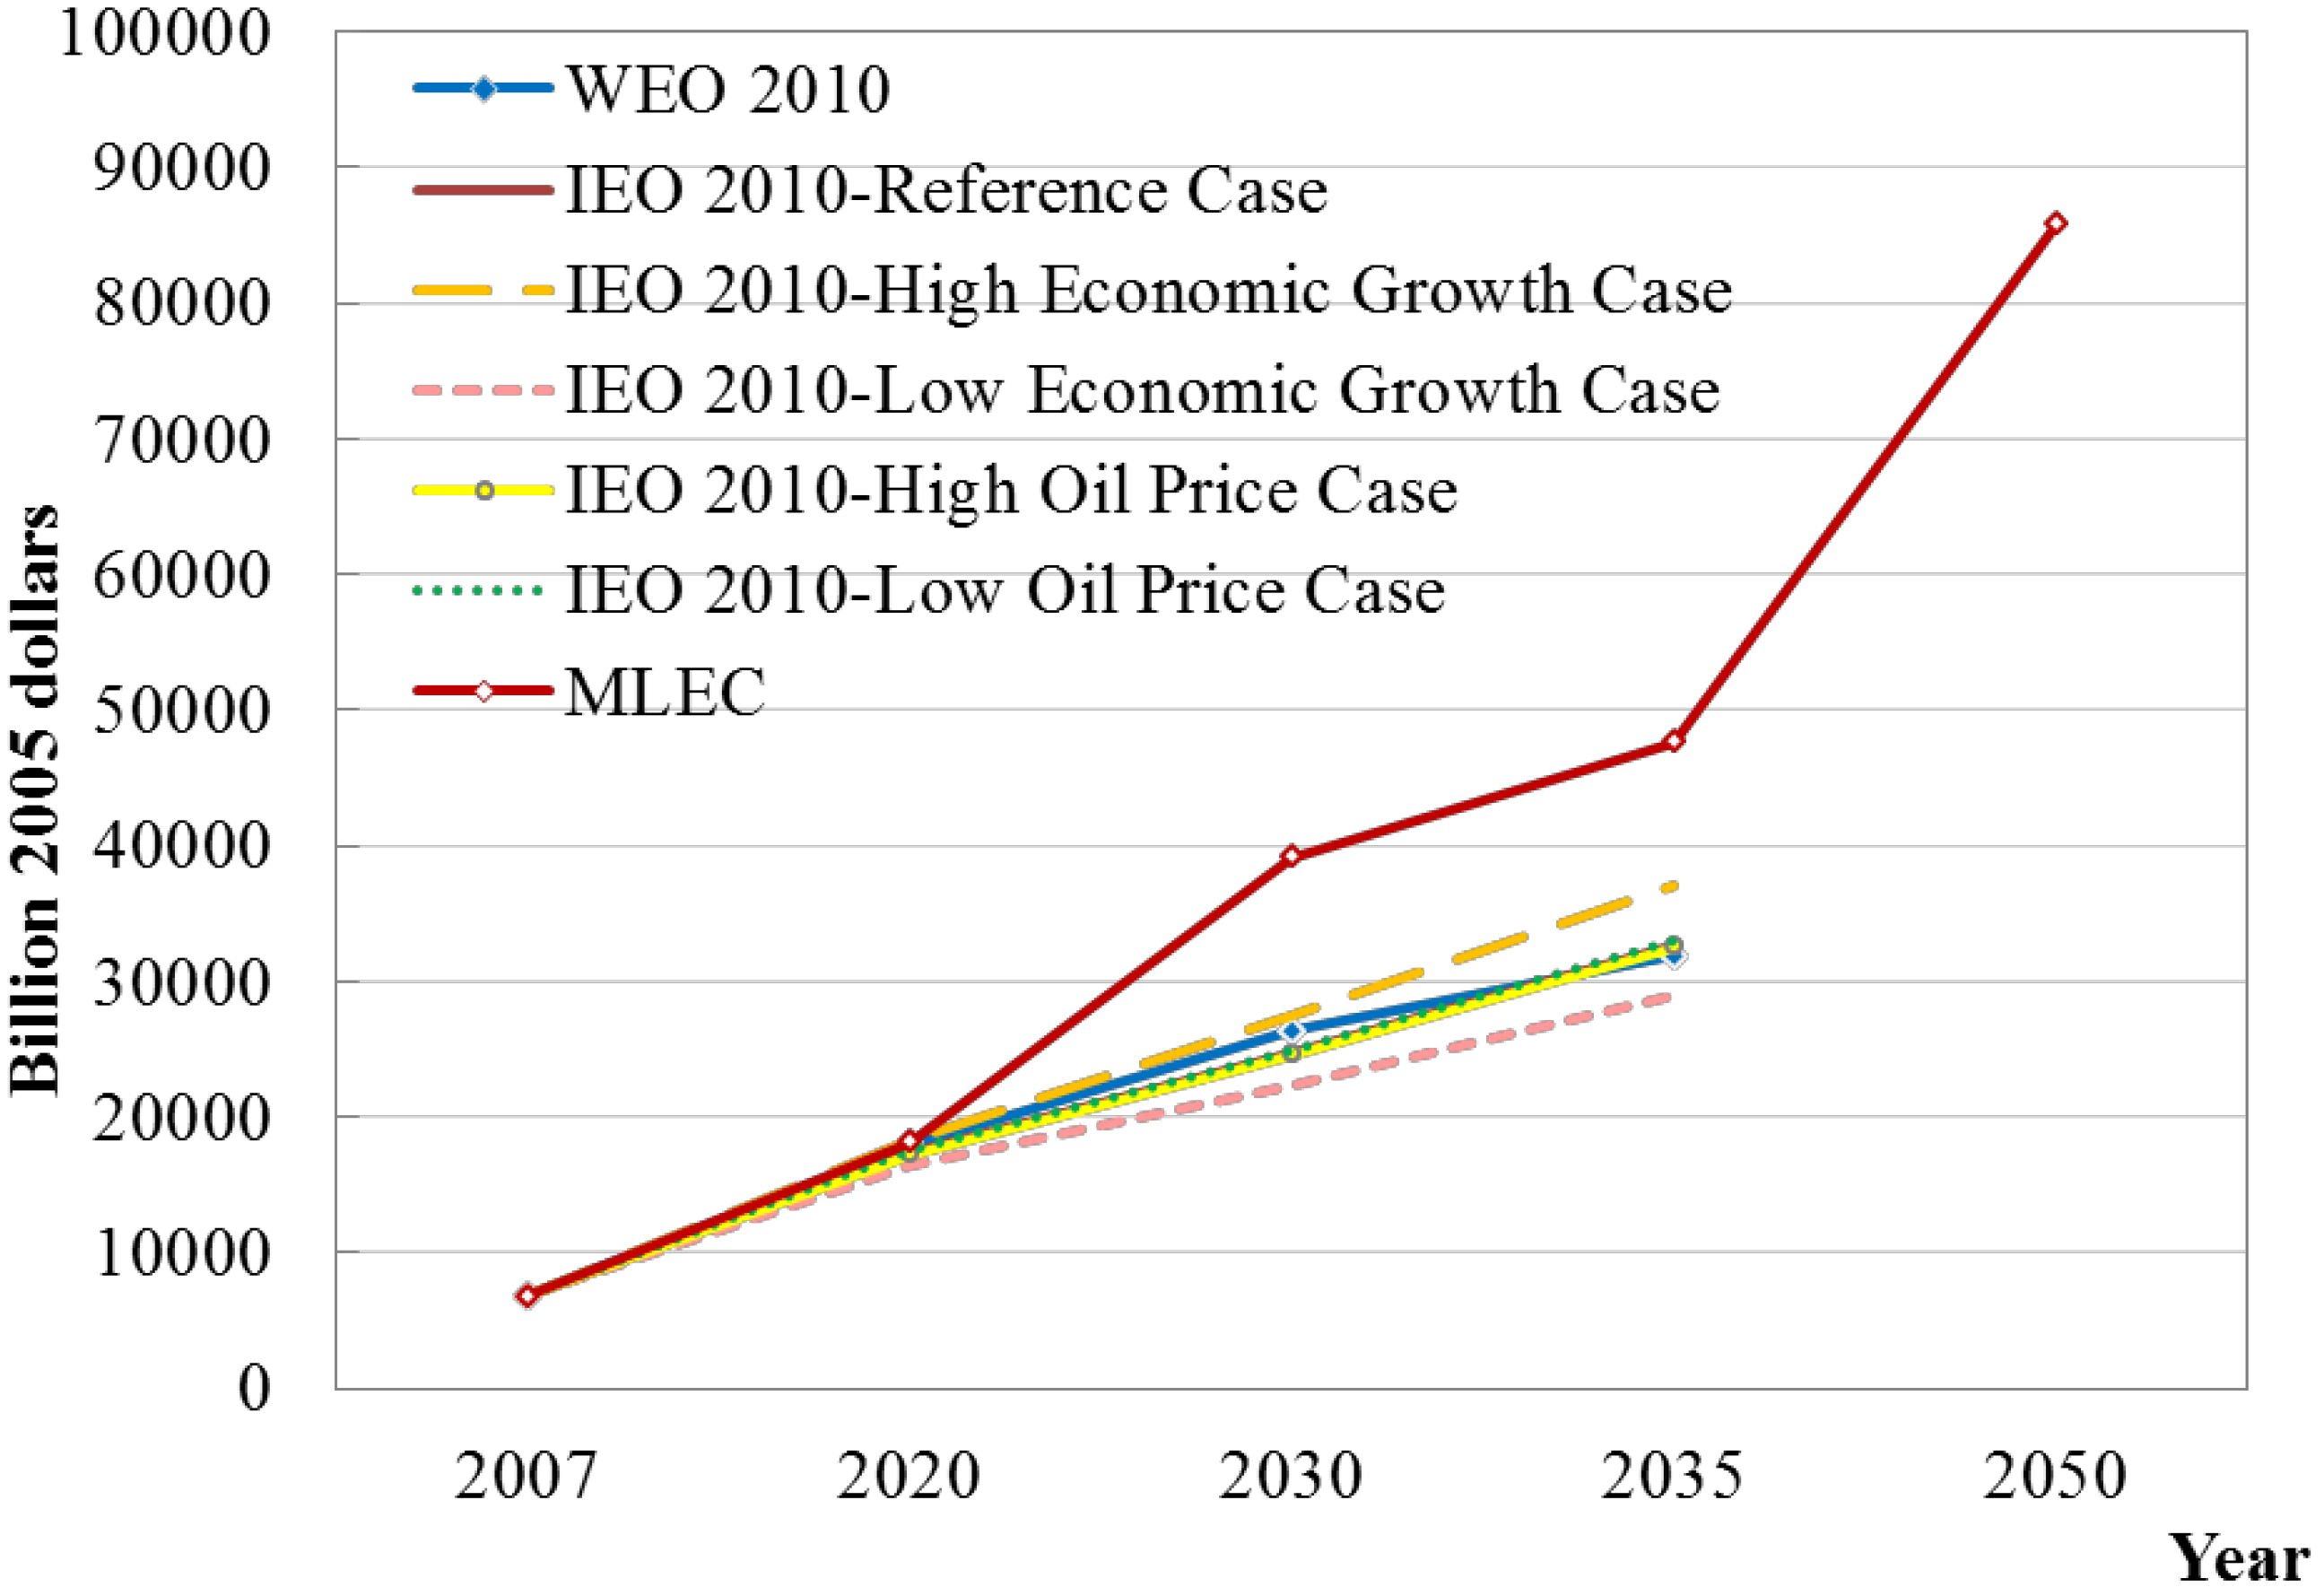
Figure 10 illustrates the GDP growth rates of China in all scenarios. In MLEC, the GDP of China grows much faster than that in WEO 2010 [7] and IEO 2010 [8]. In WEO 2010 [7], China’s GDP is assumed to grow at an annual average rate of 7.9% from 2008 to 2020, and 3.9% from 2020 to 2035. The annual average growth rate is 5.7% from 2008 to 2035. In IEO 2010, the annual average growth rates from 2007 to 2035 range from 5.7 to 6.2 depending on different scenarios, as listed in Table 3. In MLEC, the annual growth rate is assumed to be 8% from 2010 to 2030, and higher than 4% from 2030 to 2050.
Table 3. Key scenario settings in scenarios of projection energy consumption of China.
CriteriaYearWEO 2010 (IEA) [7]IEO 2010 (EIA) [8]BP Energy Outlook 2030 (BP) [9]MLEC (CAE) [10]
Reference CaseHigh Economic Growth ScenarioLow Economic Growth ScenarioHigh Oil Price ScenarioLow Oil Price Scenario
Prediction horizon-2008–20352007–20352010–20302010–2050
Population (millions)20201,4211,415-1,394
20301,4421,429-1,458
20351,4521,437-1,458
2050--1,422
Annual growth rate (%)-2010–2035: 0.342010–2035: 0.30-2010–2030: 0.45
2030–2040: 0
2040–2050: −0.25
GDP (Billion 2005 dollars)202017,96917,35318,26416,48317,20417,499-18,136
203026,34424,70927,41822,36224,62724,936-39,155
203531,89832,75537,03928,95032,49333,056-47,638
2050-------85,793
Annual growth rate (%)-2010–2035: 5.72010–2035: 5.82010–2035: 6.22010–2035: 5.32010–2035: 5.72010–2035: 5.8-2010–2030: 8
2030–2050: 4
Figure 9. Population growth setting in all scenarios of projected energy consumption of China.
Energies 06 03444 g009
Figure 10. GDP growth setting in all scenarios of projected energy consumption of China.
Energies 06 03444 g010
The WEO 2010 [7] and IEO 2010 [8] focus on impacts of oil prices on the energy market, and the oil price assumed in IEO 2010 [8] is higher than that in WEO 2010 [7] scenarios. The WEO 2010 [7] also set carbon prices in its scenarios, acting as emission constraints for fossil energy consumptions. The CO2 prices by region and scenario are listed in Table 4.
Table 4. CO2 prices by main region and scenario ($2009 per tonne) [7].
ScenarioRegion2009202020302035
New Policies ScenarioEuropean Union22384650
Japann.a.204050
Other OECDn.a.-4050
Current Policies ScenarioEuropean Union22303742
450 ScenarioOECD+n.a.45105120
Other Major Economiesn.a.-6390

5.2. Specific Scenario Settings of the Chinese Academy of Engineering

Compared with scenarios in WEO 2010 [7] and IEO 2010 [8], there are specific scenario settings in the report of the Chinese Academy of Engineering (CAE). Typically, CAE considers energy saving potentials in several high-energy-consumption sectors, thus proposes promising energy demand reduction in the future, as shown in Figure 11 [10].
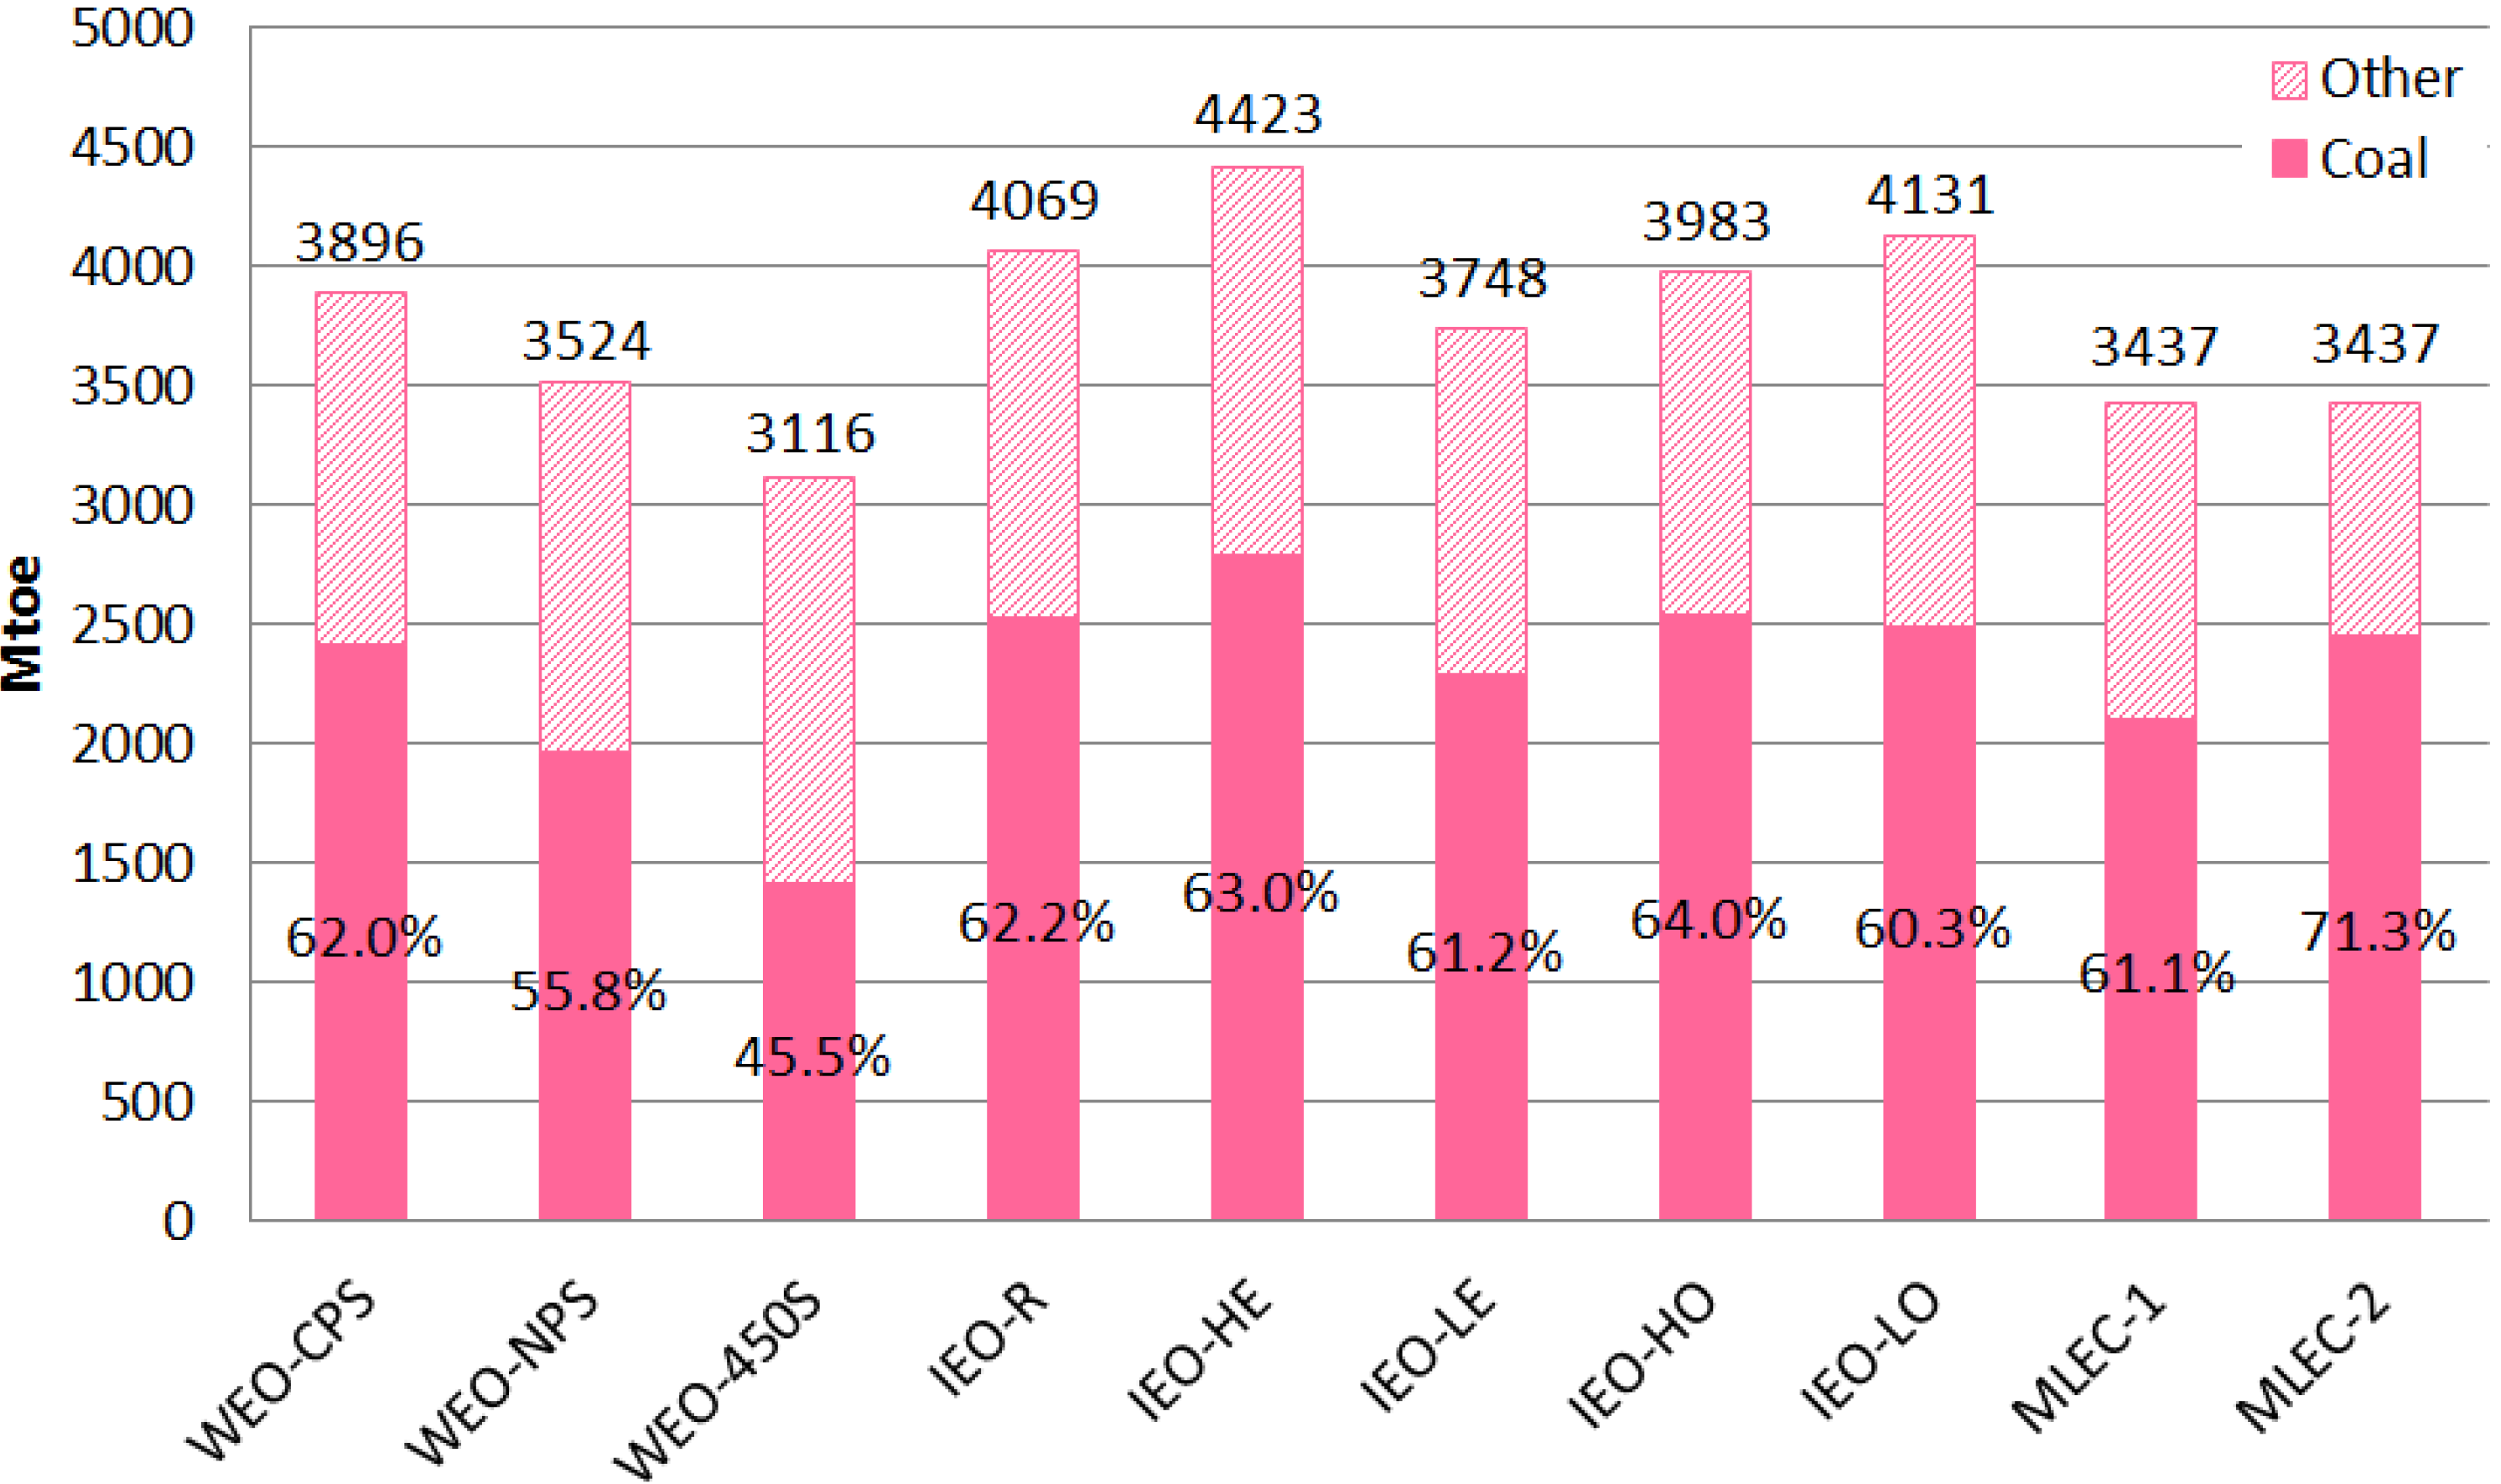
Figure 11. Energy saving potentials proposed by CAE.
Energies 06 03444 g011
In Figure 11, the energy saving potentials in 2020 are considered to be 700 Mtoe. Systematically, the energy saving potential is greatly related to macro economy development, building lifetime and steel production peak. From a macro economy development aspect, to control the energy intensity (energy consumption/GDP) below 6.27%, the energy demand would be less than 2.8 billion toe in 2020. If the building lifetime is extended from 25 to 50 years, the annual energy saving would be 105 Mtoe. If the steel production peak drops from 0.6 t per capita to 0.5 t per capita, the stable steel production from 0.4 t per capita to 0.3 t per capita, the annual energy saving would be 126 Mtoe.
Residential energy saving potential could be huge via controlling the total floor area, encouraging energy-saving life style and improving energy efficiency. Significant breakthrough of operation and management technologies can also contribute to energy saving benefits. For instance, huge amount of energy can be saved in the lighting sector by shifting to LED technologies and using more natural light.
For the primary and secondary energy sectors, there are also detailed and specific development strategies in the CAE report. For the coal industry, mining safety and high efficiency are considered to project the mining capacity in the future. The projected coal production is 3–3.5 billion tonne in 2030, and the mining death rate will be 0.01/million tonne in 2030. Coal accounts for approximately 40% of primary energy in 2050, and clean coal technologies will be widely applied. The report also presents a clean index to classify clean coal technologies, including highly-efficient combustion and advanced power generation technologies, circulating fluidized bed technology, pollutants emission control technologies, CCS (Carbon Capture and Storage), IGCC (Integrated Gasification Combined Cycle), coal gasification and liquefaction, polygeneration, and combined heat, cooling and power generation.
Figure 12 illustrates the projected coal demand in 2030 in different scenarios. The solid and slash filled columns represent projected coal demand and other primary energy demand in 2030 respectively.
Figure 12. Coal demand projections in different scenarios, 2030.
Energies 06 03444 g012
Due to the low estimation of coal mining capacity and promotion of clean coal technologies, the Chinese Academy of Engineering projects a relatively smaller total primary energy demand in 2030, compared with most of the scenario results of WEO 2010 [7] and IEO 2010 [8]. Meanwhile, the projected percentage of coal demand to total energy demand by CAE is higher than that in other scenarios, indicating that in CAE’s consideration, coal will continue to play a dominant role in China’s energy supply and demand system for a long term.
In comparison, for scenarios in WEO 2010 [7], the energy-related CO2 emission is the most important constraint of energy consumption. In these scenarios, coal demand is strictly controlled in order to achieve the total CO2 emission reduction targets.
In the report of CAE, the strategies of the power industry can be generally stated as power demand and supply projections, power grid development plans and advanced technologies and devices. Based on unit demand of electrical appliances and urban/rural differences, domestic power demand is projected. At the same time, regional analysis is made by considering economy development, population, industry scales and industrial power demand of six regions (Northeast, North, East, Middle, South and Northwest China). Power supply projection is based on power generation mix optimization, power generation capacity and operating hours, regional distribution, steam coal availability, environmental and water resource limits of coal-fired power generation, and transmission capability.
For oil and natural gas, oil demand is projected to be within 650 ± 50 million tonnes in 2030 and 750 ± 50 million tonnes in 2050. Domestic crude oil production is estimated to be stabilized between 180 and 200 million tonnes per year from present to 2050. It also sets a target to control the degree of dependence on oil import below 65%. To meet this target, another 120 ± 30 million tonnes of alternative liquid fuel would be needed, mainly for the transport sector and chemical plants. Natural gas demand is estimated to be around 550 billion m3 in 2050, and domestic natural gas production is estimated to be 300 billion m3 per year after 2030.
In summary, for the Chinese Academy of Engineering’s projections, energy saving potential is considered, leading to smaller amount of total energy demand compared with other scenarios. By carefully estimating the energy resource availabilities, promoting clean and efficient technologies and incentive policies, it projects a lower absolute amount of coal demand and a higher share of coal in the total energy demand in 2030. For scenarios in WEO 2010 [7], the energy-related CO2 emission is the most important external constraint of energy consumption. In these scenarios, the CO2-intensive energy demands are strictly controlled in order to achieve the total CO2 emission reduction targets, and renewable energy demand has greater shares of total than that in other scenarios.

6. Index Decomposition Analysis

Index decomposition methodology was first used in the 1970s to study the impact of changes in product mix on industrial energy demand [14,15,16]. Since then, energy researchers have developed several decomposition methods, and reported some applications in energy-related environmental analysis. By adopting index decomposition analysis (IDA), researchers are able to have a better understanding of the drivers of energy use and energy-related emissions in a specific energy consumption sector, such as transportation or industry. Similarly, we apply index decomposition methodology to analyze the drivers of energy consumption in different scenarios of the selected reports.

6.1. Index Decomposition Methodology

Amongst all decomposition methods, the Laspeyres and the arithmetic mean Divisia index methods are frequently used [14]. We apply the arithmetic mean Divisia index method to analyze energy consumption and CO2 emission drivers in different scenarios. The method and the concept of index decomposition of the aggregate energy intensity of industry are introduced below.
Assume that there are m different sectors in industry. Define the following variables for time t.
  • Et = Total industrial energy consumption;
  • Ei,t = Energy consumption in industrial sector i;
  • Yt = Total industrial production;
  • Yi,t = Production of industrial sector i;
  • Si,t = Production share of sector i (= Yi,t/Yt);
  • It = Aggregate energy intensity (= Et/Yt);
  • Ii,t = Energy intensity of sector i (= Ei,t/Yi,t);
The aggregate energy intensity is expressed in terms of sectoral energy intensity multiplying production share:
I t   =   i S i , t I i , t
Suppose the aggregate energy intensity varies from I0 in time 0 to IT in time T. Such a change can be expressed in two ways: Dtot = IT/I0 and ΔItot = ITI0 [14]. The first is referred to as multiplicative decomposition:
D t o t   =   I T / I 0   =   D s t r D i n t
In Equation (2), Dstr and Dint respectively represent the estimated impacts of changes in structure and sectoral energy intensity. The second way is additive decomposition:
Δ I t o t   =     I T I 0   =   o I s t r   +   t I i n t
In Equation (3), the impacts of changes in structure and sectoral energy intensity are expressed in additive form.
The Laspeyres index method isolates the impact of a variable by changing the specific variable while keeping the other variables constant. The formulae for multiplicative decomposition are:
D s t r   =   i S i , T I i , 0 / i S i , 0 I i , 0
D i n t   =   i S i , 0 I i , T / i S i , 0 I i , 0
D r s d   =   D t o t / ( D s t r D i n t )
Drsd denotes the unexplained part of Dtot. The formulae for additive decomposition are:
Δ I s t r   =   i S i , T I i , 0 i S i , 0 I i , 0
Δ I i n t   =   i S i , 0 I i , T i S i , 0 I i , 0
Δ I r s d   =   Δ I t o t Δ I s t r Δ I i n t
The arithmetic mean Divisia index method applies natural logarithm to It, and the differential equation as follows:
dln ( I t ) d t   =   i ω i [ dln ( S i , t ) d t   +   dln ( I i , t ) d t ]
In Equation (10), ωi = Ei,t/Et, is the sector share of energy consumption. Integrating from time 0 to time T:
ln ( I T / I 0 )   =   0 T i ω i [ dln ( S i , t ) / d t ]   +   0 T i ω i [ dln ( I i , t ) / d t ]
Thus:
D s t r   =   exp { 0 T i ω i [ dln ( S i , t ) / d t ] }
D i n t   =   exp { 0 T i ω i [ dln ( I i , t ) / d t ] }
In empirical studies, only discrete data are available. Therefore, Equations (12) and (13) are often approximated by the arithmetic mean of the weights for time 0 and time T:
D s t r   =   exp { i ( ω i , T   +   ω i , 0 ) 2 ln ( S i , T / S i , 0 ) }
D i n t   =   exp { i ( ω i , T   +   ω i , 0 ) 2 ln ( I i , T / I i , 0 ) }
and the additive decomposition formulae are:
Δ I s t r   =   i ( E i , T Y T   +   E i , 0 Y 0 ) 2 ln ( S i , T / S i , 0 )
Δ I i n t   =   i ( E i , T Y T   +   E i , 0 Y 0 ) 2 ln ( I i , T / I i , 0 )

6.2. Index Decomposition Method of National Energy Consumption and CO2 Emission

The index decomposition method is applied to analyze the external assumption impacts on the energy consumption and CO2 emission in different scenarios.
The followings are the calculation example of index decomposition of energy demand, and the analysis on CO2 emission goes the same way. Before index decomposition, a linear regression is made to fit the trend of energy consumption from the base year to the projection year. We choose energy intensity It to indicate the energy demand of year t, and It is assumed to have linear correlation with P1t and P2t, which represent per capita GDP of year t and per capita energy demand of year t respectively:
I t   =   a 0   +   a 1 P 1 t   +   a 2 P 2 t
where:
  • It: Energy intensity of year t = Energy demand of year t/GDP of year t;
  • P1t: per capita GDP of year t = GDP of year t/population of year t;
  • P2t: per capita energy demand of year t = energy demand of year t/population of year t;
  • a0, a1 and a2: regression coefficients.
Based on the projected energy demands from the base year to the projection year, a0, a1, a2 can be calculated by linear fitting method. We substitute the data of the energy demand, GDP, per capita GDP and per capita energy demand of the base year, 2020 and 2035 into Equation (18), respectively, and get the following equations:
I base   year   =   a 0   +   a 1 P 1 , base   year   +   a 2 P 2 , base   year
I 2020   =   a 0   +   a 1 P 1 , 2020   +   a 2 P 2 , 2020
I 2035   =   a 0   +   a 1 P 1 , 2035   +   a 2 P 2 , 2035
In Equations (19–21), a0, a1 and a2 are unknown variables. By solving the three simultaneous equations, we can have the value of a0, a1 and a2.
Then further analysis on the regression coefficients are made as follows:
dln ( I t ) d t   =   1 I t ( a 1 d P 1 t d t   +   a 2 d P 2 t d t )
  dln ( I t )   =   1 I t ( a 1 d P 1 t   +   a 2 d P 2 t )
ln ( I t I 0 )   =   1 I t [ a 1 ( P 1 t P 1 0 )   +   a 2 ( P 2 t P 2 0 ) ]
I t I 0   =   exp [ a 1 I t ( P 1 t P 1 0 )   +   a 2 I t ( P 2 t P 2 0 ) ]   =   exp [ a 1 I t ( P 1 t P 1 0 ) ] exp [ a 2 I t ( P 2 t P 2 0 ) ]
Define:
De = It/I0
D e 1   =   exp [ a 1 I t ( P 1 t P 1 0 ) ]
D e 2   =   exp [ a 2 I t ( P 2 t P 2 0 ) ]
Then De indicates the change of energy intensity between the base year and the projection year. By Equation (25) to Equation (28), De = De1·De2, De1 indicates the impact of GDP growth on energy demand, and De2 indicates the impact of population growth on energy demand.
Similarly, we can make linear regression on CO2 emission intensity as the function of per capita GDP and per capita energy demand:
C t   =   b 0   +   b 1 P 1 t   +   b 2 P 2 t
In Equation (29), Ct represents the CO2 emission intensity of year t, and Ct = CO2 emissions of year t/GDP of year t; b0, b1 and b2 are the regression coefficients, which can be calculated with the same method used to calculate a0, a1 and a2, as already stated. After index decomposition, define:
Dc = Ct/C0
D c 1   =   exp [ b 1 C t ( P 1 t P 1 0 ) ]
D c 2   =   exp [ b 2 C t ( P 2 t P 2 0 ) ]
Dc indicates the change of CO2 emission intensity between the base year and the projection year. And Dc = Dc1·Dc2, Dc1 indicates the impact of GDP growth on CO2 emissions, and Dc2 indicates the impact of population growth on CO2 emissions.
The decomposition process is carried out by Microsoft excel, and the results and discussions will be given below.

6.3. Index Decomposition Results

The index decomposition of energy demand and CO2 emission in different scenarios are shown in Figure 13 and Figure 14.
Figure 13. Index decomposition of energy intensity.
Energies 06 03444 g013
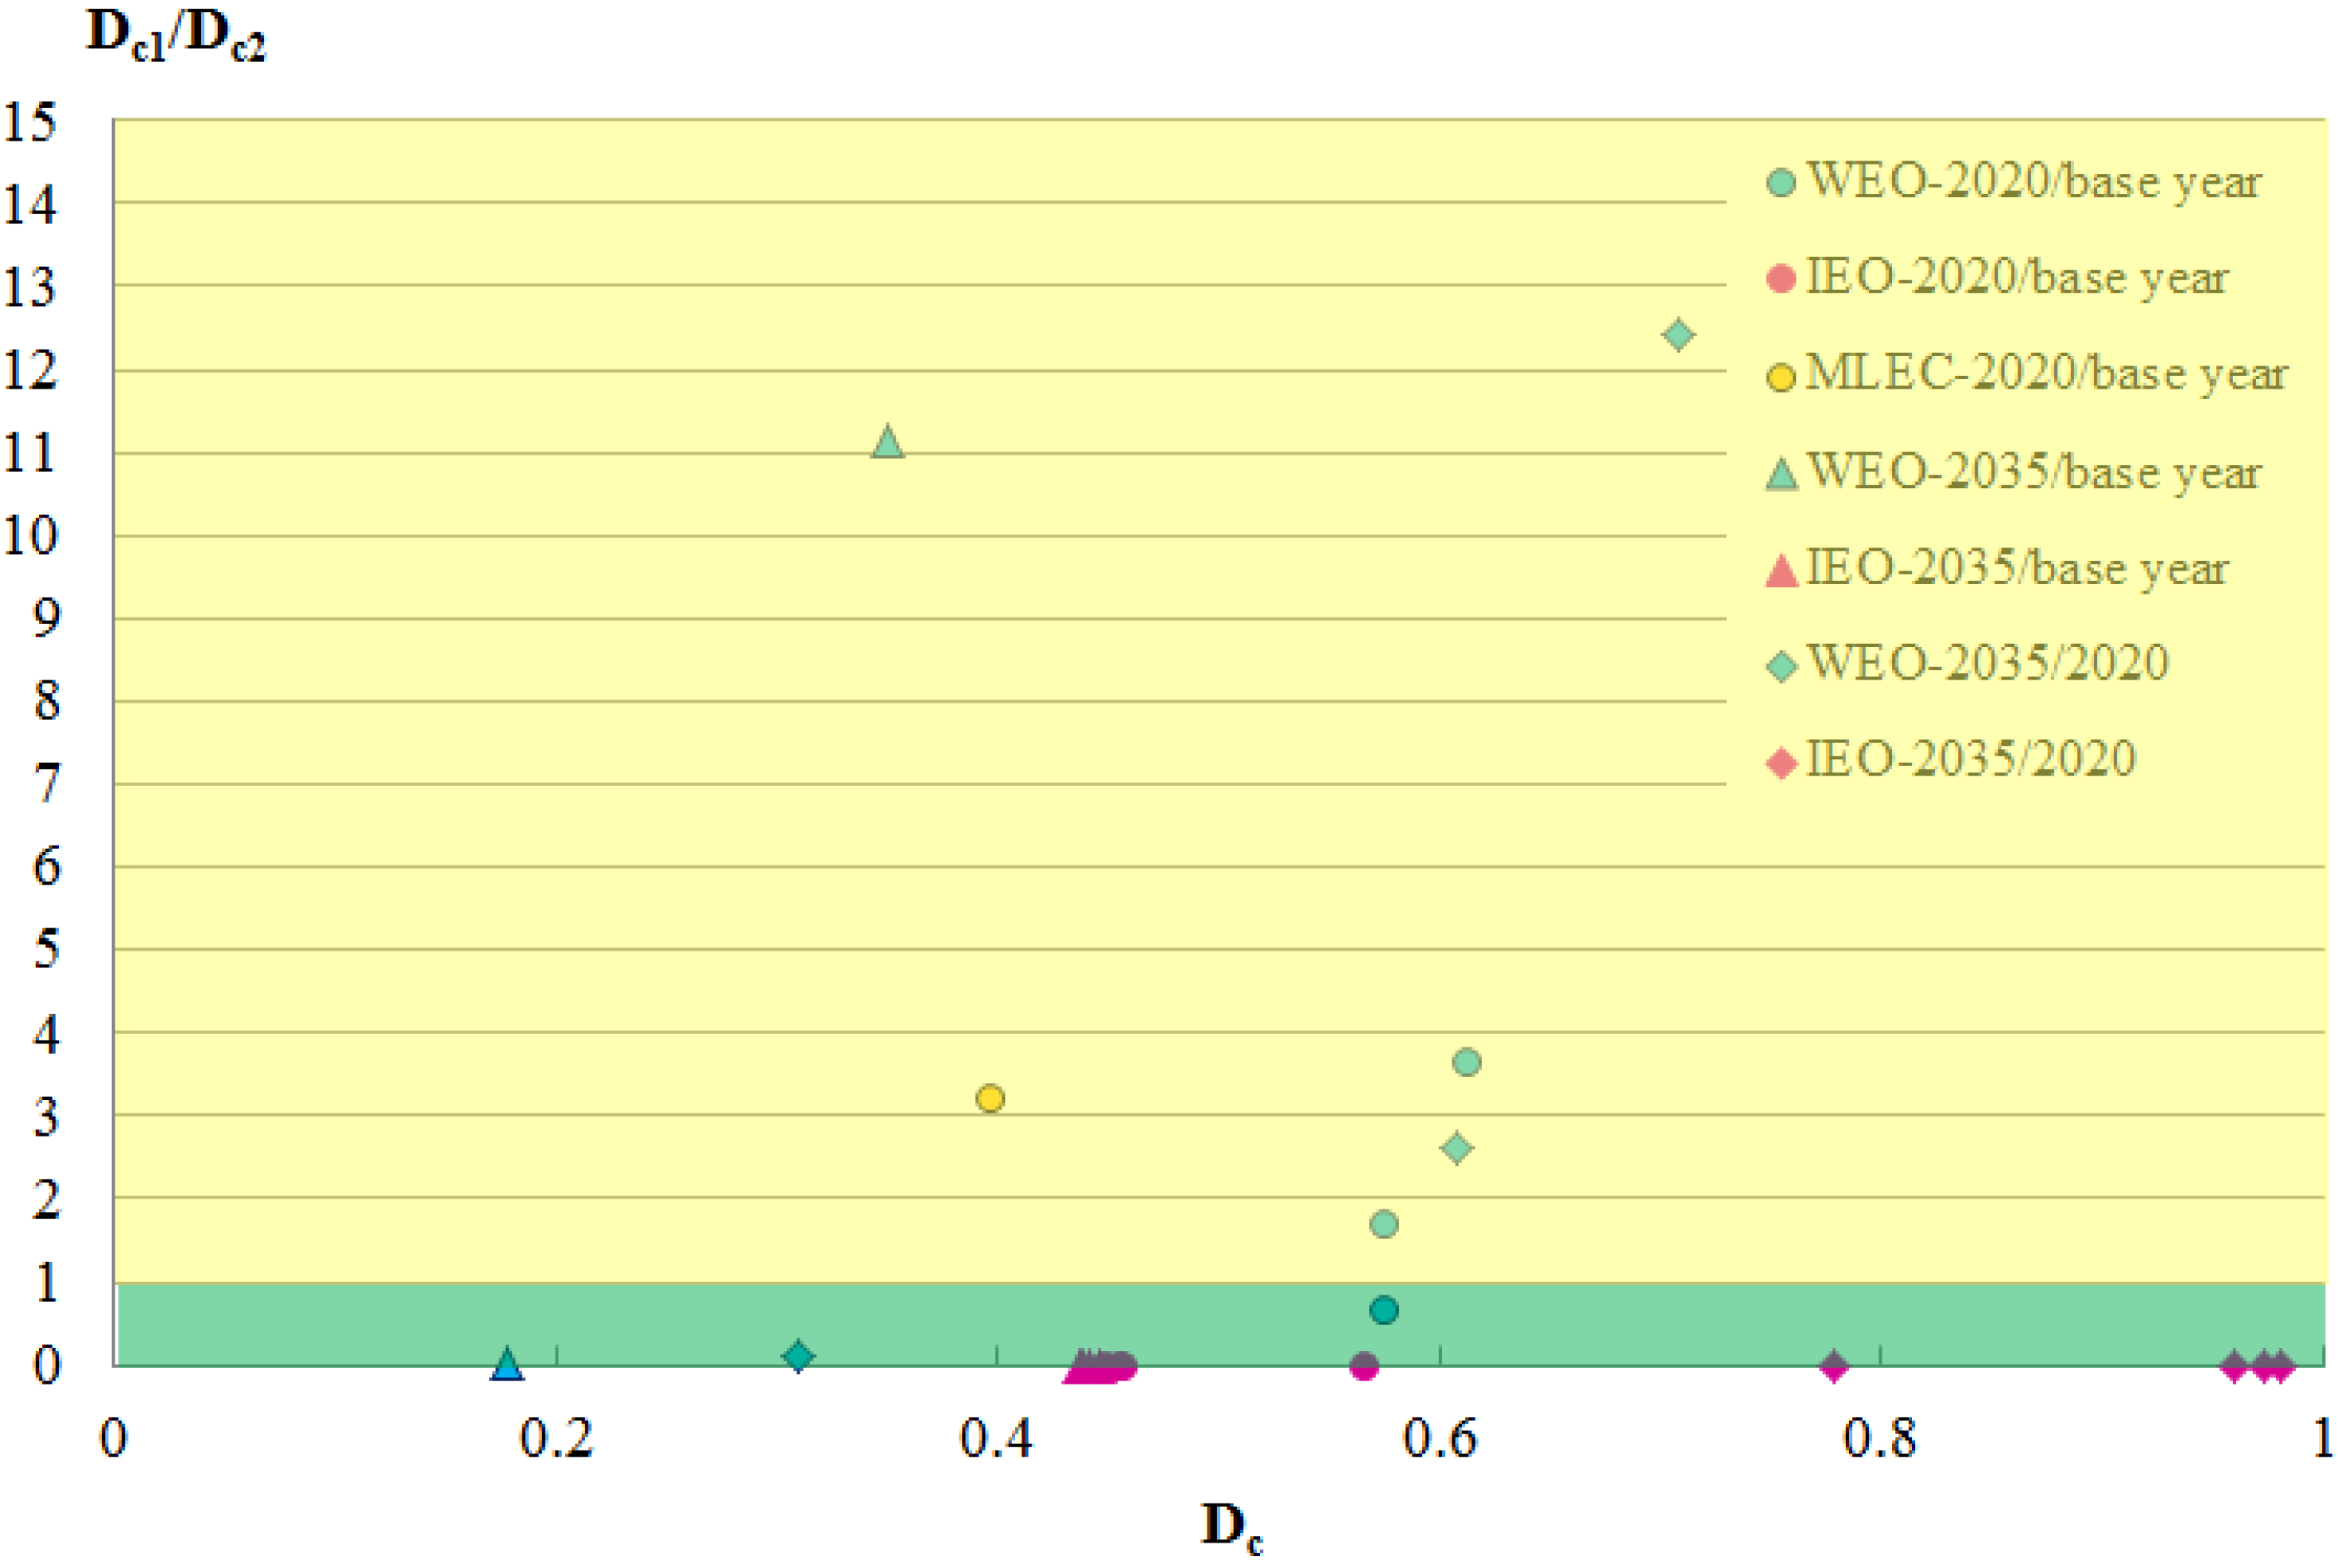
Figure 14. Index decomposition of CO2 emission intensity.
Energies 06 03444 g014
In Figure 13, the horizontal axis represents the changes from the base year to projection year, and the vertical axis represents the ratio of GDP and population impacts on energy intensity changes. When De1/De2 is larger than one, it means that impacts of per capita GDP are greater than per capita energy demand. Contrarily, when De1/De2 is smaller than one, it means that impacts of per capita energy demand are greater than per capita GDP.
For energy demands in scenarios of WEO 2010 [7] and the Chinese Academy of Engineering, most decomposed population indexes are smaller than GDP indexes, indicating that economy has greater impacts than per capita energy demand on energy demand growth. At the same time, both the indexes have positive impacts on energy demand growth.
For energy demands in scenarios of IEO 2010 [8], De1/De2 are mostly equals to zero, indicating that per capita energy demand has greater impacts than economy on energy demand growth. Also, both the indexes have positive impacts on energy demand growth. However, the actual value of De1 approaches 0 and De2 approaches infinity, indicating that in scenarios of IEO 2010 [8], energy demands are not approximately linearly dependent on population and GDP. Referred to the scenario settings, oil price is a significant factor.
In Figure 14, the horizontal axis represents the changes from the base year to projection year, and the vertical axis represents the ratio of GDP and population impacts on CO2 emission intensity changes. When Dc1/Dc2 is larger than one, it means that impacts of per capita GDP are greater than per capita energy demand. Contrarily, when Dc1/Dc2 is smaller than one, it means that impacts of per capita energy demand are greater than per capita GDP.
For CO2 emissions in scenarios of WEO 2010 [7] and the Chinese Academy of Engineering, most decomposed population indexes are smaller than GDP indexes, indicating that economy has greater impacts on CO2 emission than per capita energy demand. At the same time, both the indexes have positive impacts on CO2 emission growth.
For CO2 emissions in scenarios of IEO 2010 [8], Dc1/Dc2 are mostly equals to 0, indicating that per capita energy demand has greater impacts than economy on CO2 emission growth. However, the actual value of Dc1 approaches 0 and Dc2 approaches infinity, indicating that in scenarios of IEO 2010 [8], CO2 emissions are not approximately linearly dependent on population and GDP. Referred to the scenario settings, oil price is a significant factor. As there are no specific oil price data in the report, index decomposition on oil price impacts on energy demand and CO2 emission are not made here.
The summary of the decomposition results is provided in Table 5.
In conclusion, by index decomposition on energy demand and CO2 emission intensity changes from the base year to projection year, we have better understandings on how per capita GDP and per capita energy demand drive the total energy demand and CO2 emission in different scenarios. For WEO 2010 and the Chinese Academy of Engineering projections: compared with per capita energy demand, economy has greater impacts on energy demand intensity and CO2 emission intensity. For IEO 2010 projections, per capita energy demand has greater impacts than economy growth, and oil price is considered as a significant factor of energy demand and CO2 emission changes.
Table 5. Summary of the decomposition results.
Index Decomposition of Energy Intensity2020/base year2035/base year2035/2020
DeDe1/De2DeDe1/De2DeDe1/De2
WEO 2010CPS0.6205.6890.447126.8010.72211.419
NPS0.5952.4330.3979.4760.6662.495
450S0.5841.0520.3320.5030.5700.460
IEO 2010RC0.6125.31 × 10−160.4861.31 × 10−480.7942.29 × 10−29
HEGC0.6036.77 × 10−350.4732.04 × 10−1160.7857.18 × 10−73
LEGC0.6214.54 × 10−110.4991.35 × 10−300.8031.01 × 10−17
HOPC0.6021.08 × 10−050.4801.34 × 10−160.7972.29 × 10−10
LOPC0.6191.63 × 10150.4881.20 × 10470.7896.27 × 1027
MLEC0.5263.4520.30576.3750.5798.980
WEO 2010CPS0.6133.6710.434149.9330.70812.405
NPS0.5751.7130.34911.1390.6082.606
450S0.5750.6670.1780.0380.3100.106
IEO 2010RC0.5661.12 × 10−150.4422.24 × 10−610.7795.29 × 10−37
HEGC0.4491.02 × 10−570.4376.32 × 10−2150.9732.67 × 10−134
LEGC0.4553.81 × 10−200.4462.24 × 10−630.9822.23 × 10−36
HOPC0.4568.28 × 10−090.4381.18 × 10−290.9600.000
LOPC0.4457.41 × 10280.4418.36 × 10980.9912.56 × 1058
MLEC0.3973.2200.19520,273.9990.491175.799
Notes: CS: Current Policies Scenario; NS: New Policies Scenario; 450S: 450 Scenario; RC: Reference Case; HEGC: High Economic Growth Case; LEGC: Low Economic Growth Case; HOPC: High Oil Price Case; LOPC: Low Oil Price Case.

7. Conclusions

By studying and comparing five existing reports of macro energy scenarios of China, we illustrate the major differences of the scenarios, and interpret reasons behind these differences. By summarizing and reviewing the criteria above, we show the differences in obtaining various scenarios of the macro energy situation of China in the future. For the Chinese Academy of Engineering’s projections, energy saving potential is considered in a substantial way, leading to smaller amount of total energy demand compared with other scenarios. By carefully estimating the energy resource availabilities, making technology development pathways and promoting incentive policies, the Chinese Academy of Engineering projects a relatively lower range of coal demand and higher share of total energy demand in 2030, and lower energy-related CO2 emissions, compared with other scenarios. For scenarios in WEO 2010 [7], the energy-related CO2 emission is the most important external limit of energy consumption. In these scenarios, the CO2-intensive energy demands are strictly controlled in order to achieve the total CO2 emission reduction targets, and renewable energy demand has greater shares of total than that in other scenarios.
To better understand the drivers of energy demand and CO2 emission trend, we introduce index decomposition method to analyze economic and population impacts. For WEO 2010 [7] and the Chinese Academy of Engineering projections: compared with per capita energy demand, economy has greater impacts on energy demand intensity and CO2 emission intensity. For IEO 2010 projections, per capita energy demand has greater impacts than economy growth, and oil price is considered as a significant factor of energy demand and CO2 emission changes.

Acknowledgments

The authors gratefully acknowledge the financial support from National Natural Science Foundation of China (project No.: 51106080), from the IRSES ESE Project of FP7 (contract No.: PIRSES-GA-2011-294987), and from BP company in the scope of the Phase II Collaboration between BP and Tsinghua University.

Conflict of Interest

The authors declare no conflict of interest.

References

  1. NBSC (National Bureau of Statistics of China). China Statistical Yearbook 2010; [in Chinese]; China Statistics Press: Beijing, China, 2010.
  2. EIA (U.S. Energy Information Administration). International Energy Outlook 2011; EIA: Washington, DC, USA, 2011.
  3. IEA (International Energy Agency). World Energy Outlook 2000; IEA: Paris, France, 2000. [Google Scholar]
  4. EIA (U.S. Energy Information Administration). International Energy Outlook 2000; EIA: Washington, DC, USA, 2000.
  5. NBSC (National Bureau of Statistics of China). China Statistical Yearbook 2011; [in Chinese]; China Statistics Press: Beijing, China, 2011.
  6. IEA (International Energy Agency). World Energy Outlook 2009; IEA: Paris, France, 2009. [Google Scholar]
  7. IEA (International Energy Agency). World Energy Outlook 2010; IEA: Paris, France, 2010. [Google Scholar]
  8. EIA (U.S. Energy Information Administration). International Energy Outlook 2010; EIA: Washington, DC, USA, 2010.
  9. BP. BP Energy Outlook 2030; BP: London, UK, 2011. [Google Scholar]
  10. CAE (Chinese Academy of Engineering). The Mid-Term and Long-Term Energy Development Strategy of China (2030,2050); [in Chinese]; Science Press (China): Beijing, China, 2010. [Google Scholar]
  11. IEA (International Energy Agency). World Energy Model—Methdology and Assumptions; IEA: Paris, France, 2010. [Google Scholar]
  12. EIA (U.S. Energy Information Administration). The National Energy Modeling System: An Over View 2009; EIA: Washington, DC, USA, 2009.
  13. UNPD (United Nations Population Division). World Population Prospects; the 2009 Revision; UNPD: New York, NY, USA, 2009. [Google Scholar]
  14. Ang, B.W.; Zhang, F.Q. A survey of index decomposition analysis in energy and environmental studies. Energy 2000, 25, 1149–1176. [Google Scholar] [CrossRef]
  15. Wood, R.; Lenzen, M. Structural path decomposition. Energy Econ. 2009, 31, 335–341. [Google Scholar] [CrossRef]
  16. Su, B.; Ang, B.W. Structural decomposition analysis applied to energy and emissions: Some methodological developments. Energy Econ. 2012, 34, 177–188. [Google Scholar] [CrossRef]