Article

Use of LCA as a Tool for Building Ecodesign. A Case Study of a Low Energy Building in Spain

Research Centre for Energy Resources and Consumption (CIRCE), Campus Río Ebro, University of Zaragoza, Mariano Esquillor, 15–E50018 Zaragoza, Spain
*
Author to whom correspondence should be addressed.
Energies 2013, 6(8), 3901-3921; https://doi.org/10.3390/en6083901
Submission received: 3 June 2013 / Revised: 15 July 2013 / Accepted: 22 July 2013 / Published: 2 August 2013
(This article belongs to the Special Issue Energy Efficient Building Design 2013)

Abstract

:
This paper demonstrates how to achieve energy savings in the construction and operation of buildings by promoting the use of life cycle assessment techniques in the design for new buildings and for refurbishment. The paper aims to draw on the application of a specific methodology for low energy consumption, integrated planning, environmental performance evaluation of buildings, and design for sustainability and LCA techniques applied to buildings. The ENergy Saving through promotion of LIfe Cycle assessment in buildings (ENSLIC) methodology based on LCA for use in an integral planning process has been promoted to stakeholders who require a means to optimize the environmental performance of buildings. Feedback from the stakeholders has facilitated the creation of simplified LCA guidelines, a systematic approach guiding the user through the alternative options regarding software choices, their strengths and weaknesses, the databases available, the usefulness of different indicators, aggregation, definition of limits and options for simplifying the process. As a result, this paper presents the applied results of a case study where this methodology is implemented serving as an energy savings evaluation tool for decision makers, end-users, professionals involved in the different stages of construction, etc. Finally, it is demonstrated how LCA can facilitate comparisons between different buildings, showing the influence of all variables on a building’s life cycle environmental impact and showing the potential for energy savings. Removing market barriers to sustainable construction is actually stricter and this is good news for promoting higher energy efficiency in buildings.

1. Introduction

The construction sector has become one of the most intensive in the use of energy and raw materials. The main reason for this is the introduction of modern building materials that, unlike traditional materials, increase the embodied energy and carbon footprint of the constructions as they are made far away from where they are finally used and are produced through costly manufacturing processes [1].
The adoption of environmental strategies focused on reducing consumption of natural resources, especially energy, and waste generation can not only lessen the environmental impact but also provide companies with a competitive advantage by reducing costs and adding net value.
In order to identify opportunities for improving the environmental aspects associated with the construction sector over the complete life cycle of the building, i.e., production, construction, use and maintenance and final disposal, tools for assessment and decision-making are needed.
Global methodologies such as Life Cycle Assessment (LCA) are very appropriate for evaluating the influence that decisions adopted in the design phase of a building related to the maintenance and associated operational costs have on the real environmental impact of the building and for identifying the influence of all the variables involved in the life cycle of a building [2]. LCA also allows us to compare the environmental impact of buildings located in different geographical zones or with different uses, for example [3].
During the past years, building design to minimize consumption during the use phase has been intensified [4], for that reason special attention to impacts in other phases as a result of the reduction of such consumption must be shown, especially during the production phase [5,6].
Analyzing separately the production of all the elements of a building, the structure is the one that has the greatest impact of all of them, hence the importance of analyzing the supporting elements of a building from the global perspective of the analysis [7,8,9].
In addition the use of LCA reinforces complicated aspects to evaluate during the design phase when it comes to estimate future scenarios of occupation of the building, which will have consequences on the energy loads considered for the use phase [10].
LCA can be combined with life cycle cost assessment in order to obtain a greater economic return on the construction investment, contributing to an improvement in energy management in buildings [11,12]. This combination may for instance be used for choosing alternative technical solutions [13,14], identifying the technical solution that meets an environmental target with the lowest cost, converting the environmental impact into costs, and evaluating a building investment.
The application of LCA techniques can definitely be useful for many interest groups. While it can help construction companies make decisions when selecting suppliers and materials or waste management [15,16,17], for instance, governmental organizations can use the LCA methodology for planning, establishing priorities, taxation policies, R&D programs, etc. Finally, the LCA results mean owners can be aware of the environmental impact their building has.
As consideration for the environment continues to gain respect in the marketplace and in business, the construction sector has to modify its strategies and differentiate buildings by taking advantage of the widespread possibilities that LCA has to offer.
However, LCA has been branded rather difficult to apply because there are many input variables to be handled, for which the specific data is sparse, and sufficient criteria are needed to discriminate the numerous results obtained, especially during the early design phases.
One of the factors that create more confusion is the lifespan of the building and one of the possible solutions is to carry out statistical studies to refine this value [18]. The uncertainty generated by the lifespan of a building, it also complicates raised scenarios during the end of life, being this stage the greater uncertainty of all [19,20].
In addition other barriers have been identified to more widespread implementation of LCA as the lack of free databases and also legislative requirements or other incentives, such as the de-linking of the current procedures of energy certification and LCA [21].

2. Objectives and Limitations

This paper shows how a simplified LCA methodology developed by the authors can be used as a tool to evaluate energy savings as well as to highlight the most influential variables in a building’s environmental impact in order to select the most appropriate way to sustainable construction.
As a result of the application of this simplified methodology, a case study is presented in this paper with the goal of serving as an energy savings evaluation tool for decision makers, end-users, professionals involved in the different stages of construction, etc. Finally, it is demonstrated how a new simplification of the methodology can be done according to the results of the case study.
The main limitations to the widespread use of LCA are the complexity and uncertainty of results, whose origin lies in the low reliability of the input data. However when only rough estimates are needed, it is possible to make some simplifications [22,23,24,25] which facilitate the use of LCA among a wider group of users.
These users (architects, construction federations, architecture institutes, local authorities, civil engineers and building owners) have been involved in setting an adapted LCA methodology as the main objective of the ENSLIC project.

3. Methodology

3.1. Principles

The ENergy Saving through promotion of LIfe Cycle assessment in buildings (ENSLIC) Project, which was co-funded by the European Commission Intelligent Energy for Europe Programme and by nine European organizations that included more than 15 LCA experts and architects, sought to promote the use of LCA techniques in design for new buildings and for refurbishment, in order to achieve an energy saving in the construction and operation of buildings.
Starting with existing information generated from previous research projects the output was a set of guidelines with an LCA simplified methodology. The simplified methodology adopted a systematic approach guiding the user through the Life Cycle process and clarifying key issues that usually cause difficulty, e.g., choice of assessment tool, definition of system boundaries, options for simplifying the process, etc. [26].
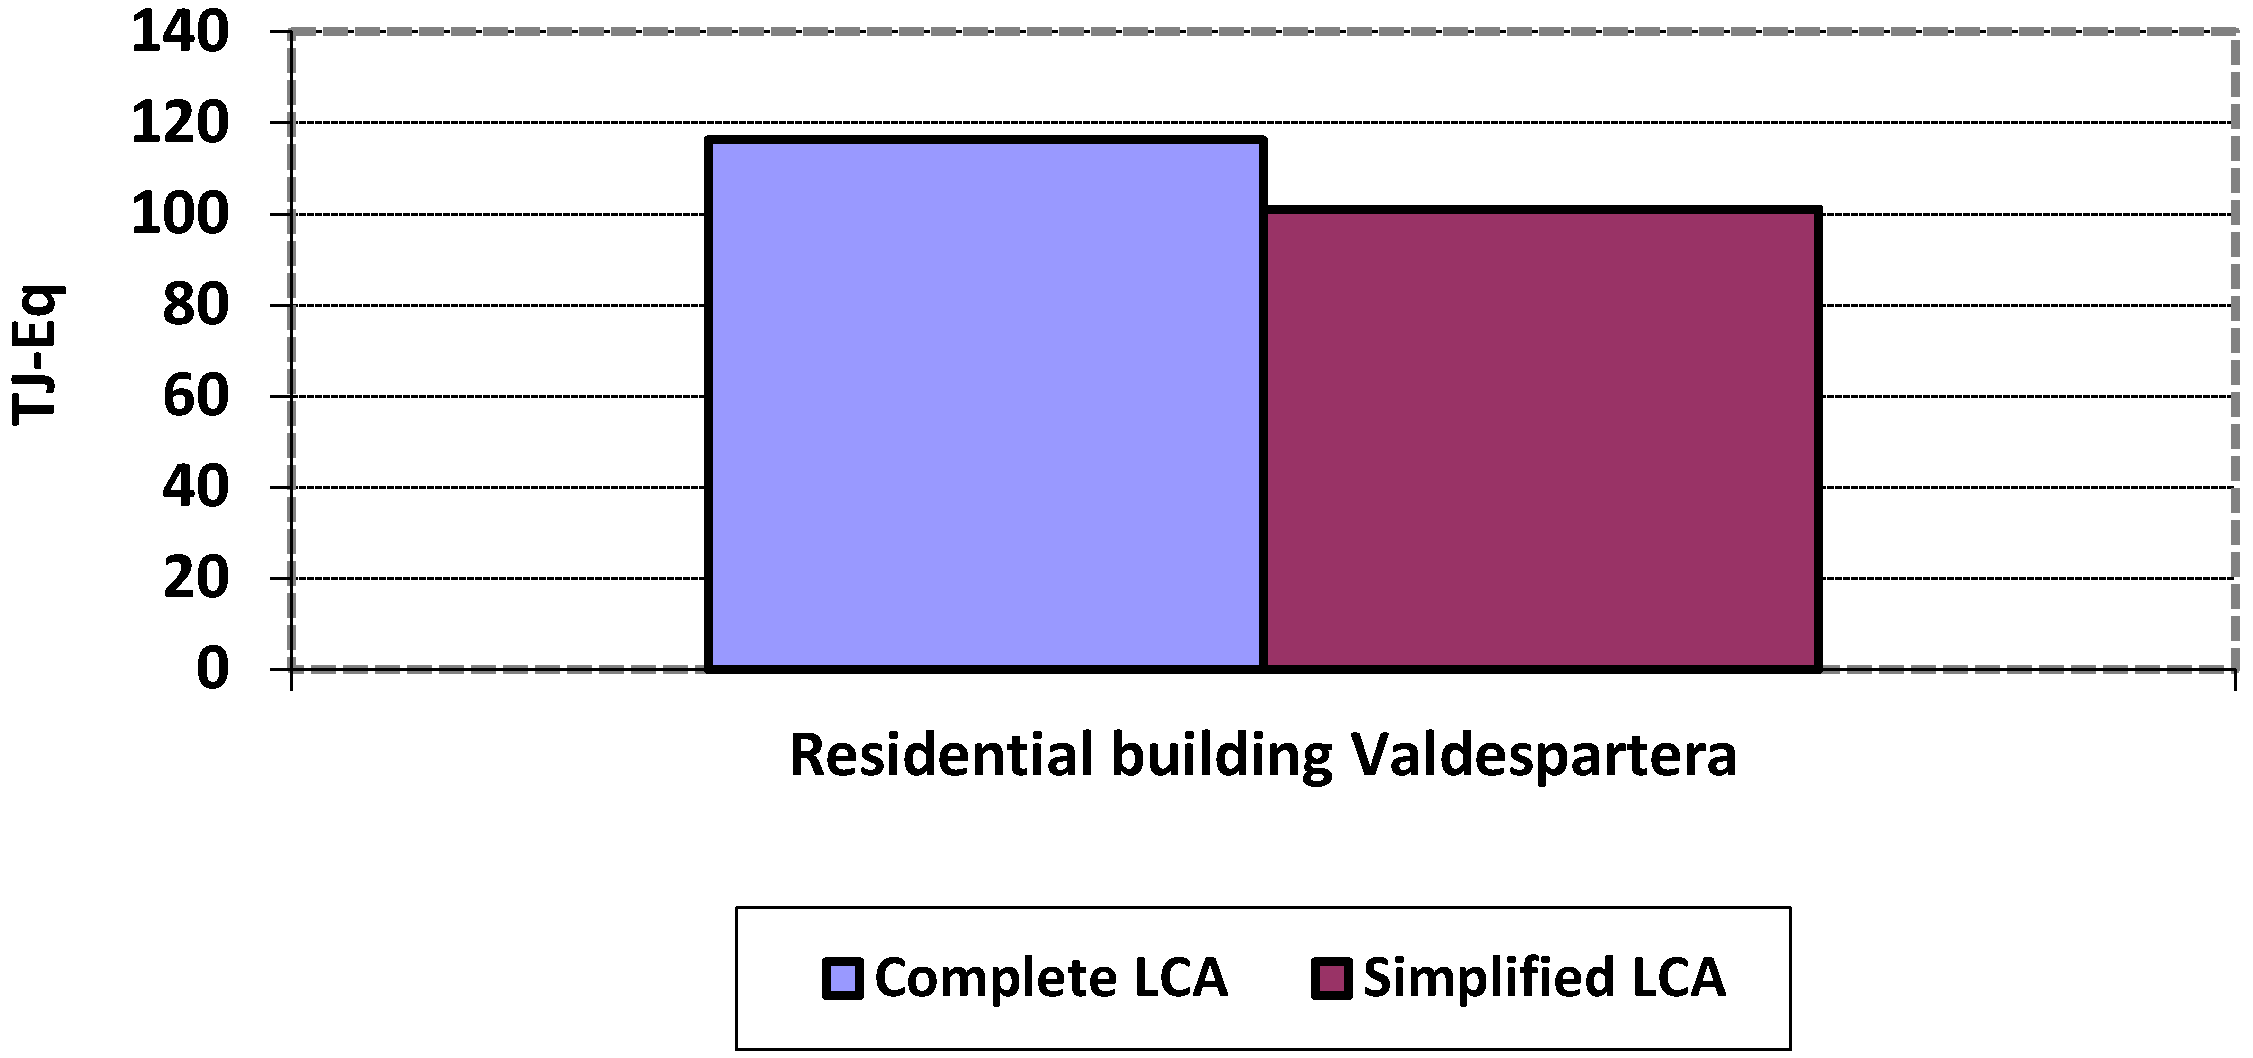
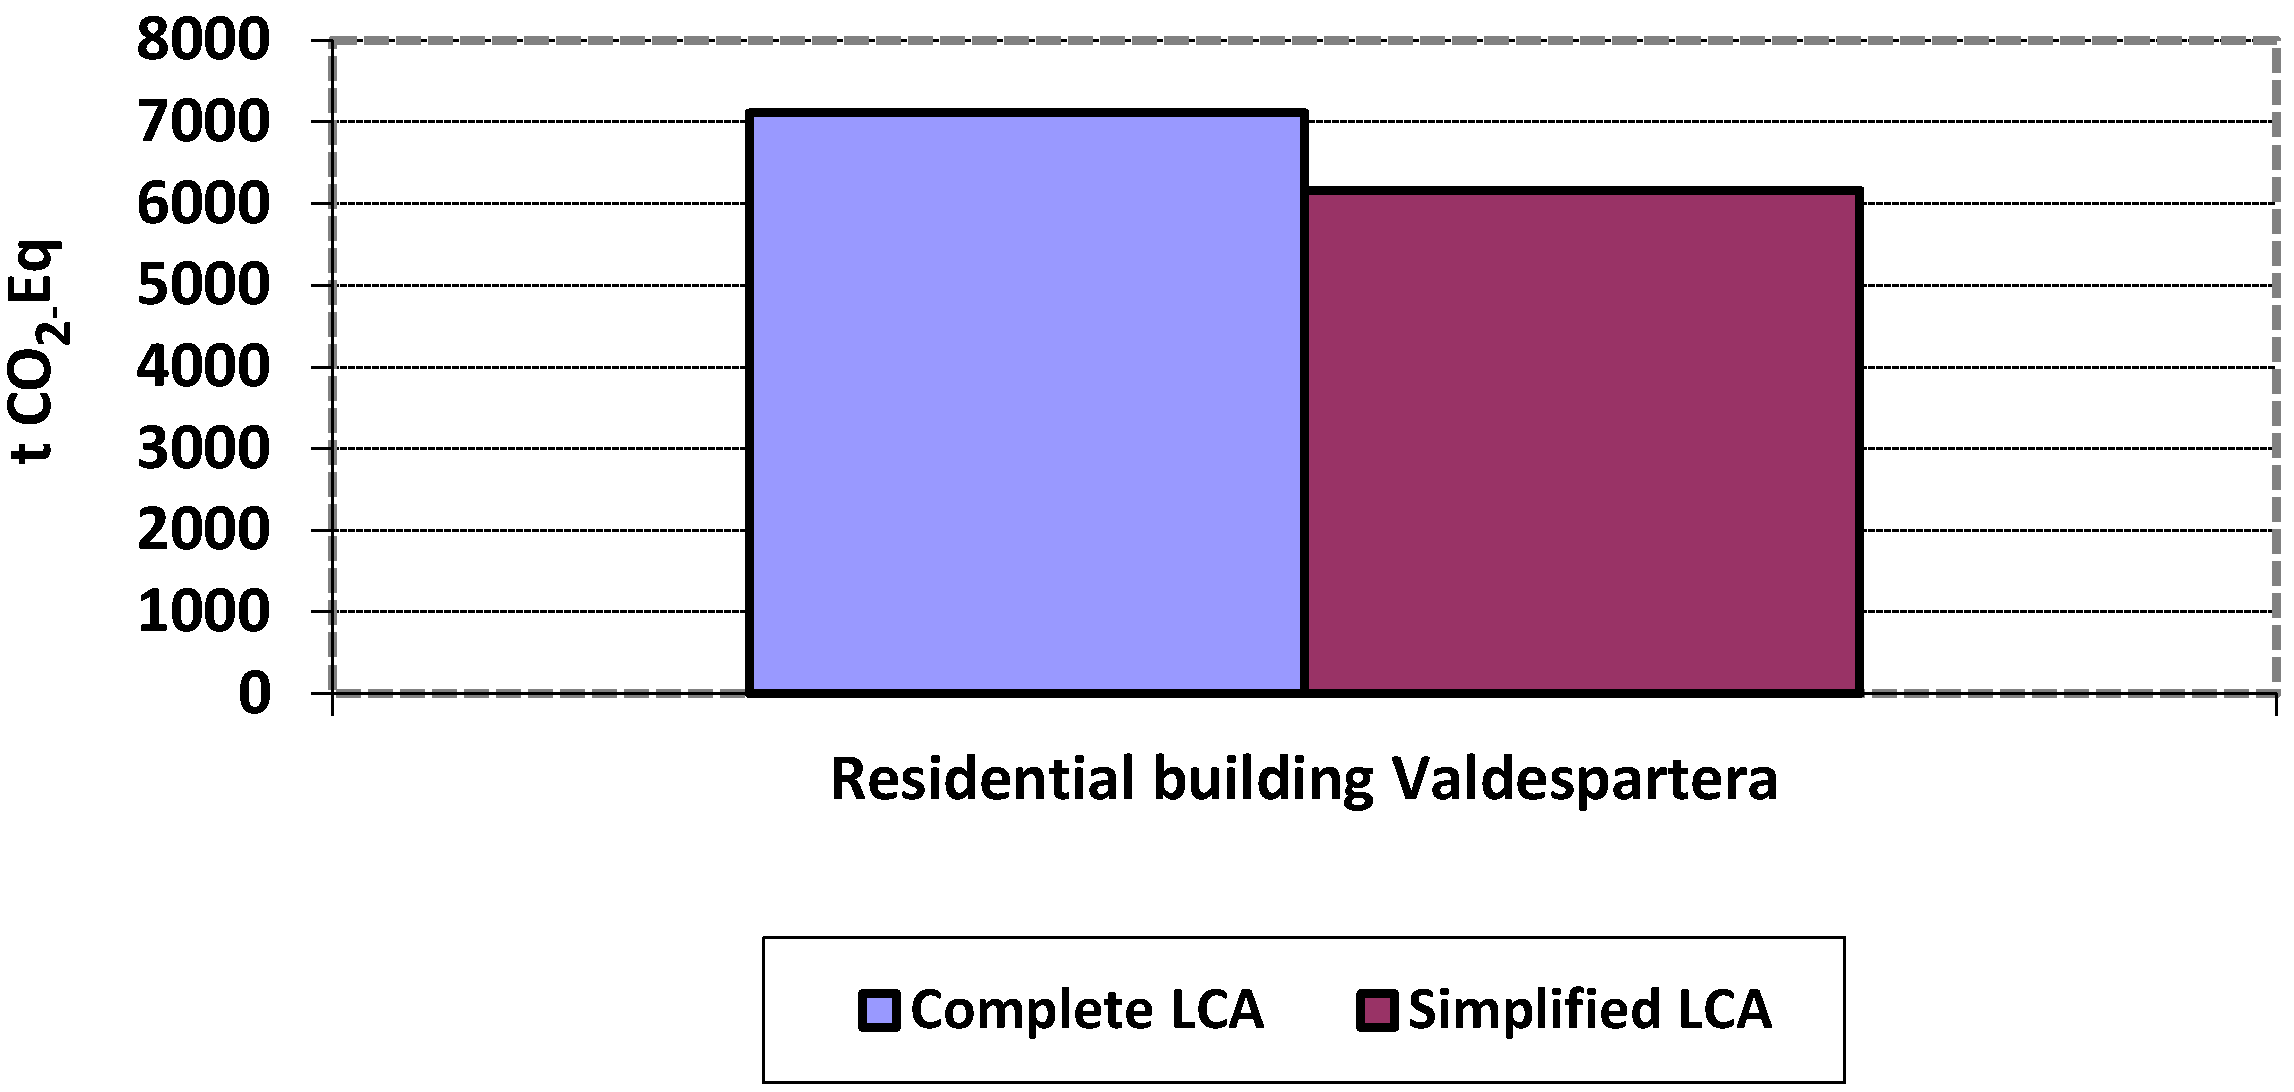
In order to provide practical applications for the simplified methodology a series of case studies on real buildings were carried out by a number of previously trained collaborating target groups. In the cases studies, the impact assessment was based primarily on indicators of energy consumption and GHG emissions in line with the current environmental problems. However, the proposed methodology allows the consideration of other environmental indicators (energy and financial) always from a life cycle perspective. Through case studies, construction players are able to increase their knowledge on the energy and environmental specifications of different materials and building solutions. This way they have in their hands all necessary information to be able to consider energy and environmental impacts when making decisions on the selection of materials, suppliers and more eco-efficient production processes.
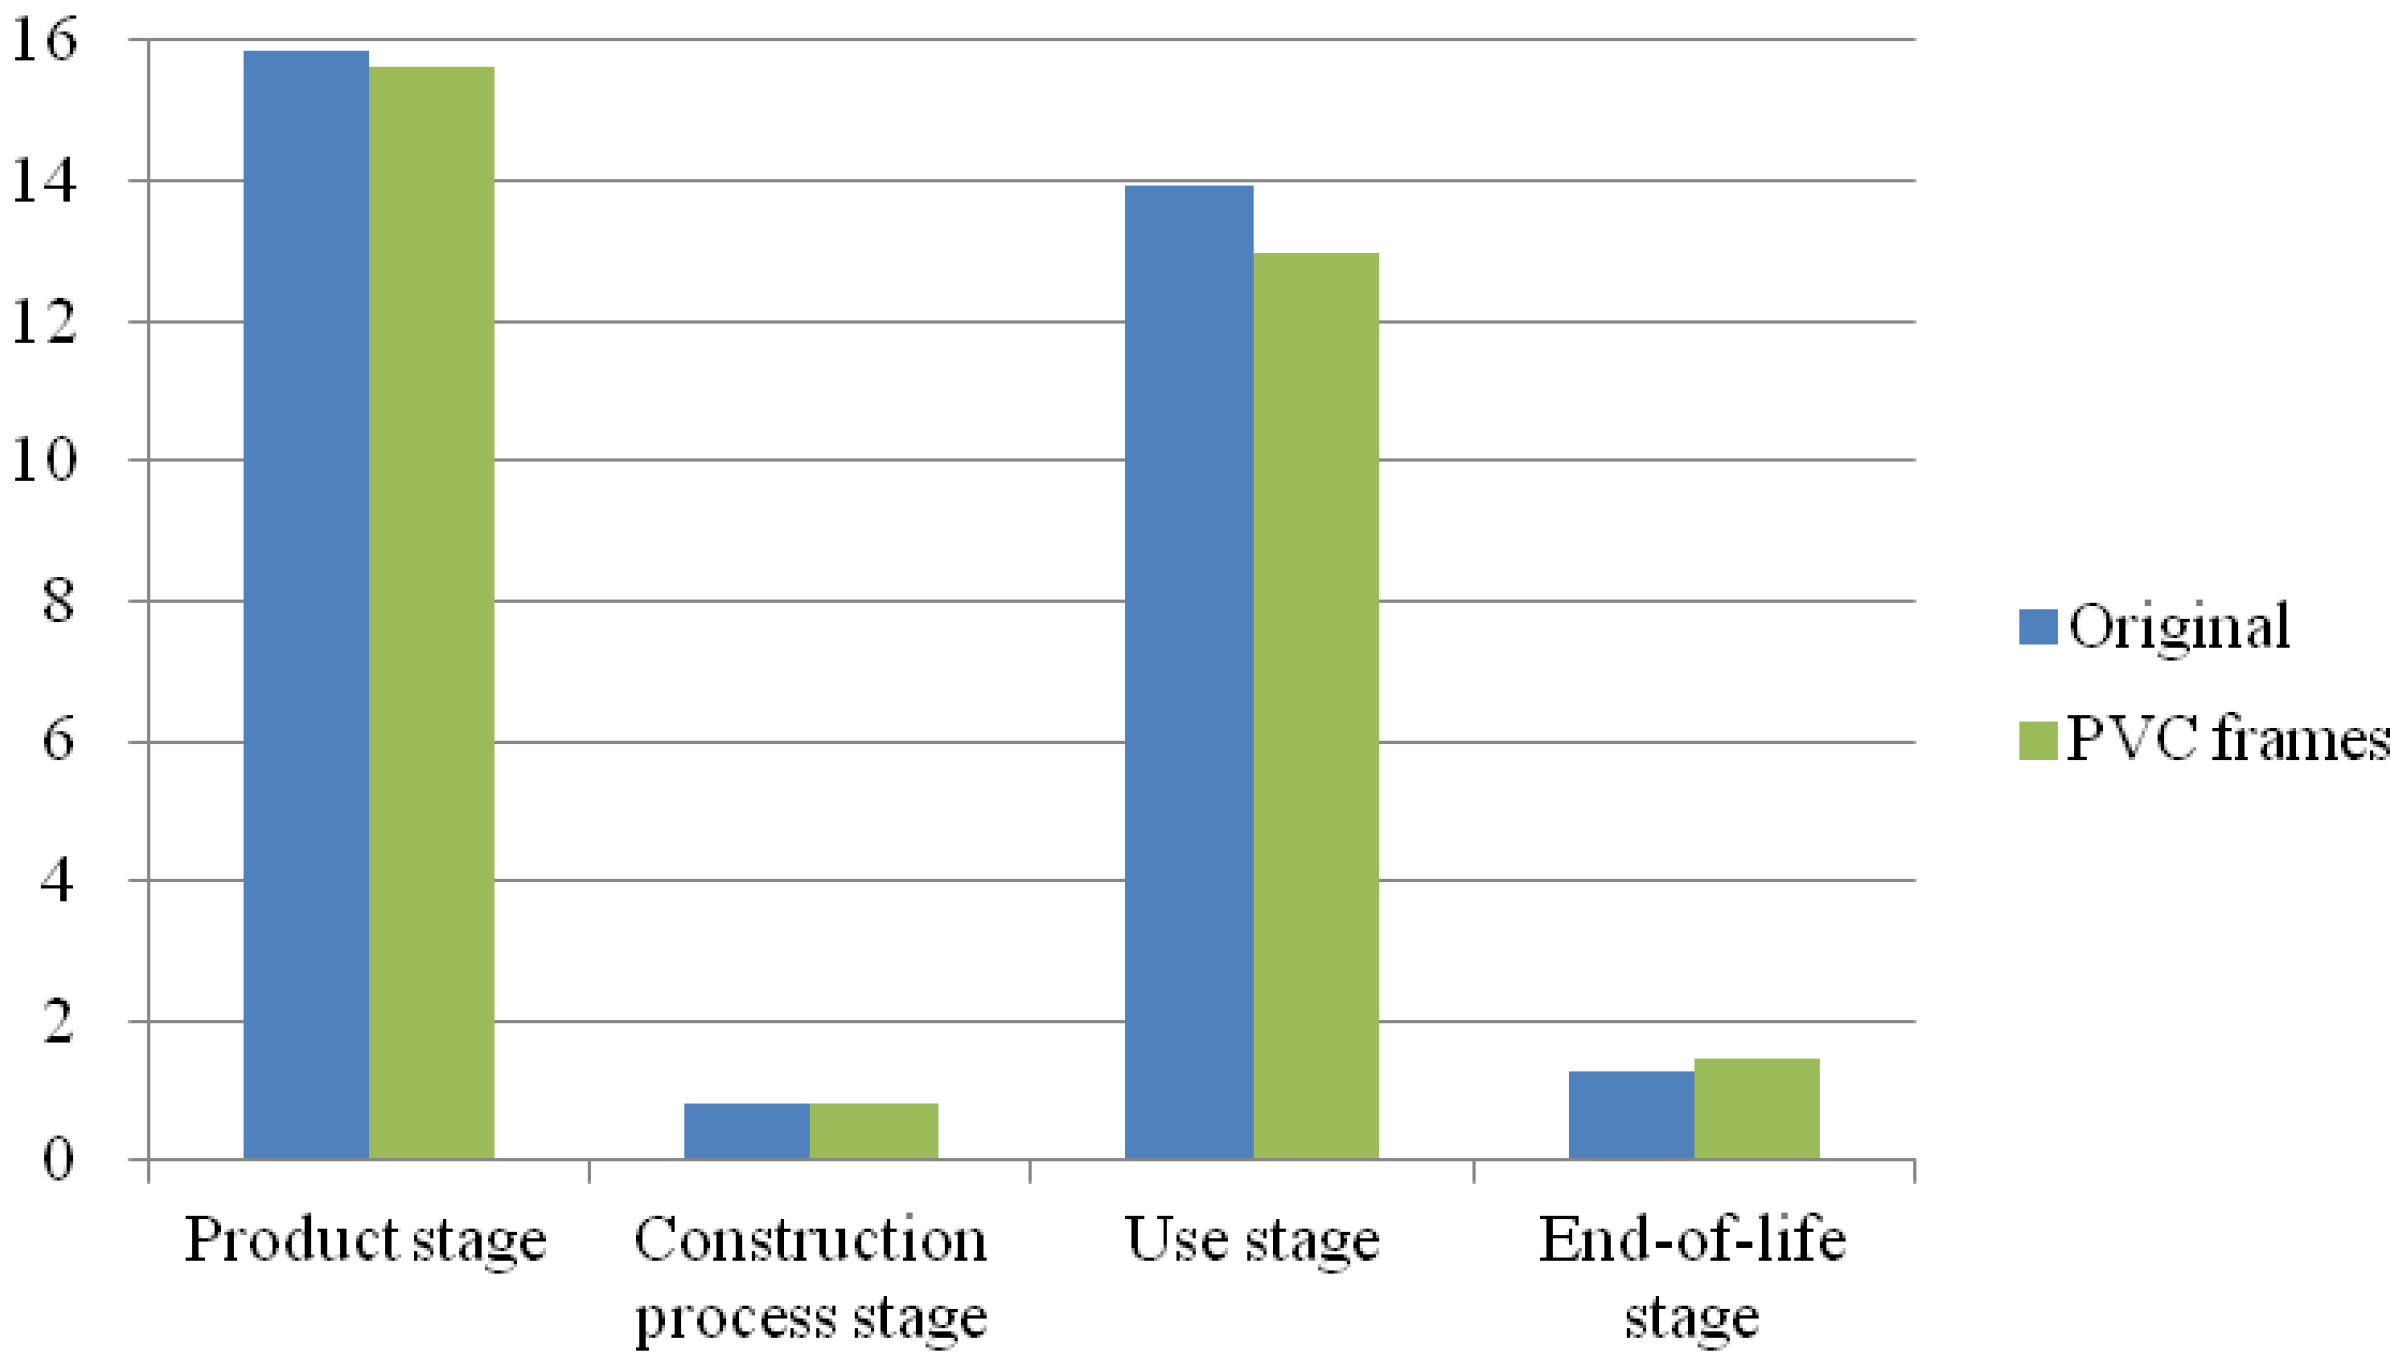
In this LCA study a building representative of the ecocity of Valdespartera (Zaragoza, Spain) was selected initially as a functional unit considering a service life of 50 years. Within the limits of the system, the four stages shown in Table 1 and proposed by the technical committee―Sustainability of construction works CEN/TC 350: product, construction process, use, and end-of-life stage [27] were included initially.
Regarding the data quality requirements, the existing inventories in the Ecoinvent v2.0 database [28,29] were initially selected and adapted to the Spanish electric mix and to the characteristics of the case studied.
The impact categories considered in this study were the primary energy demand (in MJEq or kWh-Eq) according to the CED method [30] and GWP [31] (in kg CO2-Eq) according to the IPCC 2007 methodology [32], considering a time horizon of 100 years. The software tool used in the study was SimaPro v7.3. (PRé Consultants bv, AD Amersfoort, The Netherlands)
Table 1. Life cycle stages of a building based on the CEN/TC 350 standard, EN 15643-2 Sustainability of construction works-Environmental product declarations—Product category rules.
StageModule codeModule
I. Product stageA1Raw materials supply
A2Transport
A3Manufacturing
II. Construction process stageA4Transport
A5Construction-installation on-site processes
III. Use stageB1Use
B2Maintenance
B3Repair
B4Replacement
B5Refurbishment
B6Operational energy use
B7Operational water use
IV. End-of-life stageC1Deconstruction-demolition
C2Transport
C3Waste treatment
C4Final disposal

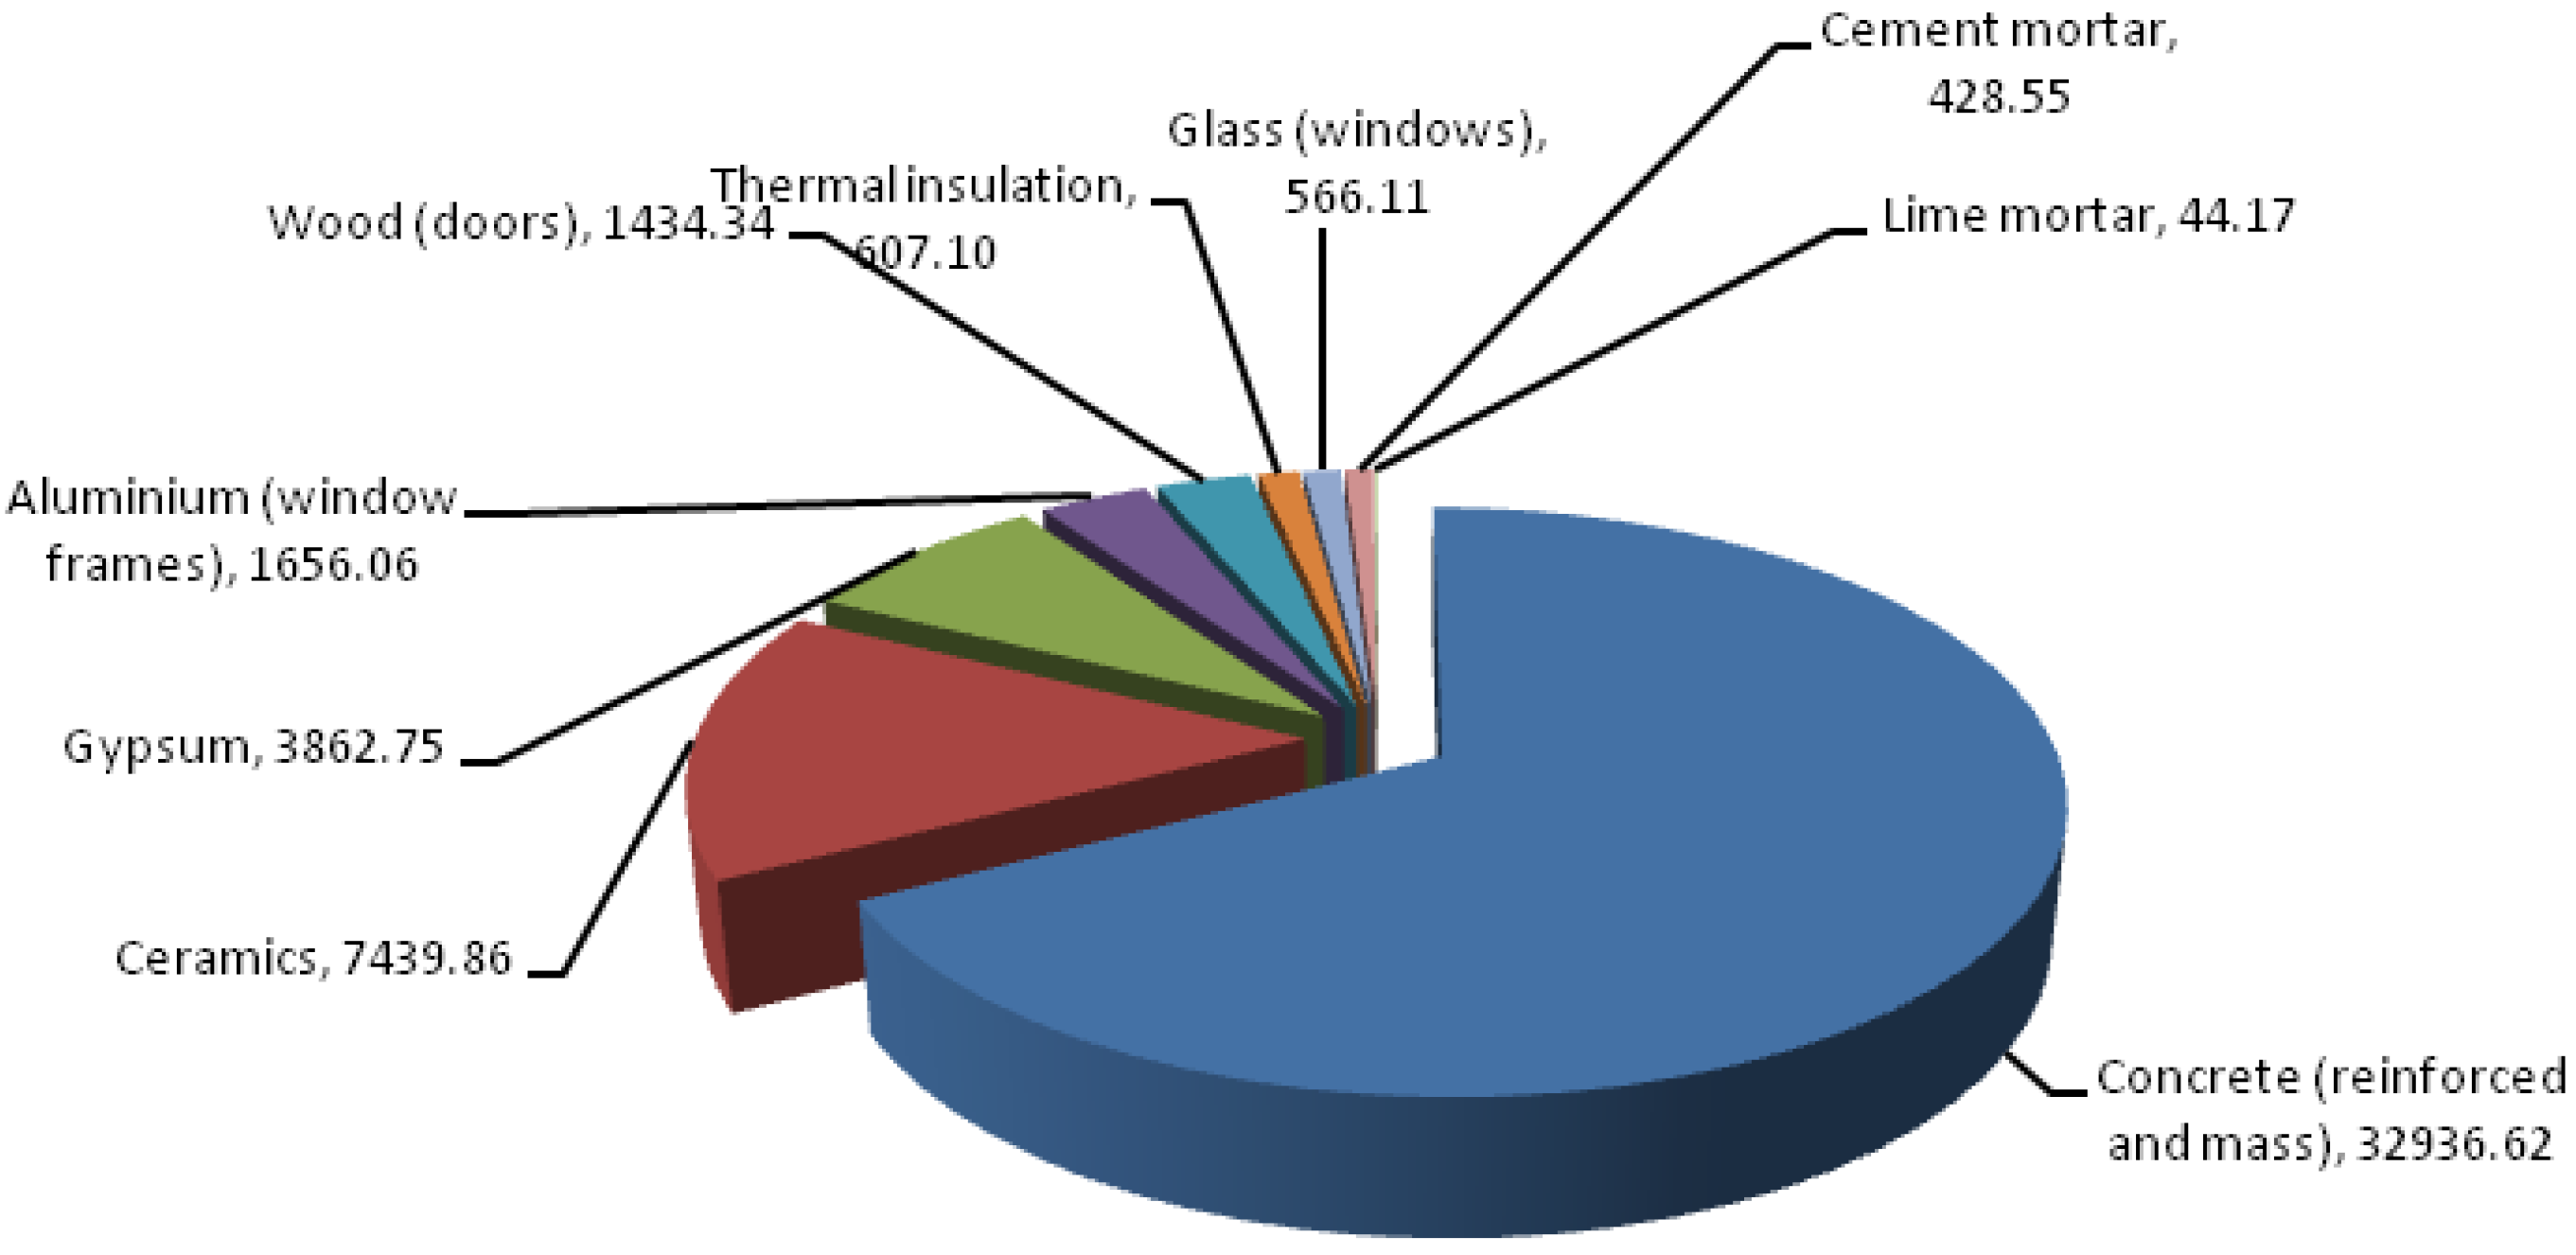
3.1.1. Product Stage

This stage considered the supply of starting materials, the related transport needs and the manufacturing processes of all the materials used for the construction of the building, and of the main energy equipment of the building, including the cold and heat generators, and the equipment for making use of renewable energy, but excluding the storage and distribution equipment (such as tanks or piping). Therefore, it is a cradle to factory gate analysis. The data related to the construction materials was extracted from the building’s architectonic project, while the data on the equipment was taken from its air conditioning project.

3.1.2. Construction Process Stage

This stage evaluated the transport needs, from the factory door to the construction site, related to the construction materials and the energy equipment of the building. In all cases road transport by truck weighing 20–28 t at half load was considered.
Similarly, the energy consumption of the machinery necessary for constructing the building and the waste generated during the construction process including the transport and the final disposal of this waste were included. The impacts of manufacturing the machinery was deemed beyond the limits of the system as it was considered that this will be used in a good number of construction works.
It is estimated that to construct 1 m3 of a building requires 0.8 m3 of earthmoving and a consumption of diesel fuel of 0.104 kg (equivalent to 1.39 kWh), and that to construct, rehabilitate and demolish a building requires an electricity consumption of 0.30 kWh/m3 [33]. It is considered that 75% of this value is comparable to the electricity demand in the construction stage.
The study of waste management of each building has been based on the compliance of Spanish legislation which establishes the obligation to the construction and demolition waste producer to include in the execution project a study of the management of such waste, including the estimation of the quantity, expressed in t and cubic meters, from the construction and demolition waste that will be generated in the work. The amount of construction waste depends on project management, which may vary from one country to another.
The estimate of quantities is carried out with reference to the most common standard ratios on the volume and definition of construction and demolition waste. These ratios have been adjusted and adapted to the characteristics of the works according to automated calculation with the help of the computer programme “Construbit Residuos”, getting the ratios shown in Table 2.
Table 2. Ratios of amounts of construction site waste produced.
Waste typekg/m2 and floorm3/m2 and floor
Packaging containing remains of dangerous substances or contaminated by them0.050.0009
Gas in pressurized containers containing dangerous substances0.020.00008
Concrete0.410.28
Roof tiles and ceramic materials00.00003
Wood2.850.008
Plastics1.070.002
Earth and stones8.50.006
Mixed construction waste10.002
Paper and cardboard0.350.0009

3.1.3. Use Stage

The use of the building includes all the impacts associated with the operation and maintenance of the building throughout its whole useful life. The operation of the building covers the consumption of final energy to meet the demand for heating, cooling, sanitary hot water and interior illumination of the building, the water consumption and the treatment of the wastewater generated. In all cases, in addition to the impact associated with the consumption itself, the impact of the energy (electricity and gas) and water supply infrastructure for the building was evaluated.
The demand and the final energy consumption of the building analysed was calculated using the tools Lider and Calener VYP [34], that incorporate hourly-based dynamic simulation calculations. When assessing the impact associated with the final energy consumption, the production values of renewable origin were deducted from the consumption of the building.
The impact due to the use of water in the building includes the transport (pumping) and treatment (filtering and purification) of the water consumed from its collection to its consumption in the building. To calculate the water consumption of the building the ratios calculated by the City Council of Zaragoza using municipal monitoring studies carried out in various residential buildings were used.
Similarly the impact of treating the wastewater generated in the building was assessed, including the energy consumption corresponding to the treatment plant and the infrastructure necessary to take the water from the building to the outflow site.
Within building maintenance, only the replacement of windows and doors, and of the energy generation equipment, every 25 years was included. The technical cleaning work and repainting of the building’s walls and possible repairs and corrective maintenance operations required throughout its useful life due to the energy systems and building enclosures were deemed beyond the limits of the system as their incidence on the total impact was expected to be lower.
The impact of the maintenance includes the impact associated with the manufacture of the new products and equipment, their transport from the factory to the building and the final disposal of the products and equipment replaced. For simplicity, it was considered that the technical specifications of the new products and equipment would be similar to the original ones.

3.1.4. End-of-Life Stage

Within this stage, the processes of deconstruction, transport and final disposal of all the construction materials and the energy equipment used throughout the service life of the building were considered.
For each material its most probable final disposal scenario is considered—disposal in dumps or incinerators or shipment to classification plants for recycling. It is important to note that currently in Spain more than 80% of the CDW is disposed of in dumps, so direct or partial recycling is clearly a minority.
According to the method established by Ecoinvent, the processes of recycling and external evaluation are beyond the limits of the system analysed. Thus, its positive effects are considered only in the new product created using this waste.

3.2. Case Studies

The LCA calculation methodology under the guidelines developed by ENSLIC was both the source and the result of their application in 30 case studies carried out by all partners in different countries all over Europe.
Each case study followed a different purpose. Each purpose met some specific needs during design or planning phase of the building. The case studies showed how the methodology in the guidelines easily managed to answer various questions at that stage, aiming to improve the sustainability of our buildings. Some analyses intended to highlight the need to quantify the embodied energy in materials, calling into question some well-known energy efficiency standards. Other studies sought to compare buildings with different materials from an LCA point of view. Sometimes the goal was to evaluate some simplifications made regarding the life stages of the building and other times it was to assess the environmental improvement of a building refurbishment beyond comfort. In some cases while deciding on heating facilities, centralized or distributed generation came to be valued and in others regulations required quantification of a reduction in equivalent CO2 emissions in construction.
The next section describes the procedure followed to perform one of the ENSLIC case studies and the main results obtained.

4. Presentation of a Case Study: A Low Energy Building in the Ecocity of Valdespartera, Zaragoza (Spain)

Since 1998 many social housing buildings have been constructed in Spain. Valdespartera is one of these municipal initiatives that tried to meet this social need by planning a new ecocity next to Zaragoza (Spain). This plan was part of a Research & Demonstration Concerto program called Renaissance, which is focused on reducing CO2 emissions by decreasing heating and cooling needs in buildings. This case study widens this scope by calculating the impact of a representative building in the ecocity of Valdespartera from an LCA point of view, intending to clarify how important the different life cycle building stages are in terms of CED and GWP [35,36].
It is a residential block of homes constructed in 2006 and oriented to the south with a total a total surface of 8067 m2 and a useful habitable and air-conditioned surface of 4458 m2. The building is composed of five floors above ground and two basement-garages for underground parking. It consists of 60 homes and a total of 230 occupants. The climate is semi-arid, according to the Köppen climate classification and has 1942 degrees-day according to an 18/18 calculation base.
Based on the results obtained, the relevance of and relationships between each stage considered were analyzed, in order to set up a methodological simplification that excluded from the system the less significant stages and less relevant aspects in each stage.

4.1. Input Data

Table 3 presents the inventory of the materials that make up the structure and the enclosure of the building. Total weight of the building materials is 8360.51 t that makes a material density index of 0.35 t/m3. The concrete-based materials, used mainly for the suspended floors and roofing, make up the majority of the weight with 64% of the total, followed by the lightweight clay blocks used for the walls, which represent 11% of the total weight.
Regarding the energy equipment, the building has gas condensation boilers to provide the heating and hot water. In addition, there are some flat-panel solar thermal collectors that cover 50% of the annual consumption of hot water. Regarding the cooling, there were no active systems to cover this demand, however as the building has a demand for cooling; it was supposed for the purposes of calculation that a fictitious centralized air conditioning unit would be used.
The transport of all the materials and equipment from the factory to the building is made by road and a total transport requirement of 836,305 tkm has been estimated, considering a distance of 100 km for each material.
Table 3. Inventory of materials of the building enclosure and structure.
EnclosureSurface (m2)MaterialVolume (m3)Density (kg/m3)Weight (t)
External wall3272.54Agglomerated cork71.431158.21
Lime mortar10.86112512.22
Ceramic lightweight clay block, thickness: 24 cm621.78920572.04
Plaster32.7390029.45
External wall706.77Single layer coating4.5912505.74
Ceramic lightweight clay block, thickness: 24 cm169.62920156.06
Plaster14.1490012.72
Internal wall6371.50Plaster509.72900458.75
Brick892.01630561.97
Foundation7290Stoneware tile63.182,000126.36
Cement mortar218.701250273.38
Ex-clay floor slab2187.0010902383.83
Plaster145.80900131.22
“Forel” type floor slab583.2019291124.99
Floor1527.21Concrete229.081850423.80
Roof1069Ex-clay roof slab320.701090349.56
Extruded polystyrene insulation53.45382.03
Plaster21.3890019.24
Windows and doorsSurface (m2)MaterialSurface (m2)Density (kg/m2)Weight (t)
Doors806.40Interior wooden door806.4027.6022.26
Windows2019.37Climalit double glazing 5-10-6 (rest of facade)664.2927.5018.27
5 mm single glazing (greenhouses)1153.1412.5014.41
Aluminium frame (10% glazed surface)201.9450.7010.24
Other structural elementsVolume (m3)MaterialConcrete amount (t)Steel amount (t)Weight (t)
Pillars and retaining walls684.9Reinforced concrete1548.1995.571643.76
The energy consumption of the construction work amounts to 38,674 kWh, of which 86% corresponds to diesel fuel consumption, and the remaining 14% is electricity demand. The amount of waste generated in the construction of the building is shown in Table 4.
The demand and the final energy consumption of the building, calculated using the hourly-based simulation tools Lider and Calener VYP, is presented in Table 5.
Table 4. Amounts of construction site waste produced in the building.
Waste typeVolumeUnit
Packaging containing remains of dangerous substances or contaminated by them6.76m3
Gas in pressurized containers containing dangerous substances0.61m3
Concrete1.1m3
Roof tiles and ceramic materials0.25m3
Wood55.04m3
Plastics13.88m3
Earth and stones46.81m3
Mixed construction waste14.25m3
Paper and cardboard6.27m3
Table 5. Energy demand for heating and cooling and final energy consumption of the building (* the ratios are expressed in useful, air conditioned m2).
Type of energykWh/m2 year*MWh/yearMWh/life span
Heating demand12.7--
Cooling demand11.9--
Heating consumption14.6065.103254.78
Cooling consumption7.0031.211560.51
Hot water consumption8.4037.451872.61
Lighting consumption6.2928.061403.22
SUBTOTAL36.29161.828091.12
Thermal solar production-4.20-18.73-936.31
TOTAL32.09143.107154.81
The water consumption, estimated according the existing regulations, was obtained and is shown in Table 6. As all of the water consumed by the building ends up in the drain, and is therefore treated as wastewater, a total volume of water to be treated of 8869.5 m3/year has been also considered.
Table 6. Total water consumption of the building.
No. of homesNo. of occupantsUnitary water consumption (m3/home and day)Total water consumption (m3/year)
5040.417482.5
1030.381387.0
Total8869.5
Within building maintenance, only the replacement of windows, doors and the energy generation equipment every 25 years was included, considering a static LCA approach [37,38]. According to the end-of-life calculations a final disposal scenario is considered obtaining a 72% of the structure and envelope materials to landfill and a 28% to incineration.

4.2. Results and Discussion

As shown in Table 7, the two stages of greater impact are those of use (52%), followed by production (43%). Contrarily, the stages of construction (2.7%) and end-of-life (2.3%) are much less significant. The type of embodied energy is principally of fossil (78%) and nuclear (14%) origin. Renewable energy provides only 8%.
Table 7. Ratios of cumulative primary energy demand and equivalent emissions of CO2 in the different life stages of the building analyzed (* the ratios are expressed in useful, air conditioned m2).
Life cycle stageCumulative primary energy demandGlobal warming potential
GJ-EqkWh-Eq/m2 year *t CO2-Eqkg CO2-Eq/m2 year *
Product stage49,730.9661.973,534.2415.85
Construction process stage3,075.933.83182.790.82
Use stage60,758.6975.713,106.3513.93
End-of-life stage2,726.203.40287.401.29
Total116,291.78144.907,110.7831.90
There is a great variability in the ratios of energy incorporated into the materials of the buildings [39]. Thus, depending on the sources of data used, the limits established and solutions and construction materials used, energy incorporated in materials of residential buildings is located in a range of 3.6 to 8.76 GJ/m2 total built area. Since the embodied energy in the production phase of the building of this case of study is of 5.78 GJ/m2 total built area, it can be concluded that the analyzed building would be approximately in half of the previous range.
Several studies from the life cycle perspective have been made in order to find out the proportion of embodied energy in the materials of construction [40], usually getting a wide range of results depending on climatic conditions and the design of the building. For example, this ratio can vary between 9% and 46% of the total energy demand in the life of the building, in the case of buildings with low energy consumption, considering these buildings located in countries with different climatic conditions. Our case of study is located within this ratio with a 43% of the impact during the production phase. Other studies claim that in conventional buildings, the embodied energy is situated in 10%–20%, while the 80%–90% would correspond to the energy of the use phase, and less than 1% to the embodied energy in the end of life phase [41].
Figure 1 shows the contribution of the most relevant aspects analyzed in the different stages of life of the building to the impact on cumulative primary energy demand. Within the use stage, the impact of the energy consumption for cooling (16%), lighting (15%) and heating (13%) is notable, while in the production stage the impact of manufacturing the reinforced concrete structure (28%) must be highlighted. The high impact of the cooling and lighting, which when analyzed as final energy had a lower weight that the heating, is due to the conversion factors from final energy to primary energy used in the CED method.
Figure 1. Cumulative primary energy demand disaggregated into the different aspects of the building’s life cycle.
Energies 06 03901 g001
Considering the impact of manufacture among the various materials, as shown in Figure 2, the impact of the reinforced concrete structures is predominant, accounting for 50% of the impact.
Figure 2. Cumulative primary energy demand (in GJ-Eq) in the manufacture of the different materials of the building.
Energies 06 03901 g002

4.3. Simplified LCA

The complexity of LCA results is often seen as the main barrier to more frequent use of LCA. Data acquisition is the most importantt problem since buildings contain many different products. Rough estimates of the environmental impacts over the life cycle are still better than to ignore these impacts. Input data should be easy to find in the building project and there should be as little of it as possible. When the aim is to simplify, questions like which data for which life cycle stage is more important than others are important to tackle.
In this section the entire life cycle analysis of the case of study is simplified. According to the results of several LCA studies in the case of standard buildings, some simplifications in the building description could be proposed:
  • Leaving the construction and end-of-life stages out of the system boundaries. The contribution of these stages reaches usually 10%–15% of the total energy impact of the building. However if other indicators are selected for the assessment, these stages should be included;
  • Limiting the aspects included in the building production stage to the construction of the structure and enclosure. The impact of the production of energy systems is usually much lower than the total building impact;
  • Limiting the aspects included in the building use stage to the final energy consumption for the building operation. However in some cases building maintenance, repair, replacement and refurbishment processes may involve a high impact.
Even in the case of standard buildings, materials play an important role regarding impacts like waste and toxicity. But in the case of low energy consumption buildings, the statements above are no longer valid : the fabrication of building elements may contribute to around 30% or even more in the total life cycle energy balance [42,43]. The emissions from heating of buildings is important but the emissions of CO2 from heating is lower than from other parts of the building sector, indicating the importance of emissions from for example production of building materials [44].
In any case, simplifications will strongly depend on the purpose of the LCA study. Therefore it is difficult to propose general LCA simplifications for buildings. The following Figure 3 and Figure 4 show the life cycle impacts obtained from the above considerations versus the results obtained for the whole LCA.
Figure 3. Comparison of the embodied energy impact (in equivalent terajoules: TJ-Eq) in the building analyzed using the complete LCA and the simplified LCA.
Energies 06 03901 g003
Figure 4. Comparison of the global warming potential impact (in equivalent t of CO2: tCO2-Eq) in the building analyzed using the complete LCA and the simplified LCA.
Energies 06 03901 g004
From the above figures we can see how the error of the simplified analysis can be acceptable for the analyzed residential building as there is just a 13% difference. The proposed simplification reduces the data and calculations, also reducing the time required to carry out the study, which is essential in order to achieve universality in the use of the LCA between the key players in the construction sector. However the generalization of this simplification proposal to other buildings would require a greater number of studies (including different types and sizes of buildings) to draw relevant conclusions.

4.4. Evaluation of Improvements

4.4.1. Envelope: Increased Insulation

The thickness of the insulating material used for the roof (expanded polystyrene—EPS) and for the external walls (agglomerated cork) will be increased in 10 cm., reducing the energy demand of the building.
Table 8 and Figure 5 show the comparison between the original building and the increased insulation improvement according to the total primary energy demand during the whole life cycle. Since the percentage by weight of the insulation is lower than other materials of the building, it only produces a 4.7% increase during the production stage but a 10.1% reduction during the use stage. There are no changes during the construction and end-of-life stages.
Table 8. Numerical comparison of the cumulative primary energy demand (in kWh-Eq/m2year *) in the building analyzed according to the increased insulation improvement.
Life cycle stageCumulative Primary Energy Demand (kWh-Eq/ m2 year *)
OriginalIncreased insulation
Product stage61.9764.88
Construction process stage3.833.84
Use stage75.7168.06
End-of-life stage3.403.40
Figure 5. Graphical comparison of the cumulative primary energy demand (in kWh-Eq/m2year *) in the building analyzed according to the increased insulation improvement.
Energies 06 03901 g005

4.4.2. Envelope: PVC Frames

There is the possibility for the glazing to replace the aluminium carpentry of the current building with PVC. This replacement shows a significant reduction in the heating demand and a slight worsening of cooling demand.
In this case, the GWP indicator has been considered for the analysis. Table 9 and Figure 6 show the comparison between the original building and the PVC frames improvement according to the GWP impact during the whole life cycle. The PVC frames produce a 1.27% reduction during the production stage and a 7.56% reduction during the use stage. There are no changes during the construction stage and the end-of-life stage is a 12.83% higher, because of the type of final disposal associated with this material.
Table 9. Numerical comparison of the global warming potential impact (in kg CO2-Eq/m2year) in the building analyzed according to the PVC frames improvement.
Life cycle stageGlobal Warming Potential (kg CO2-Eq/m2 year *)
OriginalPVC frames
Product stage15.8515.65
Construction process stage0.820.82
Use stage13.9312.95
End-of-life stage1.291.48
Figure 6. Graphical comparison of the global warming potential impact (in kg CO2-Eq/m2year) in the building analyzed according to the PVC frames improvement.
Energies 06 03901 g006

4.4.3. Renewable Energies: Biomass Boiler

The gas condensation boilers are replaced by biomass boilers producing slightly lower heating final energy consumption. CO2 emissions associated with a biomass boiler are considered null, so this cancels the heating emissions and DHW are removed.
Conversion factors obtained considering the efficiency of the entire energy supply chain and infrastructure (from the cradle to the grave) using the Ecoinvent data v2.0 for biomass are:
  • Final energy to CO2 emissions conversion factor: 50.09 g CO2/kWh;
  • Final energy to primary energy conversion factor: 1.57 kWh/kWh.
At the domestic level, heating and DHW biomass boilers are a minority in a market in which systems that use fossil fuels are still dominant. Designers’ and users’ resistance to technological changes as well as its price and fuel supply problems, are the main reasons for that. Currently, users can benefit from subsidies to invest in domestic thermal production from biomass facilities, so it is expected that the market will grow in the very near future.
For full incorporation, it is essential that the market guarantee users a supply of biomass with the same conditions of price, service and quality than for commonly used conventional fuels. The few companies that are dedicated to biomass logistics, are almost always old coal distribution companies, which have derived part of their business to biomass, but they occasionally have had to export part of their production (with the resulting environmental impact) because there is insufficient domestic demand. One of the options for the supply of fuel to domestic boilers is the manufacture and marketing of biomass densified in the form of pellets. However, an adequate economy of scale must be achieved that it will help to reduce the current high price of pellets in Spain.
Table 10 and Figure 7 show the comparison between the original building and the biomass boilers improvement according to the total primary energy demand during the whole life cycle. The biomass boilers produce a 0.43% reduction during the production stage and a 15.63% increase during the use stage due to the lower performance of this type of boilers. There are no changes during the construction and end-of-life stages.
Table 10. Numerical comparison of the cumulative primary energy demand (in kWh-Eq/m2year *) in the building analyzed according to the biomass boiler improvement.
Life cycle stageCumulative Primary Energy Demand (kWh-Eq/m2 year *)
OriginalBiomass boiler
Product stage61.9761.70
Construction process stage3.833.83
Use stage75.7189.70
End-of-life stage3.403.40
Figure 7. Comparison of the cumulative primary energy demand (in kWh-Eq/m2year *) in the building analyzed according to the biomass boilers improvements.
Energies 06 03901 g007
Table 11 and Figure 8 shows the comparison between the original building and the biomass boilers improvement according to the global warming potential impact during the whole life cycle. The biomass boilers produce a 0.12% reduction during the production stage and a 44.95% reduction during the use stage due to the low factors to pass final energy to CO2 emissions applied. There are no changes during the construction and the end-of-life stages.
Table 11. Numerical comparison of the global warming potential impact (in kg CO2-Eq/m2year) in the building analyzed according to the biomass boiler improvement.
Life cycle stageGlobal Warming Potential (kg CO2-Eq/m2 year *)
OriginalBiomass boiler
Product stage15.8515.83
Construction process stage0.820.82
Use stage13.939.61
End-of-life stage1.291.29
Figure 8. Graphical comparison of the global warming potential impact (in kg CO2-Eq/m2year) in the building analyzed according to the different improvements.
Energies 06 03901 g008
If we replace condensing boilers with biomass boilers, despite the increase in the final energy consumption for heating and hot water, the CO2 emissions decrease. Usually the obtained differences with the improvements applied do not show major changes since the case study presented in this paper is in fact a low energy consumption building.

5. Conclusions

ENSLIC has definitively provided a horizontal simplified methodology that can provide construction players with a practical and effective instrument for building and planning with the best environmental standards and a comprehensive long term energy strategy, promoting construction techniques and processes based on products with a lower energy consumption and environmental impact, and the use of high-efficiency energy equipment and the integration of renewable systems in buildings.
In the case study, the impact assessment is based primarily on indicators of energy consumption and GHG emissions in line with the current environmental problems.
However, the proposed methodology allows other environmental or financial indicators to be considered, always from a life cycle perspective. Through case studies, construction players are able to increase their knowledge on the energy and environmental specifications of different materials and building solutions.
This way they have all the necessary information in their hands to be able to consider energy and environmental impacts when selecting materials, suppliers and more eco-efficient production processes.
To achieve an adequate level of thermal comfort, the architectural design must be the linchpin, above of the efficiency of active energy equipment and systems. Therefore, before thinking about reducing the energy consumption of the equipment, it must be considered to reduce the thermal demand (heating and cooling) of the building that will have to be later covered by such equipment, below even of the limits established by the regulations in force.

Nomenclature:

CED
Cumulative Energy Demand
GWP
Global Warming Potential
LCA
Life Cycle Assessment
tkm
Ton per kilometer
CDW
Construction/Demolition Waste

Acknowledgments

This paper is based on results obtained in the framework of the ENERGY SAVING THROUGH PROMOTION OF LIFE CYCLE ANALYSIS IN BUILDING (ENSLIC) Building Project. This project was co-financed by the European Commission (Intelligent Energy Programme Contract EIE/07/090/SI2.467609) and coordinated by the CIRCE Foundation. We would like to thank everyone participating in this project: ARMINES (FR), CALCON Holding GmbH (DE), IFZ-Inter-University Research Centre for Technology, Work and Culture (AT), EMI Non-profit Company for Quality Control and Innovation in Building (HU), SEC-Sofia Energy Centre (BG), SINTEF (NO), and ECOFYS BV (NL).

Conflict of Interest

The authors declare no conflict of interest.

References

  1. Huberman, N.; Pearlmutter, D. A life-cycle energy analysis of building materials in the Negev desert. Energy Build. 2008, 40, 837–848. [Google Scholar] [CrossRef]
  2. Basbagill, J.; Flager, F.; Lepech, M.; Fischer, M. Application of life-cycle assessment to early stage building design for reduced embodied environmental impacts. Build. Environ. 2013, 60, 81–92. [Google Scholar] [CrossRef]
  3. Hestnes, A.G.; Sartori, I. Energy use in the life cycle of conventional and low energy buildings: A review article. Energy Build. 2007, 39, 249–257. [Google Scholar] [CrossRef]
  4. Pisello, A.; Bobker, M.; Cotana, F. A building energy efficiency optimization method by evaluating the effective thermal zones occupancy. Energies 2012, 5, 5257–5278. [Google Scholar] [CrossRef]
  5. Thiel, C.; Campion, N.; Landis, A.; Jones, A.; Schaefer, L.; Bilec, M. A materials life cycle assessment of a net-zero energy building. Energies 2013, 6, 1125–1141. [Google Scholar] [CrossRef]
  6. Porhinčák, M.; Eštoková, A. Environmental analysis of building materials of homes in slovak republic—A case study. Int. J. Hous. Sci. Appl. 2013, 37, 111–120. [Google Scholar]
  7. Danatzko, J.M.; Sezen, H.; Chen, Q. Sustainable design and energy consumption analysis for structural components. J. Green Build. 2013, 8, 120–135. [Google Scholar] [CrossRef]
  8. Cho, Y.S.; Kim, J.H.; Hong, S.U.; Kim, Y. LCA application in the optimum design of high rise steel structures. Renew. Sustain. Energy Rev. 2012, 16, 3146–3153. [Google Scholar] [CrossRef]
  9. Čuláková, M.; Vilčeková, S.; Kridlová Burdová, E.; Katunská, J. Reduction of carbon footprint of building structures. Chem. Eng. Trans. 2012, 29, 199–204. [Google Scholar]
  10. Peuportier, B.; Thiers, S.; Guiavarch, A. Eco-design of buildings using thermal simulation and life cycle assessment. J. Clean. Prod. 2013, 39, 73–78. [Google Scholar] [CrossRef]
  11. Langdon, D. Life Cycle Costing (LCC) as a Contribution to Sustainable Construction, Guidance on the Use of the LCC Methodology and its Application in Public Procurement; Eurpean Commission: Brussels, Belgium, 2007; pp. 1–60. [Google Scholar]
  12. Sterner, E. Life-cycle costing and its use in the Swedish building sector. Build. Res. Inf. 2000, 28, 378–393. [Google Scholar] [CrossRef]
  13. Aranda-Usón, A.; Ferreira, G.; López-Sabirón, A.M.; Mainar-Toledo, M.D.; Zabalza Bribián, I. Phase change material applications in buildings: An environmental assessment for some Spanish climate severities. Sci. Total Environ. 2013, 444, 16–25. [Google Scholar] [CrossRef] [PubMed]
  14. Castell, A.; Menoufi, K.; de Gracia, A.; Rincón, L.; Boer, D.; Cabeza, L.F. Life Cycle Assessment of alveolar brick construction system incorporating phase change materials (PCMs). Appl. Energy 2013, 101, 600–608. [Google Scholar] [CrossRef]
  15. Thormark, C. A low energy building in a life cycle—Its embodied energy, energy need for operation and recycling potential. Build. Environ. 2002, 37, 429–435. [Google Scholar] [CrossRef]
  16. Blengini, G.A. Life cycle of buildings, demolition and recycling potential: A case study in Turin, Italy. Build. Environ. 2009, 44, 319–330. [Google Scholar] [CrossRef]
  17. Chen, T.Y.; Burnett, J.; Chau, C.K. Analysis of embodied energy use in the residential building of Hong Kong. Energy 2001, 26, 323–340. [Google Scholar] [CrossRef]
  18. Rincón, L.; Pérez, G.; Cabeza, L.F. Service life of the dwelling stock in Spain. Int. J. Life Cycle Assess. 2013, 18, 919–925. [Google Scholar] [CrossRef]
  19. Densley Tingley, D.; Davison, B. Developing an LCA methodology to account for the environmental benefits of design for deconstruction. Build. Environ. 2012, 57, 387–395. [Google Scholar] [CrossRef]
  20. Martínez, E.; Nuñez, Y.; Sobaberas, E. End of life of buildings: Three alternatives, two scenarios. A case study. Int. J. Life Cycle Assess. 2013, 18, 1082–1088. [Google Scholar] [CrossRef]
  21. Zabalza Bribián, I.; Aranda Usón, A.; Scarpellini, S. Life cycle assessment in buildings: State-of-the-art and simplified LCA methodology as a complement for building certification. Build. Environ. 2009, 44, 2510–2520. [Google Scholar] [CrossRef]
  22. Adalberth, K. Energy use during the life cycle of buildings: A method. Build. Environ. 1997, 32, 317–320. [Google Scholar] [CrossRef]
  23. Adalberth, K. Energy use during the life cycle of buildings: Examples. Build. Environ. 1997, 32, 321–329. [Google Scholar] [CrossRef]
  24. Kellenberger, D.; Althaus, H.J. Relevance of simplifications in LCA of building components. Build. Environ. 2009, 44, 818–825. [Google Scholar] [CrossRef]
  25. Zabalza, I.; Aranda, A.; Scarpellini, S. Life cycle assessment in buildings: State-of-the-art and simplified LCA methodology as a complement for building certification. Build. Environ. 2009, 44, 818–825. [Google Scholar] [CrossRef]
  26. Malmqvist, T.; Glaumann, M.; Scarpellini, S.; Zabalza, I.; Aranda, A.; Llera, E. Life cycle assessment in buildings: The ENSLIC simplified method and guidelines. Energy 2011, 4, 1900–1907. [Google Scholar] [CrossRef]
  27. AENOR. Sustainability of Construction Works—Assessment of Buildings—Part 2: Framework for the Assessment of Environmental Performance; Vol. UNE-EN 15643–2:2011; CEN-CENELEC Management Centre: Brussels, Belgium, 2011. [Google Scholar]
  28. Frischknecht, R.; Jungbluth, N.; Althaus, H.J.; Doka, G.; Dones, R.; Heck, T.; Hellweg, S.; Hischier, R.; Nemecek, T.; Rebitzer, G.; et al. The ecoinvent database: Overview and methodological framework. Int. J. Life Cycle Assess. 2005, 10, 3–9. [Google Scholar] [CrossRef]
  29. Frischknecht, R.; Rebitzer, G. The ecoinvent database system: A comprehensive web-based LCA database. J. Clean. Prod. 2005, 13, 1337–1343. [Google Scholar] [CrossRef]
  30. Pimentel, D.; Hurd, L.E.; Bellotti, A.C.; Forster, M.J.; Oka, I.N.; Sholes, O.D.; Whitman, R.J. Food Production and the Energy Crisis. Science 1973, 182, 443–449. [Google Scholar] [CrossRef] [PubMed]
  31. Life cycle assessment—An operational guide to the ISO Standards; Guinée, J.B.; Gorrée, M.; Heijungs, R.; Huppes, G.; Kleijn, R.; de Koning, A.; van Oers, L.; Sleeswijk, G.H.; Suh, S.; Haes, H.; et al. (Eds.) Ministry of Housing: Den Haag, The Netherlands, 2001.
  32. Forster, P.; Ramaswamy, V.; Artaxo, P.; Berntsen, T.; Betts, R.; Fahey, D.W.; et al. Climate Change 2007—the Physical Science Basis. Contribution of Working Group I to the Fourth Assessment Report of the IPCC; Susan, S., Qin, D., Manning, M., Chen, Z., Marquis, M., Averyt, K.B., Tignor, M., Miller, H.L., Eds.; Cambridge University Press: Cambridge, UK, 2007. [Google Scholar]
  33. Kellenberger, D.; Althaus, H.J.; Jungbluth, N.; Künniger, T.; Lehmann, M.; Thalmann, P. Life Cycle Inventories of Building Products. Final report ecoinvent Data v2.0; EMPA Dübendorf, Swiss Centre for Life Cycle Inventories: Dübendorf, Switzerland, 2007. [Google Scholar]
  34. Pérez-Lombard, L.; Ortiz, J.; González, R.; Maestre, I.R. A review of benchmarking, rating and labeling concepts within the framework of building energy certification schemes. Energy Build. 2009, 41, 272–278. [Google Scholar] [CrossRef]
  35. Monteiro, H.; Freire, F. Life-cycle assessment of a house with alternative exterior walls: Comparison of three impact assessment methods. Energy Build. 2012, 47, 572–583. [Google Scholar] [CrossRef]
  36. Stazi, F.; Mastrucci, A.; Munafò, P. Life cycle assessment approach for the optimization of sustainable building envelopes: An application on solar wall systems. Build. Environ. 2012, 58, 278–288. [Google Scholar] [CrossRef]
  37. Reap, J.; Bras, B.; Newcomb, P.J.; Carmichael, C. Improving Life Cycle Assessment by including Spatial, Dynamic and Place-Based Modeling. In Proceedings of DETCí03 ASME 2003 Design Engineering Technical Conferences and Computers and Information in Engineering Conference, Chicago, IL, USA, 2–6 September 2003; pp. 77–83.
  38. Collinge, W.O.; Landis, A.E.; Jones, A.K.; Schaefer, L.A.; Bilec, M.M. Dynamic life cycle assessment: Framework and application to an institutional building. Int. J. Life Cycle Assess. 2012, 18, 538–552. [Google Scholar] [CrossRef]
  39. Dixit, M.K.; Fernández Solís, J.L.; Lavy, S.; Culp, C.H. Identification of parameters for embodied energy measurement: A literature review. Energy Build. 2010, 42, 1238–1247. [Google Scholar] [CrossRef]
  40. Yohanis, Y.G.; Norton, B. Life-cycle operational and embodied energy for a generic single-storey office building in the UK. Energy 2002, 27, 77–92. [Google Scholar] [CrossRef]
  41. Kotaji, S.; Edwards, S.; Schuurmans, A. Life Cycle Assessment in Building and Construction. A State-of-the-Art Report; SETAC Press: Brussels, Belgium, 2003. [Google Scholar]
  42. Nässén, J.; Holmberg, J.; Wadeskog, A.; Nyman, M. Direct and indirect energy use and carbon emissions in the production phase of buildings: An input-output analysis. Energy 2007, 32, 1593–1602. [Google Scholar] [CrossRef]
  43. Wallhagen, M.; Glaumann, M.; Malmqvist, T. Basic building life cycle calculations to decrease contributions to climate change—Case study on an office building in Sweden. Build. Environ. 2011, 46, 1863–1871. [Google Scholar] [CrossRef]
  44. Toller, S.; Wadeskog, A.; Finnveden, G.; Malmqvist, T.; Carlsson, A. Energy use and environmental impacts of the Swedish building and real estate management sectors. J. Ind. Ecol. 2011, 15, 394–404. [Google Scholar] [CrossRef]

