2. Background
Unlike the wind energy industry, the wave energy industry is still at the development and prototyping stage. Many different technologies are under investigation [
3], with a recent count showing over a thousand patents held in the area of wave energy conversion [
4]. Different solutions may suit different locations and wave regimes [
5]. Wave energy conversion devices can be classified according to a number of criteria, including the operating principle, the directional characteristics and the location of the device relative to the shore. Following the first of these conventions, they can be considered either oscillating body devices, overtopping devices or, such as the device under consideration herein, oscillating water column (OWC) devices [
6]. The OWC is one of the most established technologies in the field and one of the few where grid-connected examples exist, such as the LIMPET[
7], the Mutriku breakwater [
8] and the installation on Pico Island [
9]. In its simplest form (see
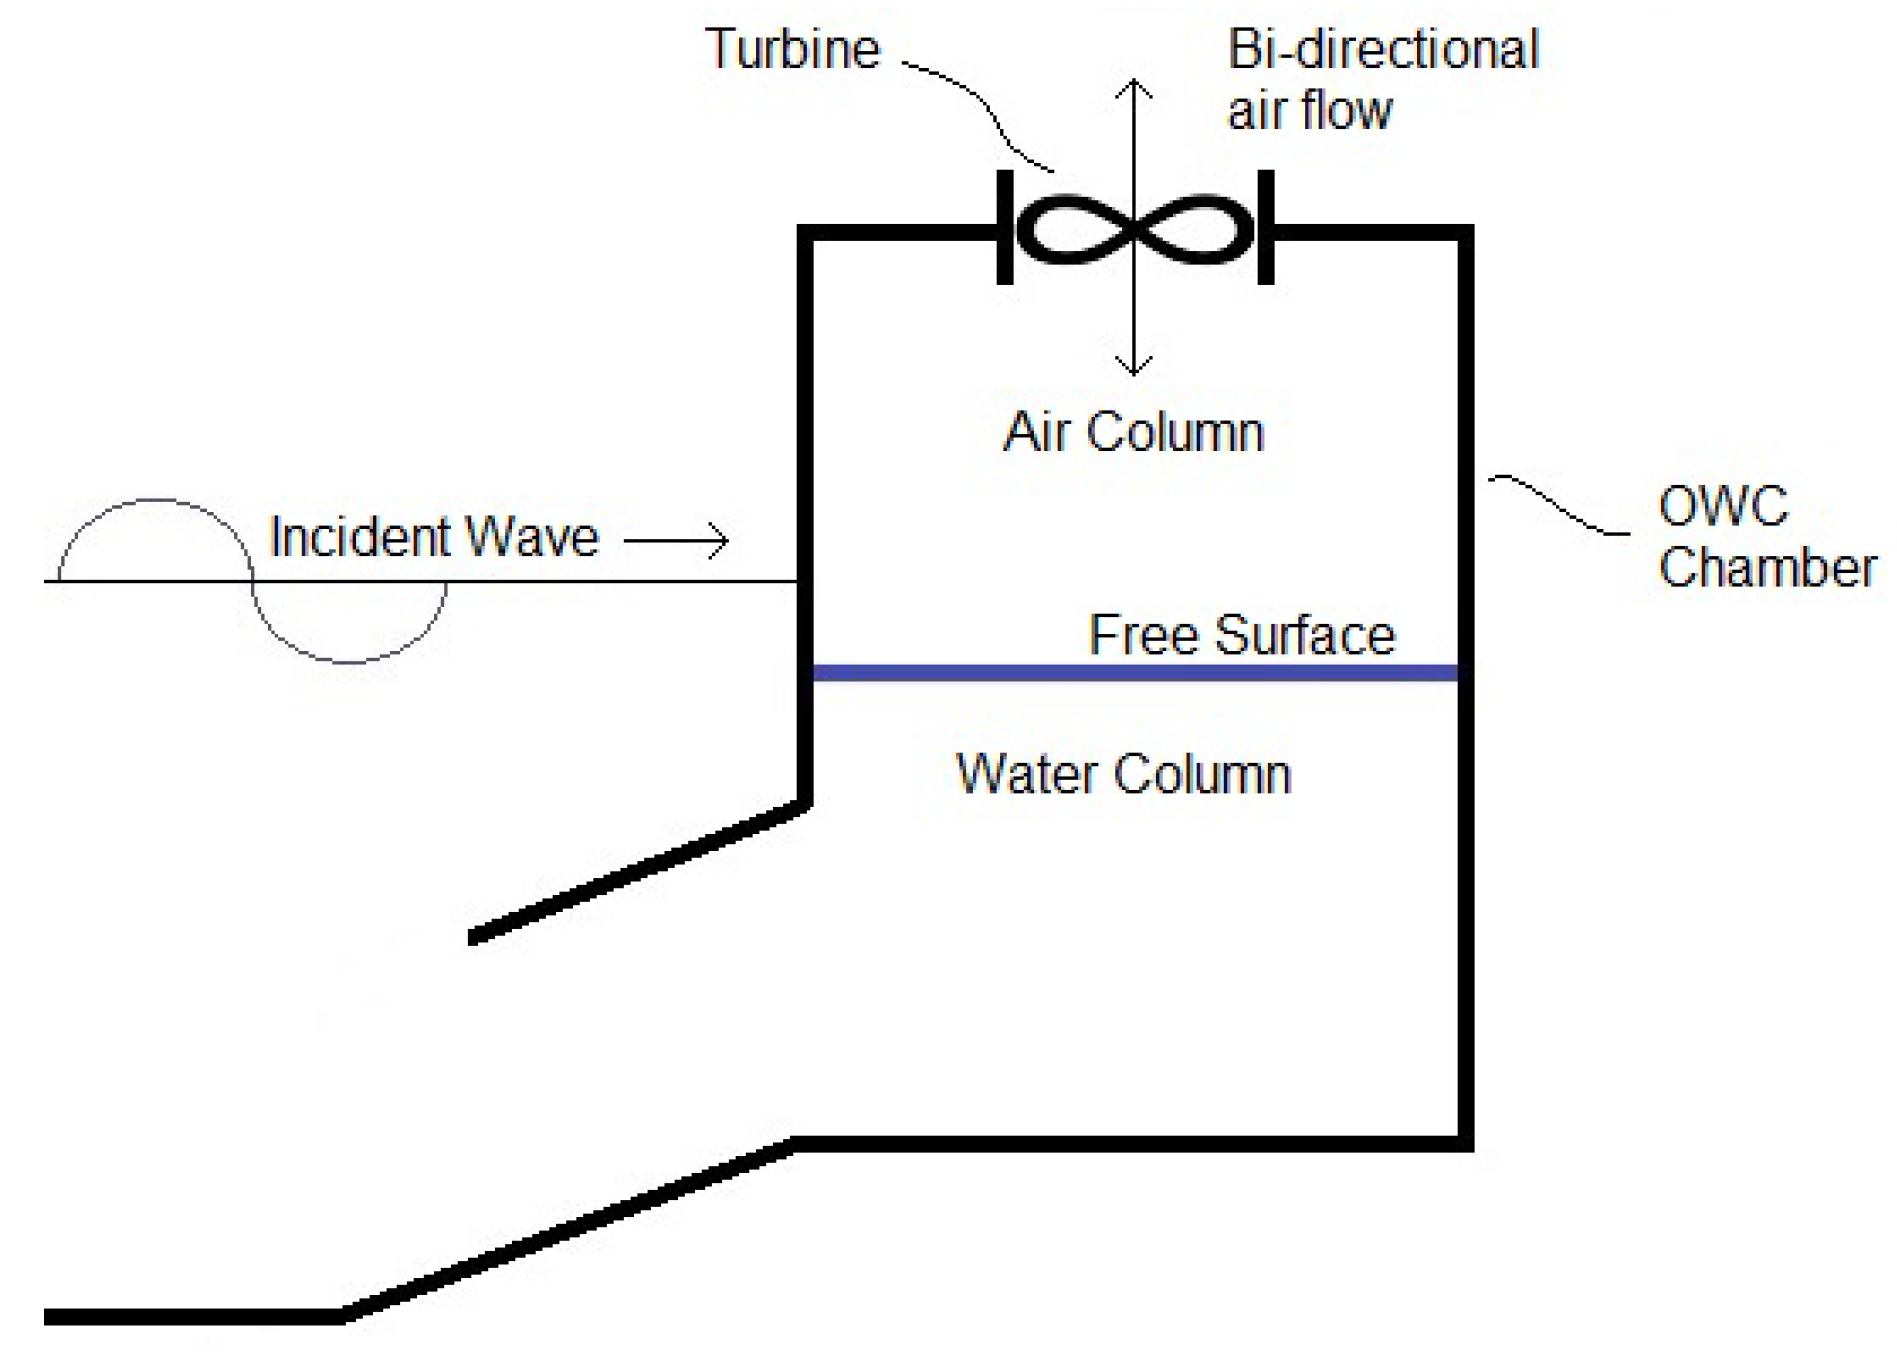
Figure 1), an OWC comprises a chamber with an opening below the minimum level of the sea. As a wave propagates across this opening, the column of water within the chamber rises and falls, which, in turn, pressurises and de-pressurises the air above the water. A turbine is located above the water column, and the air flow resulting from the pressure difference between the ambient air and that within the chamber is used to drive the turbine. In this form, the air flow across the turbine is bi-directional. Traditional turbines are designed to operate in a uni-directional flow regime. Such turbines may be used with an OWC if the air flow is rectified. Alternatively, a range of bi-directional turbines exits, such as the Wells Turbines [
10], the impulse turbine, which may be used with or without movable guide vanes [
11], and the Sevonius turbine, which can offer a low cost alternative for low-energy sites [
12]. One interesting development is the use of two uni-directional impulse turbines in the absence of rectifying valves [
13]. A review of the current state of bi-directional turbine technology for use in this field can be found in [
14]. A simple OWC is illustrated in
Figure 1.
Figure 1.
Schematic of a simple oscillating water column (OWC).
Figure 1.
Schematic of a simple oscillating water column (OWC).
OWC devices may be located either onshore, such as the LIMPET and the Pico, or offshore and seabed mounted, such as some of the technology under development by Oceanlinx [
15], or offshore and floating, as in the Japanese device, the “Mighty Whale” [
16]. An OWC installation may consist of one or more chambers, each chamber with its own generator, or multiple chambers may operate together to drive a single generator. This operation may be achieved by mechanically cascading turbines on a common drive train to a single generator, such as [
17,
18]. Another method is through the manifolding of the pneumatic pressure generated in a number of chambers, such as the onshore device discussed in [
19]. From the perspective of power extraction, the primary advantage of multiple chambers operating in tandem over a single large chamber is that, as each water column oscillates out of phase with the others, the overall delivery of power is smoothed. Further, it is probable that structural engineering issues may be avoided using multi-chamber construction. An interesting overtopping device, which shares many of the structural concerns of an OWC device, is discussed in [
20].
3. Proposed Platform
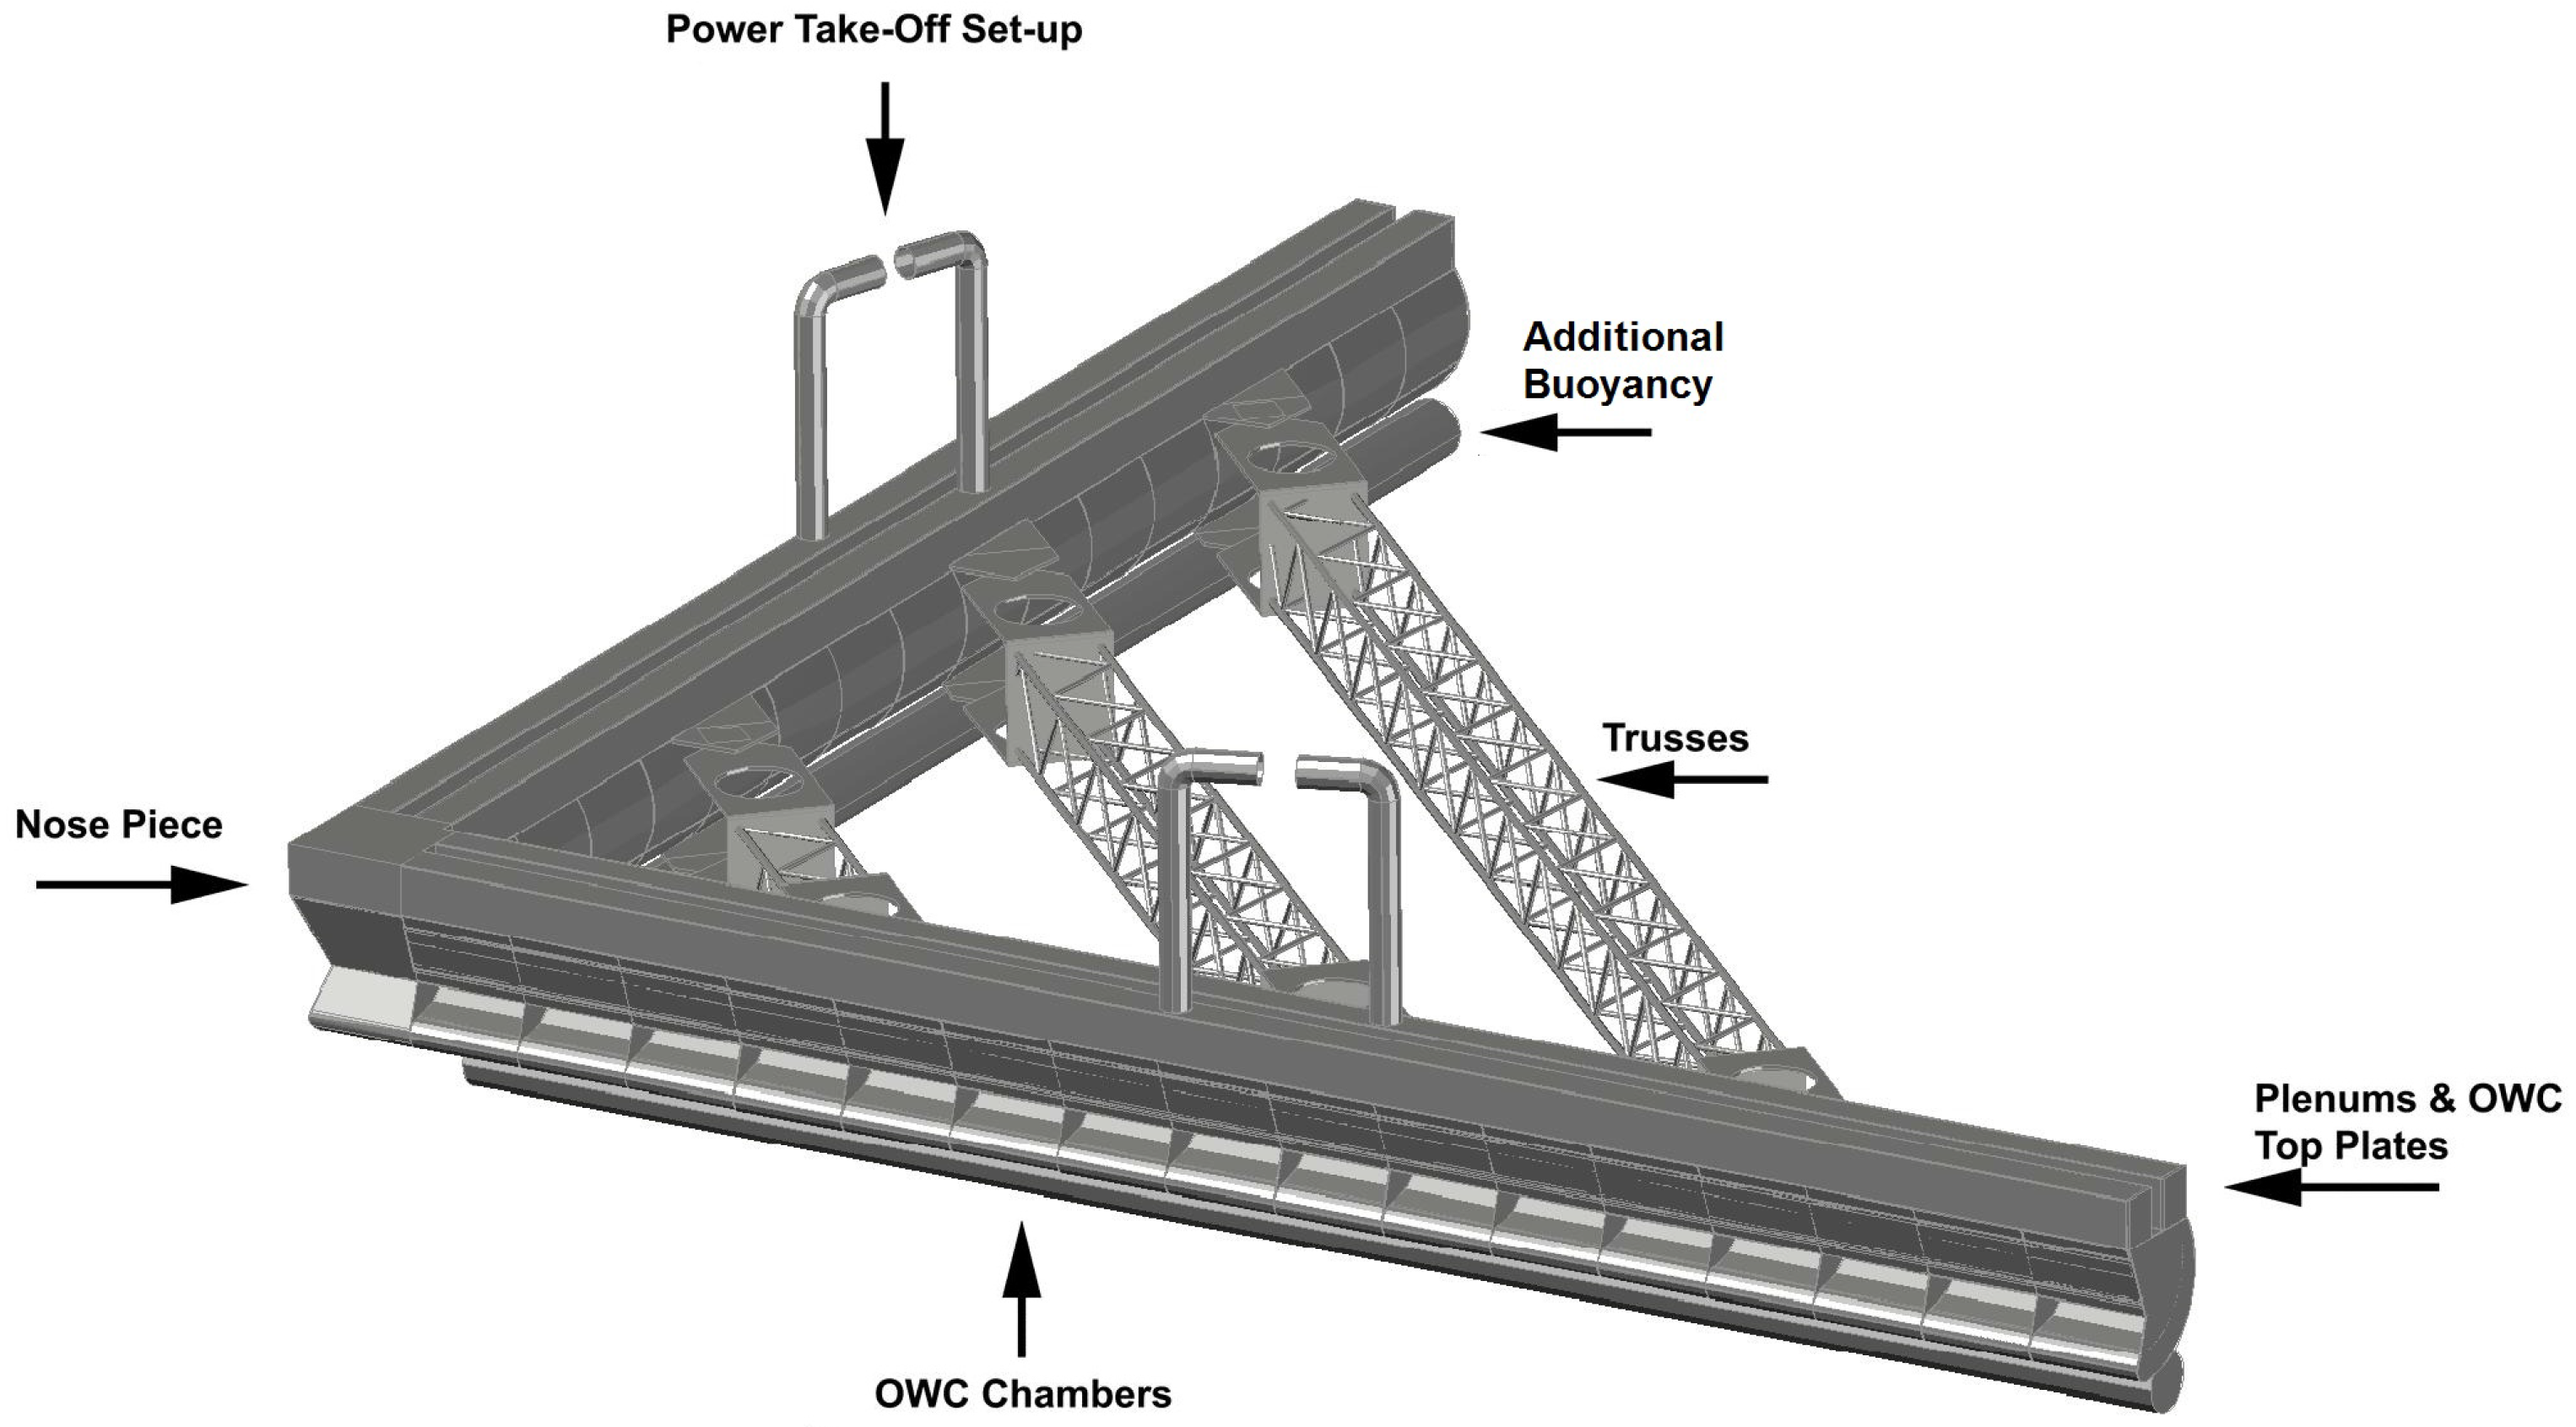
The proposed device consists of a large floating platform comprising two legs joined at a 90-degree angle in a V-configuration. Due to intellectual property concerns at this time, the authors are unable to include an illustration of the full-scale device. However, to illustrate the concept,
Figure 2 illustrates the three-dimensional AutoCAD drawing used during the modelling process. This concept shares some operational characteristics with the onshore device [
19], and the overall footprint bears similarities to [
21], although the proposed mooring arrangement is quite different. A single point floating production storage and offloading unit (FPSO)-style mooring located at the nose of the platform would allow it to weather vane into the direction of the incident waves.
Figure 2.
Accurate three-dimensional AutoCAD drawing of the scale model.
Figure 2.
Accurate three-dimensional AutoCAD drawing of the scale model.
The wave energy component is based on a development of the OWC concept. Cross trusses between the two legs of the platform provide the necessary structural strength to enable the platform to survive sea conditions, and the platform has been designed in accordance with the relevant Det Norske Veritas (DNV) codes [
22,
23,
24,
25]. A single, large, offshore horizontal axis wind turbine is to be located at the nose of the platform, ensuring that the turning moments acting on the platform due to the reaction of the wind force on the turbine will be minimised. This will eliminate the danger of such moments turning the platform beam-on to the incident waves when the wind and wave headings are not identical.
Both legs of the platform incorporate a number of chambers with side openings (located on the outside of the platform) to allow ingress of seawater to create a column of water within the chambers. For all wave conditions, these openings remain below the water level. The chambers convert the energy stored in the motion of the incident waves into pneumatic energy, which can be converted into electric energy using an air-driven turbine. The current concept envisages sixteen chambers in each leg, the size of each chamber being equal and determined based on the typical North Atlantic wave regime and the hydrodynamic characteristics of the resulting water column.
Both high- and low-pressure plenums run along the length of each leg of the platform, with each water column chamber connected to the two plenums on the corresponding leg via air flow conduits. Passive air admittance valves allow for air to flow in one direction only between the chambers and the plenums. The high-pressure plenum collects air that is generated by the upward movement of the water column in a chamber. Air will only flow into this plenum from a chamber if the air pressure within the chamber is greater than that within the plenum. Air from the low-pressure plenum will flow into a chamber, due to the downward motion of the water column in the chamber, if the pressure within the chamber is lower than that within the plenum. Should the pressure within a chamber at any time be less than that within the high-pressure plenum while also being greater than that within the low-pressure plenum, no flow of air between the chamber and the plenums will take place. This will result in the height of the water column remaining virtually locked, though some movement will take place, due to the compressibility of the air within the chamber, effecting a “latching”, which can align the phase of the exciting force due to the incident wave and the phase of the velocity of the water column motion. This passive latching is based on a force threshold method, the theory of which is discussed in [
26,
27]. Air flows between the high-pressure and low-pressure plenums through a pneumatic turbine, where the chambers and plenums of each leg form a closed system. The Leancon device [
28] shares similarities with our device, since it comprises a floating platform with integrated OWCs. The OWCs in the Leancon device are formed from a number of downward-facing pipes, which are in communication with suction and pressure channels. However, unlike our device, which shares some traits of a terminating device, the Leancon device is designed to allow excess wave energy to pass through the downward-facing pipes.
4. Scale Model
A 1:50 scale model of the proposed platform was constructed, focussing on the wave energy converting aspects of the platform, and it ignores the FPSO mooring arrangement and wind turbine mass. The operation of the OWCs, valves and plenums is identical to that described for the proposed (full-scale) platform in
Section 3, except that the power take-off (PTO) arrangement is simulated using Venturis.
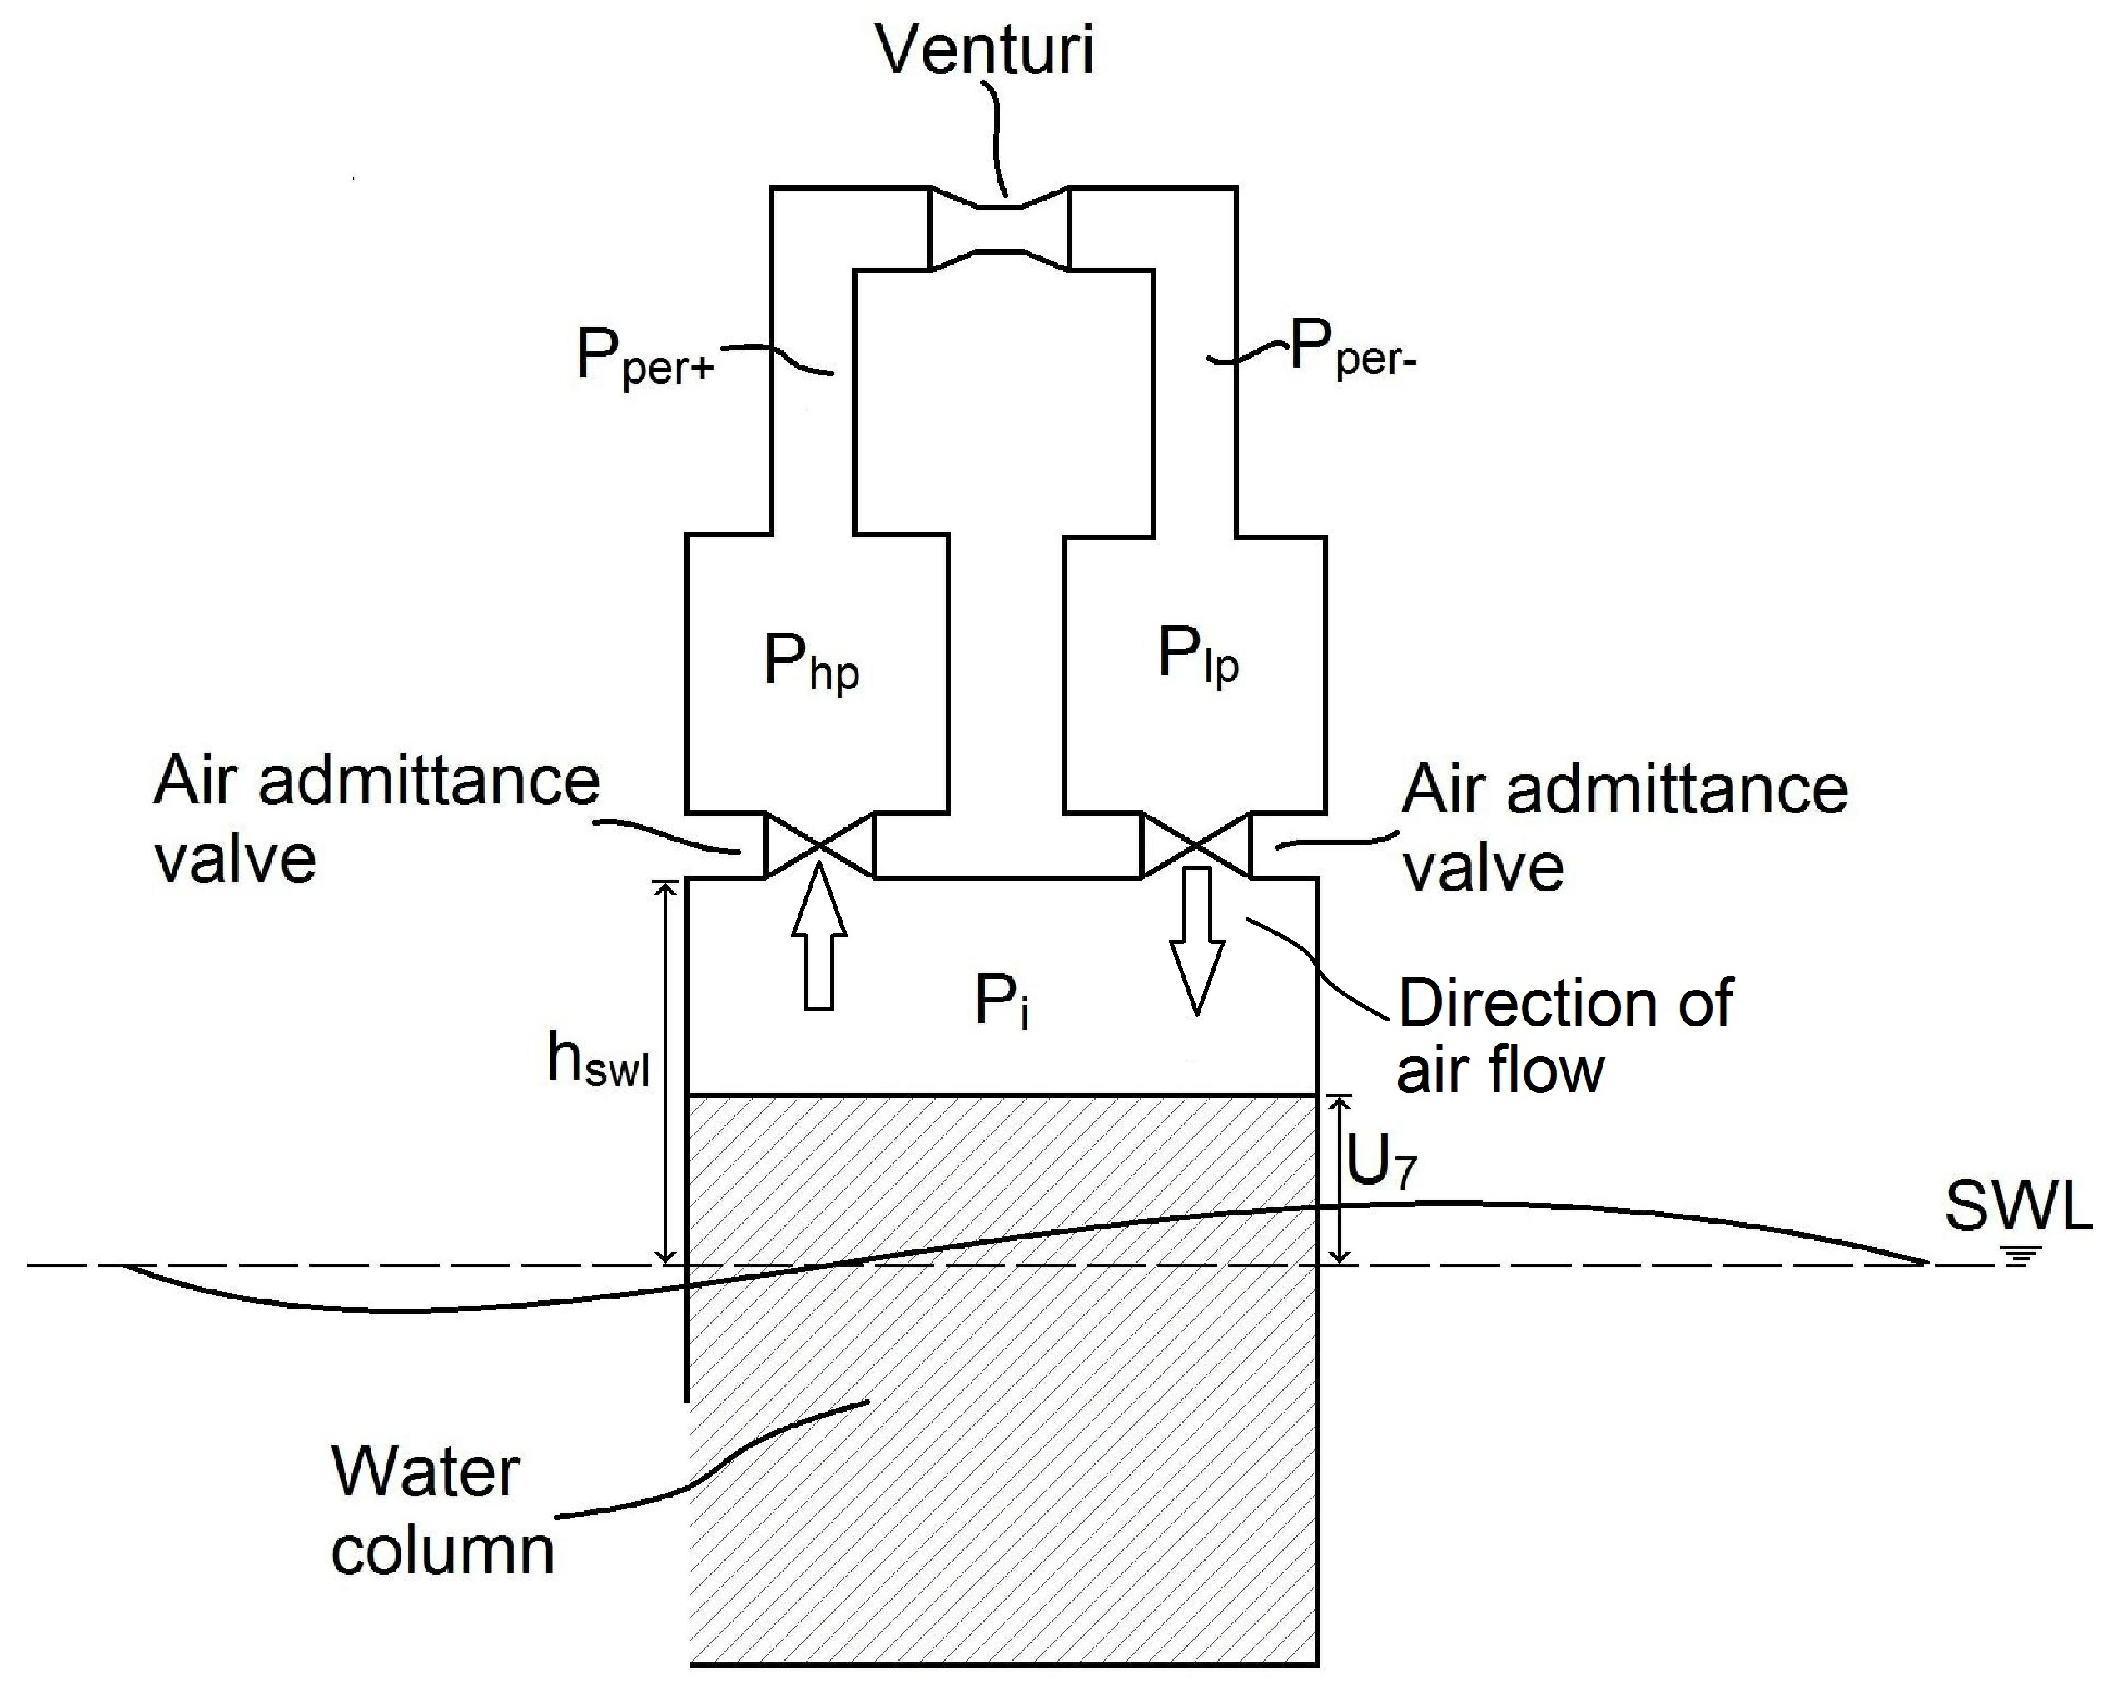
Figure 3 illustrates a schematic of the cross-section through one OWC chamber, showing the main components of the system and the direction of air flow.
The design of the model was, in part, based on the results of earlier testing using three-chamber models. The purpose of that testing was firstly to investigate the effect of varying the angle of the OWC chamber partition walls relative to the back wall of the leg of the platform. Secondly, the effect of using a curved OWC chamber profile compared to a straight profile was investigated. It was found that the energy absorbed was greatest when the dividing walls between the chambers were kept at 90 degrees to the back wall. It was also found that the profile of the chamber had little effect on the energy absorbed, and the decision to proceed with the curved profile, as shown in the cross-section of the later model in
Figure 4, was taken for structural reasons [
29].
Figure 3.
Schematic of chamber, valve and plenum arrangement with one OWC chamber.
Figure 3.
Schematic of chamber, valve and plenum arrangement with one OWC chamber.
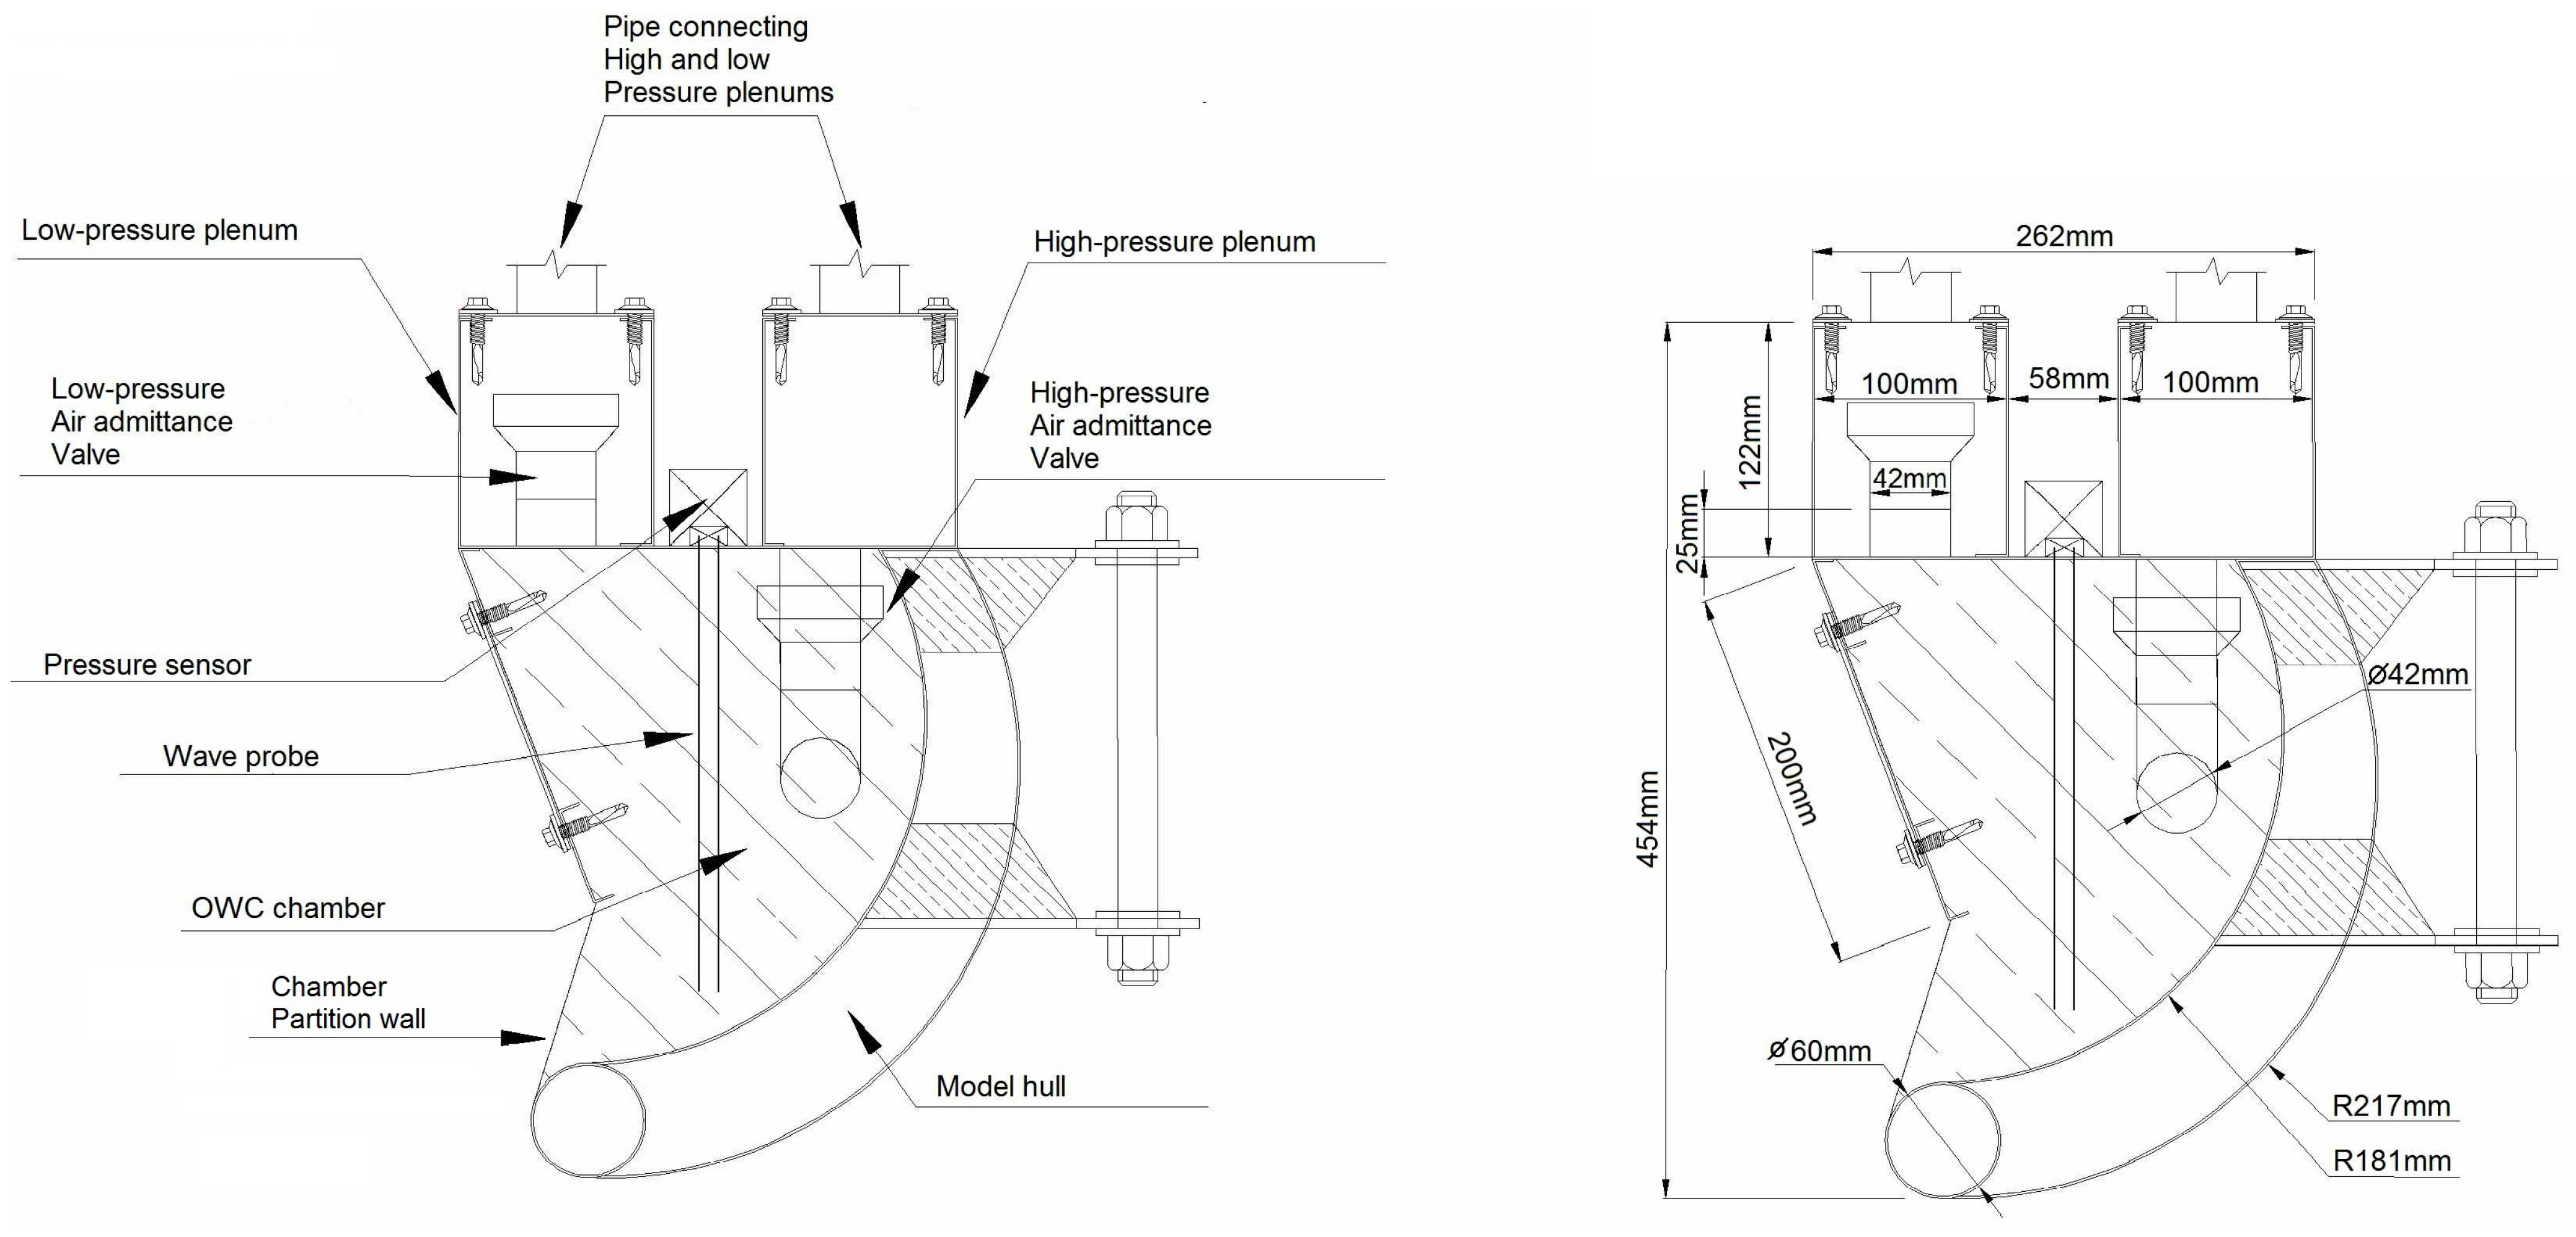
Figure 4.
Cross section of OWC chamber.
Figure 4.
Cross section of OWC chamber.
Complications in the scaling of an OWC model arise, due to the influence of the air volumes involved [
30]. For the 1/50
th scale 32-chamber model, the hull dimensions are scaled using Froude scaling. The air volumes are scaled by the square of the scaling factor when compared to the full-scale concept, in order to scale the effects of the stiffness of the air. A good discussion into the issues surrounding model scaling can be found in [
31]. The proposed full scale device would be deployed in the North Atlantic, where the range of dominant zero crossing periods lies between 8 and 10 s [
32]. The individual chambers have been designed to have a resonant period of 9.25 (1.3) s at full (model) scale. These values are based on the hydrodynamic quantities for a single chamber calculated using WAMIT [
33] and found from the following equation:
where
c is the hydrostatic stiffness;
m is the mass; and
a is the (infinite frequency) added mass of the water column. The length of each leg at full scale is such that should a leg be acted on by a regular wave of period 9 s, one complete period of this wave would be in communication with the leg at all times. This is equivalent to a regular wave of period 1.27 s at model scale. It is these considerations that dictated the size, orientation and number of chambers in each leg.
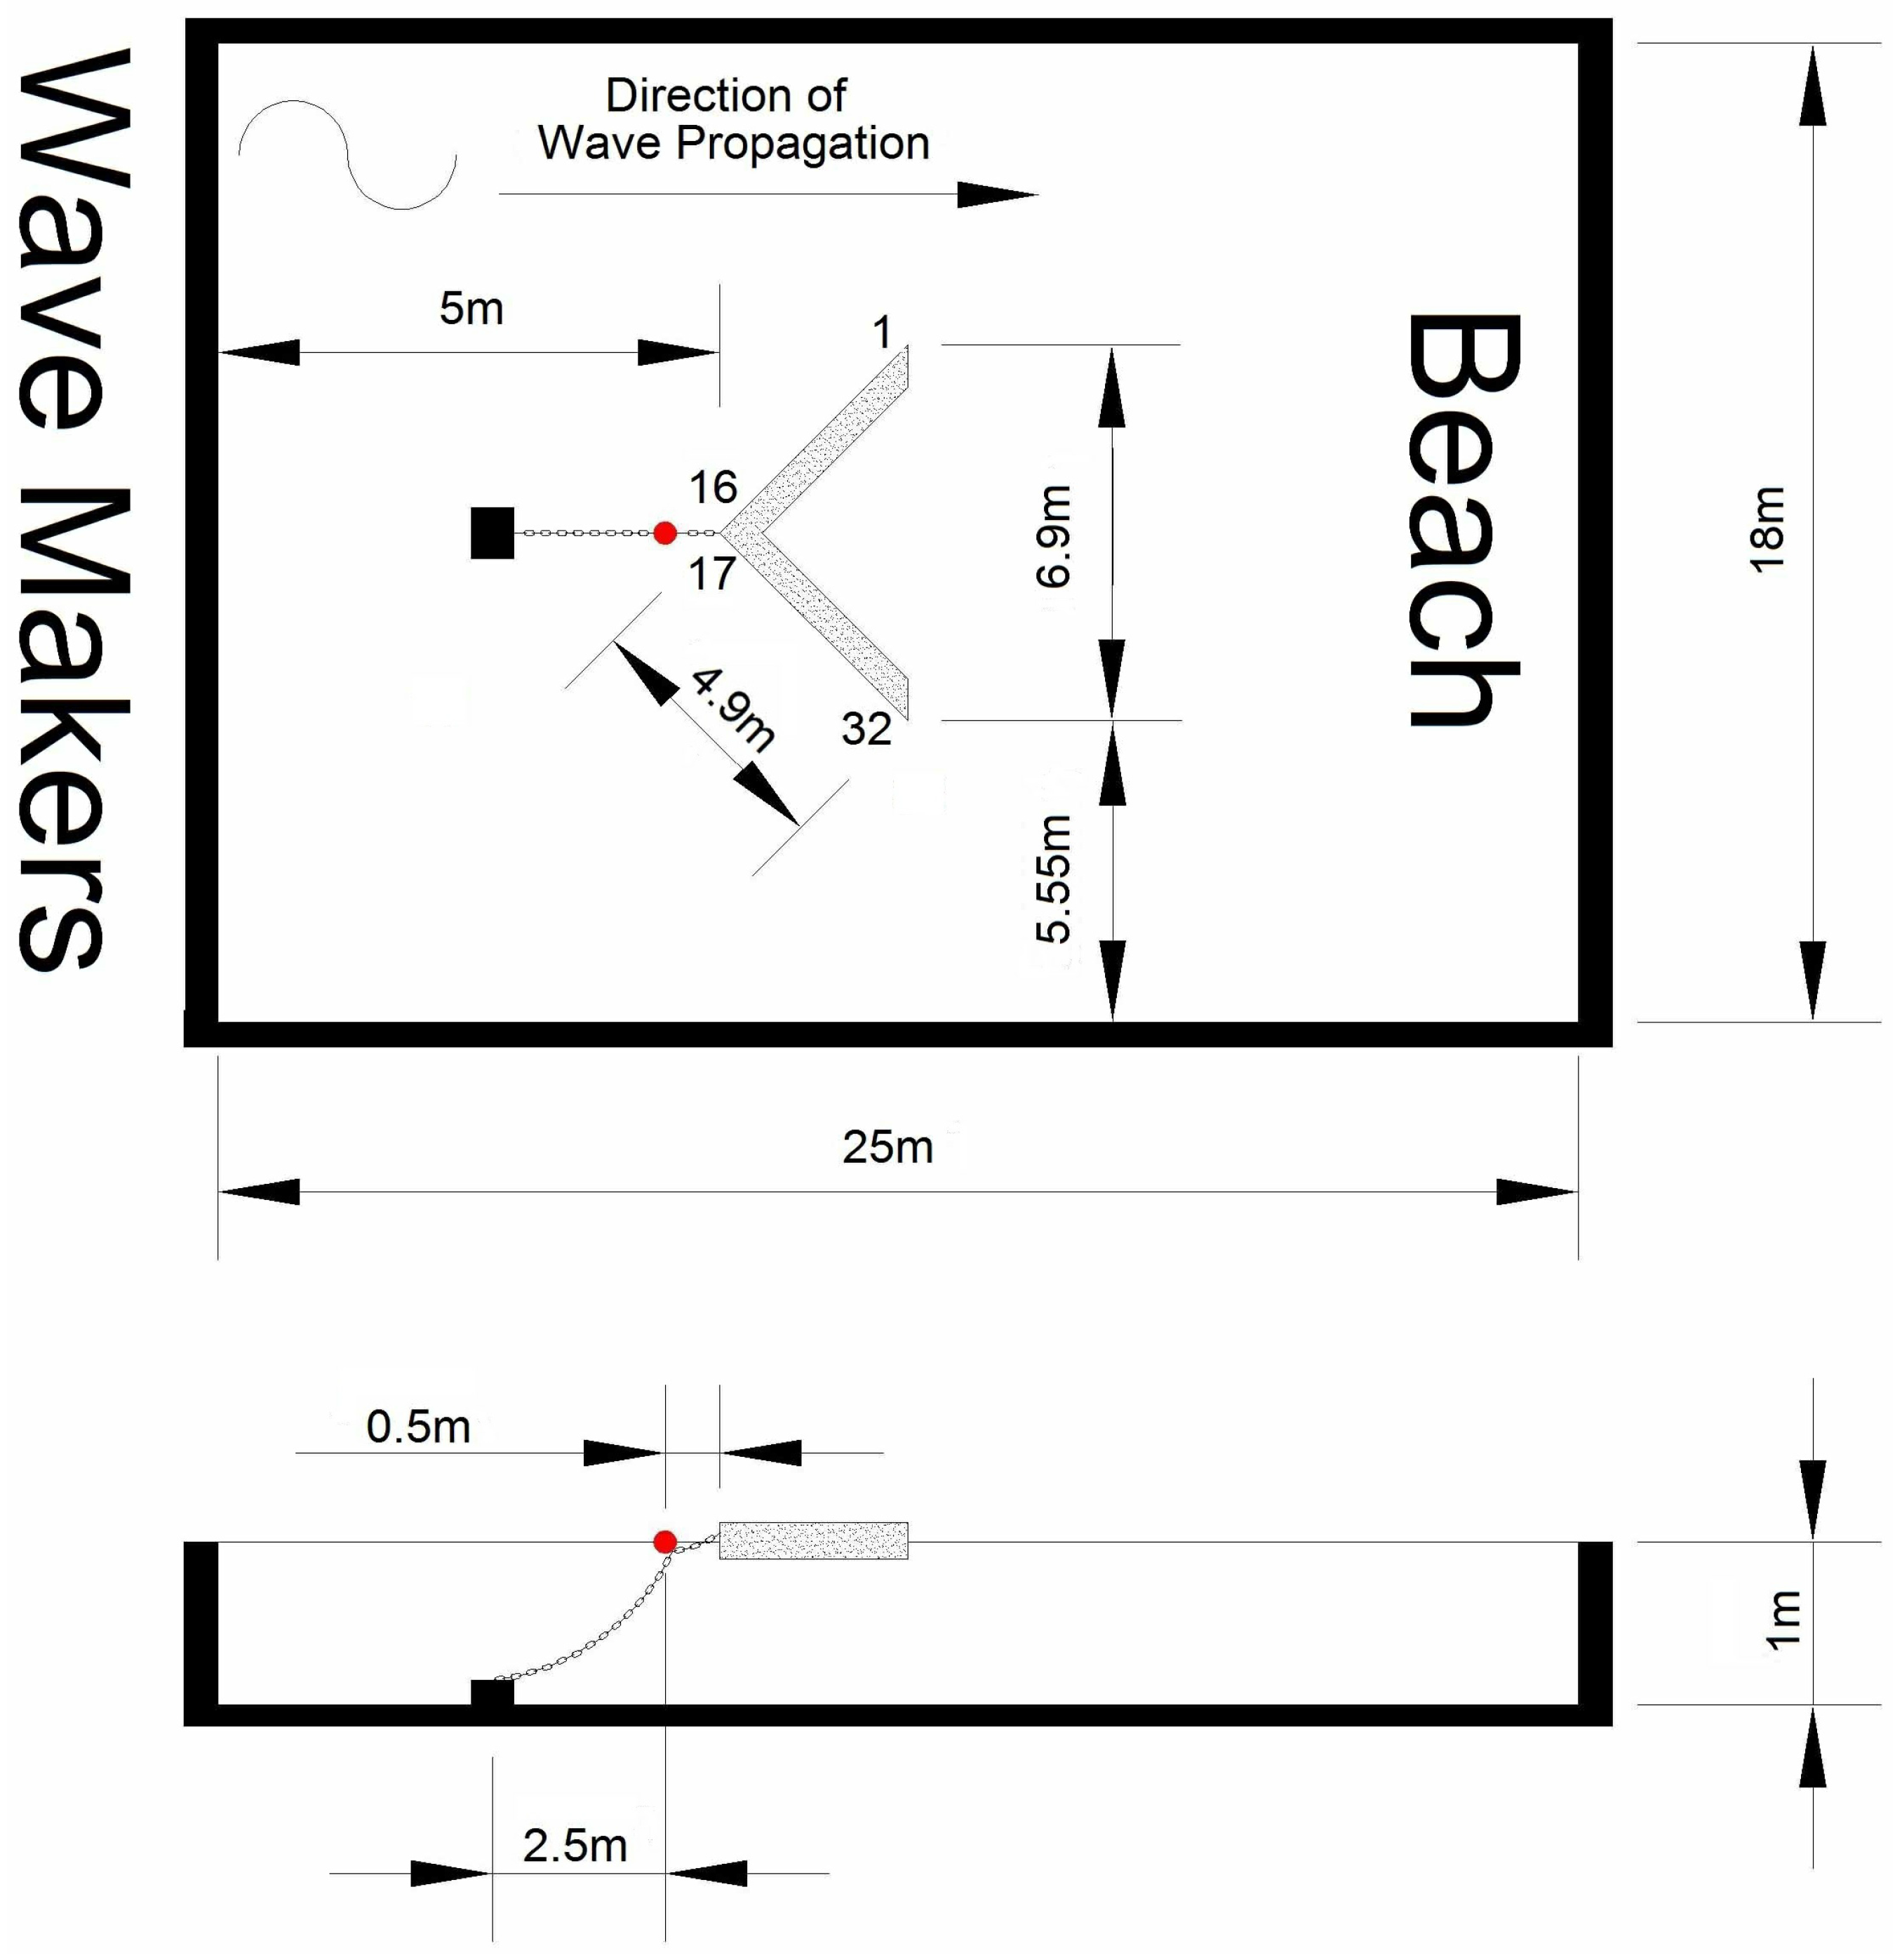
While the full-scale platform would likely be constructed from reinforced concrete for economic reasons, this scale model was constructed primarily from stainless steel. Each leg of the model platform is 4.9 m in length, and the width of each water column chamber along the leg is 0.29 m. The cross-sectional dimensions of the chambers can be seen in
Figure 4. Perspex windows were included to allow visual inspection of the motion of the water column in each chamber during testing. In order to simulate a power take-off (PTO) arrangement and introduce varying levels of damping to the system, the high- and low-pressure plenums on each leg were connected to 76 mm diameter stainless steel tubes, rising vertically from each plenum to a height of 600 mm before turning through 90 degrees to face each other. A gap of 200 mm is left between the openings of these two tubes on each leg to allow for the installation of Venturis of varying throat diameters. These Venturis were constructed from glass-reinforced plastic and an airtight seal between the Venturis and the model obtained using latex couplers.
To provide additional buoyancy in case of any water egress into the hull of the model, a length of sealed, hollow 150 mm diameter plastic pipe was laid under each leg of the model. These pipes were completely submerged when the model was at rest.
Figure 2 shows a three-dimensional CAD drawing of the model. This drawing is dimensionally accurate and allows the mass, moments of inertia and centre of gravity of the model to be determined using the AutoCAD “massprop” command. The use of dimensionally accurate CAD models to determine key parameters is a relatively common practice [
34].
Wave probes were installed in all chambers along one leg of the model to record the motion of the water columns relative to the platform during the testing. These probes were located along the vertical centre line of the chambers. Pressure transducers were installed in these chambers to record the variation in chamber air pressure and at both ends and the centre point of each plenum. Two further pressure transducers were located at the midpoints of the PTO simulating tubes on either side of the Venturi to allow for air flow calculations through the Venturis and, hence, allow power absorption calculations to be performed. Motion capture equipment was used to record the rigid body motion of the platform and the required knowledge of the location of the centre of gravity of the model, again obtained from the accurate three-dimensional AutoCAD model in
Figure 2. A number of further wave probes were installed in the OWC chambers of the second leg to compare the results obtained from both legs, though no additional pressure transducers were installed in the OWC chambers of this leg. A total of 22 wave probes and 28 pressure transducers were installed on the model.
The cross-sectional profile of the platform chambers is curved for structural reasons and to reduce losses due to vortex formation.
Figure 4 illustrates the cross-section through one chamber of the model, illustrating the location of the two plenums connected to this chamber, the wave probe and the pressure transducer.
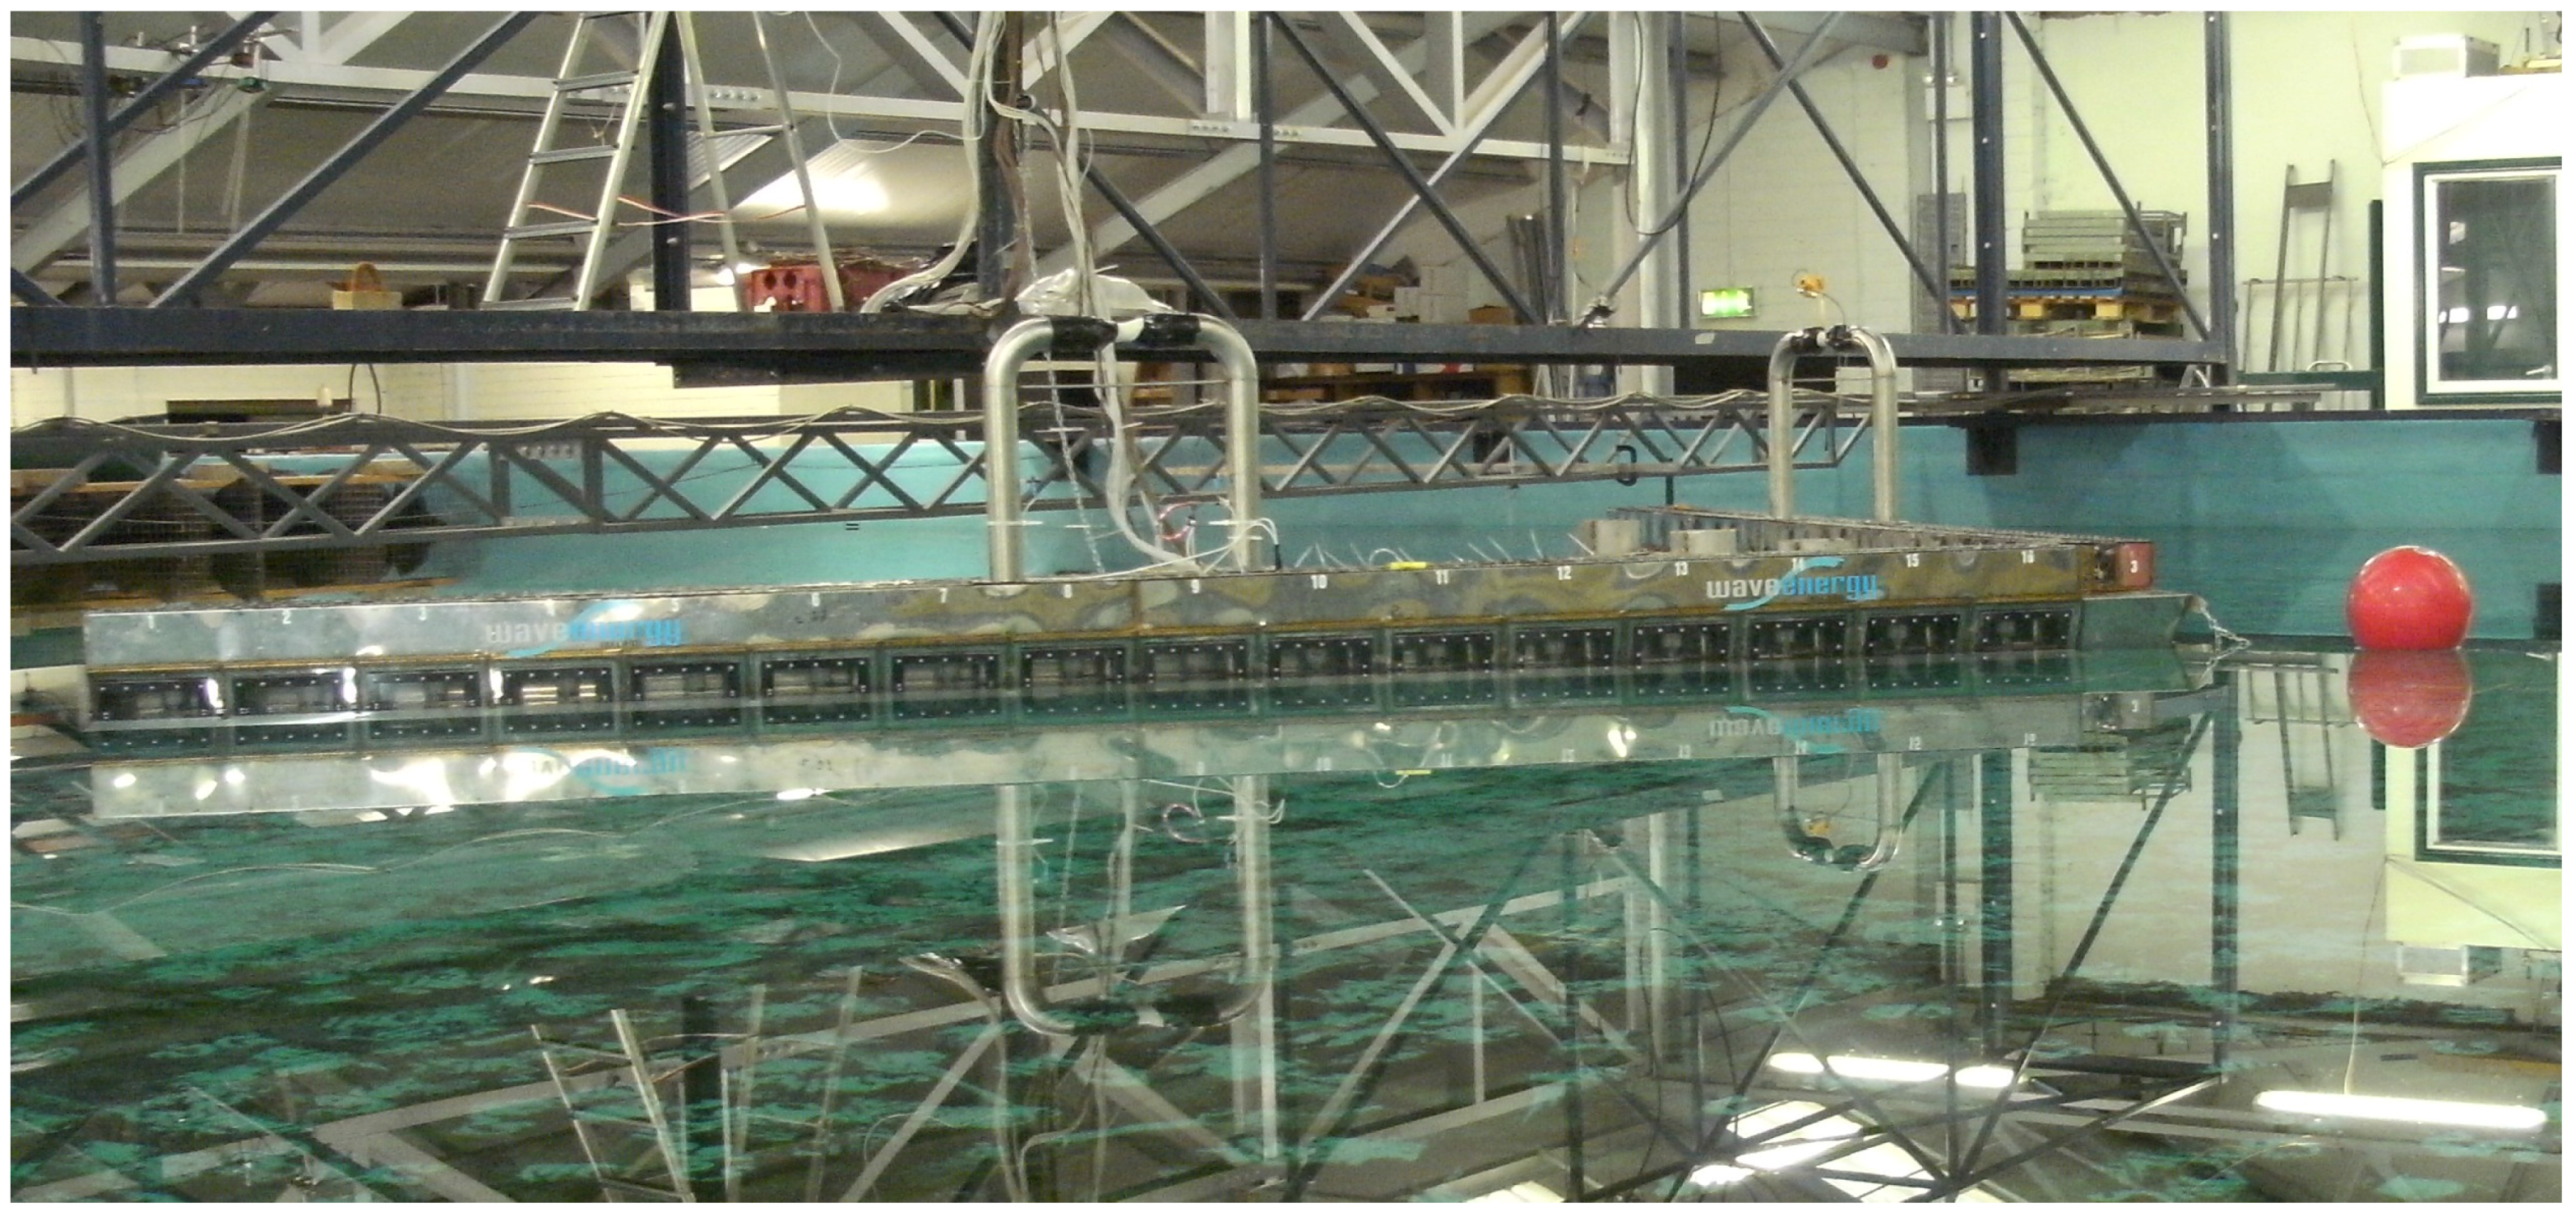
Figure 5 shows a photograph of the model
in situ in the basin at the Hydraulics and Maritime Research Centre (HMRC), located at University College Cork, Ireland, prior to the beginning of the testing. Note that the sensor wiring looms at the back of the model.
Figure 5.
Model in situ at the Hydraulics and Maritime Research Centre (HMRC).
Figure 5.
Model in situ at the Hydraulics and Maritime Research Centre (HMRC).
5. Model Testing
The model was installed in the large ocean basin at the HMRC. This basin has dimensions of 25 m × 18 m × 1 m. Some concern exists in relation to the reflection of waves from the tank walls, notably for the tests performed using incident waves with relatively short wavelengths. However, the waves of primary interest lie around the 8–10 second period range at full scale, equivalent to 1.13 to 1.41 s at model scale. At these wavelengths, interaction with the tank walls is less of an issue. At wave periods where reflections are significant, the seagoing behaviour of the device may still be extracted from these results [
35]. The effect of reflections from the tank walls is neglected in the results presented here.
The model was moored using a single point catenary style arrangement, where an anchored chain was connected to a floating buoy and, then, to the nose of the platform. The model was free to rotate about this point, simulating a single point FPSO-style mooring.
Figure 6 is a schematic of the model moored in the basin and shows the main dimensions of the basin and model. Also illustrated is the naming convention for the OWC chambers, with chambers 1 to 16 on the starboard leg and chambers 17 to 32 on the port leg, as indicated.
Using lead weights, the draught of the model was set as required. All sensors were sampled at a rate of 32 Hz, following calibration. In line with the Sustainable Energy Authority of Ireland wave energy converter development protocols [
36], the model was tested for a variety of configurations, with a range of damping conditions achieved through varying Venturi throat diameters for a range of wave conditions. The model was tested for a range of regular waves of 60 mm wave height for wave periods of 0.71, 0.85, 0.99, 1.13, 1.27, 1.41, 1.56, 1.70, 1.84 and 1.98 s. This is equivalent to a full scale wave height of three metres and full scale wave periods of 5, 6, 7, 8, 9, 10, 11, 12 and 13 s, respectively, using Froude scaling [
30]. All tests simulated head sea conditions, with waves impacting each OWC chamber at 45 degrees. Each test was run for 60 s to allow any transient effects to subside. Wave probes located in front of the model were used to record the incident wave heights and the time series data from these probes used to ensure the incident wave height remained at 60 mm. The Venturis used to effect various PTO damping had throat diameters of 20 mm, 25 mm, 27.5 mm and 30 mm. Each Venturi set was tested for each incident wave period listed. The theory underlying the analysis of the resulting measurements is outlined in
Section 7, and the results themselves are presented in the frequency domain in
Section 8.
Figure 6.
Schematic of model and ocean basin at the HMRC.
Figure 6.
Schematic of model and ocean basin at the HMRC.
6. Numerical Simulation
Numerical simulation of the model was carried out in the frequency domain using a combination of software packages. The frequency dependent hydrodynamic quantities,
i.e., the added mass, radiation damping and wave-induced exciting forces, were determined using the numerical solver produced by WAMIT Inc. [
33], using the CAD surface-modelling package, MultiSurf, developed by AeroHydro Inc. [
37] to calculate the mean wetted surface. MATLAB [
38] was then used to predict the displacement of the water columns and platforms, along with the power absorbed by the model, with the centre of gravity, the mass and moments of inertia again provided from the AutoCAD model, as in
Figure 2.
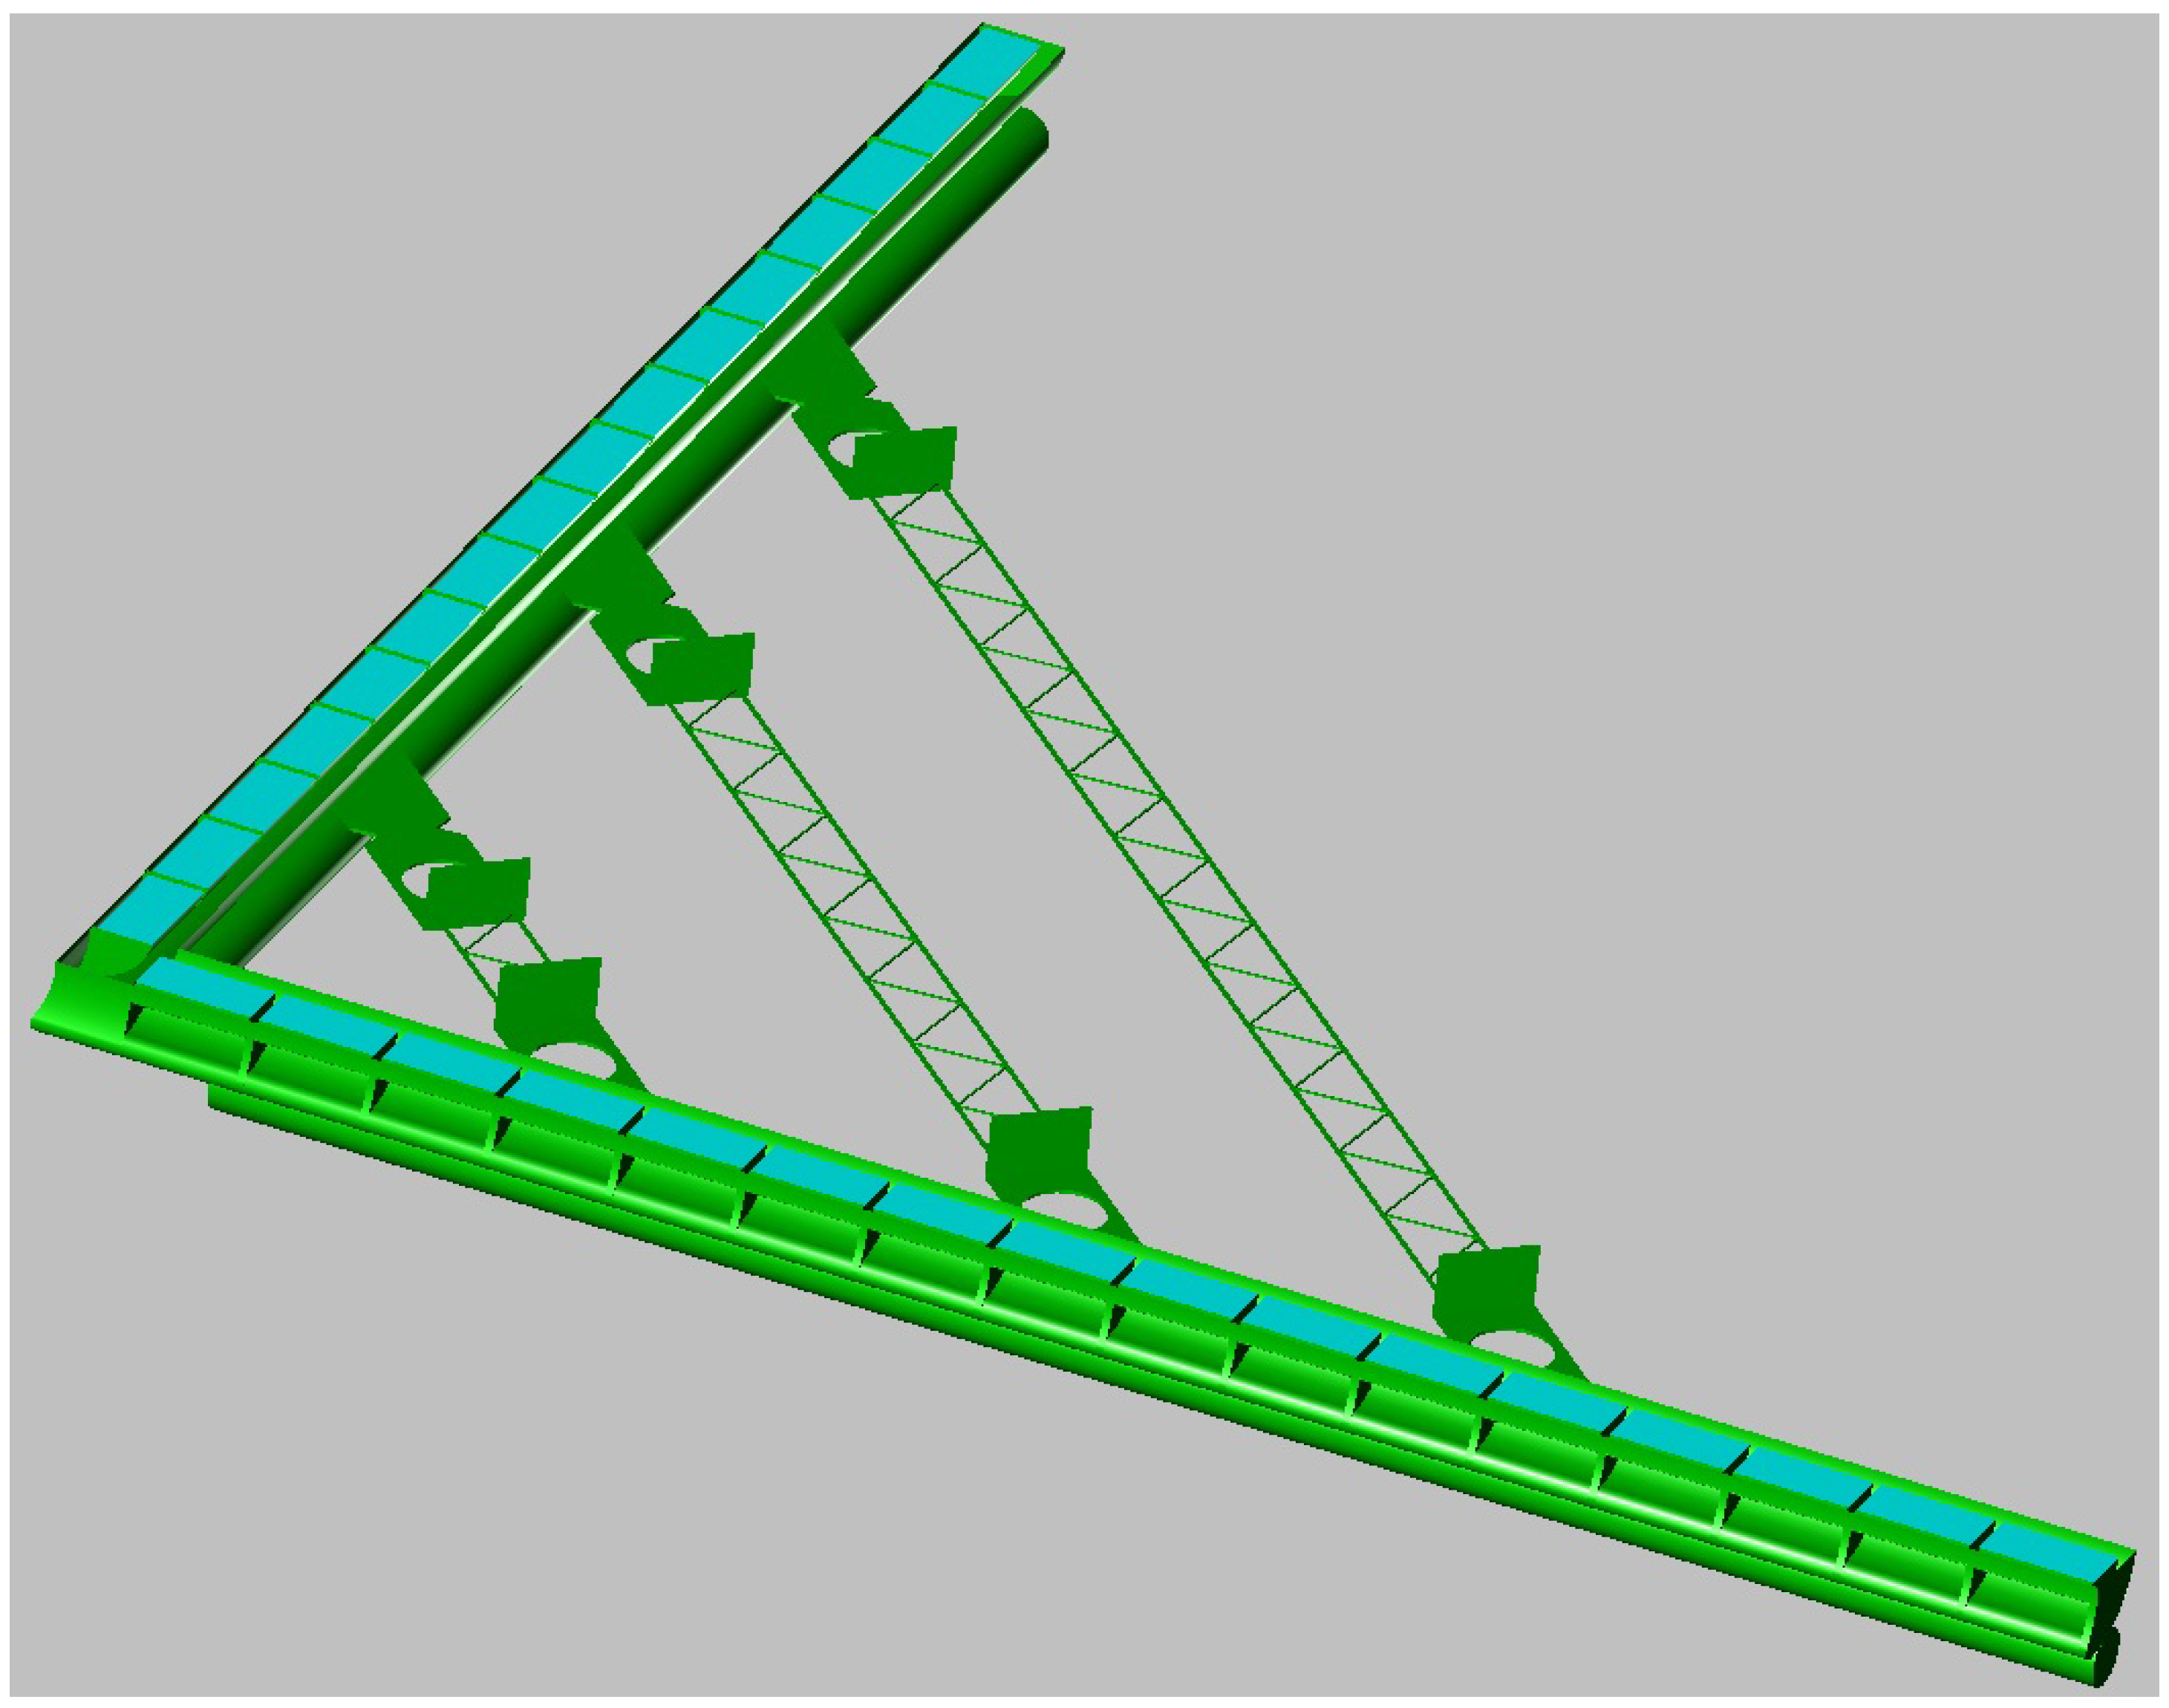
The water columns are represented in the MultiSurf model by surface patches, which can be seen as the cyan patches in
Figure 7. Each patch is assigned a unique number by MultiSurf. By default, WAMIT solves for the frequency-dependent properties of the six rigid body modes of motion of the object being analysed. However, additional modes of motion may be included in the WAMIT solution through the use of the “Generalized Body Modes” function. A custom routine was written in FORTRAN (compiled using the Intel Visual FORTRAN compiler) to incorporate the heave modes of each of the 32 OWCs based on the patch numbers assigned by MultiSurf.
Figure 7.
MultiSurf representation of model. Note surface patches corresponding to the free surfaces of the water columns.
Figure 7.
MultiSurf representation of model. Note surface patches corresponding to the free surfaces of the water columns.
Using the panel method as described in [
39] and others, WAMIT was used to determine the frequency-dependent exciting forces, added masses and radiation damping by numerically solving the following equations:
where
j is the unit complex number;
ρ the density of water;
ω the incident wave angular frequency;
the scattering velocity potential;
the radiated velocity potential of the
mode and
the body normal vector. WAMIT was also used to calculate the hydrostatic stiffness values of the model, which was verified using the “massprop” command in AutoCAD on a region of size and shape to match the water plane area of the model.
7. Analysis Methods Used
This section documents the analytical techniques and measures used in the analysis of the results of the testing of the 1:50 scale model of the device. Each test run was 1 min in duration, with each sensor sampled at 32 Hz, resulting in 1,920 samples for each sensor for each test run. The water column in each chamber is modelled as a massless piston after Evans [
40], and only the heave mode of the water columns is considered. Due to the location of the probes along the vertical centre line of the chambers, no rotational motion of the water columns was recorded. In accordance with guidelines issued by the International Towing Tank Conference [
41], the heave response amplitude operator (RAO) for the motion of the platform and the motions of the water columns is defined as:
where the amplitude of the heave displacements and the wave amplitude are in metres. The pitch RAO for the motion of the platform is expressed non-dimensionally in terms of the wave steepness and defined as:
where the amplitude of the pitch displacement is in degrees and the wave length and wave amplitude are in metres. Note that the displacements of the water columns, used to calculate the heave RAOs of the water columns, are determined as a combination of the data returned by the water column wave probes and the heave and pitch motion of the platform itself. The wave probes are fixed to the platform, therefore recording the motion of the water columns
relative to the platform. Displacements (in metres) are calculated relative to a coordinate system, where the origin of the vertical axis is located at the still water level, as:
where
is the heave displacement of the
water column relative to the still water level;
is the heave displacement of the
water column relative to the platform;
is the perpendicular distance from the centre of gravity of the platform to the centre of the
water column in metres;
is the pitch displacement of the platform in radians and
is the heave displacement of the platform. The average displacement is determined from the root mean square (RMS) of the displacement time signals as:
where
represents the value of the
element of the time series and
n is the number of samples in the time series. Since the RMS of a signal is related to the amplitude,
, by:
the amplitude of the displacement may be determined by:
The wave power absorbed by the model was determined using three different methods in order to provide confidence in the results.
7.1. Power Calculation Method 1:
Power in the Venturi is calculated as the product of the RMS volumetric airflow rate multiplied by the RMS of the pressure difference across the Venturi. This yields the power absorbed by one leg of the model, and since the model is symmetric, the total power absorbed is twice this figure. Using standard Venturi theory, the mass flow rate across a Venturi can be determined once the coefficient of discharge,
, is known using the following equation:
where
is the mass flow rate of air through the Venturi;
is the cross-sectional area of the throat section of the Venturi;
is the density of air;
is the pressure in the conduit leading to the high-pressure plenum; and
is the pressure in the conduit leading to the low-pressure plenum. Typically, the measured value for
for a smooth Venturi ranges from 0.95 to 0.97 [
42]. As the primary purpose of the testing performed was to assess the viability of the configuration, an estimate of 0.9 was used, leading to conservative power figures. Assuming that no compression of air takes place, which can be considered valid at the volumes used here and for subsonic fluid flows (Mach no. <0.3) [
43], the volumetric flow rate can be determined from:
where
is the volumetric flow rate of air through the Venturi. Combining Equations (
11) and (
12) allows the air flow power to be calculated from the following equation:
7.2. Power Calculation Method 2:
This method of determining the power absorbed is based on the heave velocity of the water column, as determined from the derivative of the displacement signal. The air flow from each chamber is calculated as:
where
is the air flow into the
OWC chamber;
is the cross-sectional area of the
water column and
is the velocity of the water column in the
chamber. The total power is therefore:
where
is the pressure difference between the plenum and the
chamber and N is the number of OWC chambers.
7.3. Power Calculation Method 3:
Here, we model an air admittance valve as an orifice, once the valve is open. The mass flow equations for these valves are given [
44] by:
where
is the mass flow rate of air from the low-pressure plenum into the
OWC chamber;
is the mass flow rate of air from the
OWC chamber into the high-pressure plenum;
is the coefficient of discharge for the air admittance valves;
is the edge distance of the air admittance valves;
is the opening distance of the diaphragms in the valves;
is the pressure in the
chamber;
is the pressure in the high-pressure plenum and
is the pressure in the low-pressure plenum.
Equation (
16) applies when the low-pressure plenum is discharging into a chamber, and Equation (
17) applies when a chamber is discharging into the high-pressure plenum. The mass flow is assumed to be zero when the water column is motionless.
Regardless of which method is used to calculate the power absorbed, the geometry of the model is such that the wave crest length presented to it is 6.9 m; see
Figure 6. The power per metre,
, in the wave is given by standard linear wave theory as:
where
g is the acceleration due to gravity,
A is the wave amplitude and
ω is the angular wave frequency. The efficiency of the model in converting wave energy is given by:
where
is the power absorbed by the model in Watts and
is the length of the wave crest presented to the model.
7.4. Numerical Model Evaluation
The equation of motion for the platform is given [
45] by:
where
F is the exciting force vector;
V is the complex velocity vector; and
Z is the complex impedance matrix, given by:
The added mass, added damping and hydrostatic stiffness matrices,
A,
B and
C, and the exciting force vector,
F, are determined from WAMIT. The mass matrix,
M, is calculated using the AutoCAD model. In general, it is not possible to numerically simulate the effects of latching, as employed on this model, directly in the frequency domain. The approach taken here to include the effects of the latching of the water columns in the numerical model is to determine a time-averaged linear value of the apparent PTO damping as experienced for each OWC and to use the linear damping matrix,
D. This is achieved by considering the power absorbed as determined experimentally,
(using the second method). Defining the average power absorbed by each chamber, as in Equation (
15), where the volumetric flow is given by Equation (
14), the pressure drop per unit flow,
, for each chamber is given [
46] by:
The flow rate,
, is given by:
where
is the RMS of the velocity of the water column and
is the cross-sectional area of the water column. Thus, Equation (
22) becomes:
or:
This allows the power absorbed to be defined in terms of a time-averaged linear damping and the square water column velocity, where the time-averaged damping is given by:
The value for the damping determined from Equation (
26) has units of Ns/m. The validity of determining a time-averaged equivalent linear damping using Equations (
22) and (
26) is based on the comparison between the different methods employed in determining the power absorbed by the model during tank testing as described. This comparison can be seen
Figure 9 for the 25 mm throat diameter Venturi set.
By solving Equation (
20) using the hydrodynamic values determined from WAMIT and the PTO damping as determined using Equation (
26), the complex velocity vector,
V, may be determined. The simulated power absorbed,
P, may then be found by:
where
D is the PTO damping matrix. The effect of the roll, sway, surge and yaw motions on the vertical displacement of the platform will be negligible in head seas. Consequently, when the PTO damping matrix is created, only the heave and pitch motions of the platform and the relative vertical motion of the water columns need be considered. This leads to a damping matrix in the following form where
is the perpendicular distance of the centre of the
chamber from the pitch axis of rotation and
is the linear damping for the
chamber:
8. Results
This section presents some results of the physical modelling alongside the equivalent results obtained from the numerical model for the 25 mm throat diameter Venturi set installed. This particular configuration was highlighted, because it resulted in the largest amount of power absorbed by the model, which occurred at a wave period of 1.13 s, equivalent to a wave period of 8 s using Froude scaling.
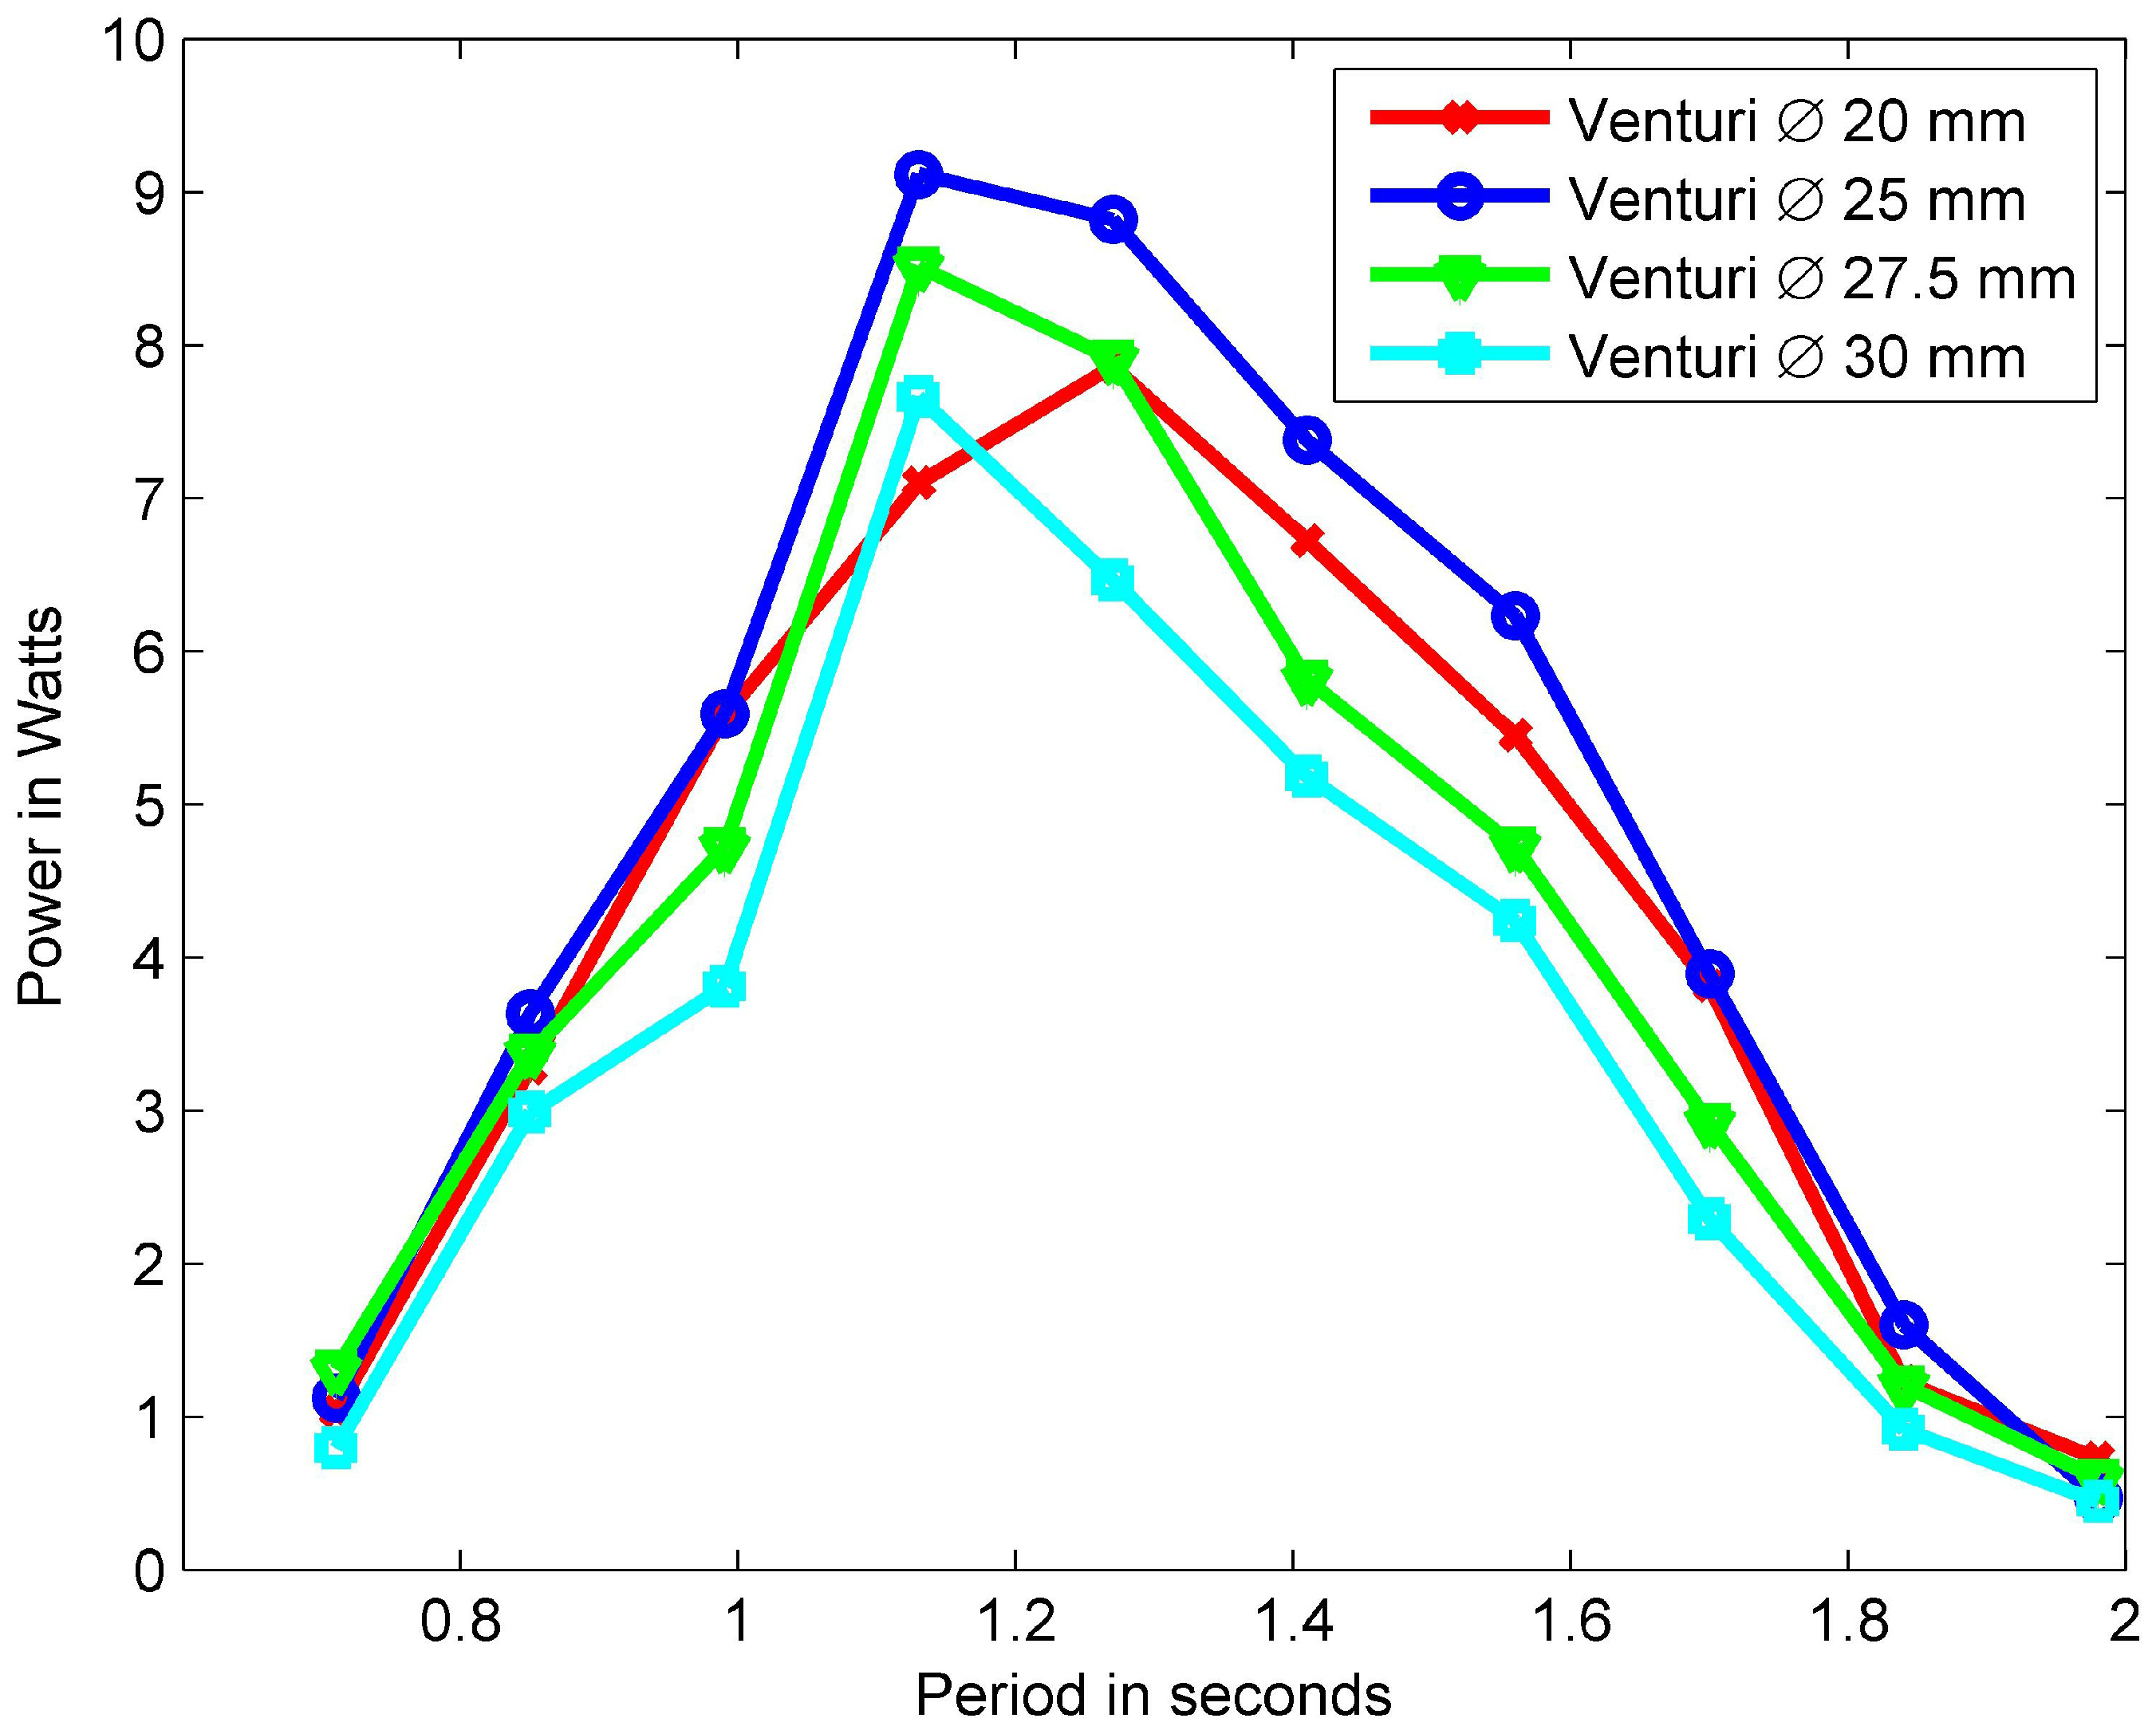
Figure 8 illustrates the amount of wave energy absorbed by the model (in watts) for each tested incident wave period and each Venturi throat diameter using Method 1 for power calculation. Note that the range of periods over which the device absorbed a significant amount of the energy from the incident wave during this testing was from approximately 1 to 1.45 s. These are equivalent to wave periods of 7 to 10.25 s at full scale, which is significant, since in excess of 78% of sea states in the North Atlantic have a zero crossing period in the range of 7.5 to 10.5 s [
32]. Note that this is only the hydrodynamic power absorbed by the model and, at full-scale, where the pneumatic power would be further converted to electrical power, further losses would occur.
Method 1 is considered the most reliable for accurately determining the power absorbed by the model, as it depends upon the output of two pressure transducers, one on either side of the Venturi of one leg, and, thus, gives a measure of the power absorbed by all 16 OWCs of one leg operating together. The total power absorbed is found by doubling this figure,
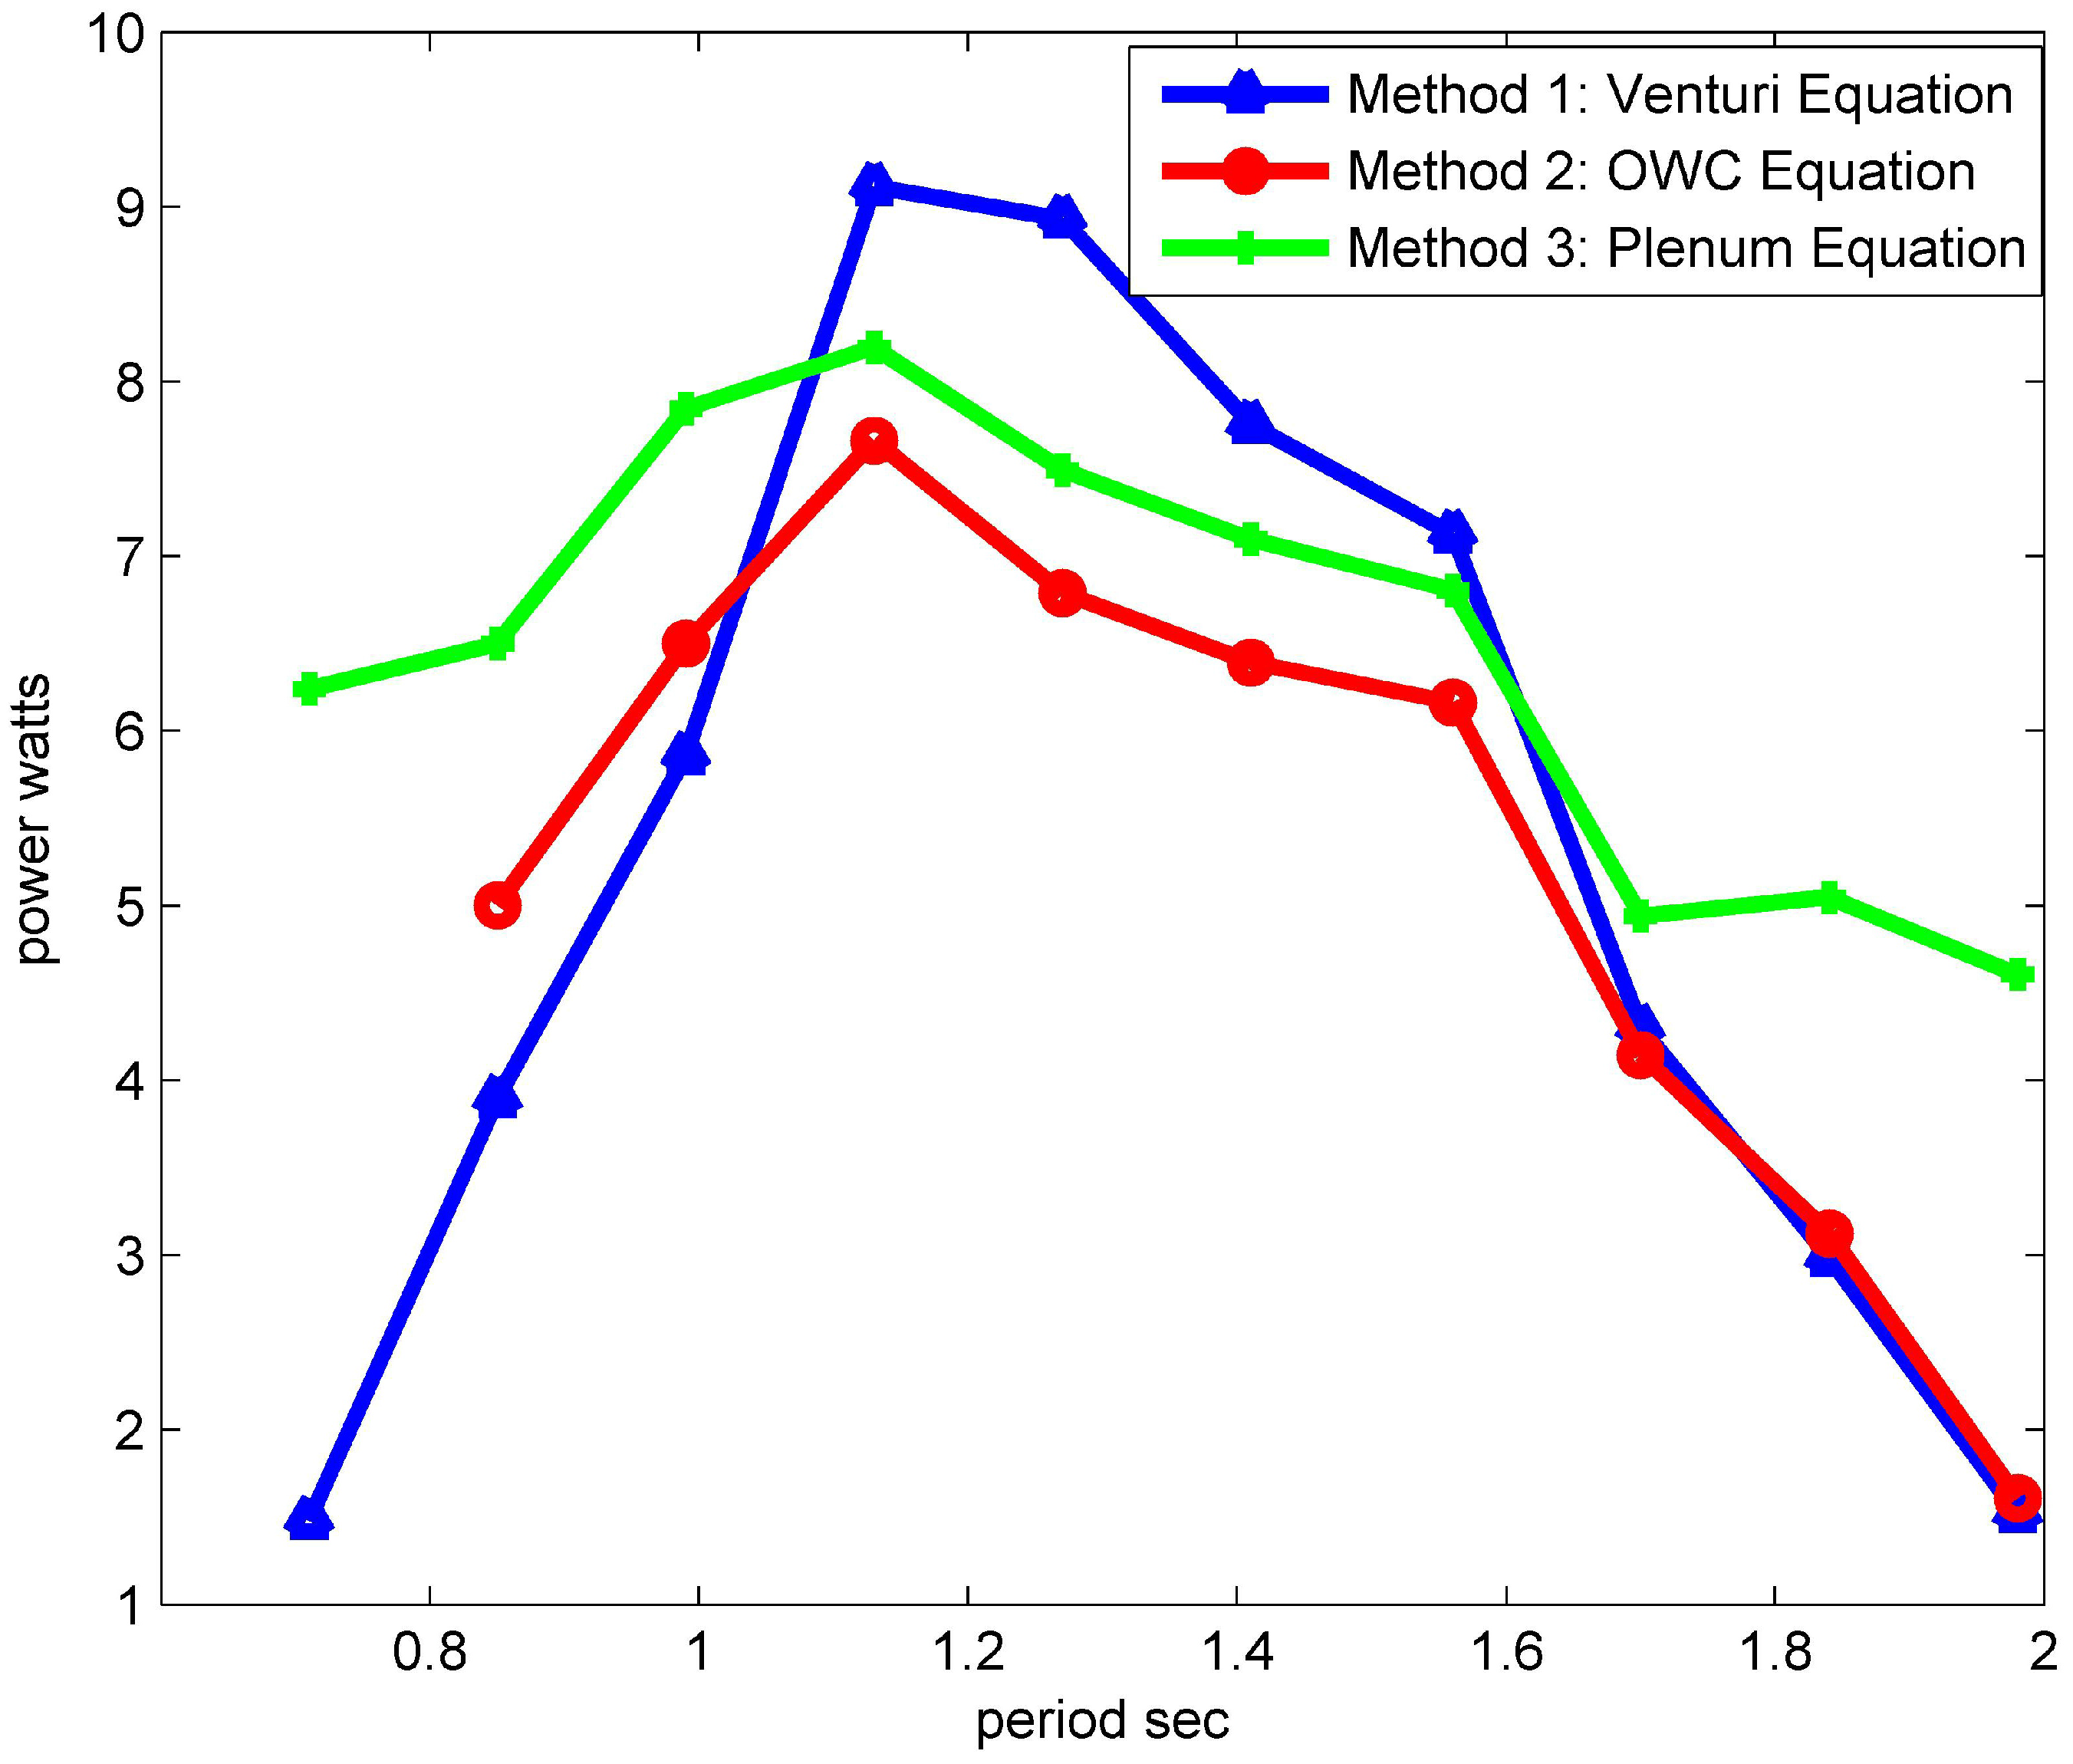
i.e., it is assumed that both legs of the platform absorb equal amounts of power. The calculations performed in implementing Method 2 included the assumption that the displacements of the water columns were relatively low, and as such, the cross-sectional area of the water column could be considered constant. A further possible source of error in this method would arise from splashing within the chambers affecting the output from the wave probes. Method 3 assumed a value of 0.5 for the coefficient of discharge for all the air admittance valves, a value that has not been experimentally confirmed. The primary purpose of Method 2 and Method 3 was to establish the validity of the linear damping model employed in the frequency domain numerical model, discussed above. A comparison of the three sets of results is presented in
Figure 9. As can be seen, a reasonable fit between the three methods used was achieved. The significance of this fit is to suggest that the linear damping value determined using Method 2 would be expected to produce reasonable results when used with the numerical model.
Figure 8.
Variation in power absorbed by the model against the incident wave period for each Venturi set tested while subject to an incident wave amplitude of 30 mm.
Figure 8.
Variation in power absorbed by the model against the incident wave period for each Venturi set tested while subject to an incident wave amplitude of 30 mm.
It is informative to compare the damping values that result from Equation (
26) with damping values quoted for an existing device. For example, the damping value reported by Wavegen [
46] for the LIMPET OWC on the island of Islay is 1,608,768 Ns/m. By following the guidelines for Froude scaling outlined in [
30], this leads to a value of 91 Ns/m at a scale of 1:50. For those Venturi diameters where the power absorbed by the model during tank testing was greatest, with throat diameters ranging from 25 mm to 30 mm, the linear damping coefficient was found to vary in the range of 500 Ns/m to 800 Ns/m. This would suggest that our model was over-damped during the testing. This assertion is supported by the results of the numerical model, as discussed in
Section 9.
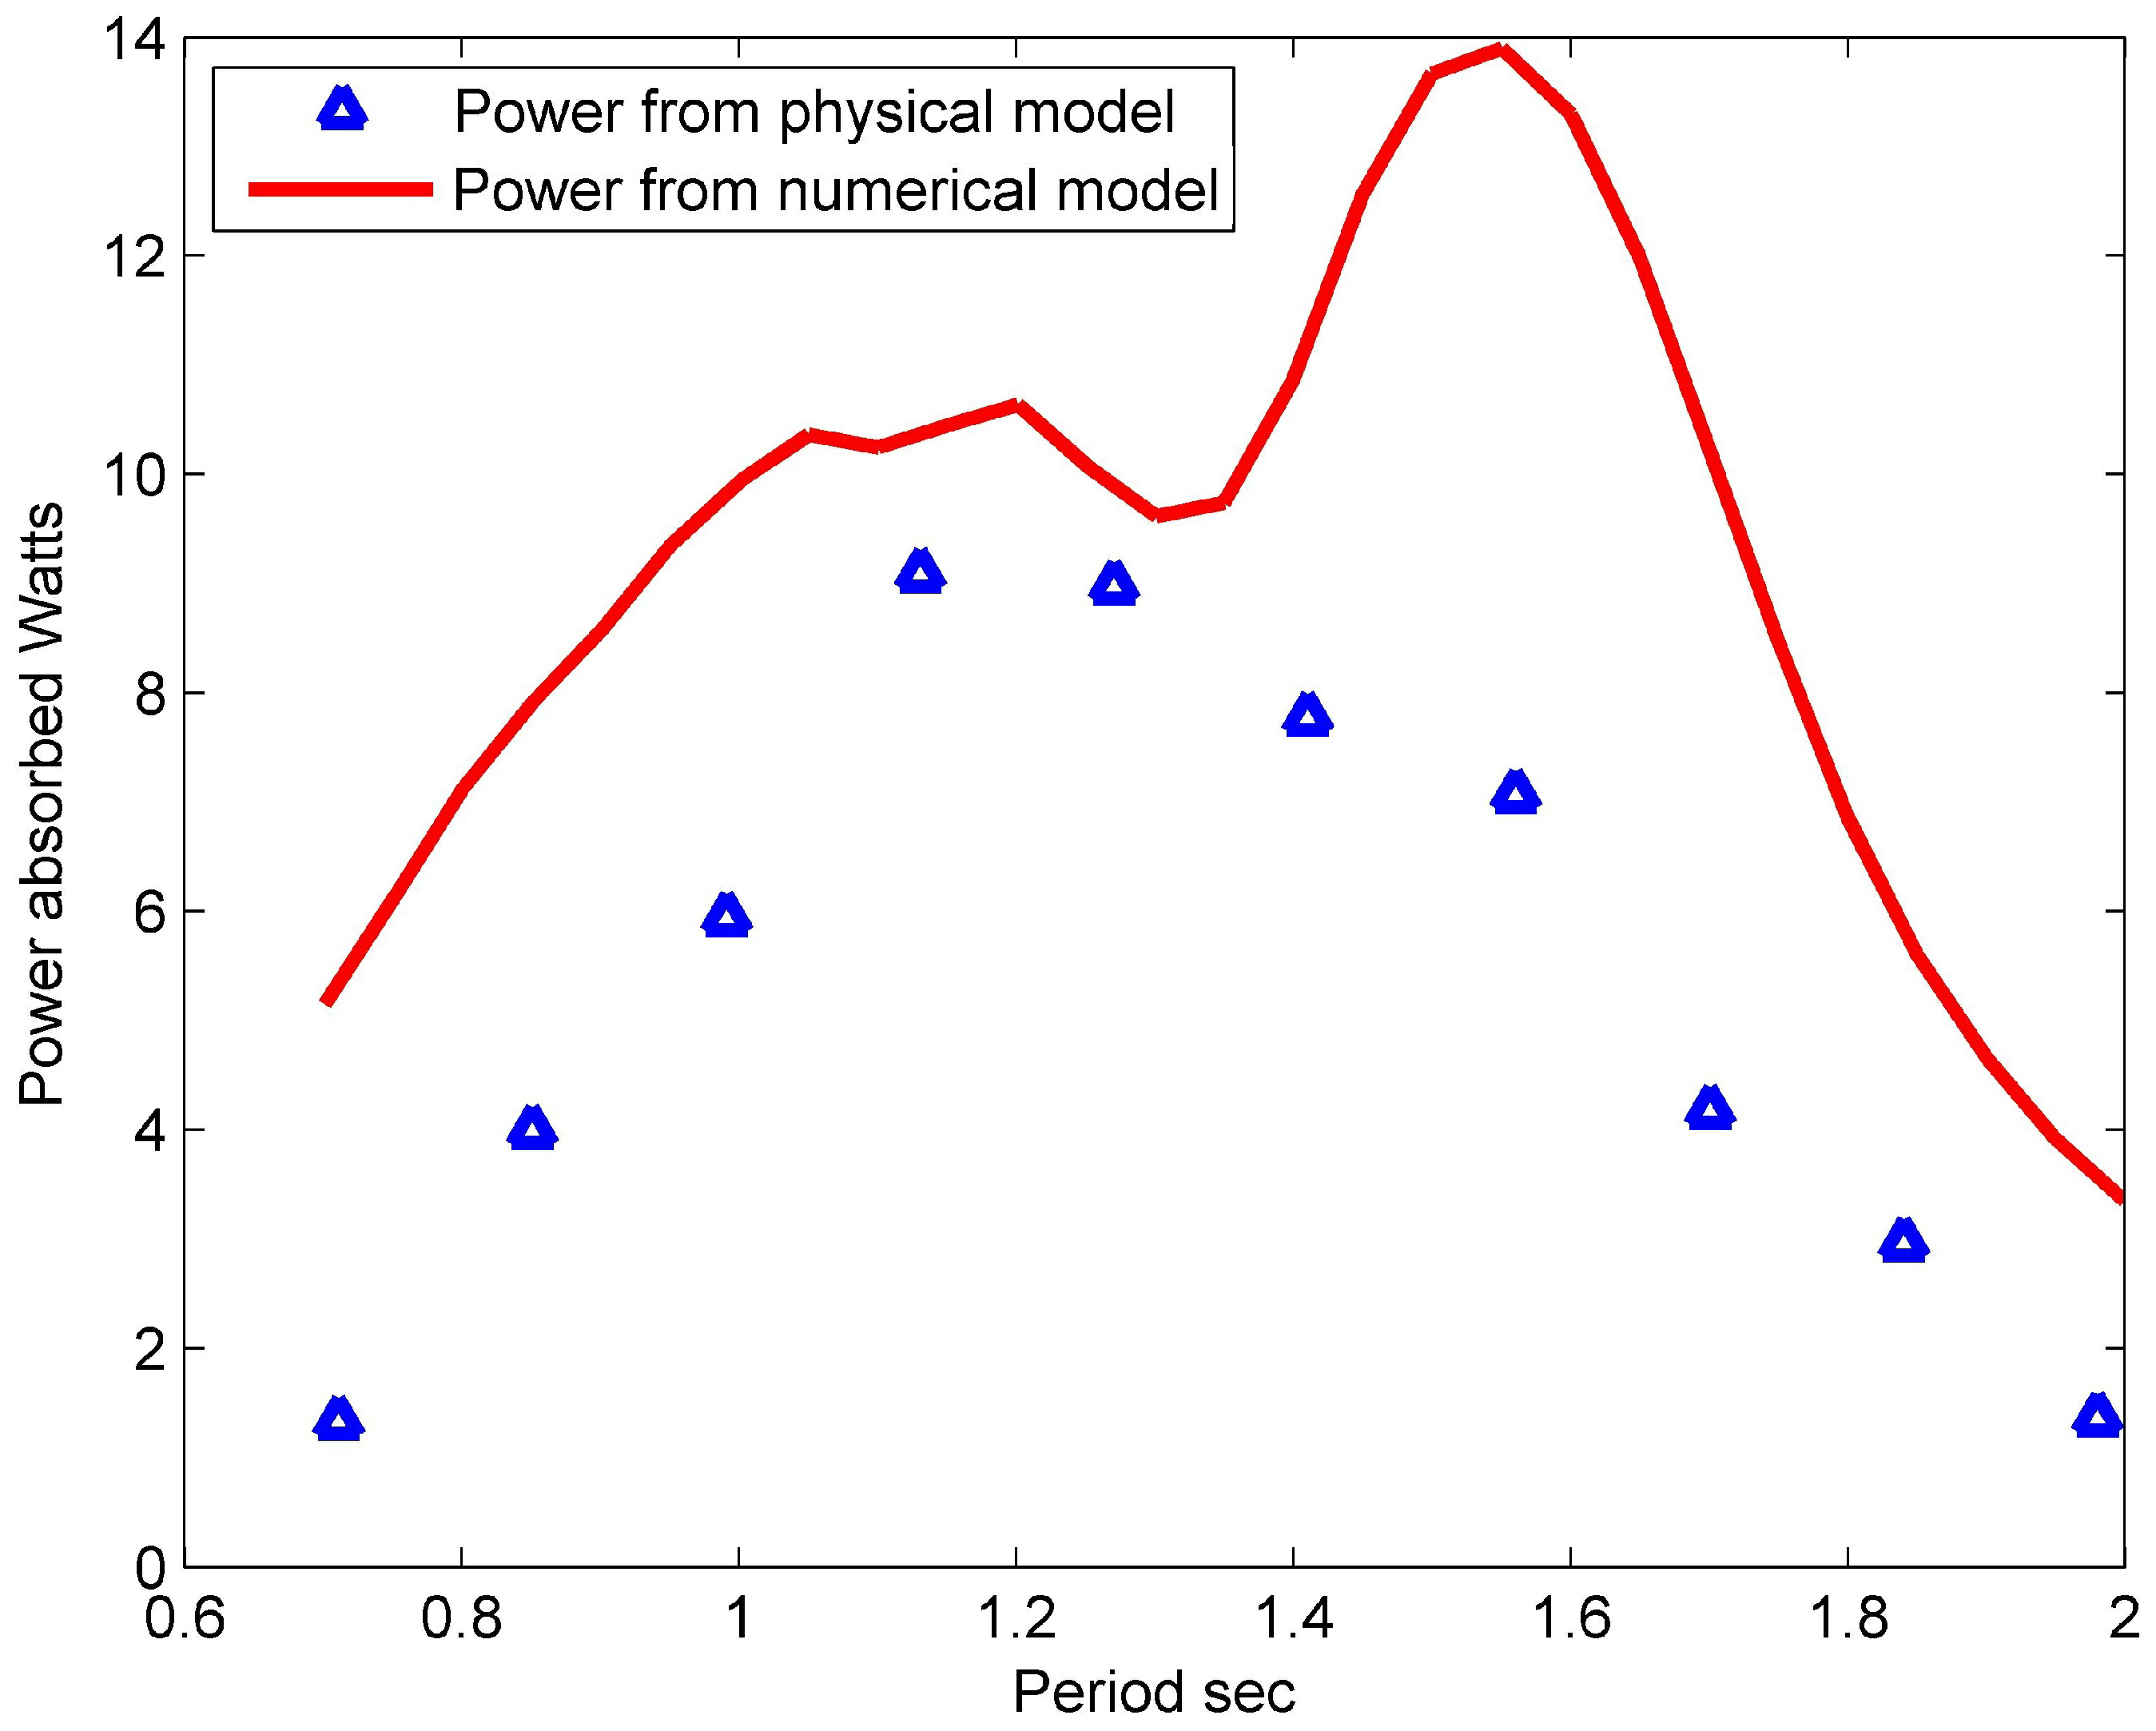
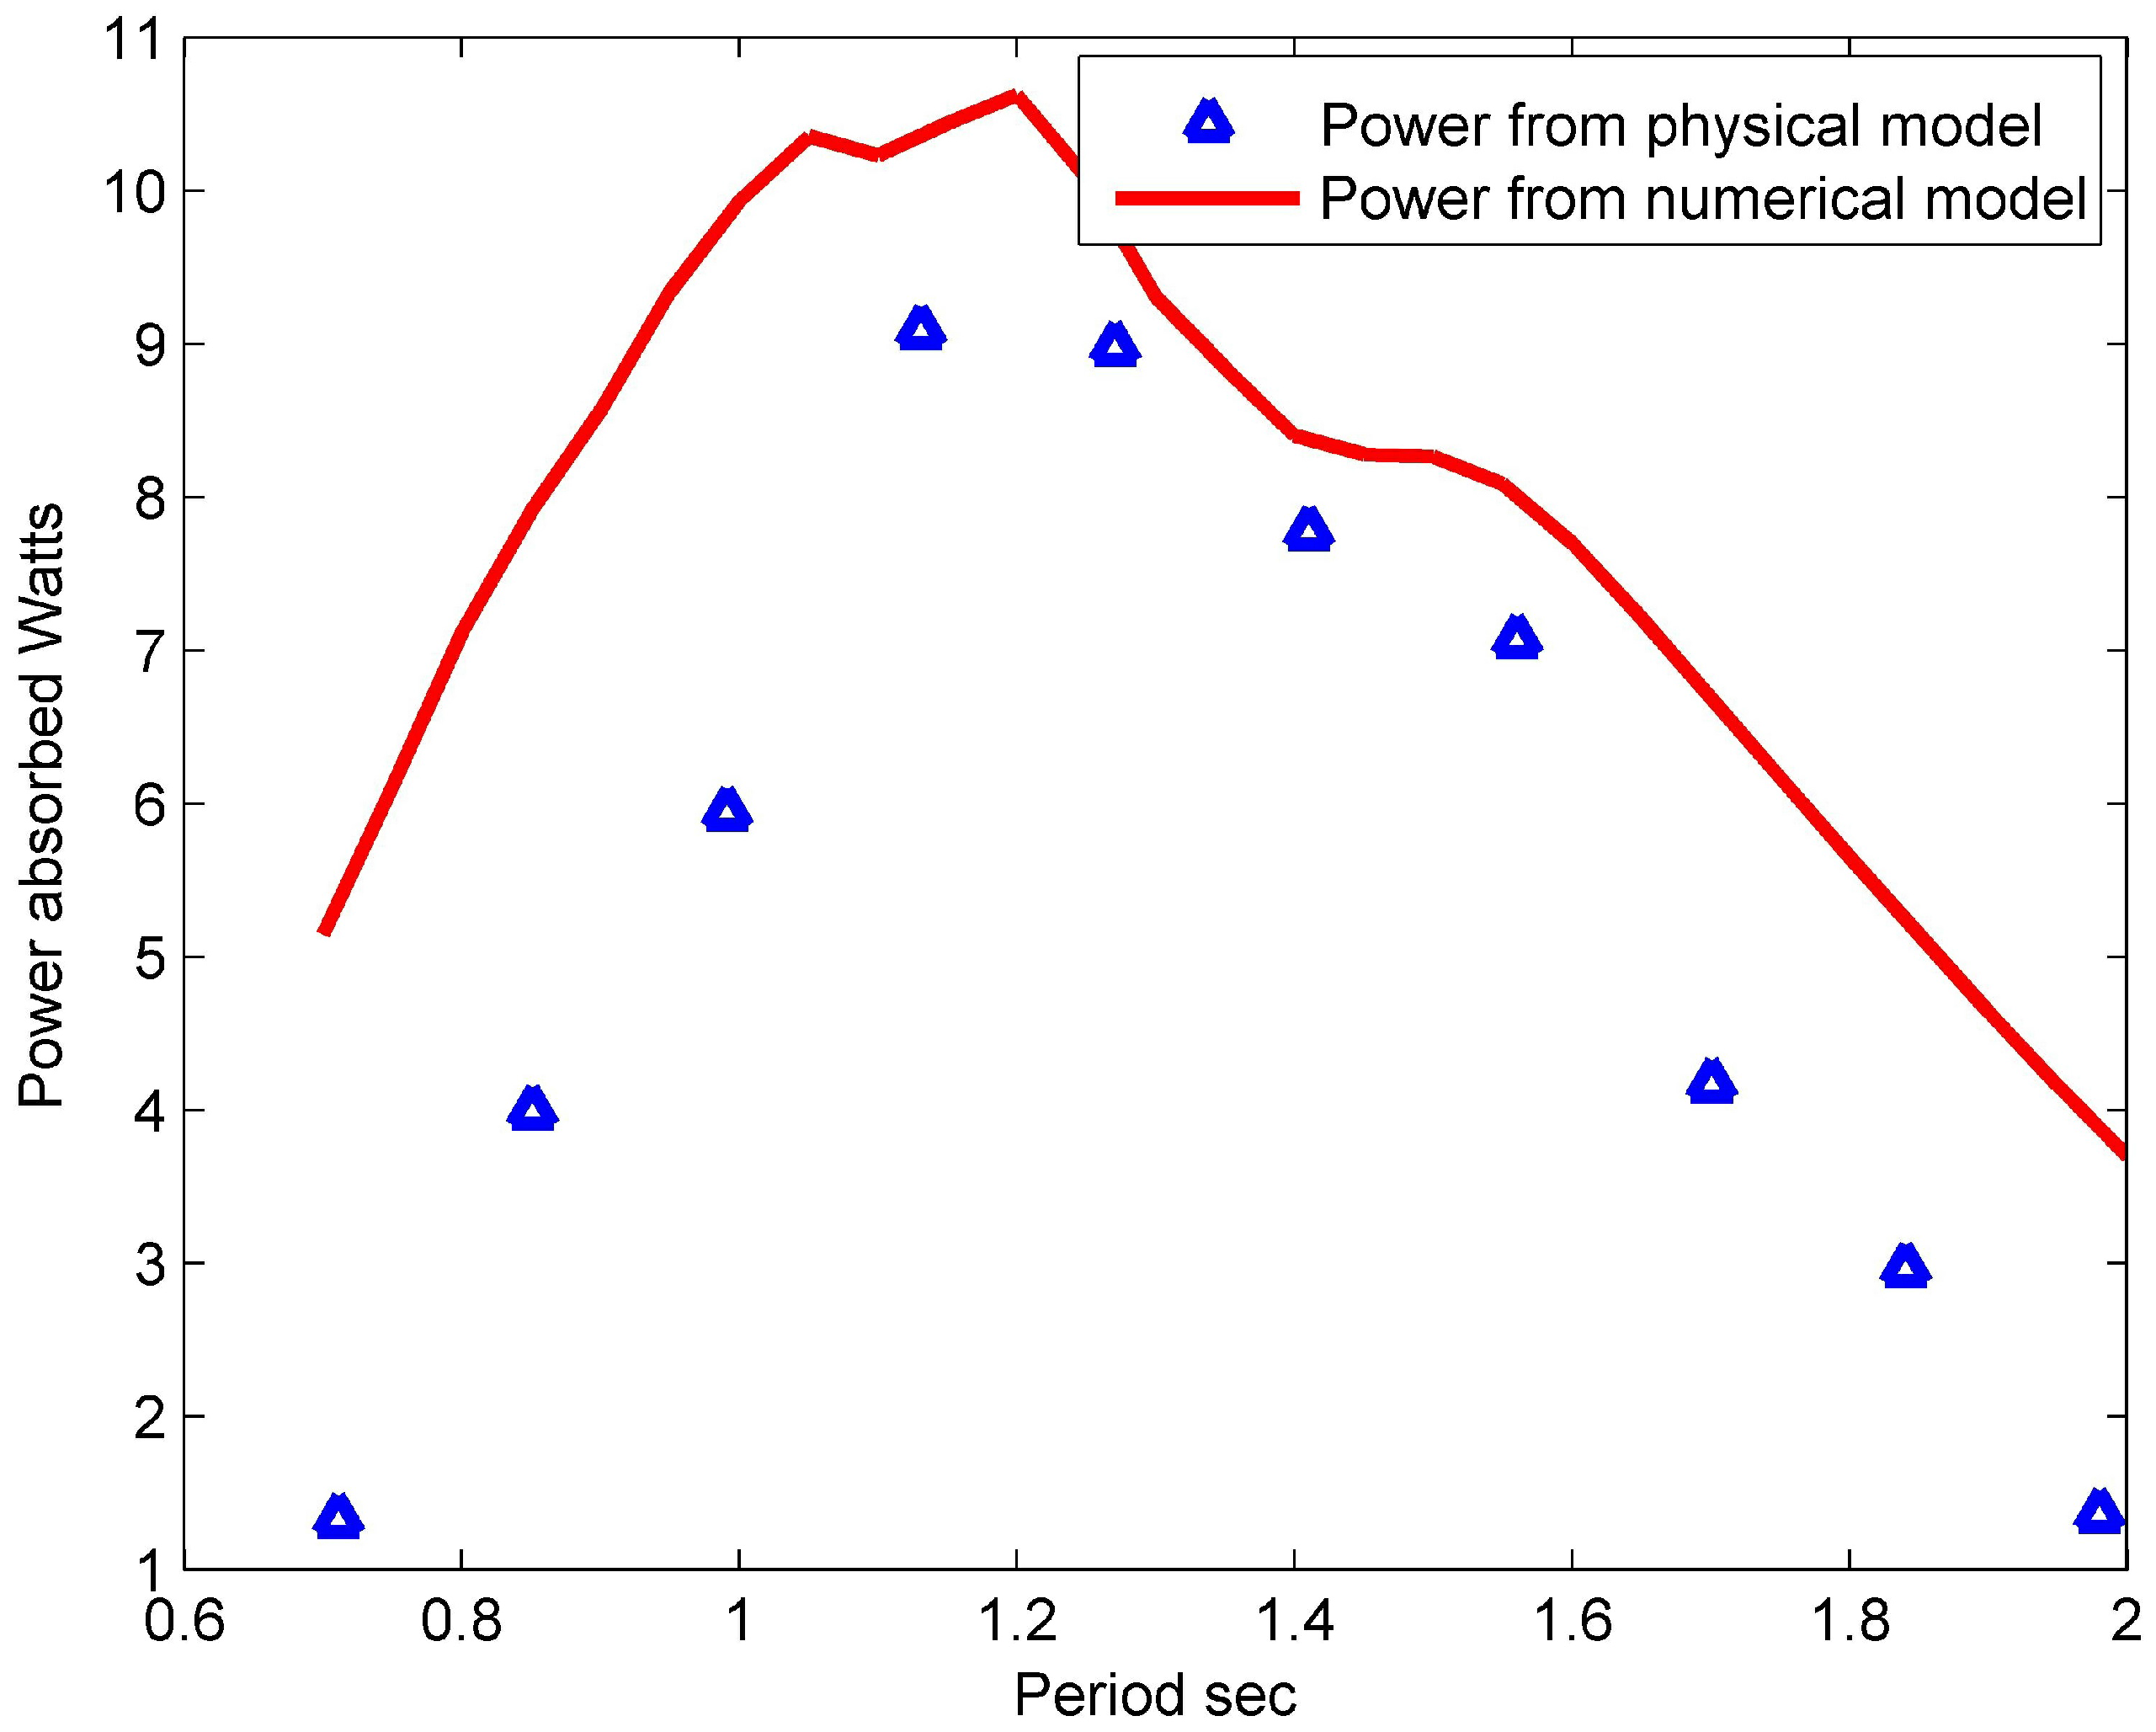
Figure 10 compares the power absorbed by the model with a Venturi throat diameter of 25 mm, as determined by tank testing, to that determined by numerical simulation based on Equation (
27). The averaged linear damping per chamber for this Venturi set was calculated from the test results as 608 Ns/m, and this value was used for all chambers.
Figure 9.
Comparison of calculated power absorbed by the model against a wave period with the 25 mm Venturi set installed and subject to an incident wave amplitude of 30 mm.
Figure 9.
Comparison of calculated power absorbed by the model against a wave period with the 25 mm Venturi set installed and subject to an incident wave amplitude of 30 mm.
Figure 10.
Comparison between power absorbed during tank testing with the 25 mm throat diameter Venturi set installed with the model subject to an incident wave amplitude of 30 mm, and the predicted power absorbed using a value of 608 Ns/m for the power take-off (PTO) damping for each chamber with respect to wave period.
Figure 11,
Figure 12,
Figure 13,
Figure 14,
Figure 15,
Figure 16,
Figure 17 and
Figure 18 illustrate a comparison between the heave RAOs of the water columns as determined experimentally and numerically. The water column motions have been referenced to the still water level, as described in Equation (
7), and are not relative to the platform. The chambers are labelled sequentially from OWC 1 to OWC 16, with OWC 1 at the rear of the model leg and OWC 16 at the bow of the model, as illustrated in
Figure 6. The numerical RAOs were determined by solving Equation (
20) in MATLAB using the hydrodynamic properties from WAMIT, in conjunction with the linear damping determined using Equation (
26). WAMIT may also be used to determine the RAOs of each mode of motion directly, provided that the external PTO damping and mass matrices are included in the WAMIT input files. In fact, the RAOs generated by the MATLAB routine were found to be in exact agreement with the RAOs produced by WAMIT. The benefit of calculating the platform motions, and, thus, the power absorbed, from the numerical model in MATLAB is that the effect of varying the values in the PTO matrix may be quickly investigated, without the need to re-run WAMIT once confidence in the results has been established.
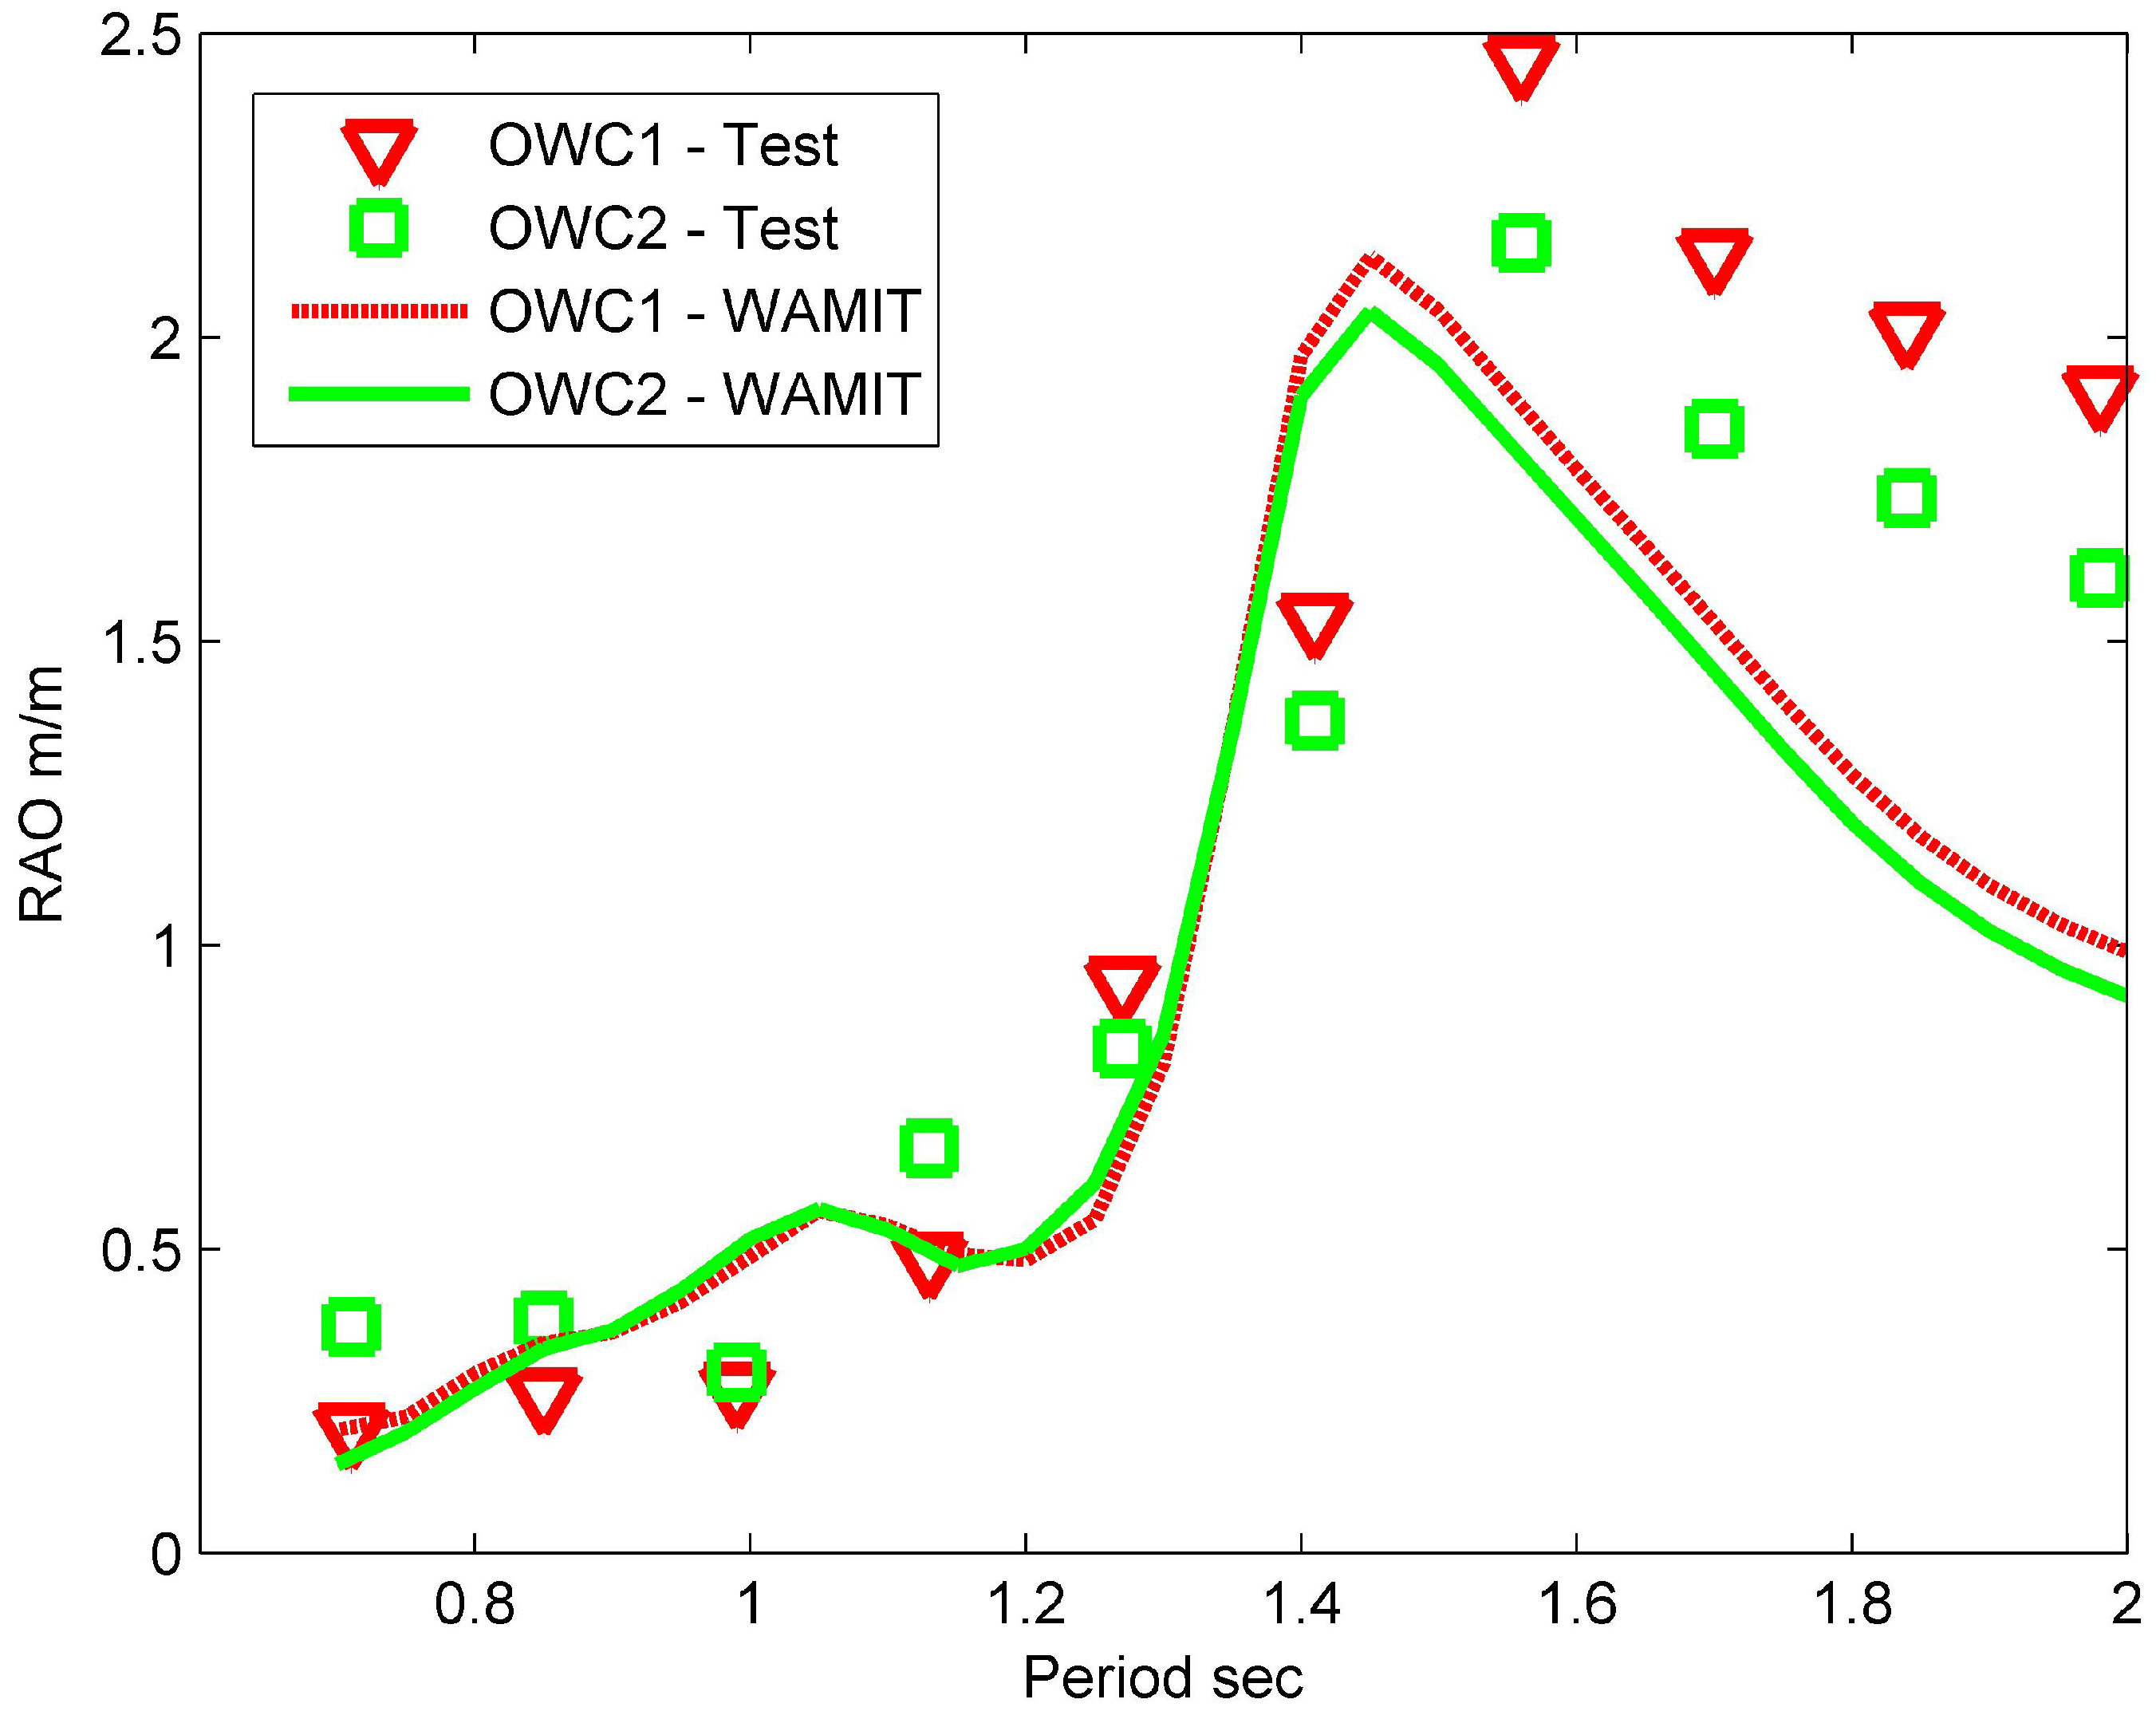
Figure 11.
Comparison between the experimentally and numerically determined water column Response Amplitude Operators (RAOs) for chambers 1 and 2 using the 25 mm throat diameter Venturi set with the model subject to an incident wave amplitude of 30 mm, against the incident wave period.
Figure 11.
Comparison between the experimentally and numerically determined water column Response Amplitude Operators (RAOs) for chambers 1 and 2 using the 25 mm throat diameter Venturi set with the model subject to an incident wave amplitude of 30 mm, against the incident wave period.
Figure 12.
Comparison between the experimentally and numerically determined water column RAOs for chambers 3 and 4 using the 25 mm throat diameter Venturi set with the model subject to an incident wave amplitude of 30 mm, against incident wave period.
Figure 12.
Comparison between the experimentally and numerically determined water column RAOs for chambers 3 and 4 using the 25 mm throat diameter Venturi set with the model subject to an incident wave amplitude of 30 mm, against incident wave period.
Figure 13.
Comparison between the experimentally and numerically determined water column RAOs for chambers 5 and 6 using the 25 mm throat diameter Venturi set with the model subject to an incident wave amplitude of 30 mm, against the incident wave period.
Figure 13.
Comparison between the experimentally and numerically determined water column RAOs for chambers 5 and 6 using the 25 mm throat diameter Venturi set with the model subject to an incident wave amplitude of 30 mm, against the incident wave period.
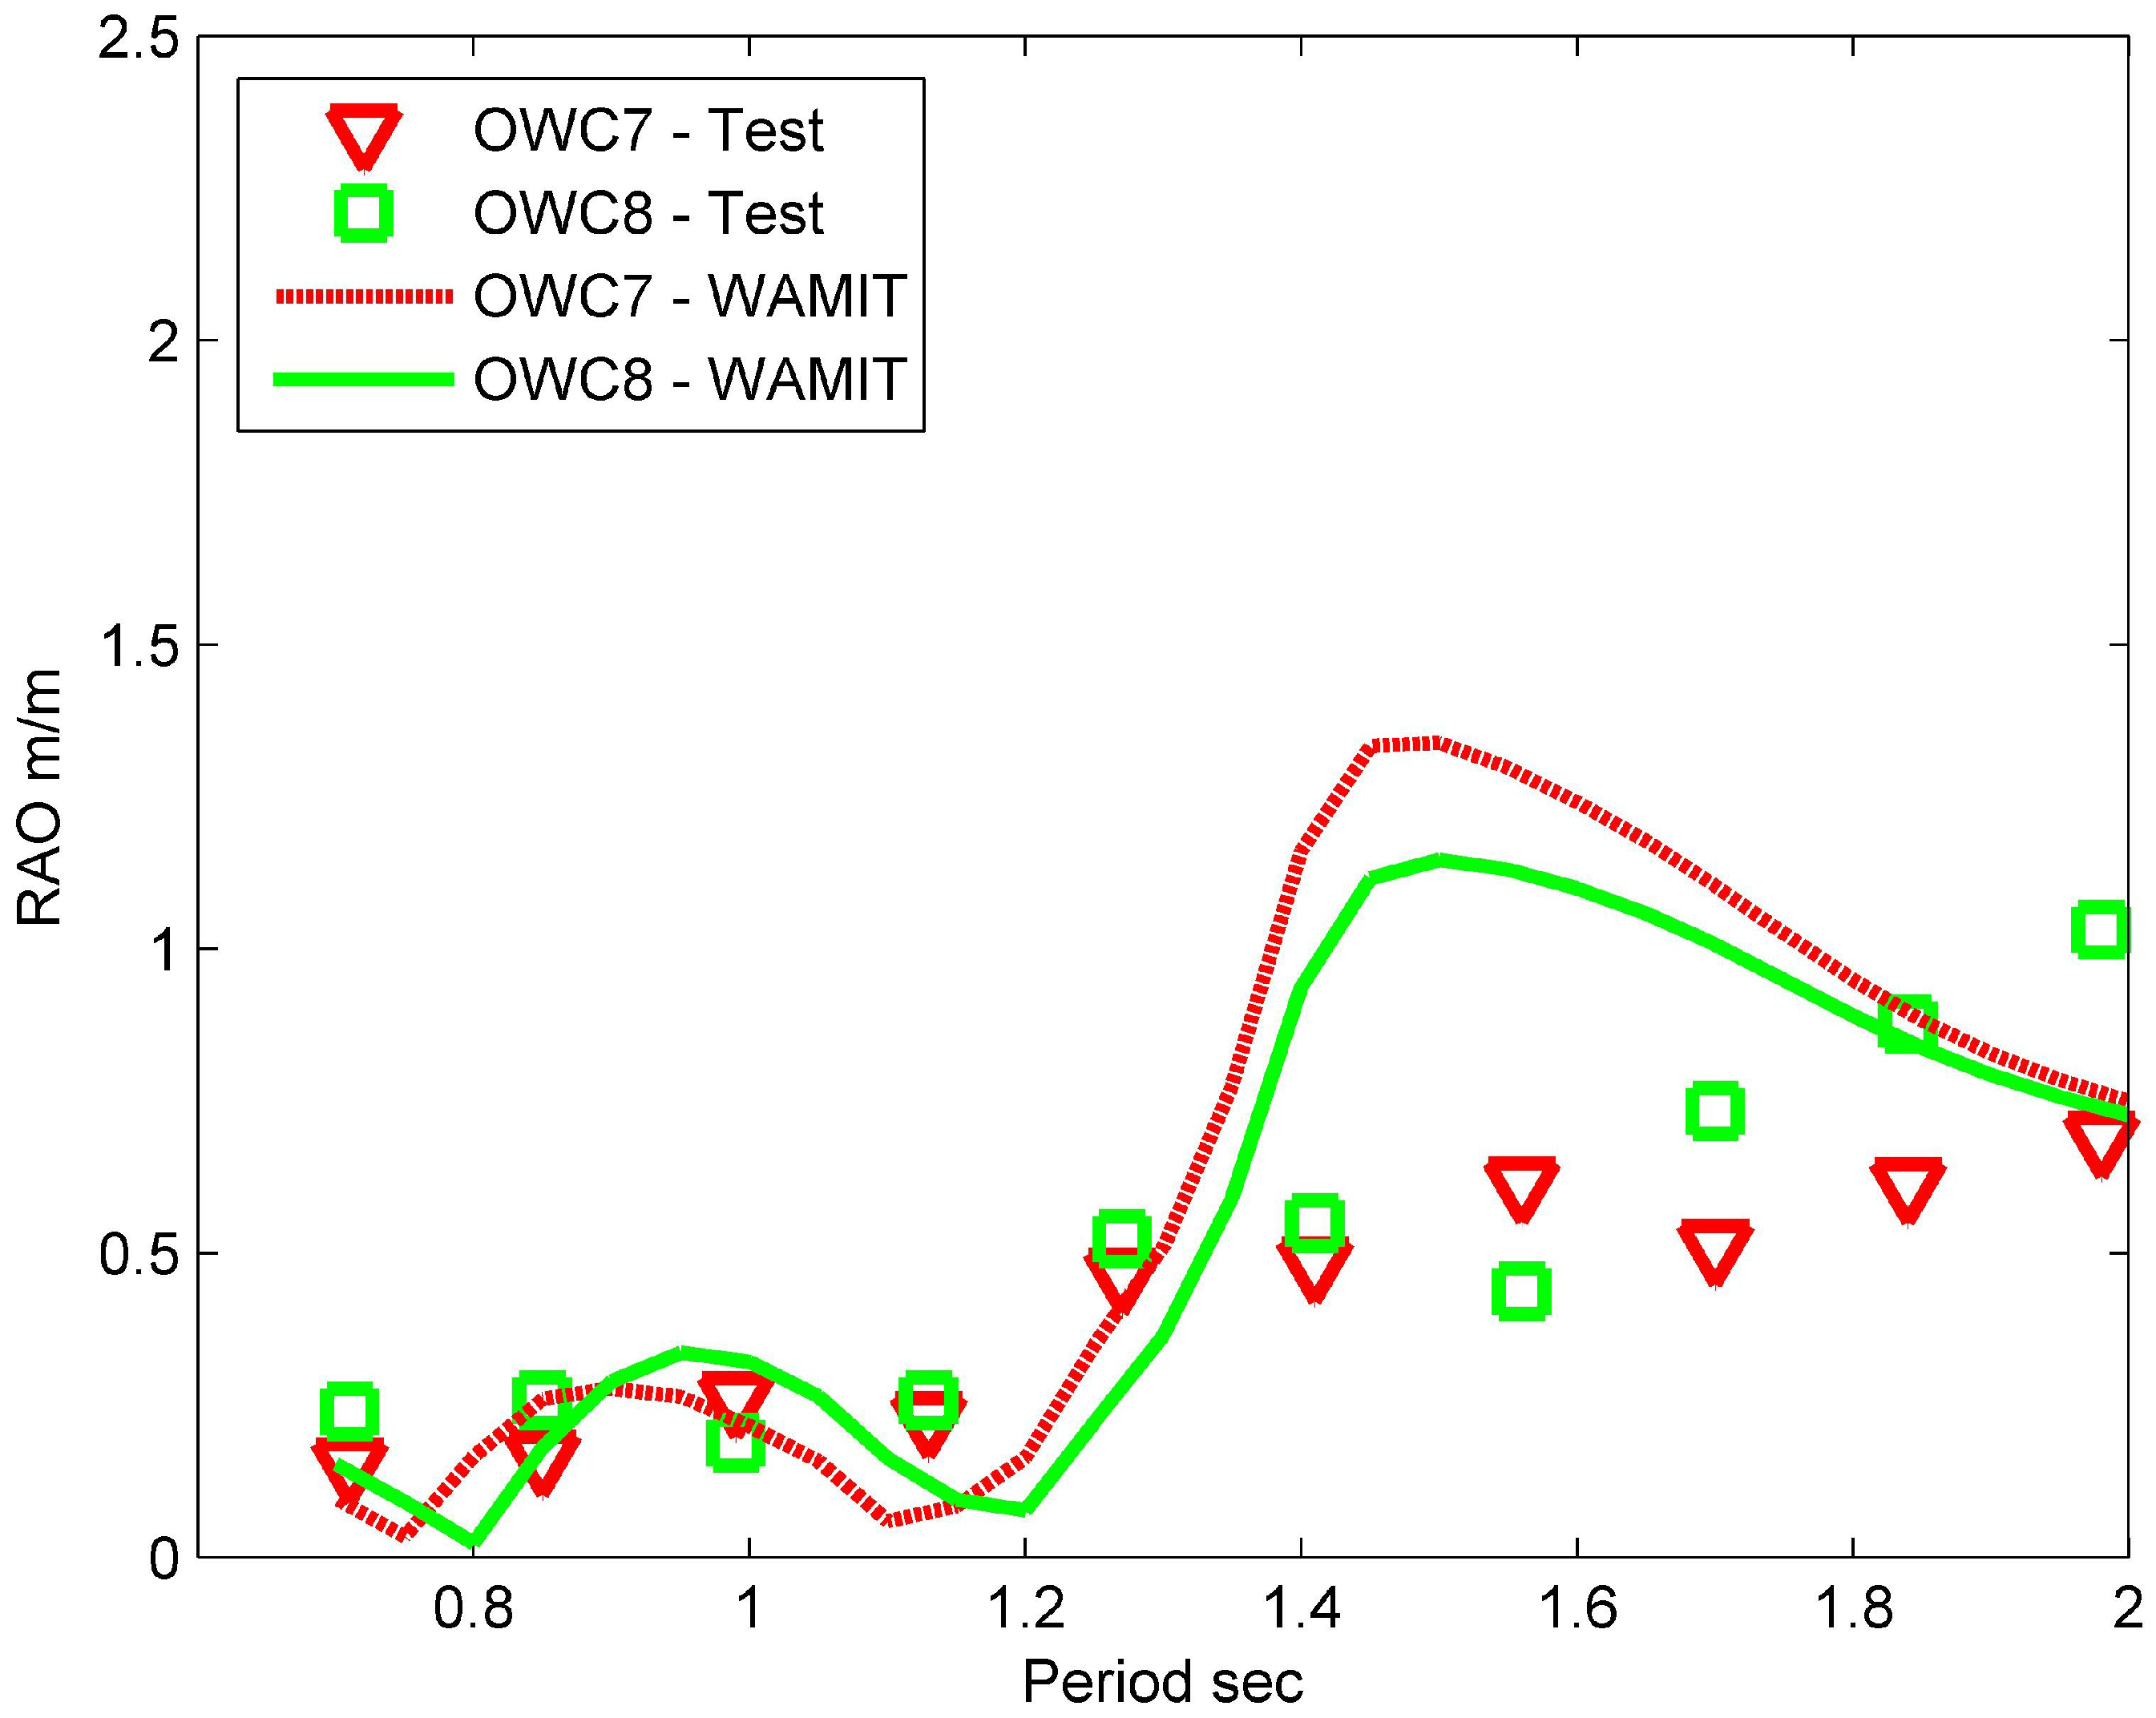
Figure 14.
Comparison between the experimentally and numerically determined water column RAOs for chambers 7 and 8 using the 25 mm throat diameter Venturi set with the model subject to an incident wave amplitude of 30 mm, against the incident wave period.
Figure 14.
Comparison between the experimentally and numerically determined water column RAOs for chambers 7 and 8 using the 25 mm throat diameter Venturi set with the model subject to an incident wave amplitude of 30 mm, against the incident wave period.
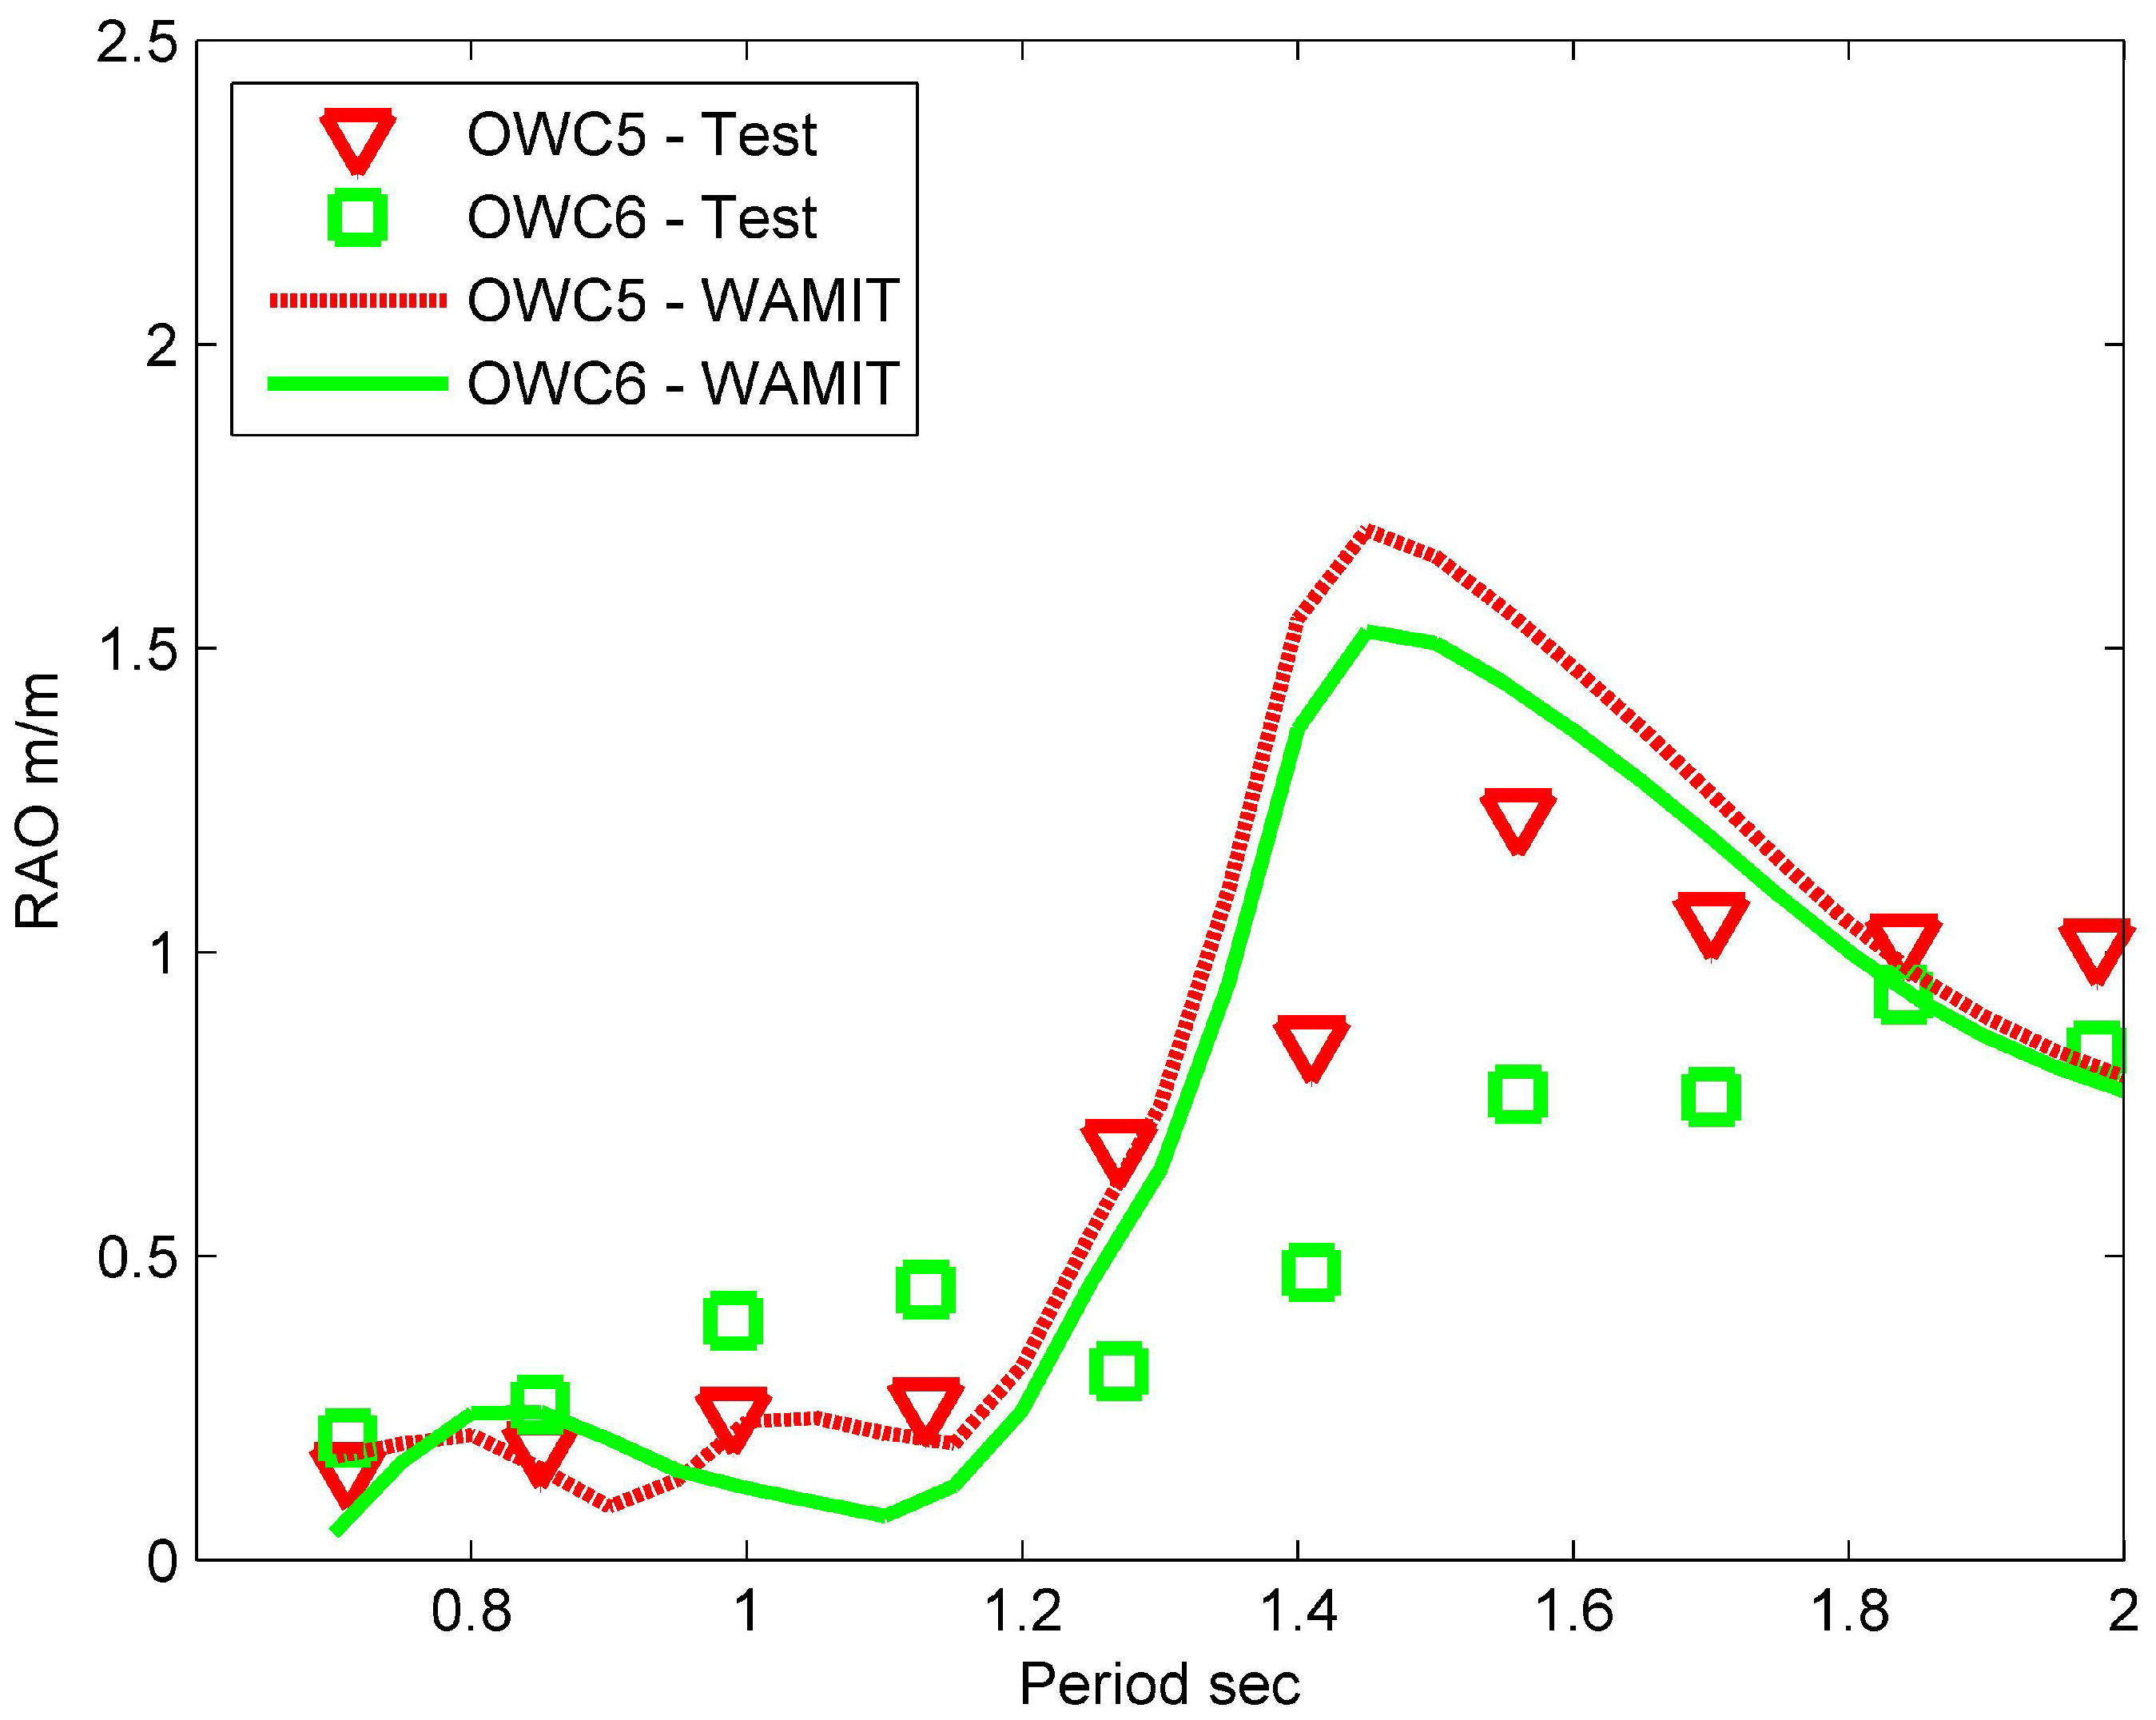
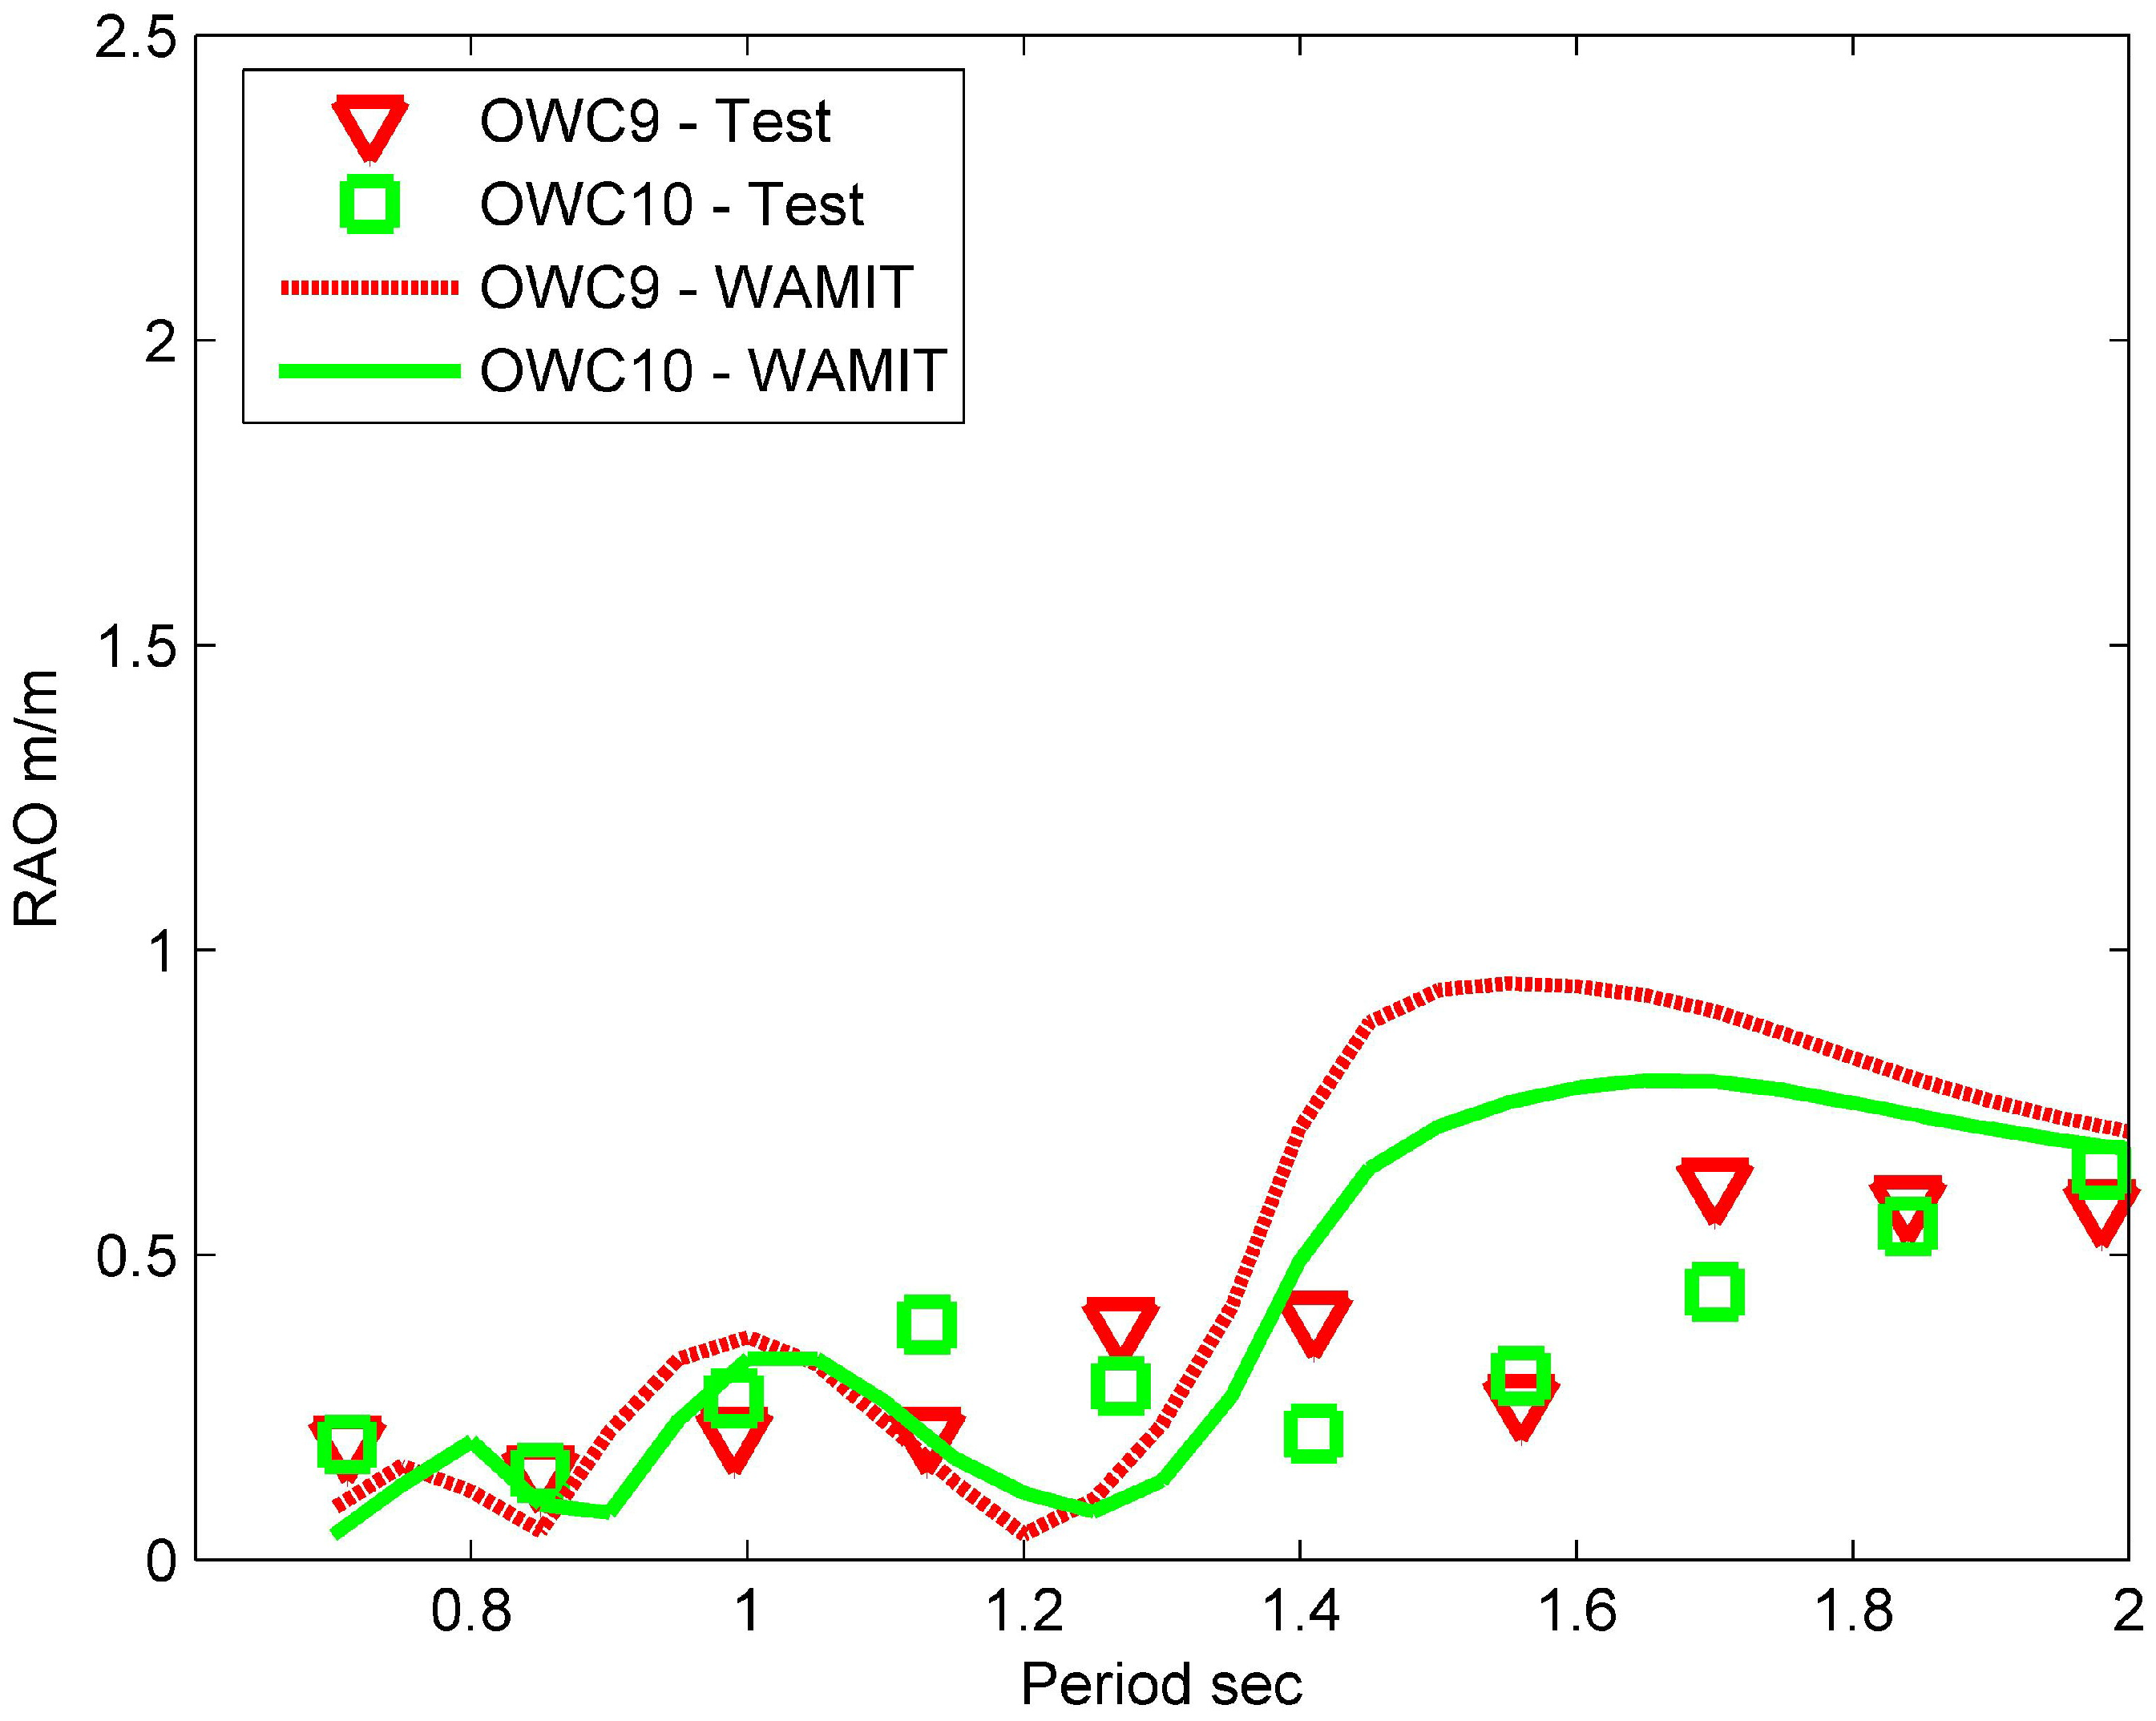
Figure 15.
Comparison between the experimentally and numerically determined water column RAOs for chambers 9 and 10 using the 25 mm throat diameter Venturi set with the model subject to an incident wave amplitude of 30 mm, against the incident wave period.
Figure 15.
Comparison between the experimentally and numerically determined water column RAOs for chambers 9 and 10 using the 25 mm throat diameter Venturi set with the model subject to an incident wave amplitude of 30 mm, against the incident wave period.
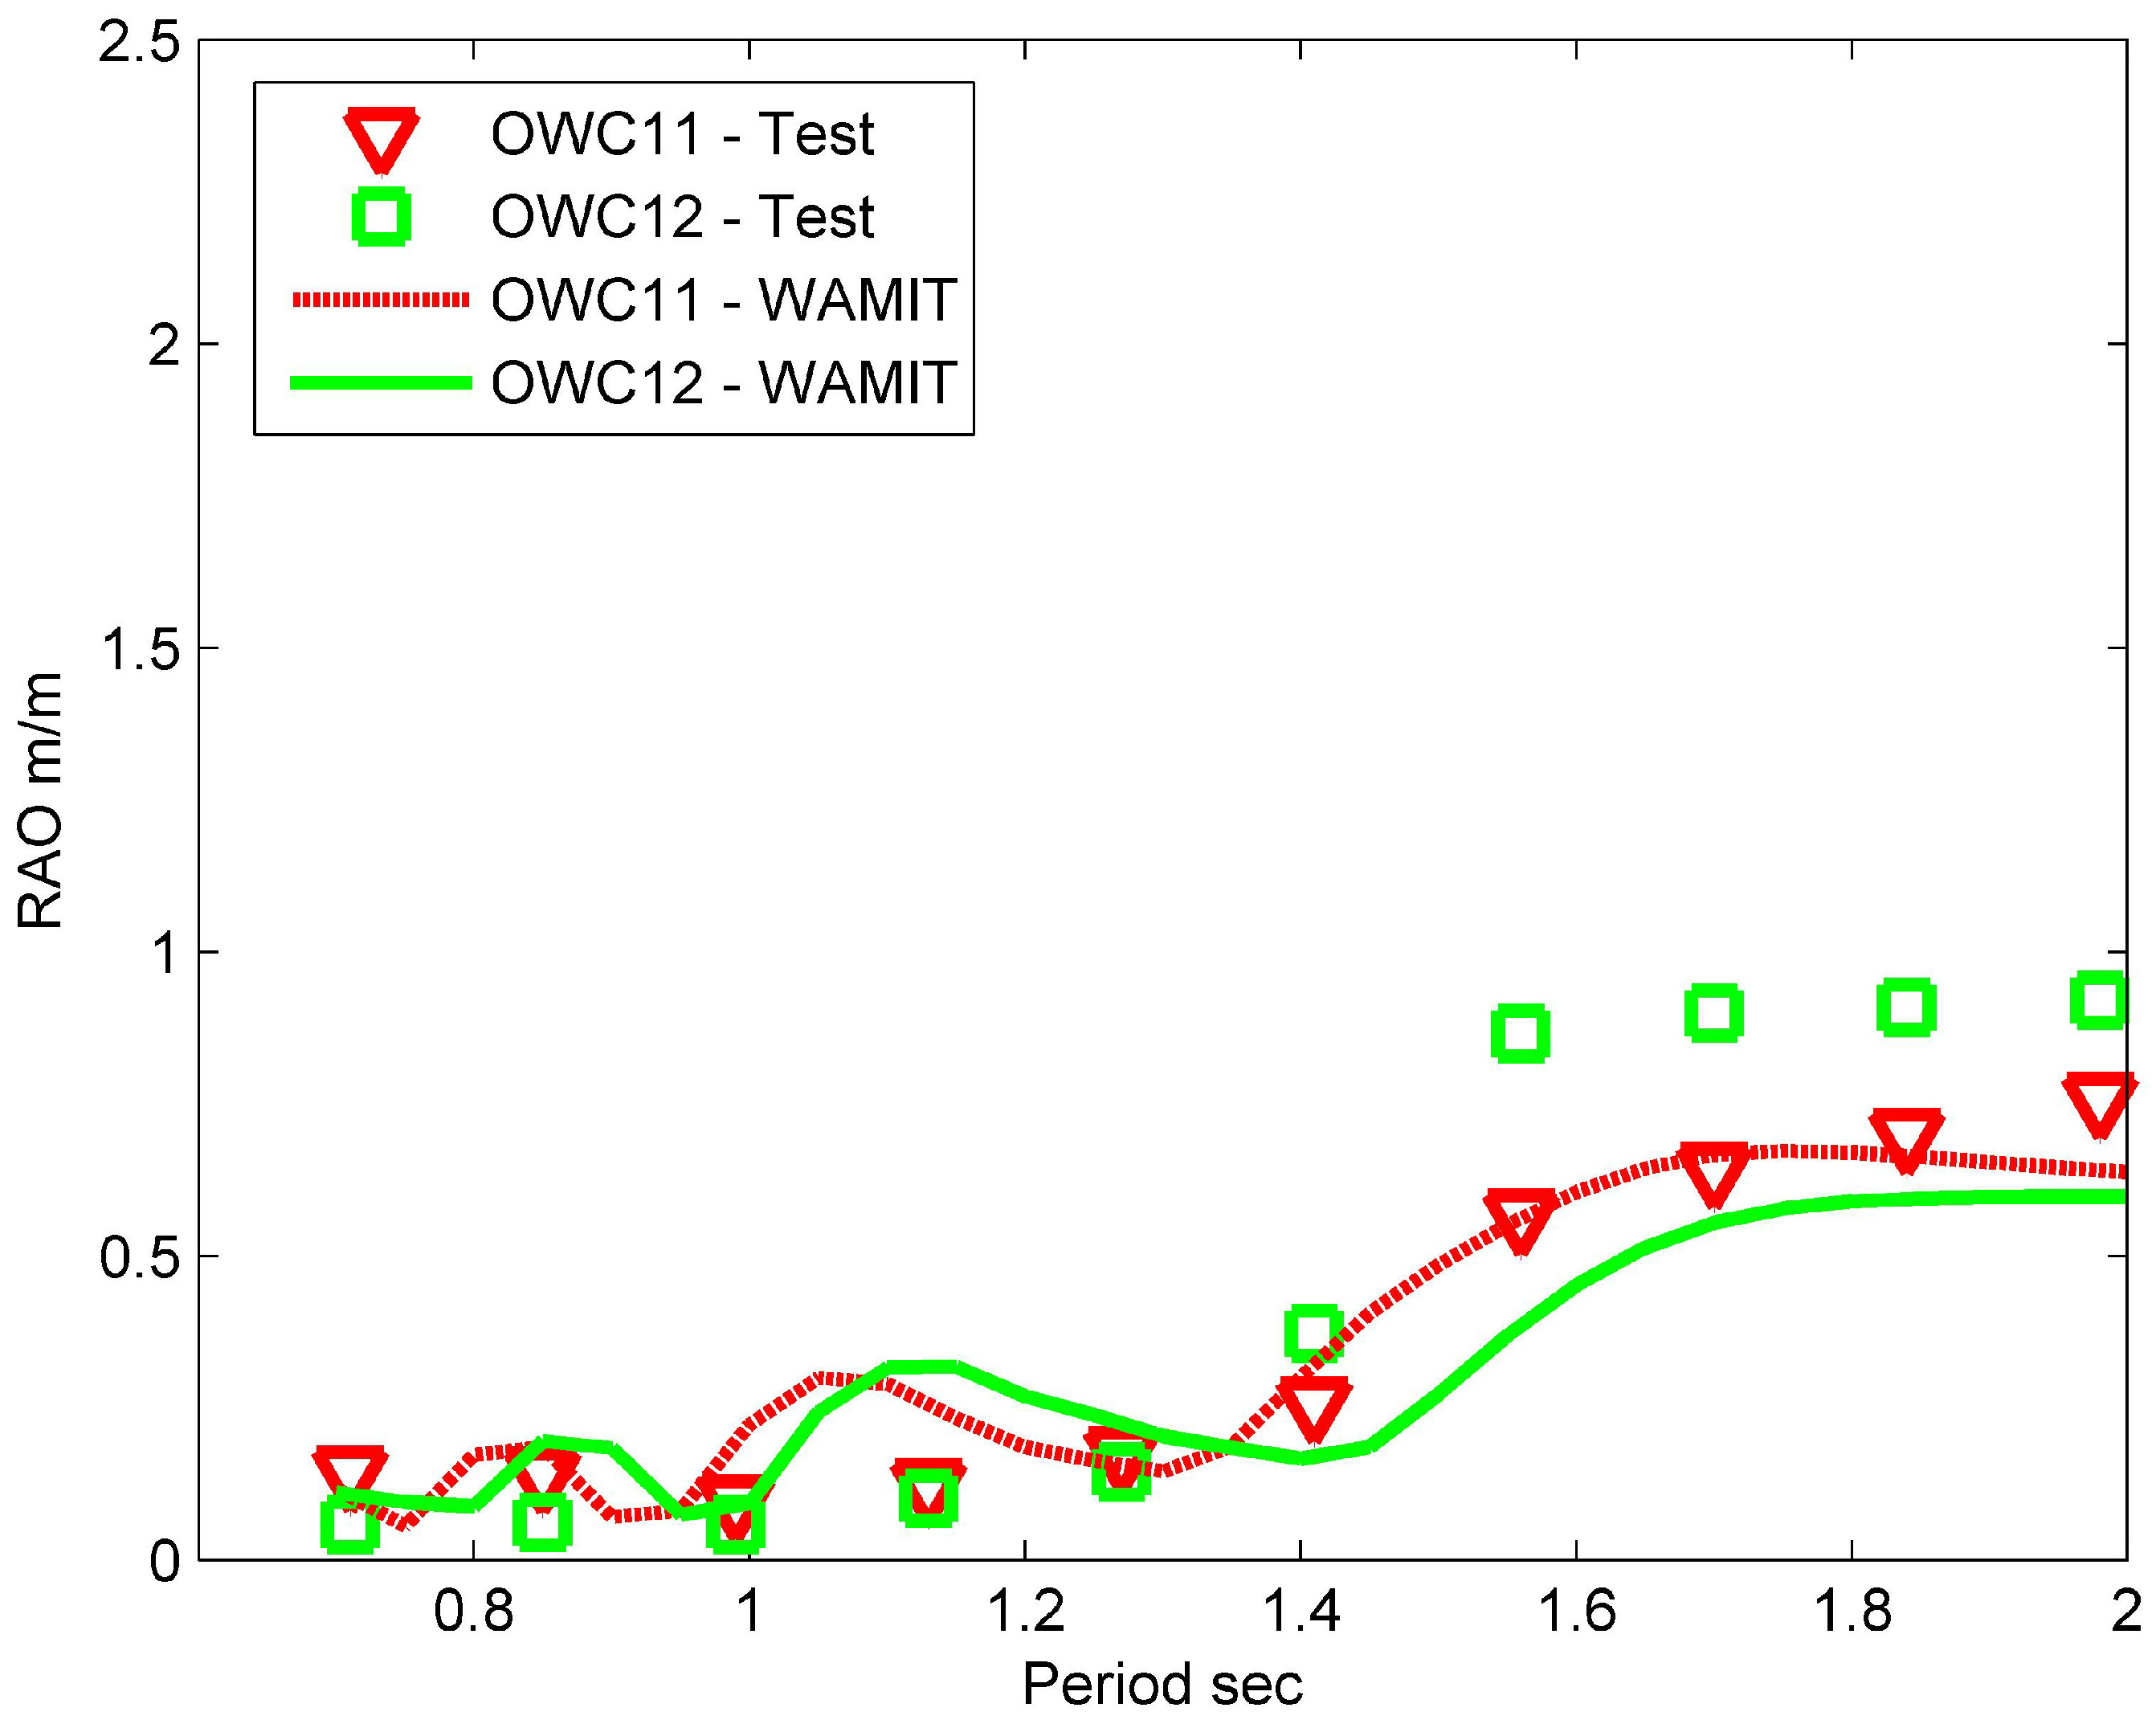
Figure 16.
Comparison between the experimentally and numerically determined water column RAOs for chambers 11 and 12 using the 25 mm throat diameter Venturi set with the model subject to an incident wave amplitude of 30 mm, against the incident wave period.
Figure 16.
Comparison between the experimentally and numerically determined water column RAOs for chambers 11 and 12 using the 25 mm throat diameter Venturi set with the model subject to an incident wave amplitude of 30 mm, against the incident wave period.
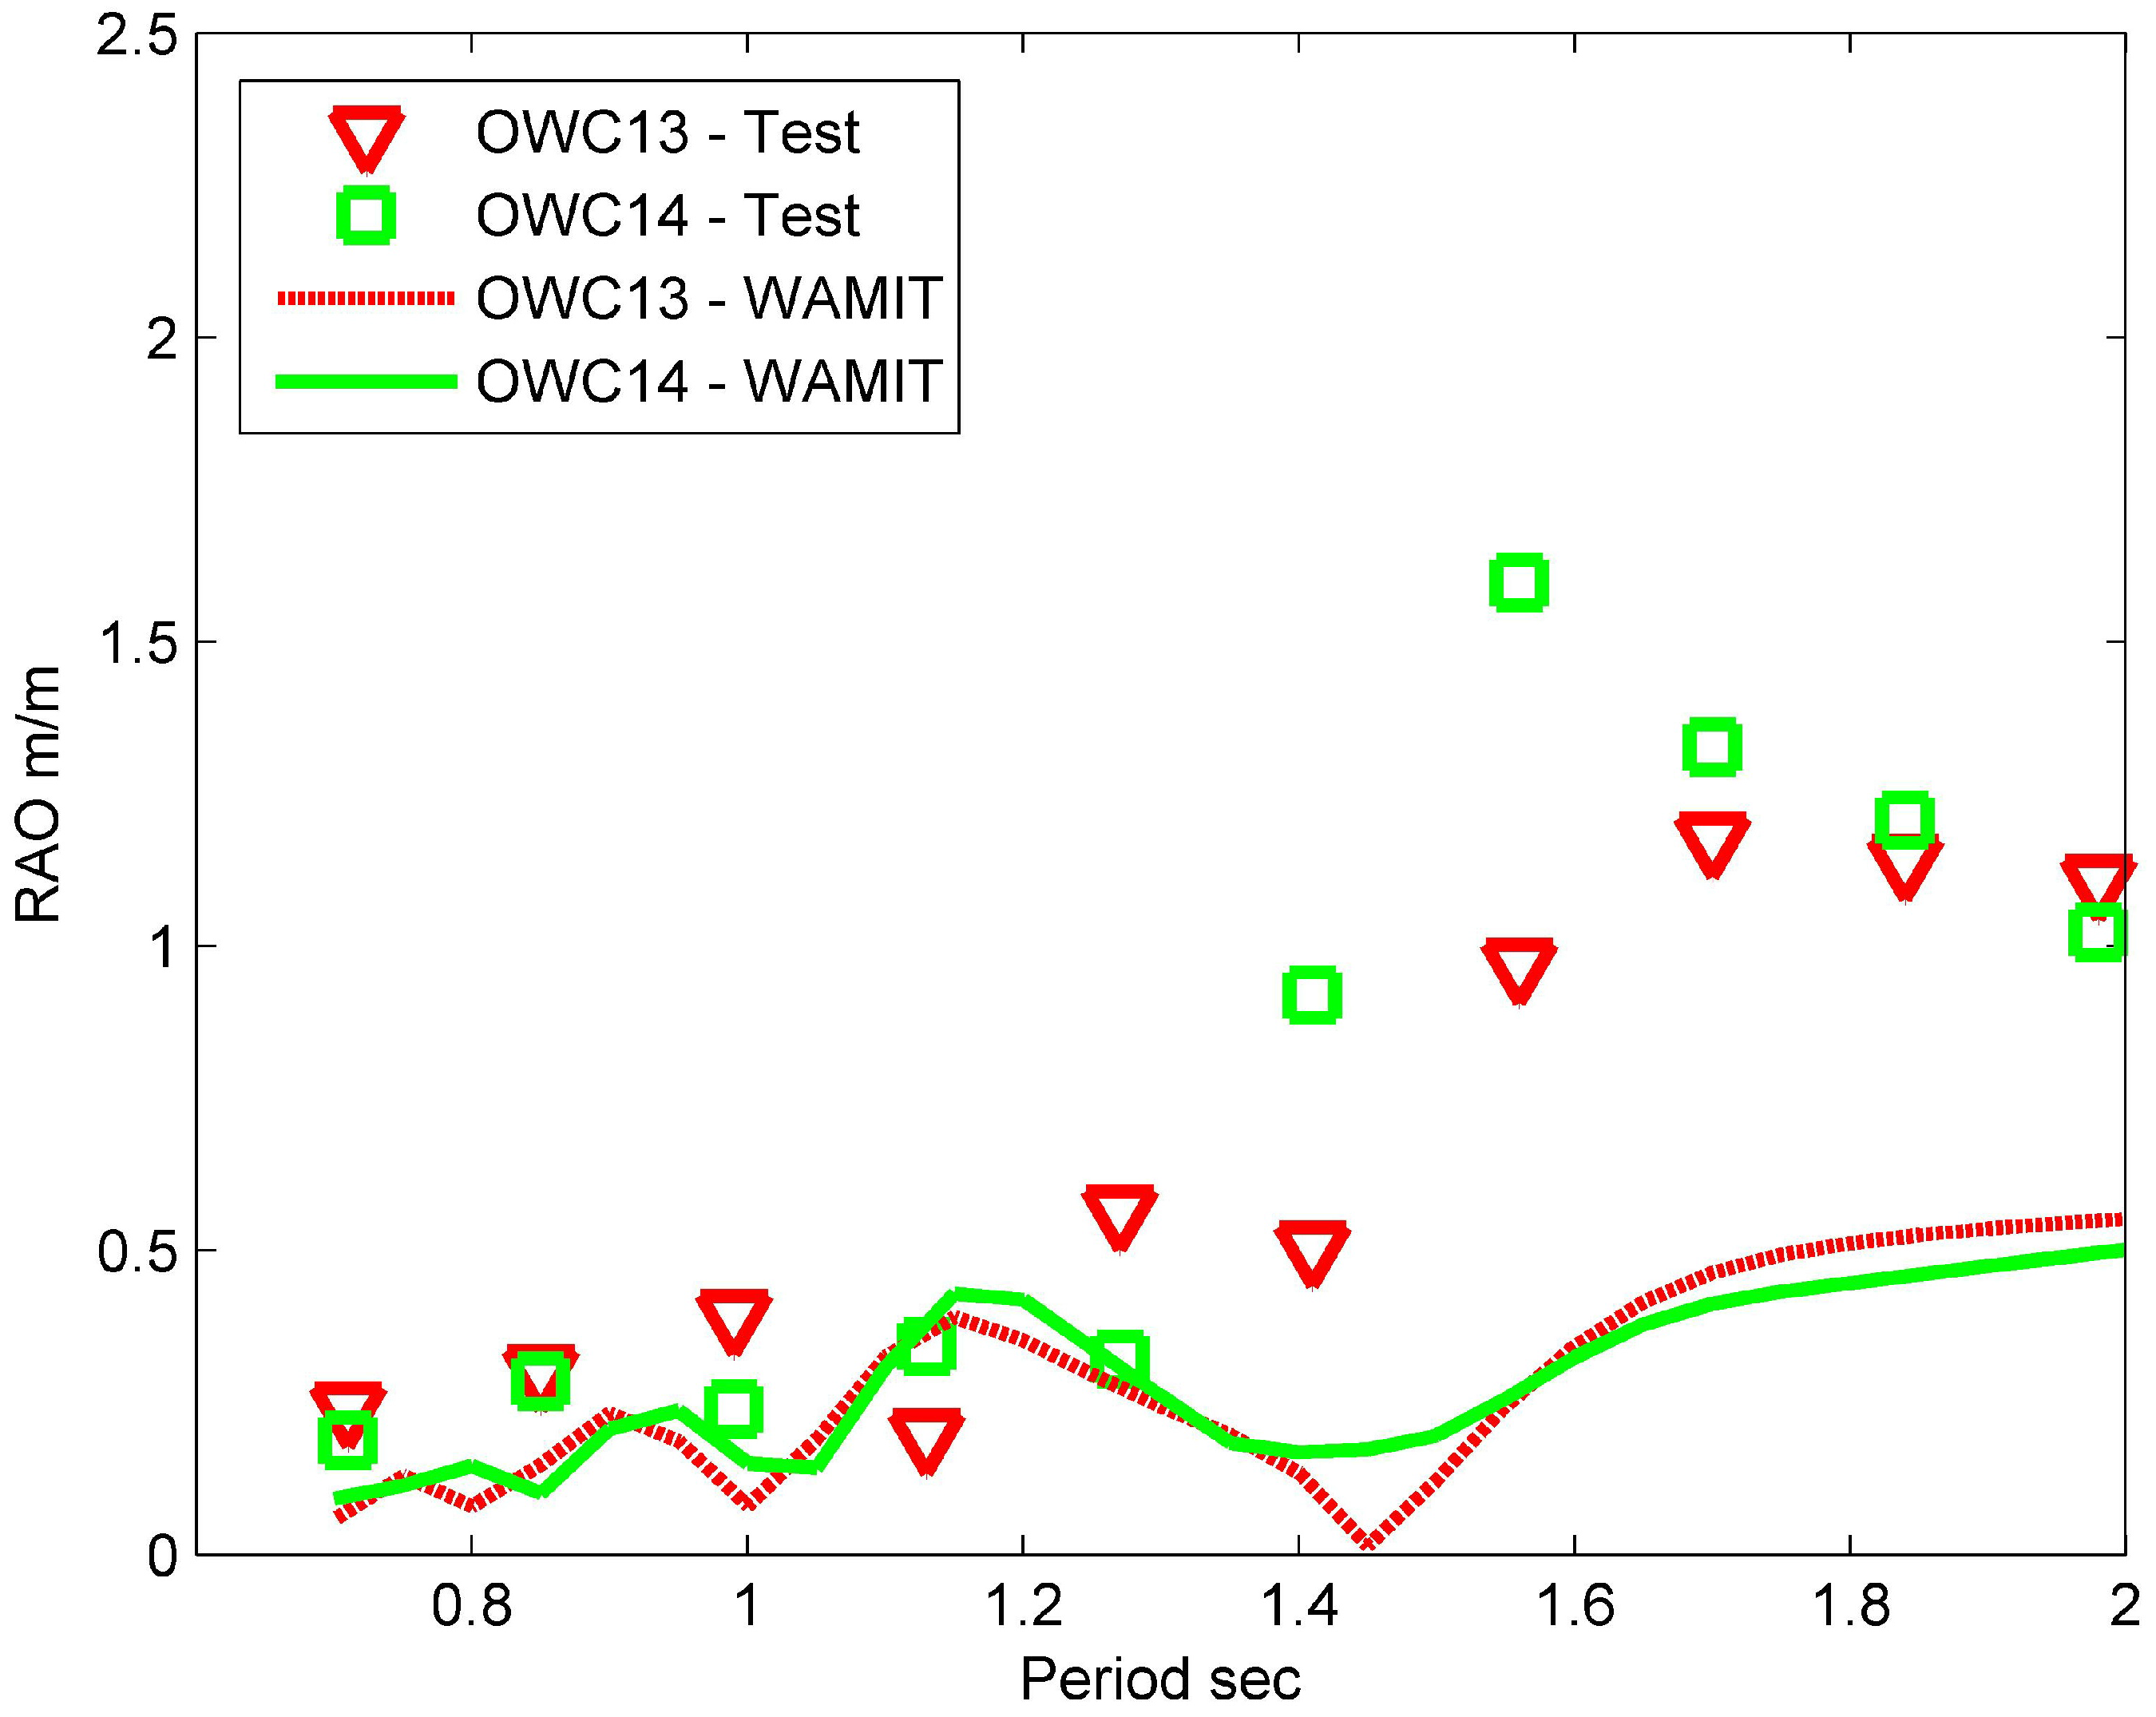
Figure 17.
Comparison between the experimentally and numerically determined water column RAOs for chambers 13 and 14 using the 25 mm throat diameter Venturi set with the model subject to an incident wave amplitude of 30 mm, against the incident wave period.
Figure 17.
Comparison between the experimentally and numerically determined water column RAOs for chambers 13 and 14 using the 25 mm throat diameter Venturi set with the model subject to an incident wave amplitude of 30 mm, against the incident wave period.
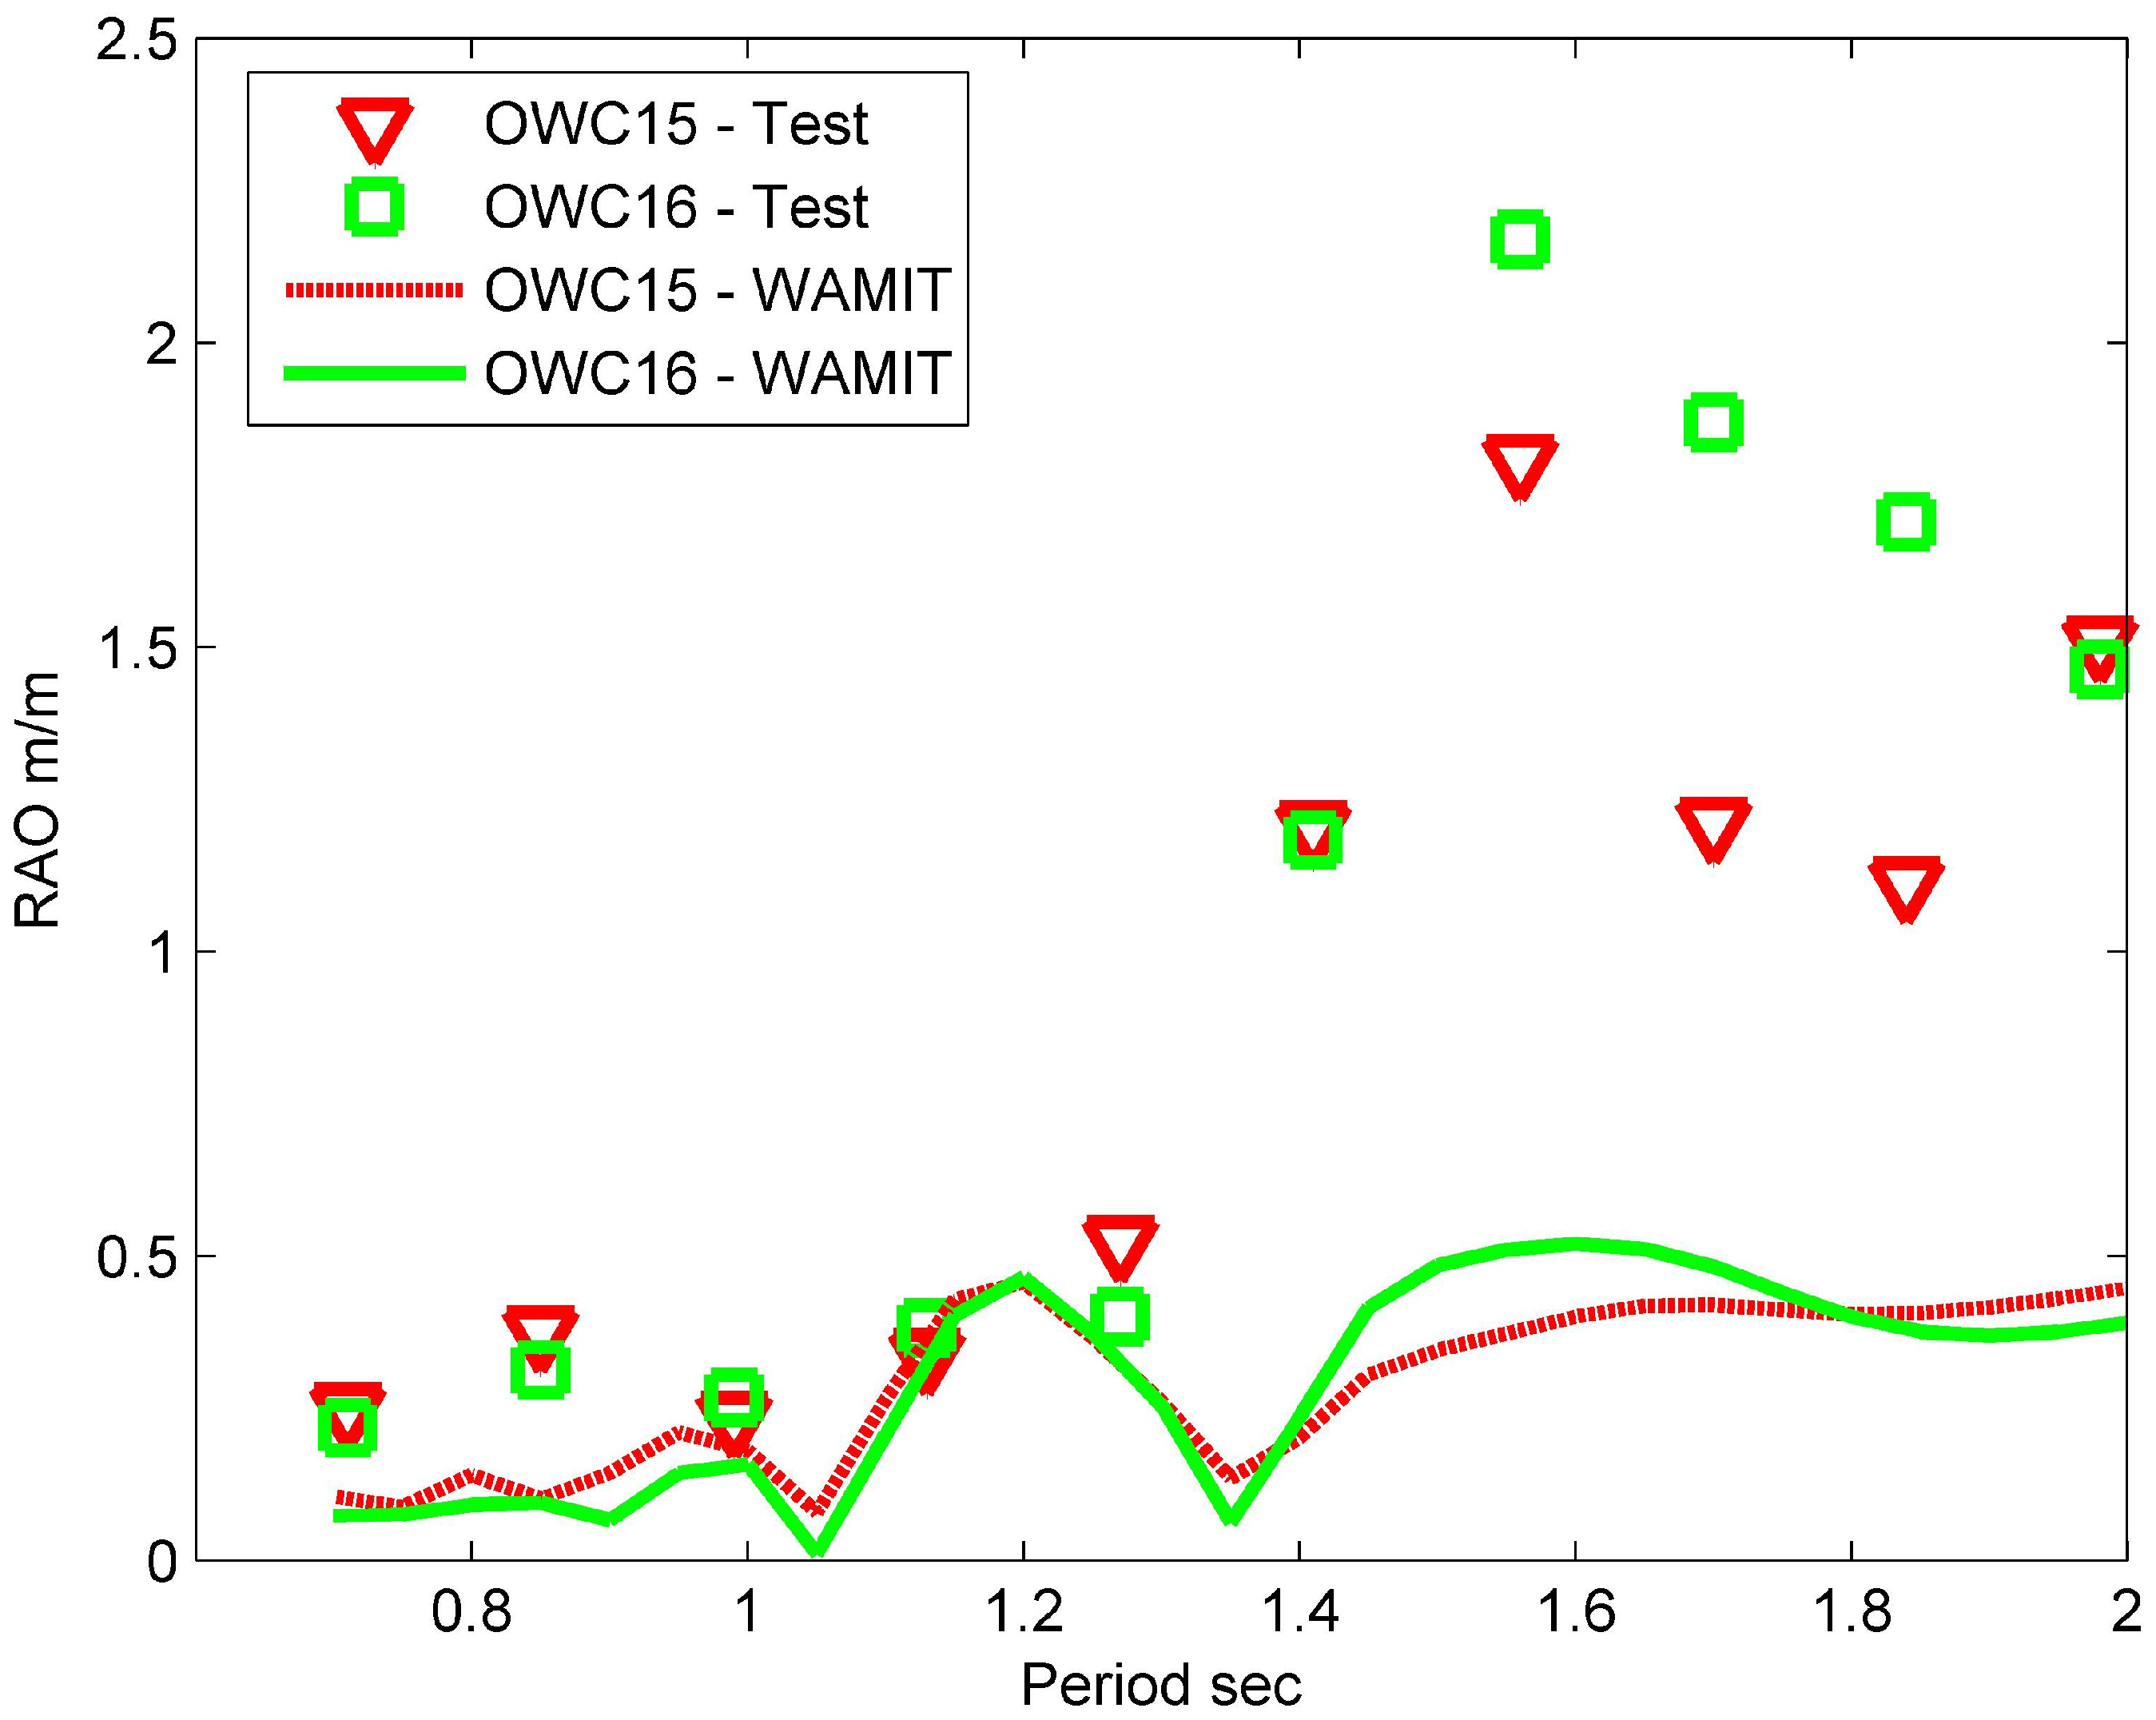
Figure 18.
Comparison between the experimentally and numerically determined water column RAOs for chambers 15 and 16 using the 25 mm throat diameter Venturi set with the model subject to an incident wave amplitude of 30 mm, against the incident wave period.
Figure 18.
Comparison between the experimentally and numerically determined water column RAOs for chambers 15 and 16 using the 25 mm throat diameter Venturi set with the model subject to an incident wave amplitude of 30 mm, against the incident wave period.
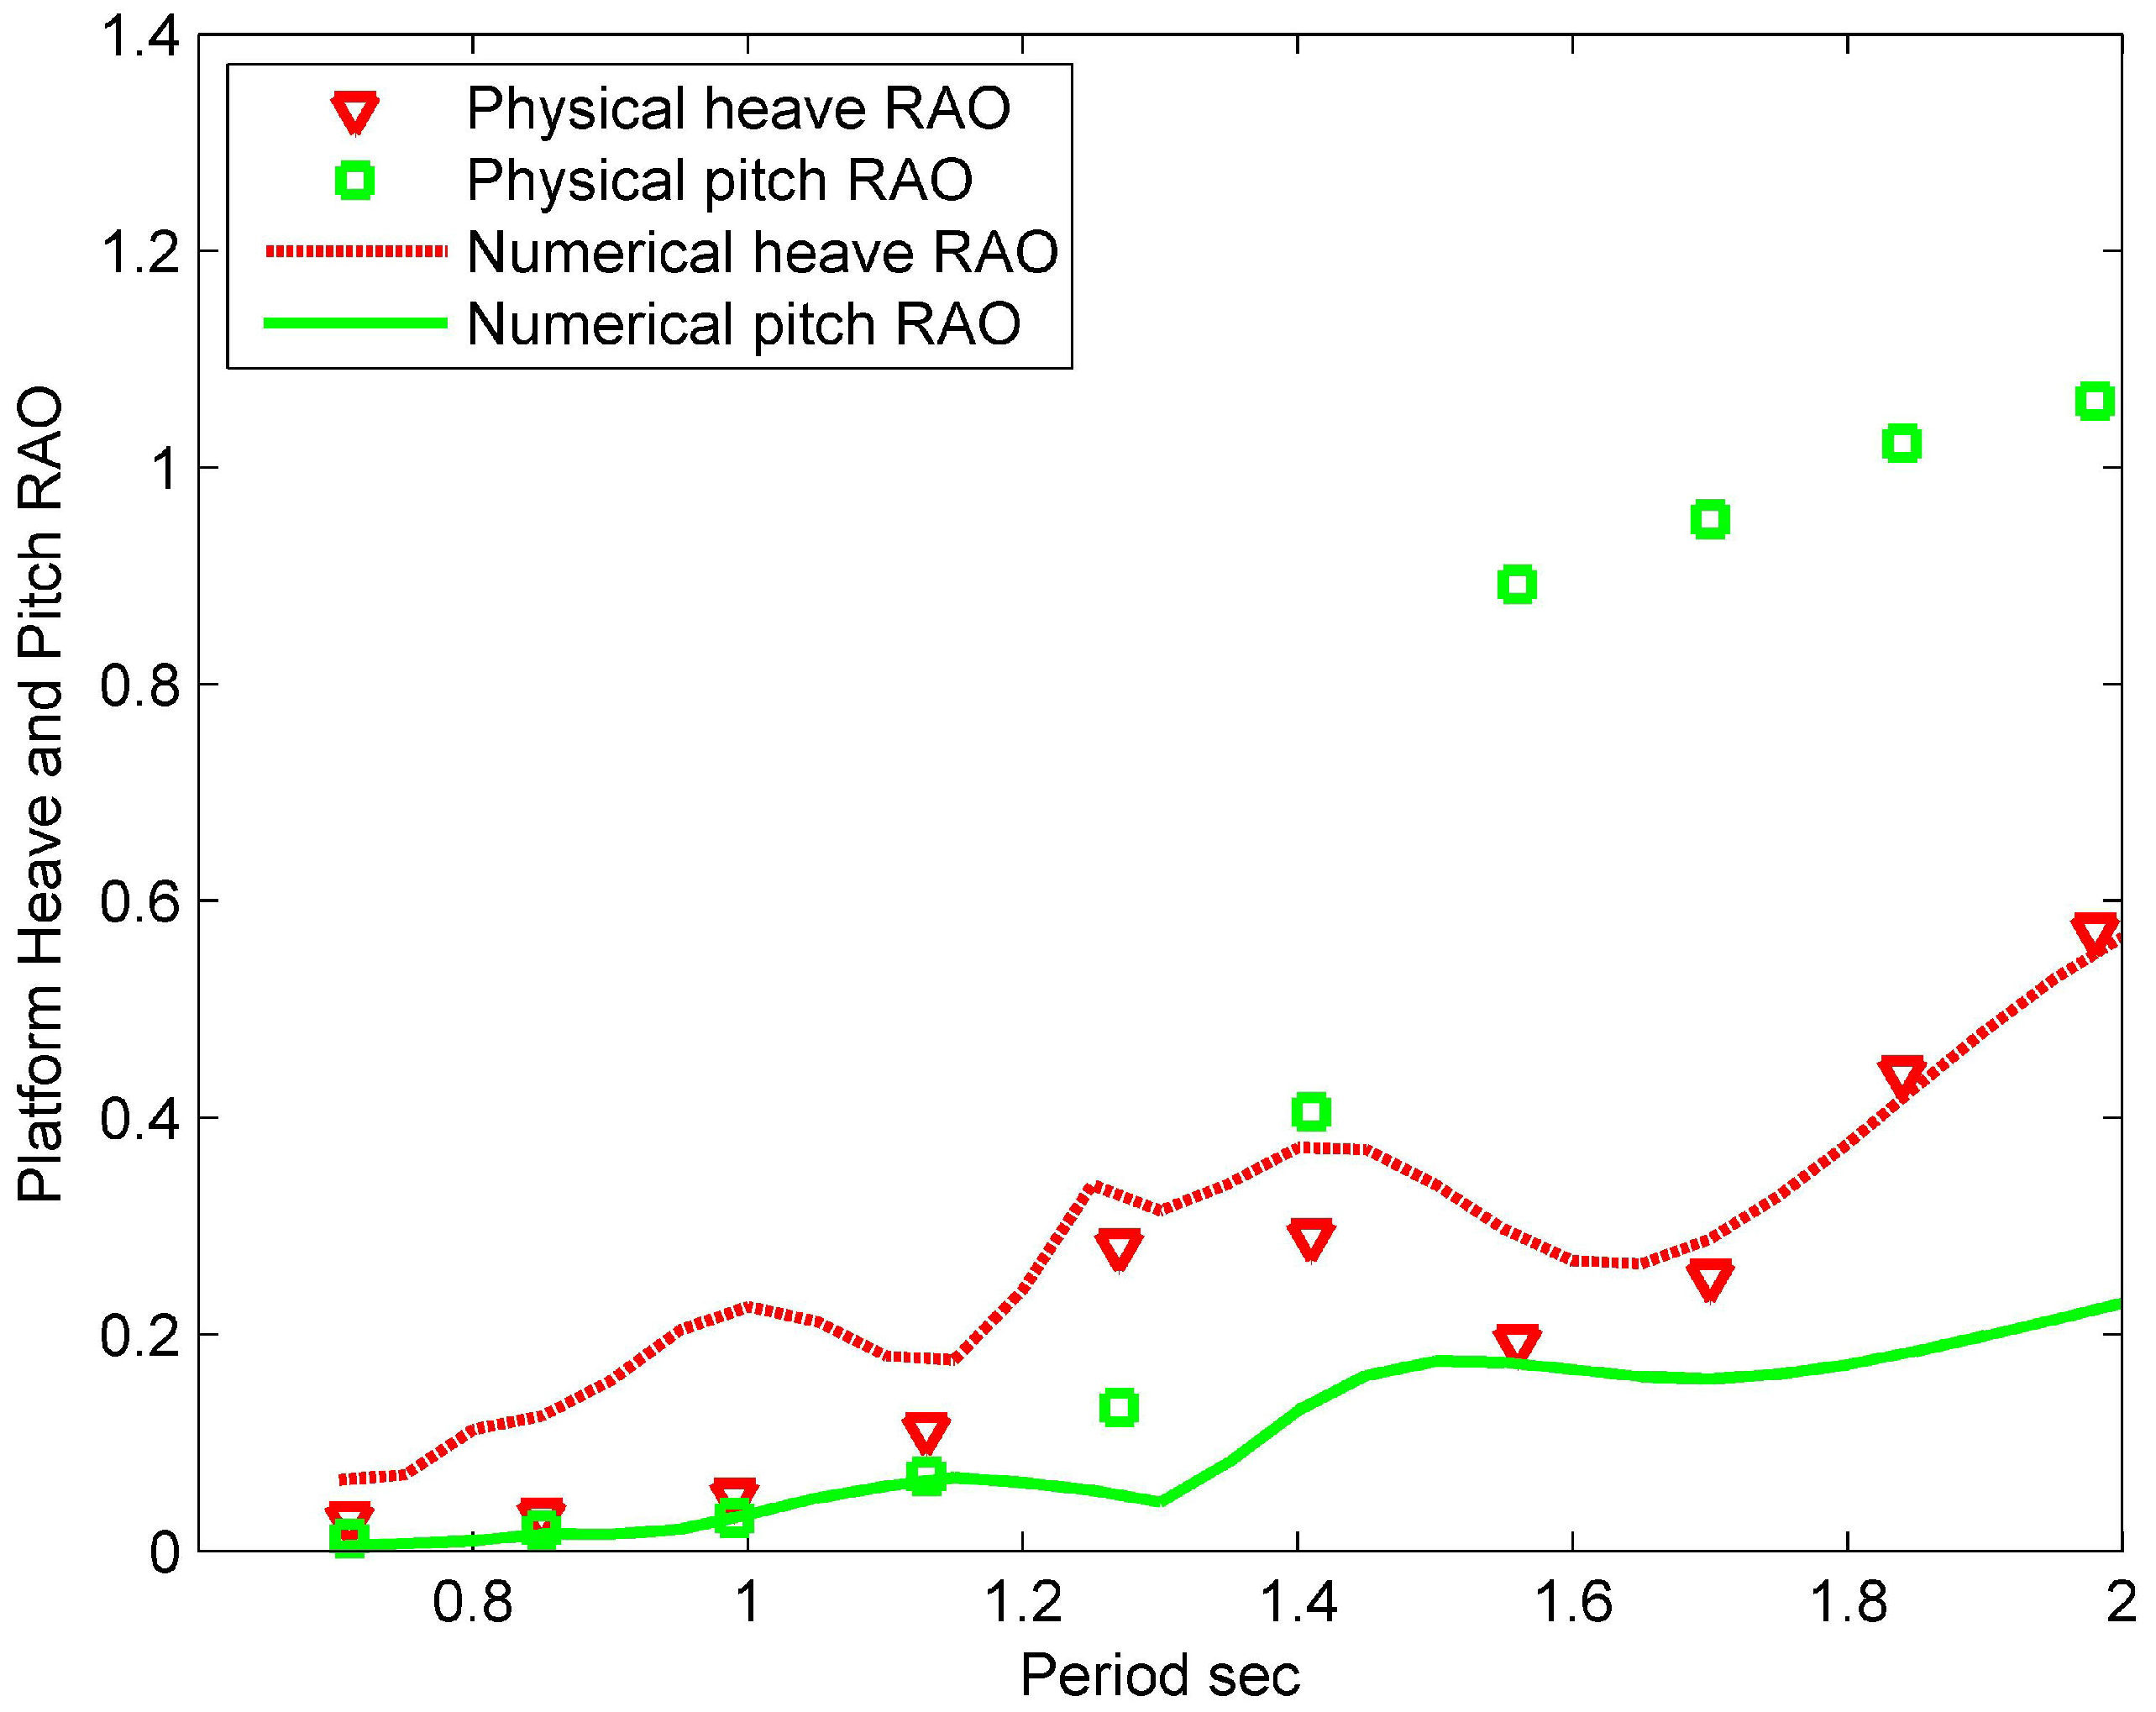
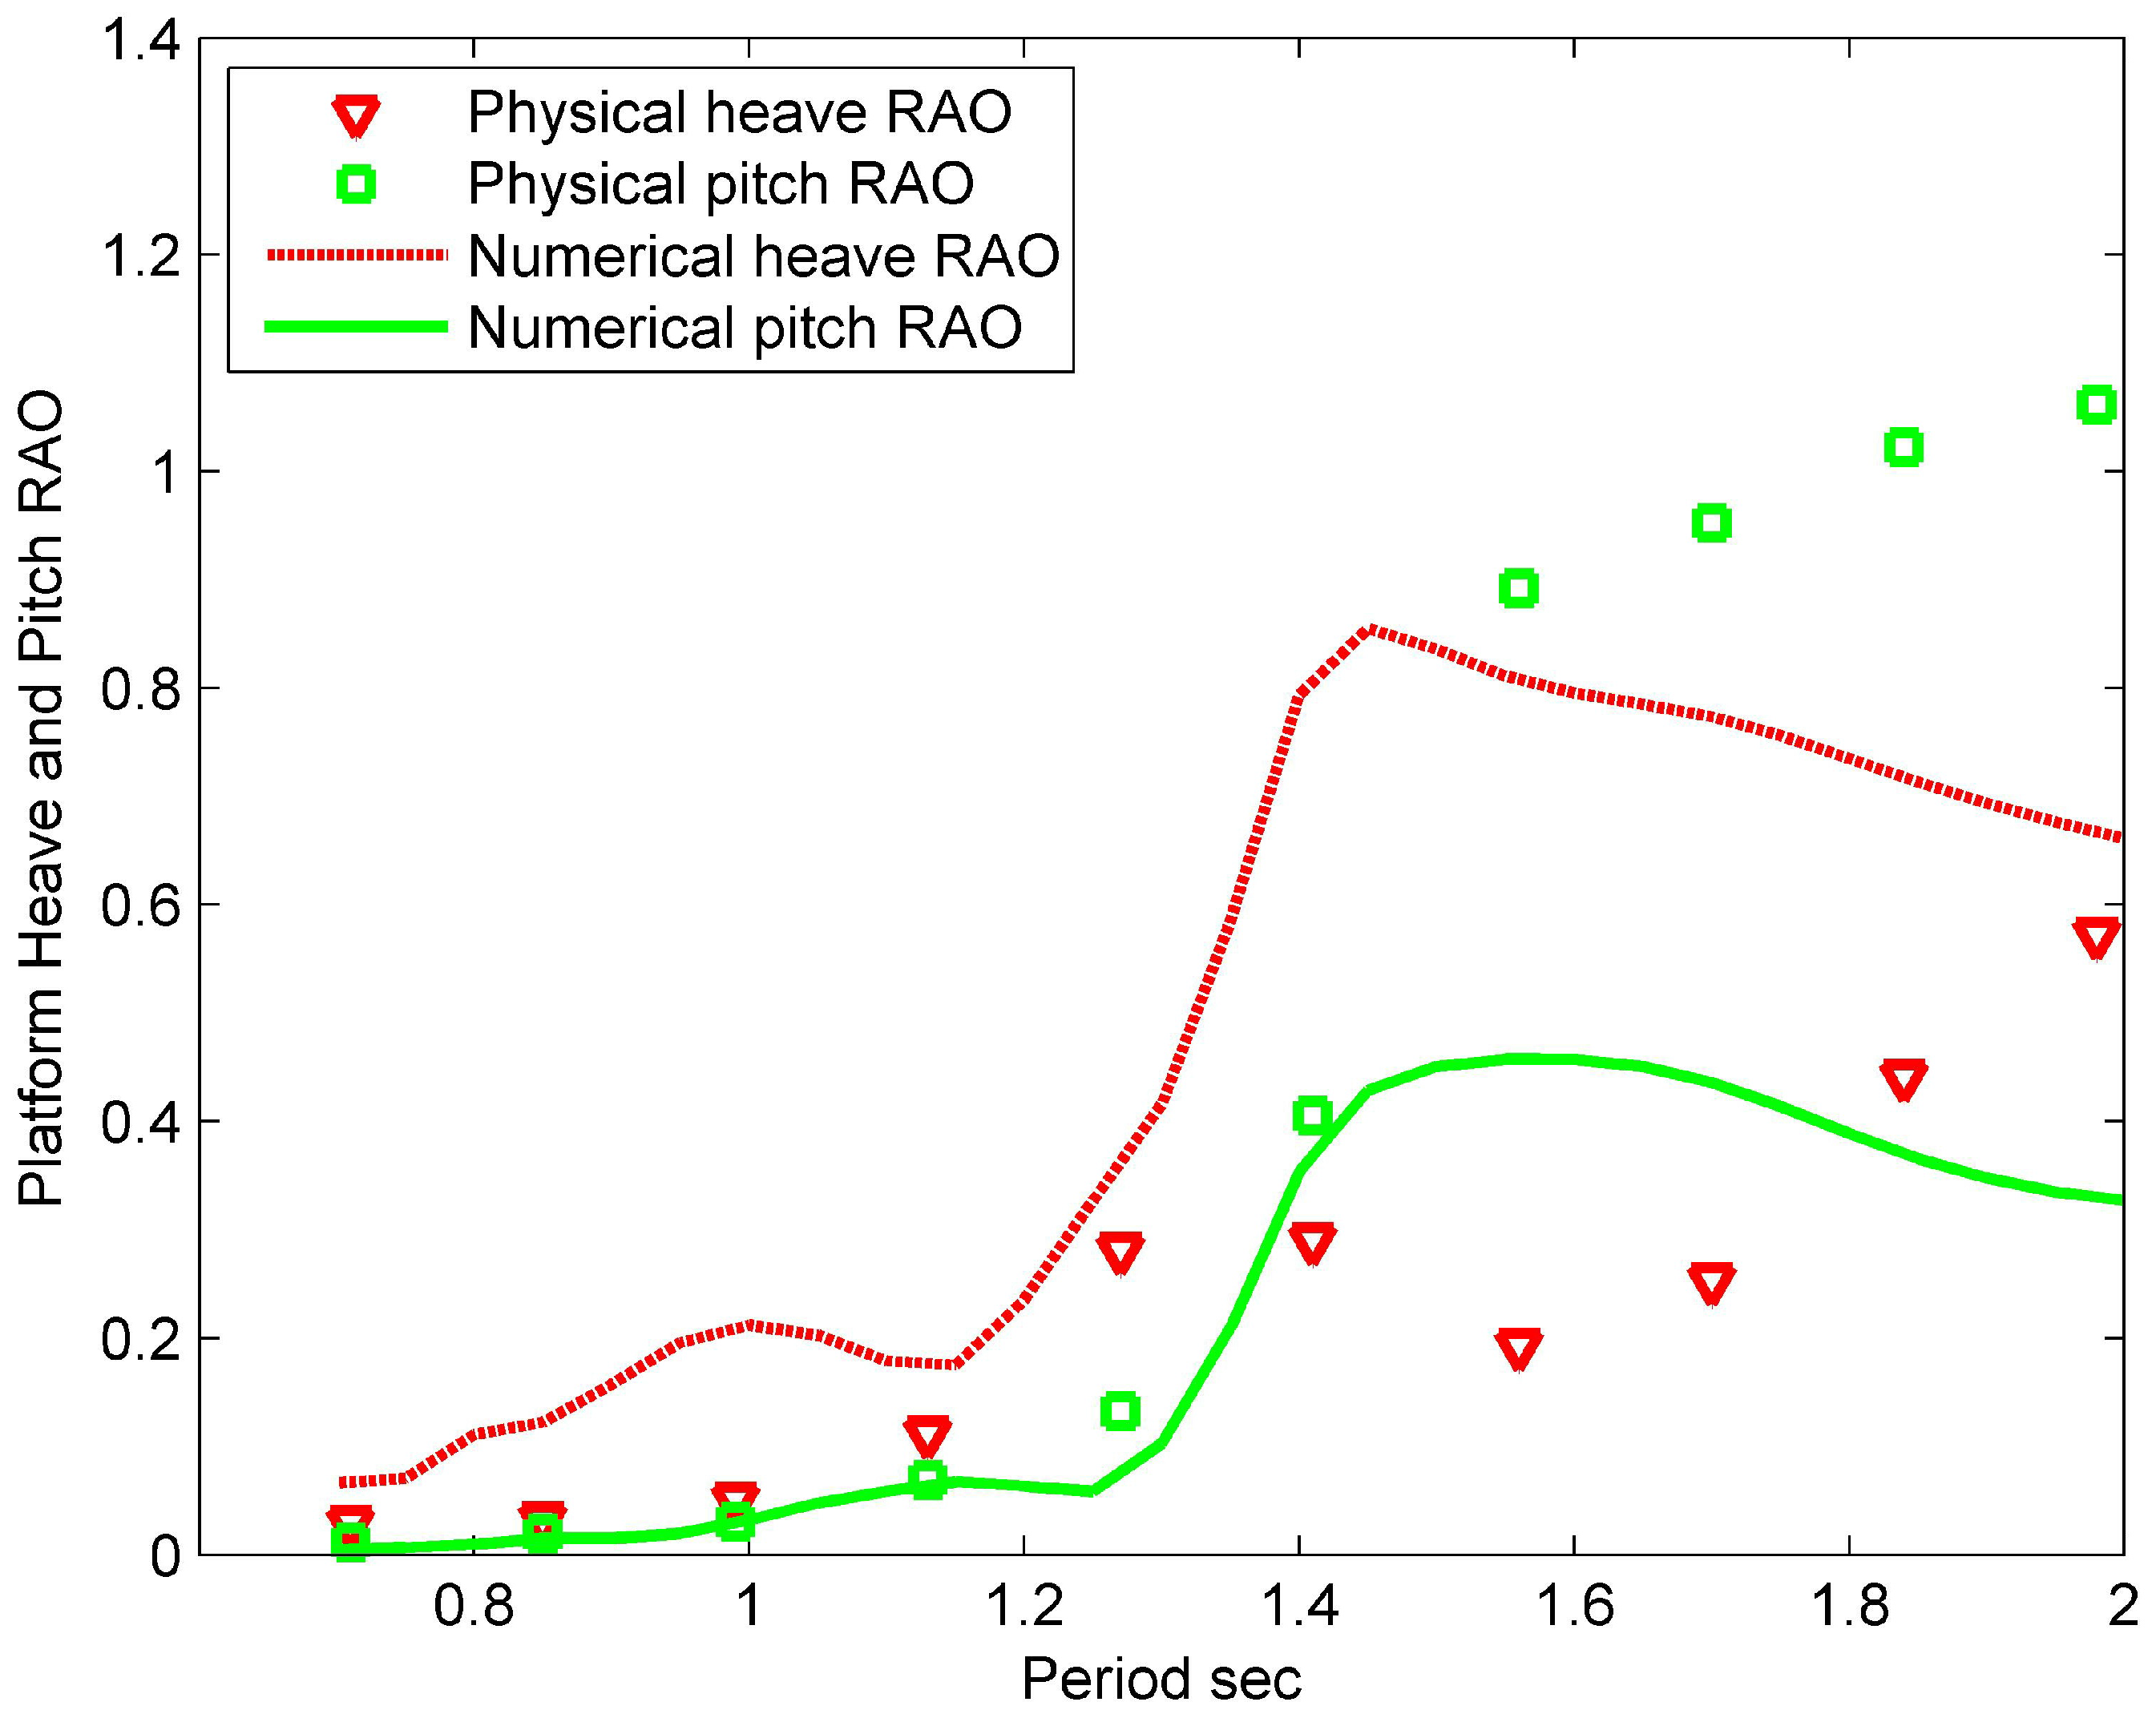
Figure 19 depicts the RAOs for the heave and pitch rigid body motions of the platform with the model using the 25 mm throat diameter Venturi set subject to an incident wave of amplitude 30 mm. It is ultimately envisaged that the full-scale platform would serve as a base for a wind turbine, and the accelerations that a wind turbine would experience at hub height are largely a function of the pitching motion of the platform.
Figure 20 illustrates the amplitude of the experimental and predicted angular pitch displacement and the heave displacement of the platform plotted against the incident wave period. This plot is included for clarity during the discussion in
Section 9.
Significantly, the experimental RAOs of the water columns appear to be dominated by the platform pitch motions at, and close to, the platform pitch resonant period. The water columns furthest away from the centre of gravity of the platform show the largest RAOs around this period of approximately 1.56 s. With respect to a wind turbine mounted on the platform, the extent of the pitching motion around this period is undesirable. However, the pitch mode of the platform is not the only one through which the platform absorbs wave power. This can be seen in
Figure 10, where the power absorbed by the model in the physical test is depicted. Significant power is also absorbed by the model at around the heave resonant period of the water columns, between wave periods of 1.3 and 1.4 s. This shows that the relative motion of the water columns to the platform is significant at these periods.
Figure 19.
Comparison between the experimentally and numerically determined platform pitch and heave RAOs using the 25 mm throat diameter Venturi set with the model subject to an incident wave amplitude of 30 mm, against the incident wave period.
Figure 19.
Comparison between the experimentally and numerically determined platform pitch and heave RAOs using the 25 mm throat diameter Venturi set with the model subject to an incident wave amplitude of 30 mm, against the incident wave period.
Figure 20.
Comparison between the experimentally and numerically determined platform pitch and heave displacements using the 25 mm throat diameter Venturi set with the model subject to an incident wave amplitude of 30 mm, against the incident wave period.
Figure 20.
Comparison between the experimentally and numerically determined platform pitch and heave displacements using the 25 mm throat diameter Venturi set with the model subject to an incident wave amplitude of 30 mm, against the incident wave period.
One further point of note is that upon completion of the tank testing, it was found that the air admittance valves between the high-pressure plenum and OWCs 1, 5, 7 and 14 had become partially blocked, which would increase the apparent linear damping experienced by these chambers. While it is impossible to quantify this increase exactly, the damping levels for these chambers have been increased in the simulation in an attempt to include the effect of these blockages.
9. Comparison of Experimental and Simulation Results
The efforts made to reconcile numerical and experimental data where significant differences occur is discussed. Initially, consider
Figure 19, which illustrates the rigid body heave and pitch RAOs of the platform with the 25 mm Venturi throat diameter damping level. As can be seen, a significant difference exists between the experimental and numerical results in the region of an incident wave period greater than 1.4 s. The largest pitch angular displacement occurs at an incident wave period of approximately 1.5 s for both data sets (during the testing, the maximum pitch displacement occurred at a wave period of 1.56 s), as can be seen in
Figure 20. The experimental data shows a significantly larger pitch displacement and a lower heave displacement when compared to the numerical prediction in this range of incident wave periods. However, experimental and numerical results converge once the incident wave frequency is greater than the pitch resonant period, as can be seen in
Figure 20. This might suggest a transfer of energy between the heave and pitch modes at incident wave periods close to the resonant frequency of the platform pitching mode, perhaps due to the effect of the mooring arrangement, as investigated below.
Consider now the correlation between the predicted and recorded RAOs of the water columns. The results for chambers 1 to 4, closest to the stern of the model, can be seen in
Figure 11 and
Figure 12. Overall, good general agreement for both the RAO magnitudes and periods at which these magnitudes occur has been achieved for chambers 1 to 4. However, where divergence does occur, it is for wave periods close to the platform pitch resonance period. The match between the experimental and predicted RAOs for water columns 5 to 8 in
Figure 13 and
Figure 14 follows the same pattern. Overall, the magnitudes are of a similar order, with some divergence again at wave periods close to the platform pitch resonant period. The comparison between the results for OWCs 9 to 12 are depicted in
Figure 15 and
Figure 16. These plots follow the trend of diverging at periods close to the platform pitch resonant period. The numerical results over-predict the RAOs for chambers 9 and 10, while under-predicting the results for chambers 11 and 12. The final water column RAOs, those for chambers 13 to 16, are shown in
Figure 17 and
Figure 18. While
Figure 17 and
Figure 18 exhibit the same pattern whereby divergence occurs at the same point as before, the divergence in these two plots is greater. These chambers are at the bow of the model and closest to the mooring point. Note that a single, averaged value of damping was applied herein to all the OWC chambers. By fine tuning the individual chamber damping levels, better agreement could likely be achieved between the experimental and predicted results. However, as discussed below, the primary use of the numerical model as currently implemented is to investigate the overall suitability of the total level of platform PTO damping.
Figure 10 illustrates the effect that the difference in the actual and predicted RAOs of the platform has on the experimentally determined and numerically derived power absorbed by the platform. For incident wave periods up to the pitch resonant period at approximately 1.56 s, the two power curves are in general agreement. However, a large spike in the numerically predicted power occurs at the pitch resonance. This would suggest that the real-world pitch motion of the platform may be parasitic to the power absorbed at these wave frequencies. It is interesting to note that the numerical model does predict the two peaks shown in the experimental results at incident wave periods of approximately 1.3 and 1.5 s. These periods correspond to the resonant heave period of the water columns, as discussed in
Section 4, and the resonant pitch period of the platform. Peaks in the amplitude of the heave motions of the water columns can been seen at the two periods above when the relative motion of the water columns to the platform is examined, although these peaks are not apparent in
Figure 11 to
Figure 18, which illustrate the RAOs of the water columns referenced to the still water level.
Efforts were made to reconcile the two sets of data where divergence exists. The effect of the mooring chain and buoy arrangement on the behaviour of the numerical model of the platform was investigated, according to the approach suggested by Fitzgerald and Bergdahl [
47]. The physical model mooring arrangement can be seen in
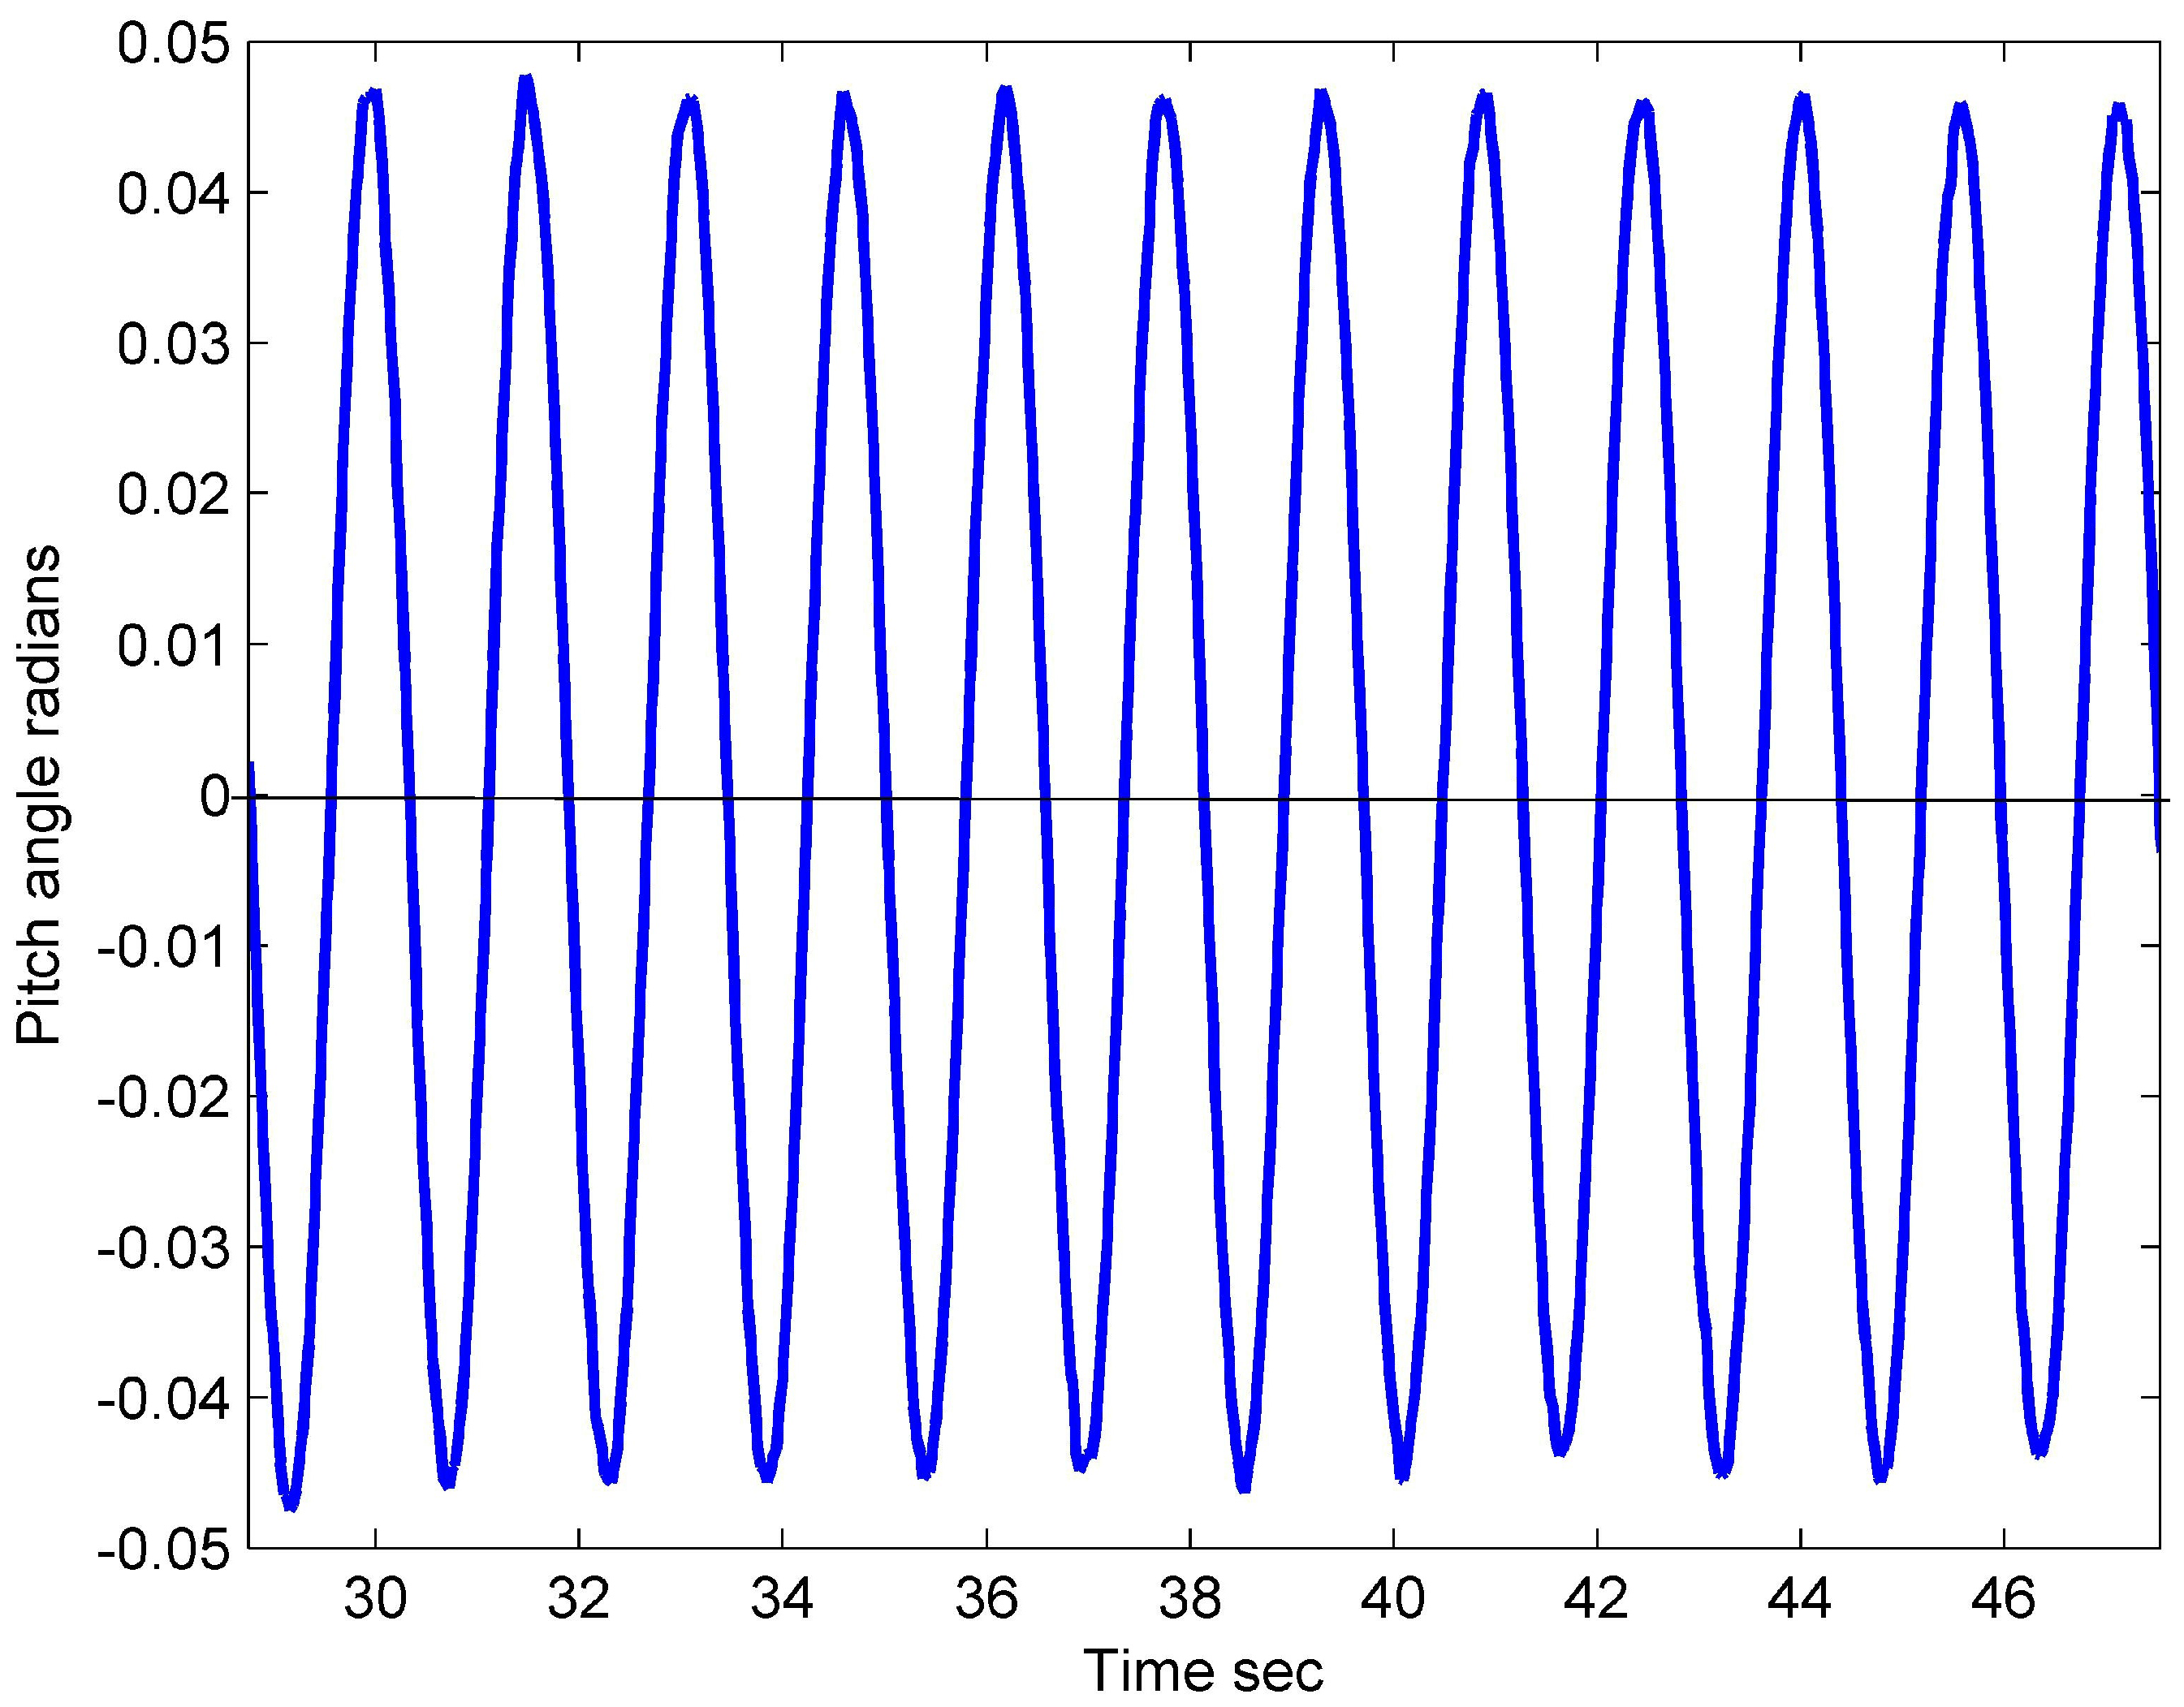
Figure 6. The possibility that the combined heave and pitch motions at the pitch resonant period were sufficient to fully extend and tension the mooring chain was investigated. This may have had the effect of transferring energy between modes and resulted in the larger than predicted pitch and lower than predicted heave experimental RAOs. However, examination of the test data showed that this was not occurring. Such an effect would be expected to manifest as a “jerking” action. In
Figure 21, which illustrates the time series of the pitch displacement at the pitch resonant wave period of 1.56 s, no such “jerking” action can be observed. The inclusion of the behaviour of the mooring on the system is thus unlikely to explain the large divergence in the rigid body RAOs at the pitch resonance.
Figure 21.
Time series of the platform pitch motion with the 25 mm throat diameter Venturi set installed and with the model subject to an incident wave amplitude of 30 mm at an incident wave period of 1.56 s.
Figure 21.
Time series of the platform pitch motion with the 25 mm throat diameter Venturi set installed and with the model subject to an incident wave amplitude of 30 mm at an incident wave period of 1.56 s.
The most successful method to reconcile the physical and numerical results to date focussed on the power curves, as illustrated in
Figure 10. This method involved increasing the rigid body pitch added damping at frequencies around the pitch resonance by a factor of two.
Figure 22 illustrates the effect on the predicted power absorbed of this relatively simplistic change in the numerical model compared to the actual power absorbed.
Figure 23 shows the resulting predicted platform heave and pitch RAOs compared to the experimental values.
Figure 22.
Comparison between power absorbed during physical test using the 25 mm Venturi set with the model subject to an incident wave amplitude of 30 mm and the numerical model with the pitch added damping doubled about the resonance period.
Figure 22.
Comparison between power absorbed during physical test using the 25 mm Venturi set with the model subject to an incident wave amplitude of 30 mm and the numerical model with the pitch added damping doubled about the resonance period.
Figure 23.
Comparison between platform heave and pitch RAOs during the physical test using the 25 mm Venturi set with the model subject to an incident wave amplitude of 30 mm and the numerical model with the pitch added damping doubled about the resonance period.
Figure 23.
Comparison between platform heave and pitch RAOs during the physical test using the 25 mm Venturi set with the model subject to an incident wave amplitude of 30 mm and the numerical model with the pitch added damping doubled about the resonance period.
The power absorption plots now show reasonably close agreement. Both the experimental and numerical results show two regions of relatively high power absorption with respect to incident wave period, corresponding to the heave resonant period of the water columns and the pitch resonant period of the platform. Significantly, the predicted platform heave RAO plot now closely matches the experimental results, showing the same dip in values around the platform pitch resonant frequency. However, the predicted platform pitch RAO plot does not show good agreement.
One further possibility of model tuning is to include a coupling term between the heave and pitch modes in Equation (
21). The aim of this approach was to transfer energy between these modes as the numerical model under-predicts the platform pitch RAO and over-predicts the heave RAO at the same periods. It was found that the numerically predicted rigid body motions were highly sensitive to small changes in both the mass matrix,
M, and the stiffness matrix,
C. Differences in values of a few percent in these matrices have a dramatic influence on the platform RAOs. For example, the effect of the additional mass due to the cable train is hard to quantify
in situ; yet, it may be significant. Furthermore, the latching action of the valves and plenums will change the mass and moments of the platform as water columns lock in position. This effect cannot be modelled in the frequency domain in the fashion employed here. It seems likely, due to the highly non-linear nature of the platform, along with the time-dependent latching action, that the frequency domain modelling approach discussed herein will be of limited use.
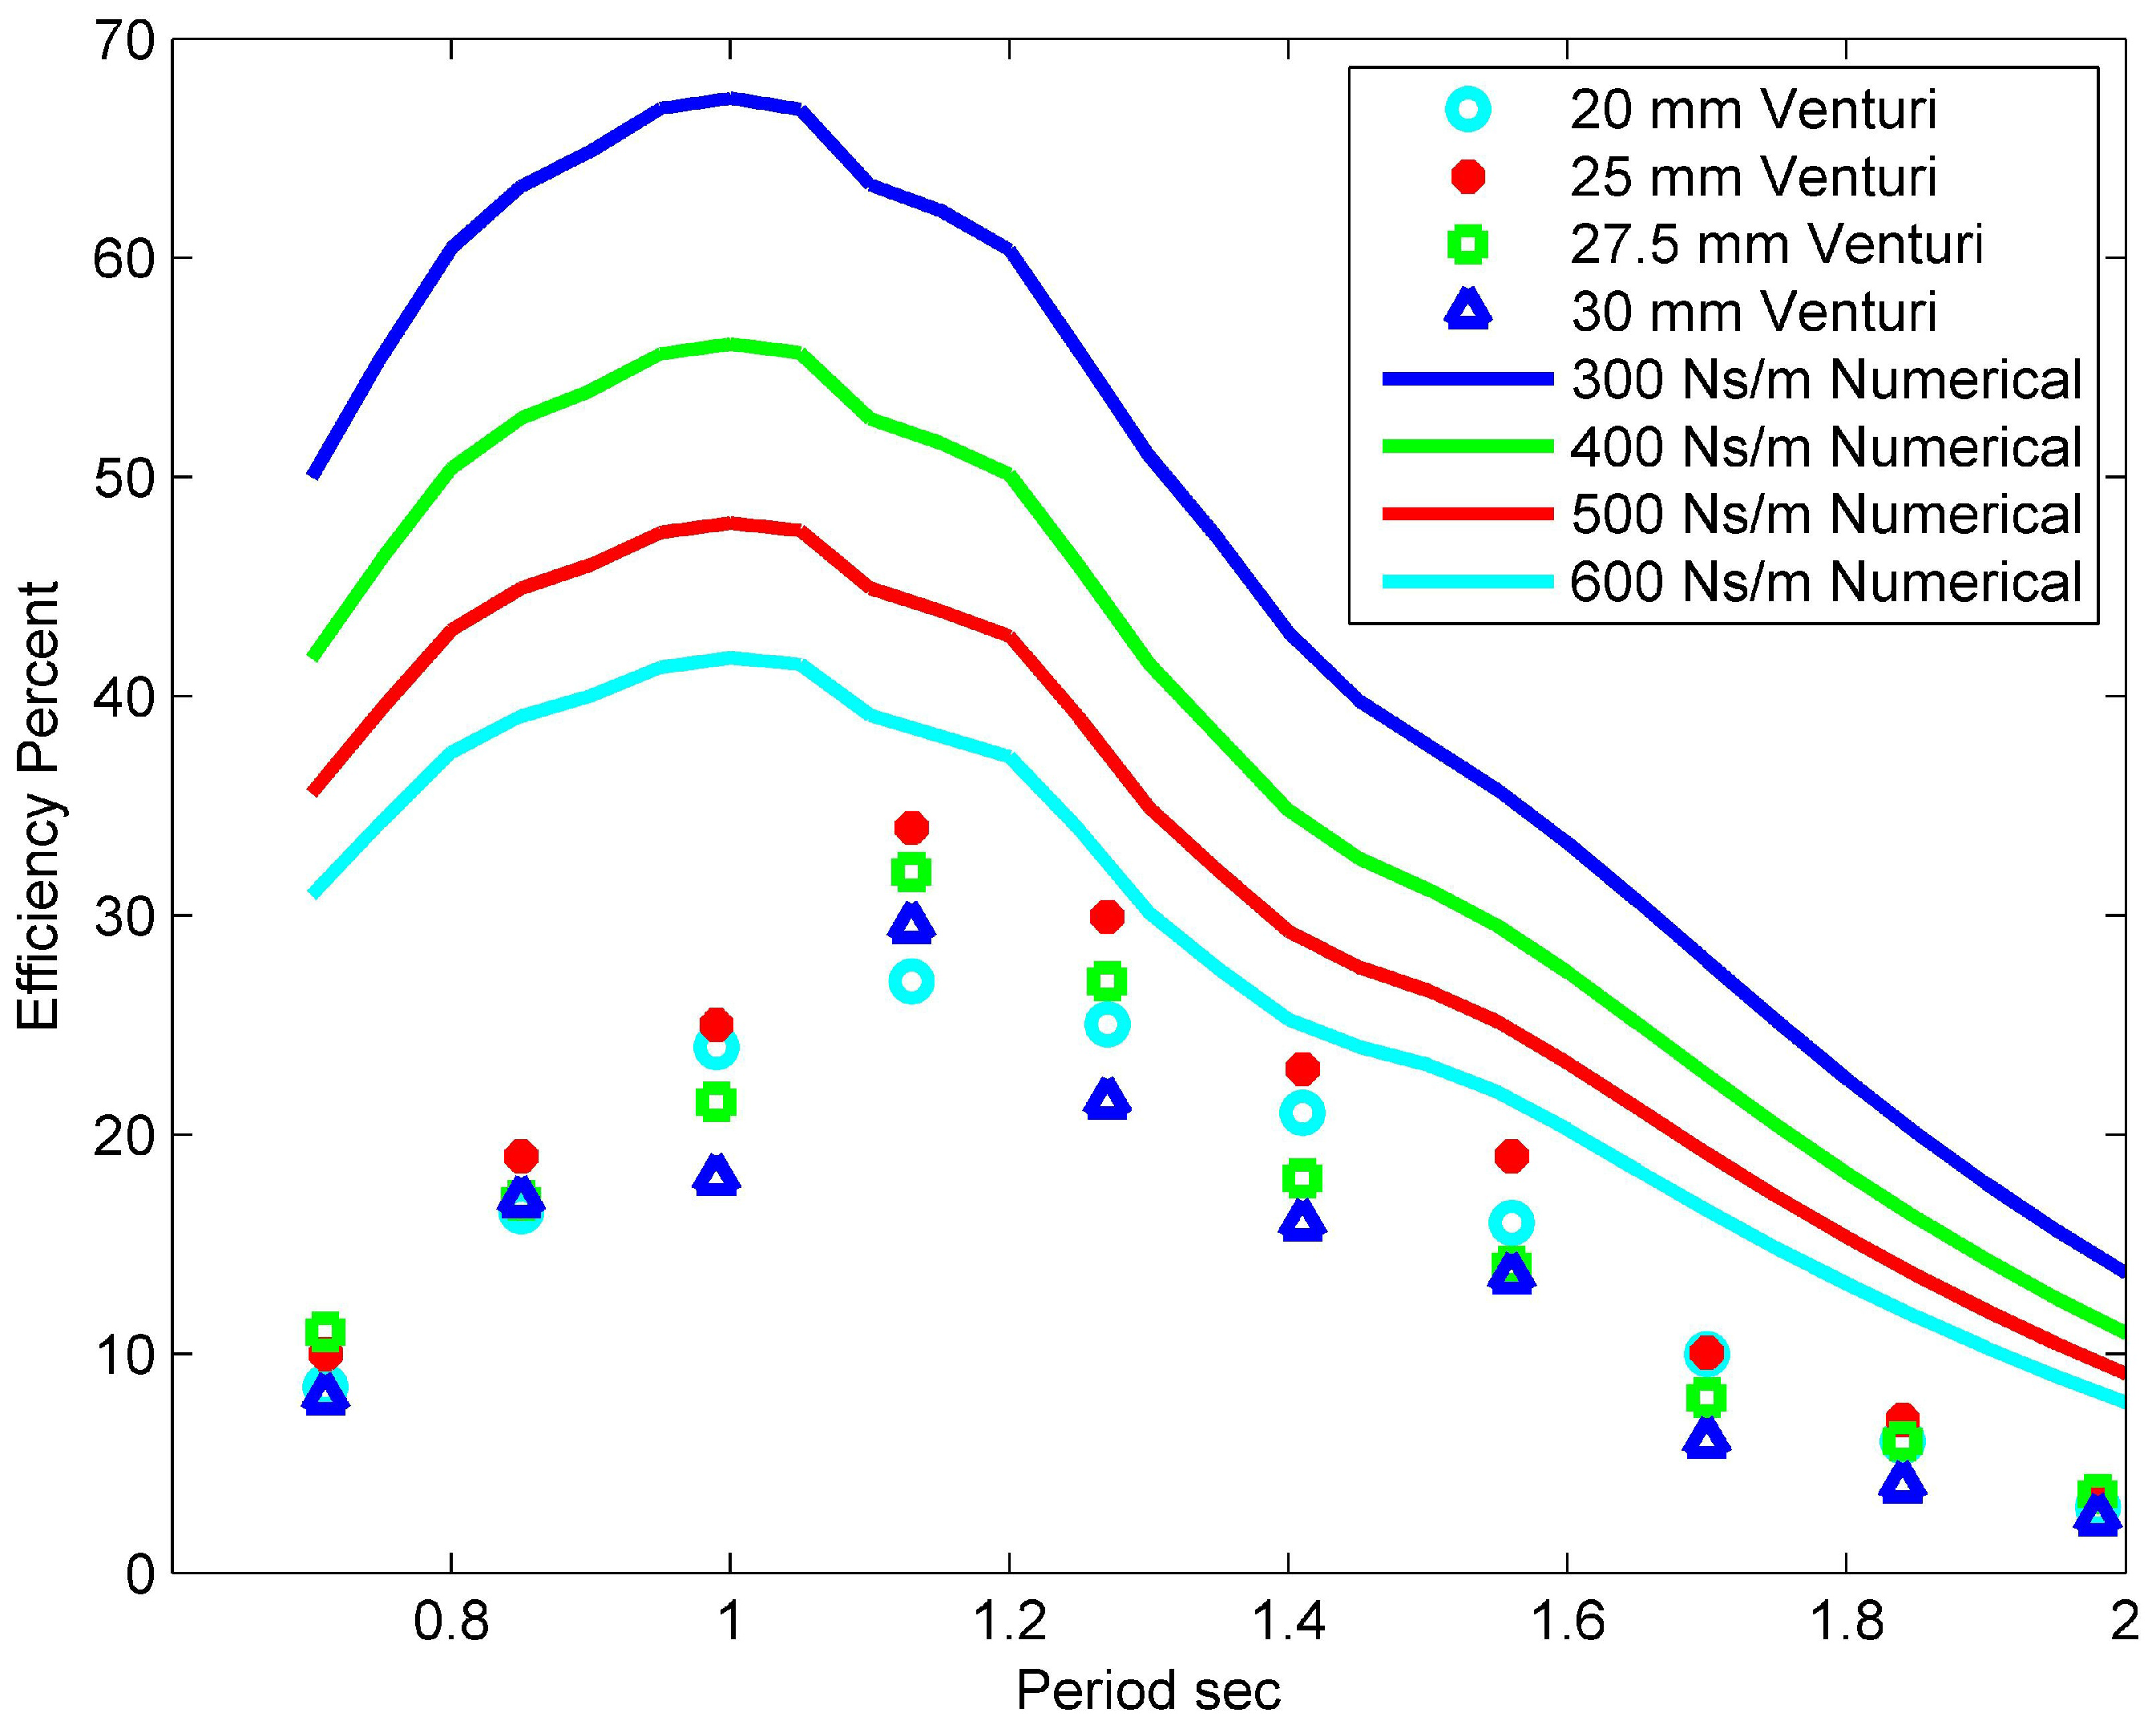
However, while the numerical model is far from perfect, it is informative to examine the effect of varying the linear damping used in the solution of Equation (
27) to determine the predicted power absorbed. As discussed in
Section 8 of this paper, the value of applied damping for the LIMPET, when scaled by 1:50 using Froude scaling, is significantly lower than the damping value calculated for each OWC during this testing. This suggests that the model may be over-damped, reducing its energy capturing ability. To investigate if the model was over-damped, Equation (
27) has been solved using various levels of applied damping.
Figure 24 illustrates the effect that varying the value of PTO damping applied to each OWC chamber in the numerical simulation has on the predicted converter efficiency. This efficiency is determined using Equation (
19). For comparison, the power absorbed for the range of Venturi throat diameters used during the tank tests is also shown. This figure supports the contention that the model platform is significantly over-damped as currently configured and is the most useful aspect of the frequency domain model as currently implemented.
Figure 24.
Effect of varying the linear PTO damping on the percentage predicted power absorbed with respect to wave period with the model subject to an incident wave amplitude of 30 mm.
Figure 24.
Effect of varying the linear PTO damping on the percentage predicted power absorbed with respect to wave period with the model subject to an incident wave amplitude of 30 mm.
10. Conclusions
A frequency domain numerical model of a model wind/wave energy converting platform provides some useful indicative results. The advantage of such a model over a time domain model is the rapid development time and the relatively low computational cost involved. However, accuracy is compromised at periods close to the platform pitch resonant frequency. Due to the latching action of the water columns, and the non-linearities inherent in the system as a result, it is not possible to fully simulate the behaviour of the device without time domain modelling. Clearly, some mechanism at the pitch resonant period is not captured by the frequency domain model.
Since the platform is intended to provide a base for an offshore wind turbine, the stability of a full-scale platform in response to ocean waves is important. While platform pitching motions may serve to increase or decrease the wave power absorbed by the platform, large pitching angles may also lead to unacceptable levels of accelerations at the hub of a wind turbine mounted on the platform. The model platform exhibited a pitch resonance period close to 1.56 s. At full scale, this is equivalent to a period of 11 s. In order to improve the stability of the platform, it will be necessary to increase the pitch resonant period beyond this value and outside the range of the North Atlantic wave regime. One consequence of this pitching motion is the large effect on the experimental heave RAOs of the water columns about this period. However, significant wave power is absorbed by the model at periods lower than the platform pitch resonant period close to the water column heave resonant period.
It has been shown that it is possible to manifold and collect pneumatic power from a large number of OWCs as part of a floating platform in a reasonably efficient manner, which was the primary purpose of the testing. However, it is clear that the PTO arrangement as implemented in the test model is over-damped, a fact that is not only borne out by the simulation results, but also by subsequent testing that has been carried out on the model, but which is not the subject of this paper. Simulations currently suggest that an apparent linear damping of 65 Ns/m for each chamber would result in an optimum level of damping.
The developers believe there is potential to commercially develop a combined wind/wave platform such as that described herein. There are several areas of work being undertaken on this concept. A time domain numerical model is currently under development, which will be extended to include non-linear effects. Further work is being carried out on the hydrodynamic behaviour of the platform to reduce the pitching motion that a full scale platform would undergo in the North Atlantic wave regime. This would allow for it to be used as a base for wind turbine installations. Finally, investigations continue into the valve and plenum arrangements to reduce the level of PTO damping and improve the wave energy absorption of the platform.

