Method for Cost-Benefit Analysis of Improved Indoor Climate Conditions and Reduced Energy Consumption in Office Buildings


Abstract
:1. Introduction
2. Methods
2.1. Description of the Energy Performance and Occupant Productivity Assessment Method
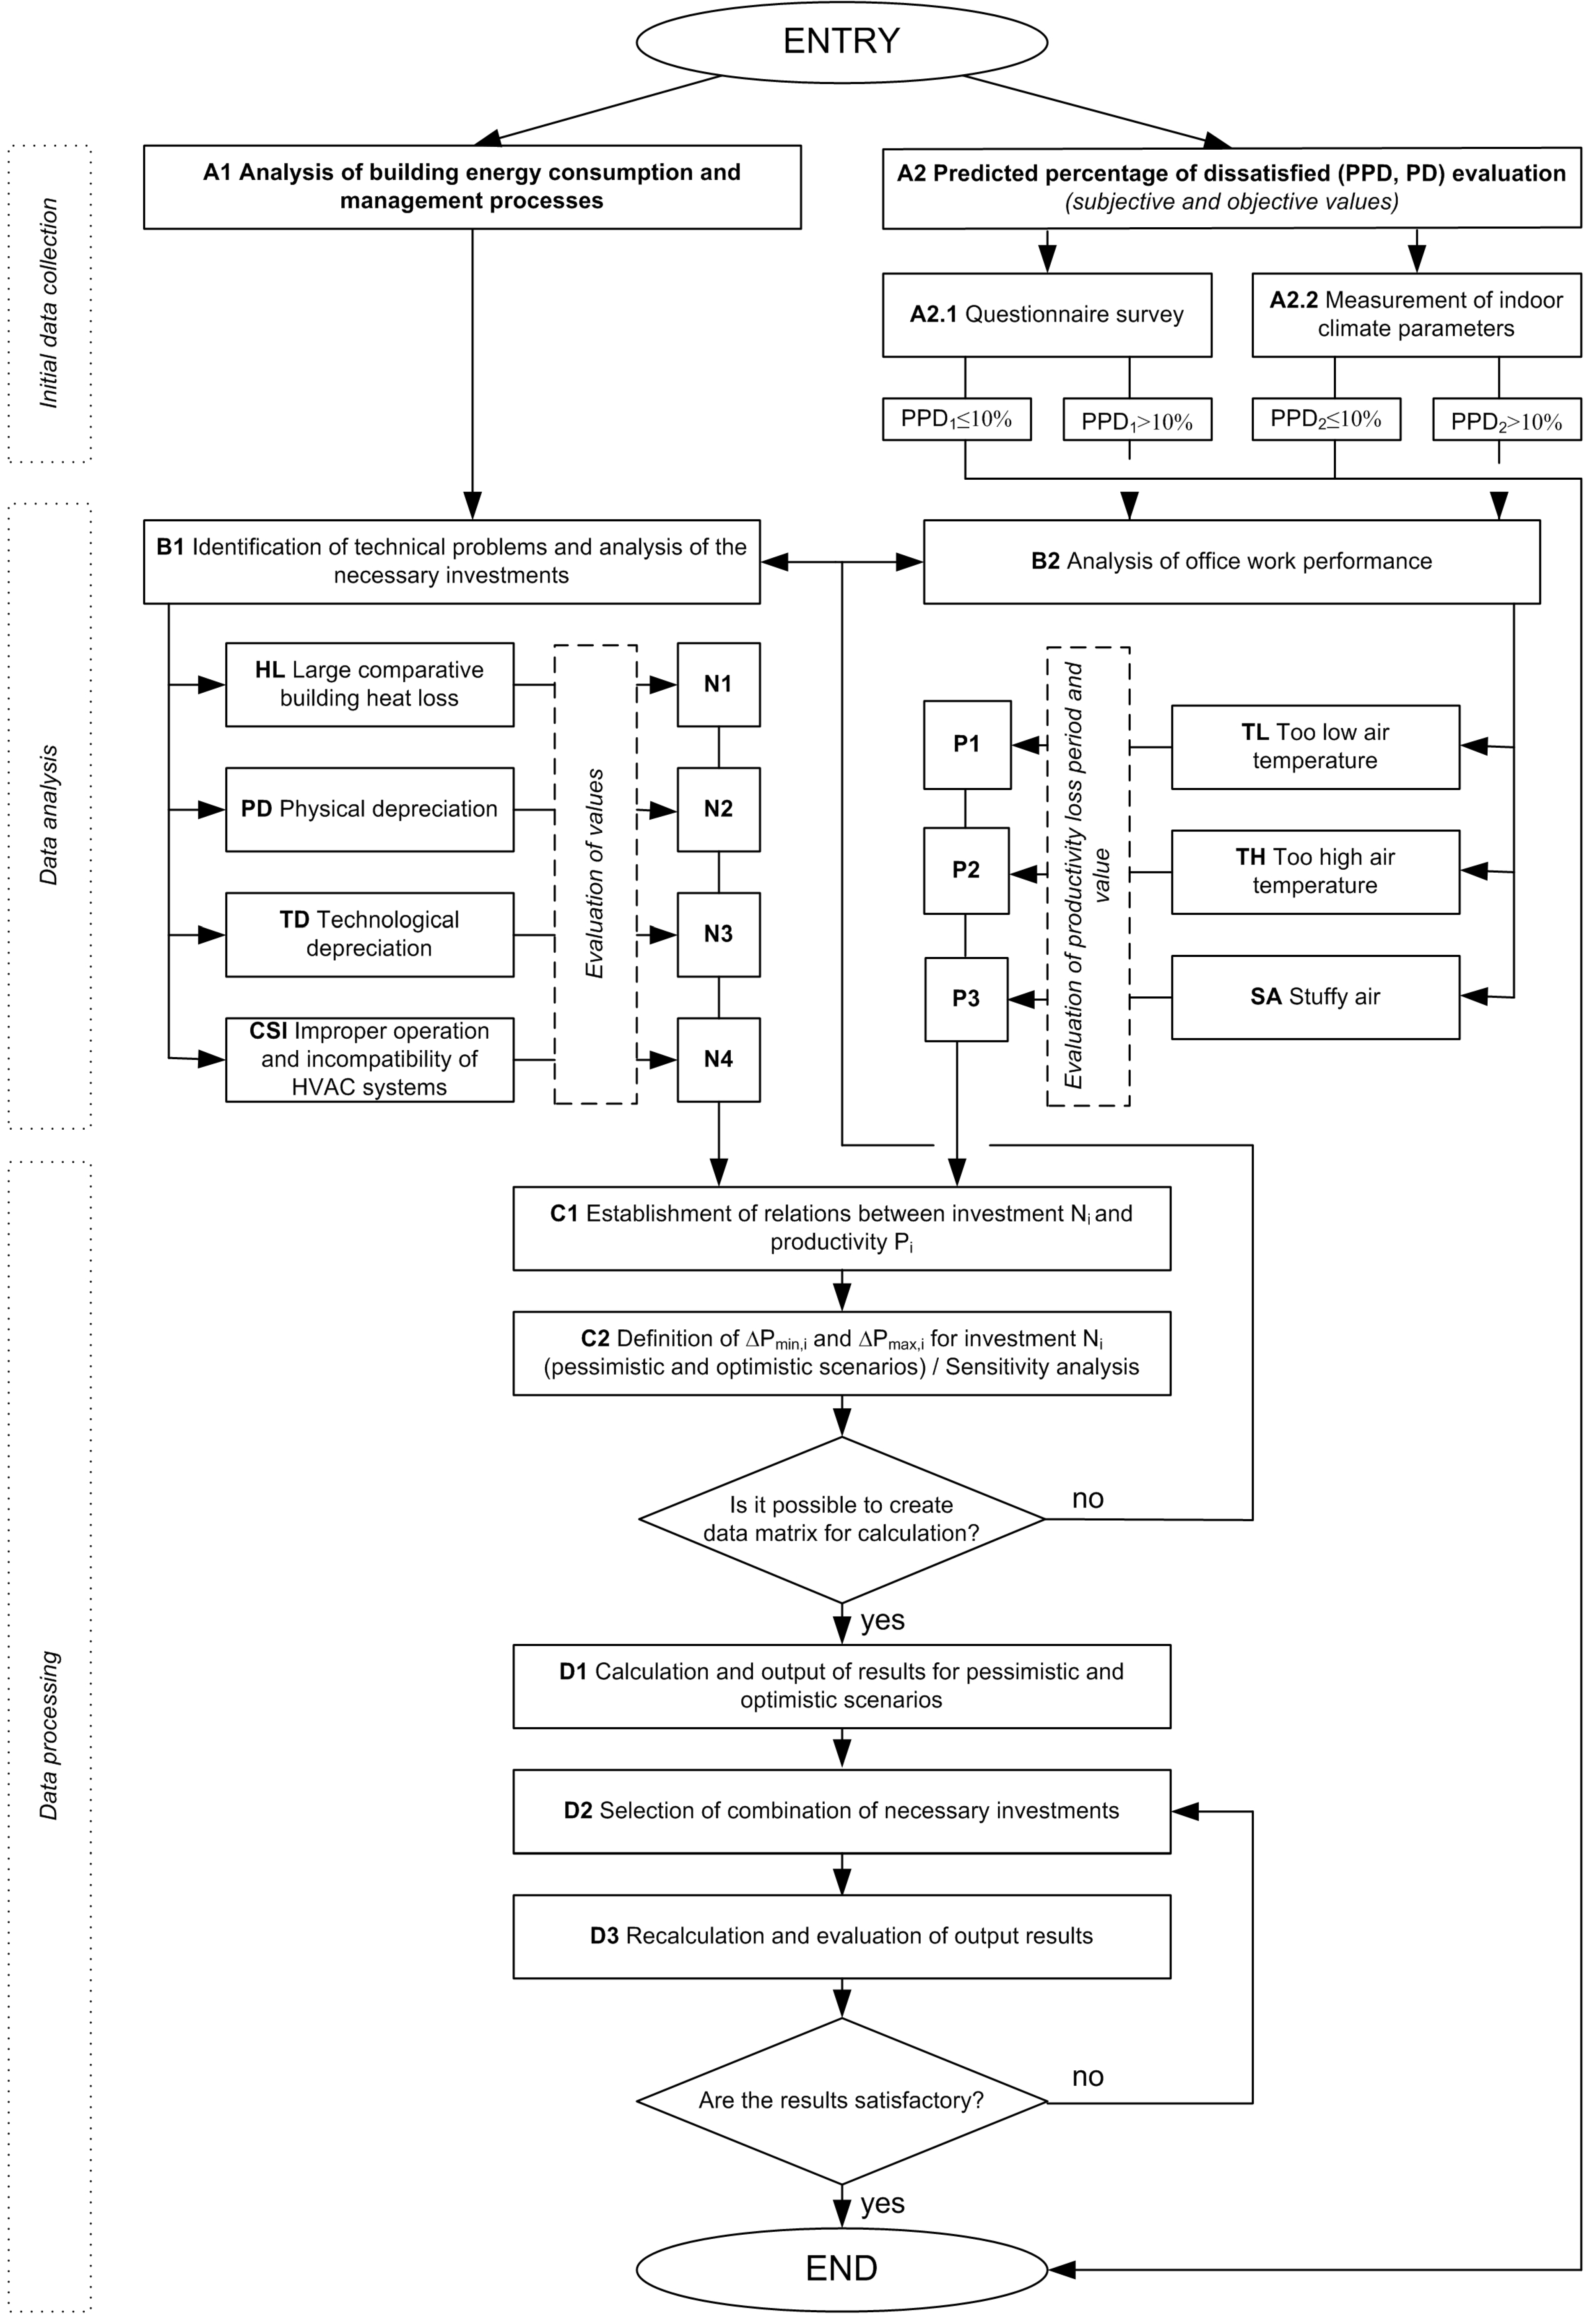
2.2. The TOPSIS Technique
3. Verification of the EP-OP Method
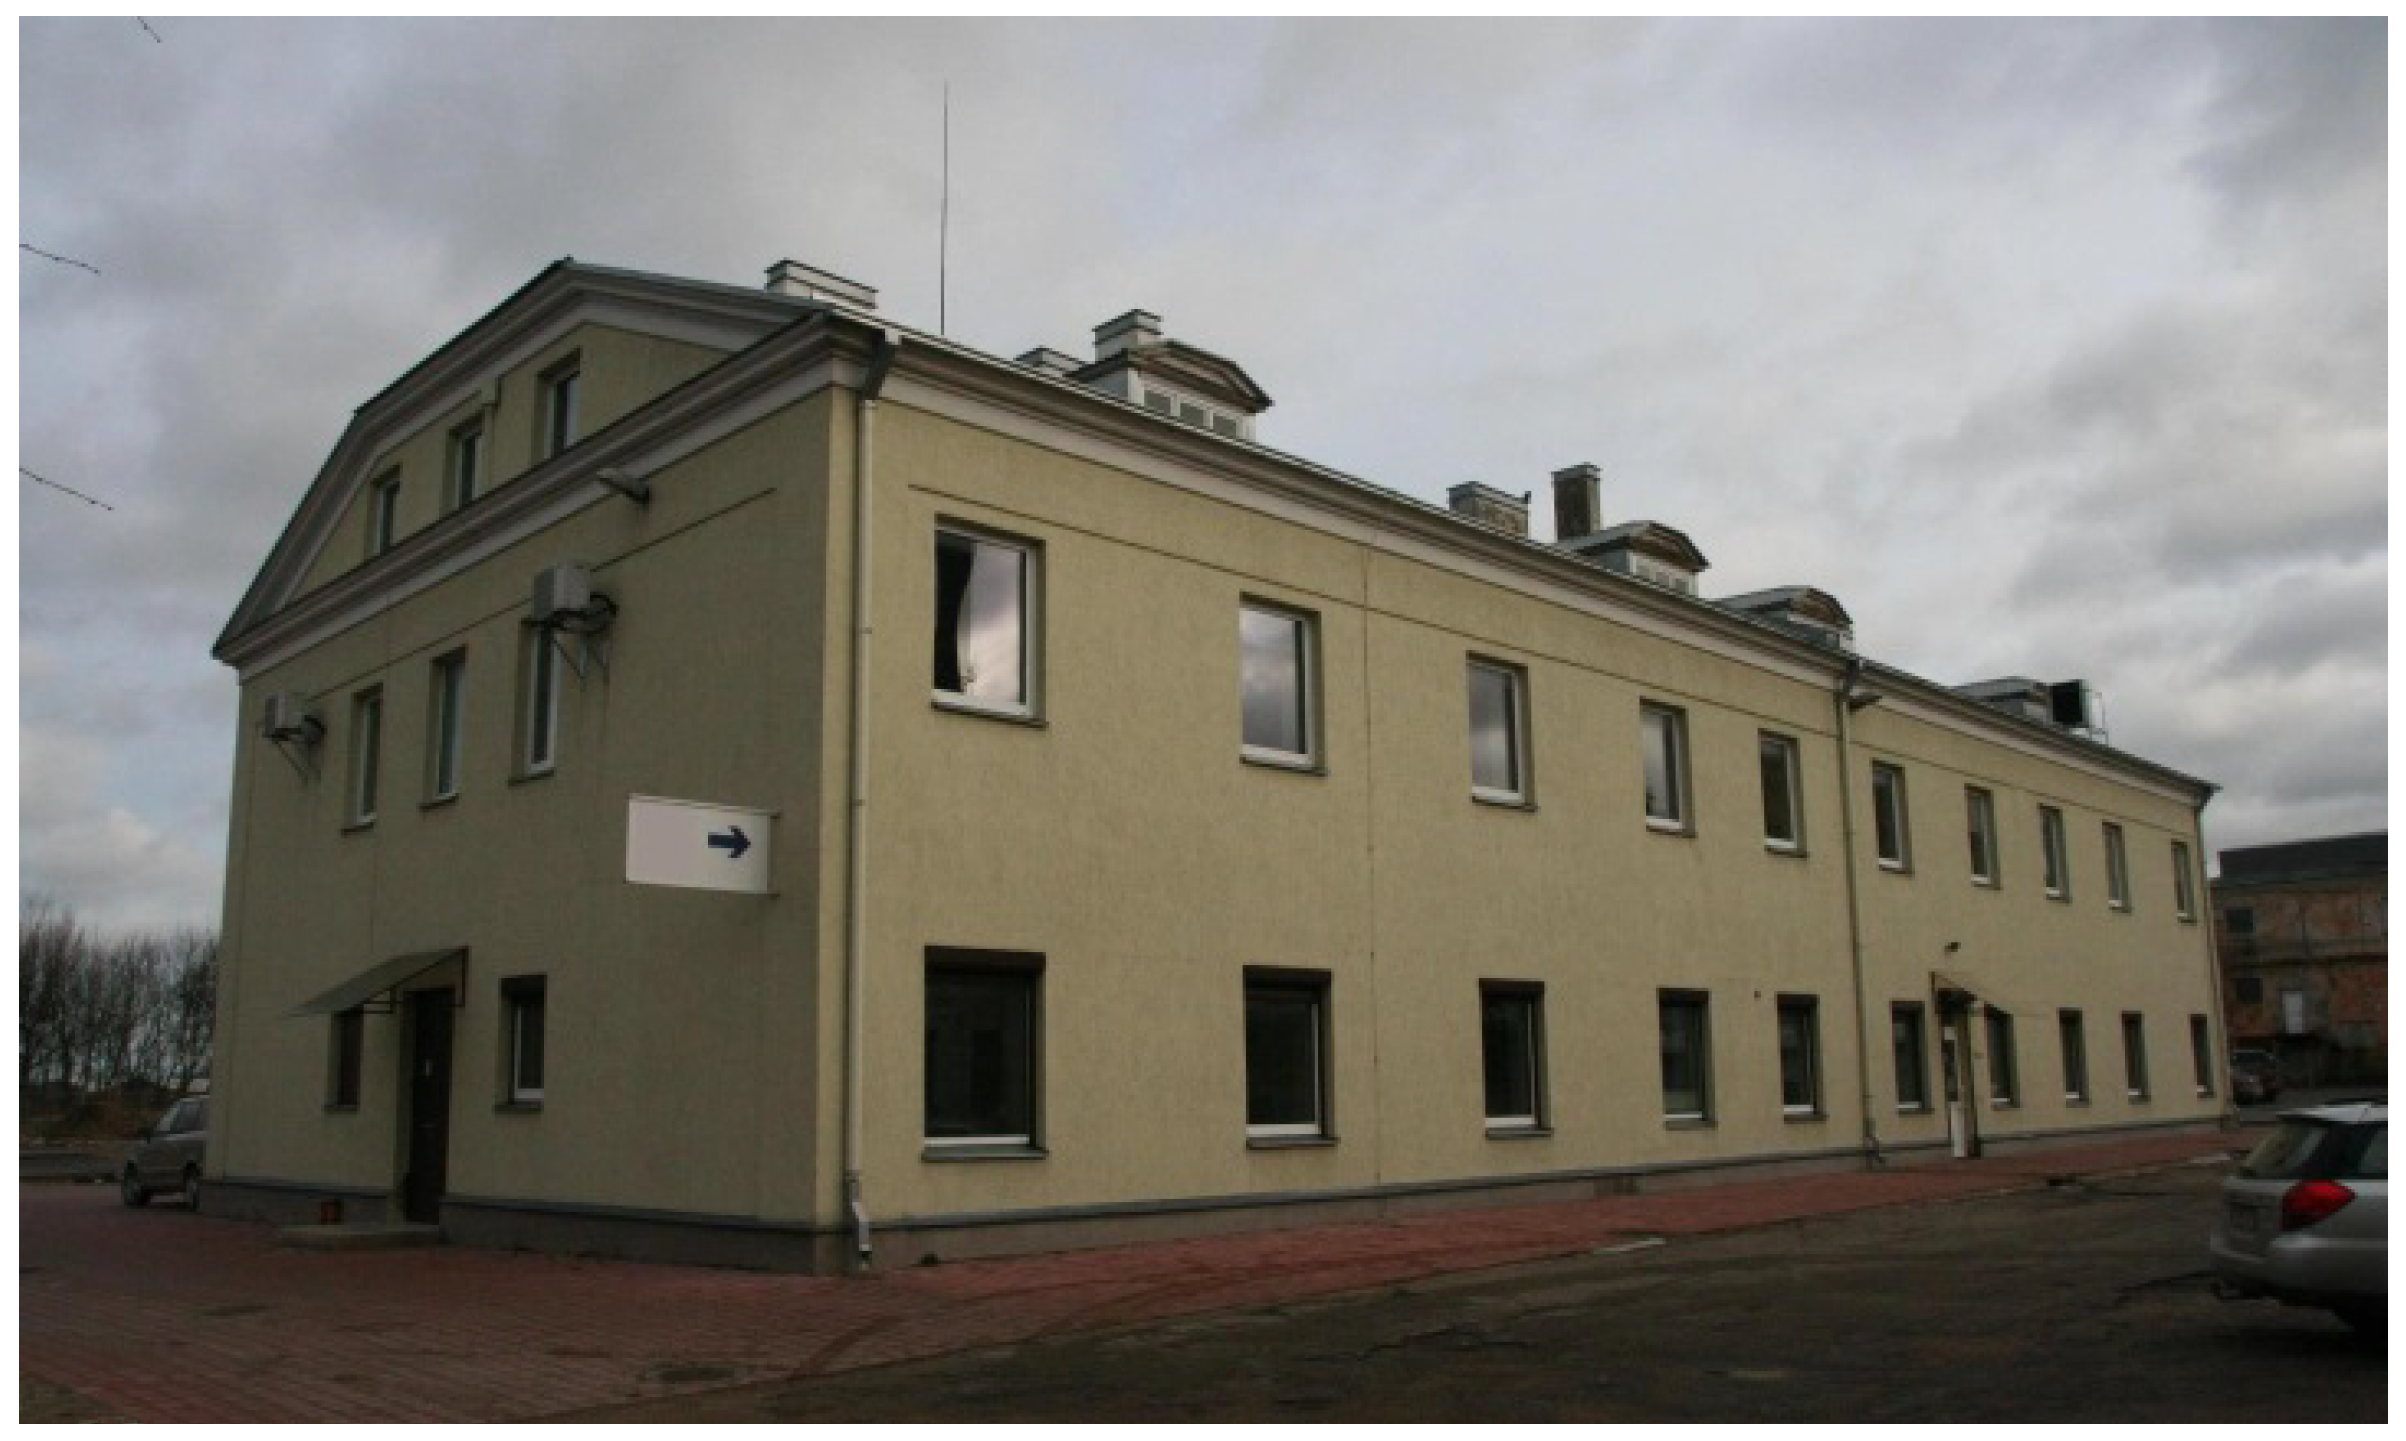
3.1. Description of the Case Study Building

3.2. Results


| Index | Technical problem | Description of required investment | Required investment €/m2 * | Annual savings €/m2 |
|---|---|---|---|---|
| N1 | High comparative building heat losses | Energy class of the building—“E”. Additional insulation for building envelope would lead to thermal energy saving of approximately 40%. Life time of the investment is 20 years. | 5.24 | 7.70 |
| N2 | Physical depreciation | Conventional natural gas fired boilers installed 13 years ago are physically and technologically outdated and unreliable. Replacement of conventional natural gas fired boiler into a gas condensing boiler would save about 8% of the thermal energy [29]. Life time of the investment is 10 years. | 0.87 | 1.54 |
| N3 | Technological depreciation | Natural ventilation does not provide the required ventilation rate (10 L/s per person) and does not save energy. Heat recovery ventilation with air cooling would save about 25% of thermal energy [30,31]. Life time of the investment is 10 years. | 1.32 | 4.82 |
| N4 | Improper operation and incompatibility of HVAC systems | Indoor air temperature is being controlled according to the external air temperature by either compensating heating controller or adjustment of the thermostatic radiator valves. New controller functioning according to the weather forecast would save approximately 20% of thermal energy [32,33]. Life time of the investment is 10 years. | 0.57 | 3.85 |
| Index | Indoor environmental problem | Summary of the questionnaire survey | Description | Approximate duration in days per year | Expected annual productivity gain | |
|---|---|---|---|---|---|---|
| Pessimistic scenario (ΔPmin) | Optimistic scenario (ΔPmax) | |||||
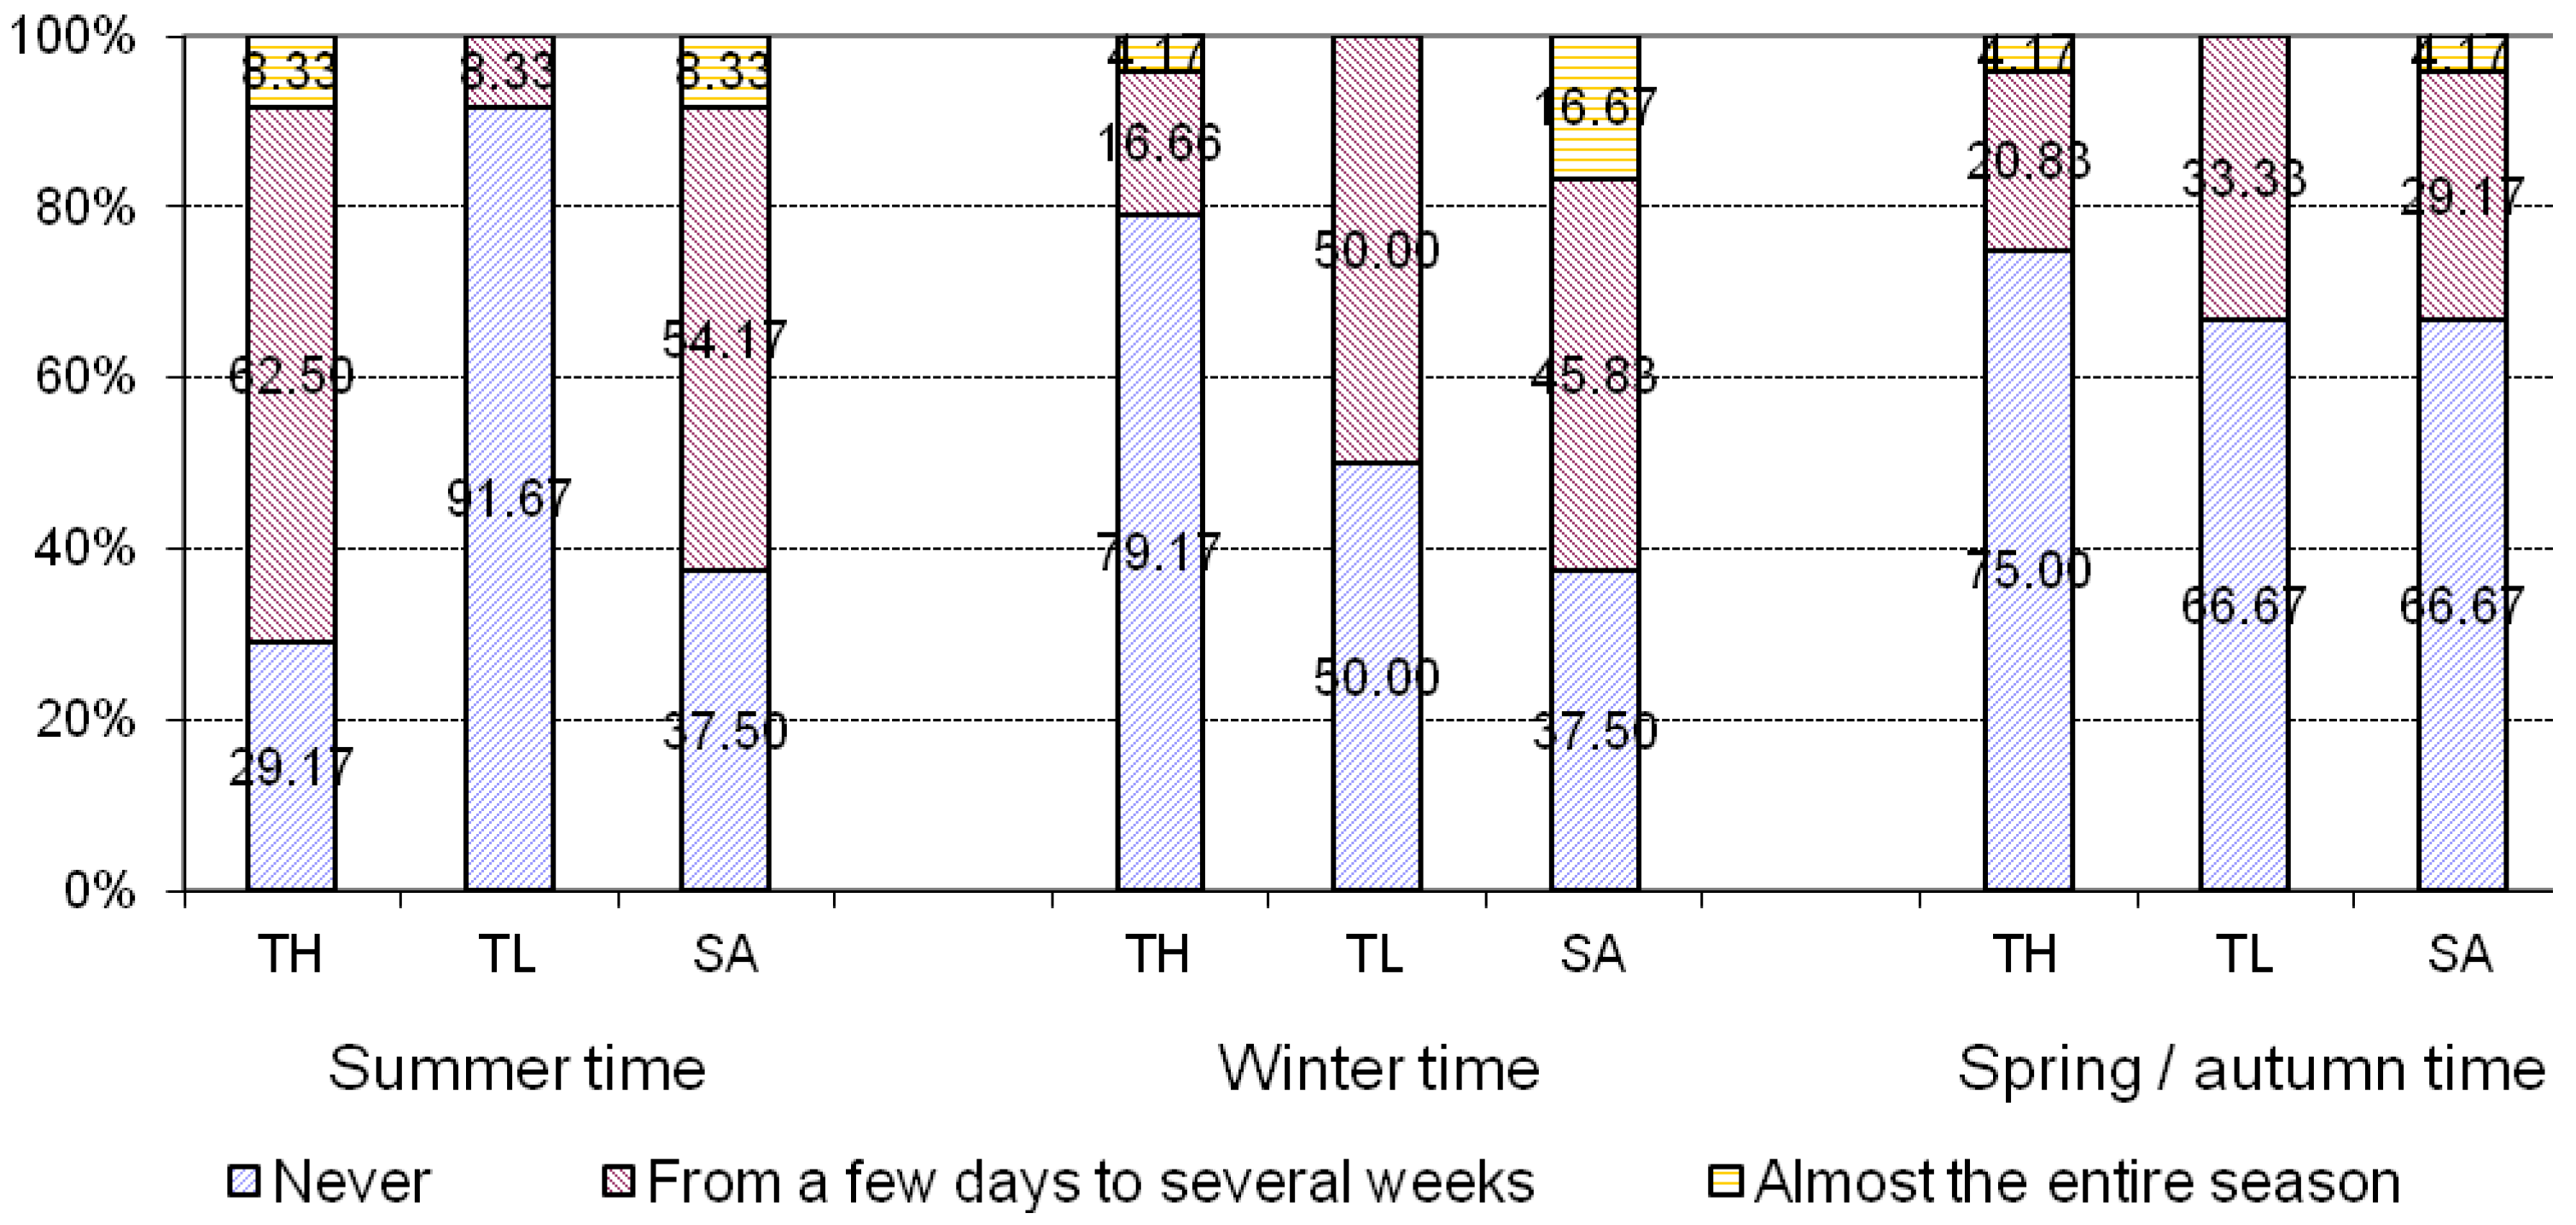
| P1 | Too low air temperature | Indicated by 50% of employees during winter time (for period from several days to several weeks), by 33.3% employees in spring/autumn. | The maximum performance is achieved at ca. +22 °C. ΔPmin value was calculated according to thermal sensation vote while productivity as a function of air temperature was used for determining ΔPmax [23]. | 22 | 1% (0.14 €/m2) | 4% (0.58 €/m2) |
| P2 | Too high air temperature | Indicated by 70.83% of employees during summer time and by 33.3% employees in spring/autumn. | 22 | 5% (0.73 €/m2) | 13% (1.90 €/m2) | |
| P3 | Stuffy air | Percentage of dissatisfied in summer and winter is 62.5%, during spring and autumn is 33.3%. | Loss of productivity as a function of percentage of dissatisfied by air quality was used for this estimation [23]. | 88 | 5.5% (3.21 €/m2) | 5.5% (3.21 €/m2) |
| Investment alternative (see Table 1) | Required investment €/m2 | Annual savings on energy €/m2 | Productivity gain, €/m2 and relation to cause of the complaints | |
|---|---|---|---|---|
| Pessimistic scenario | Optimistic scenario | |||
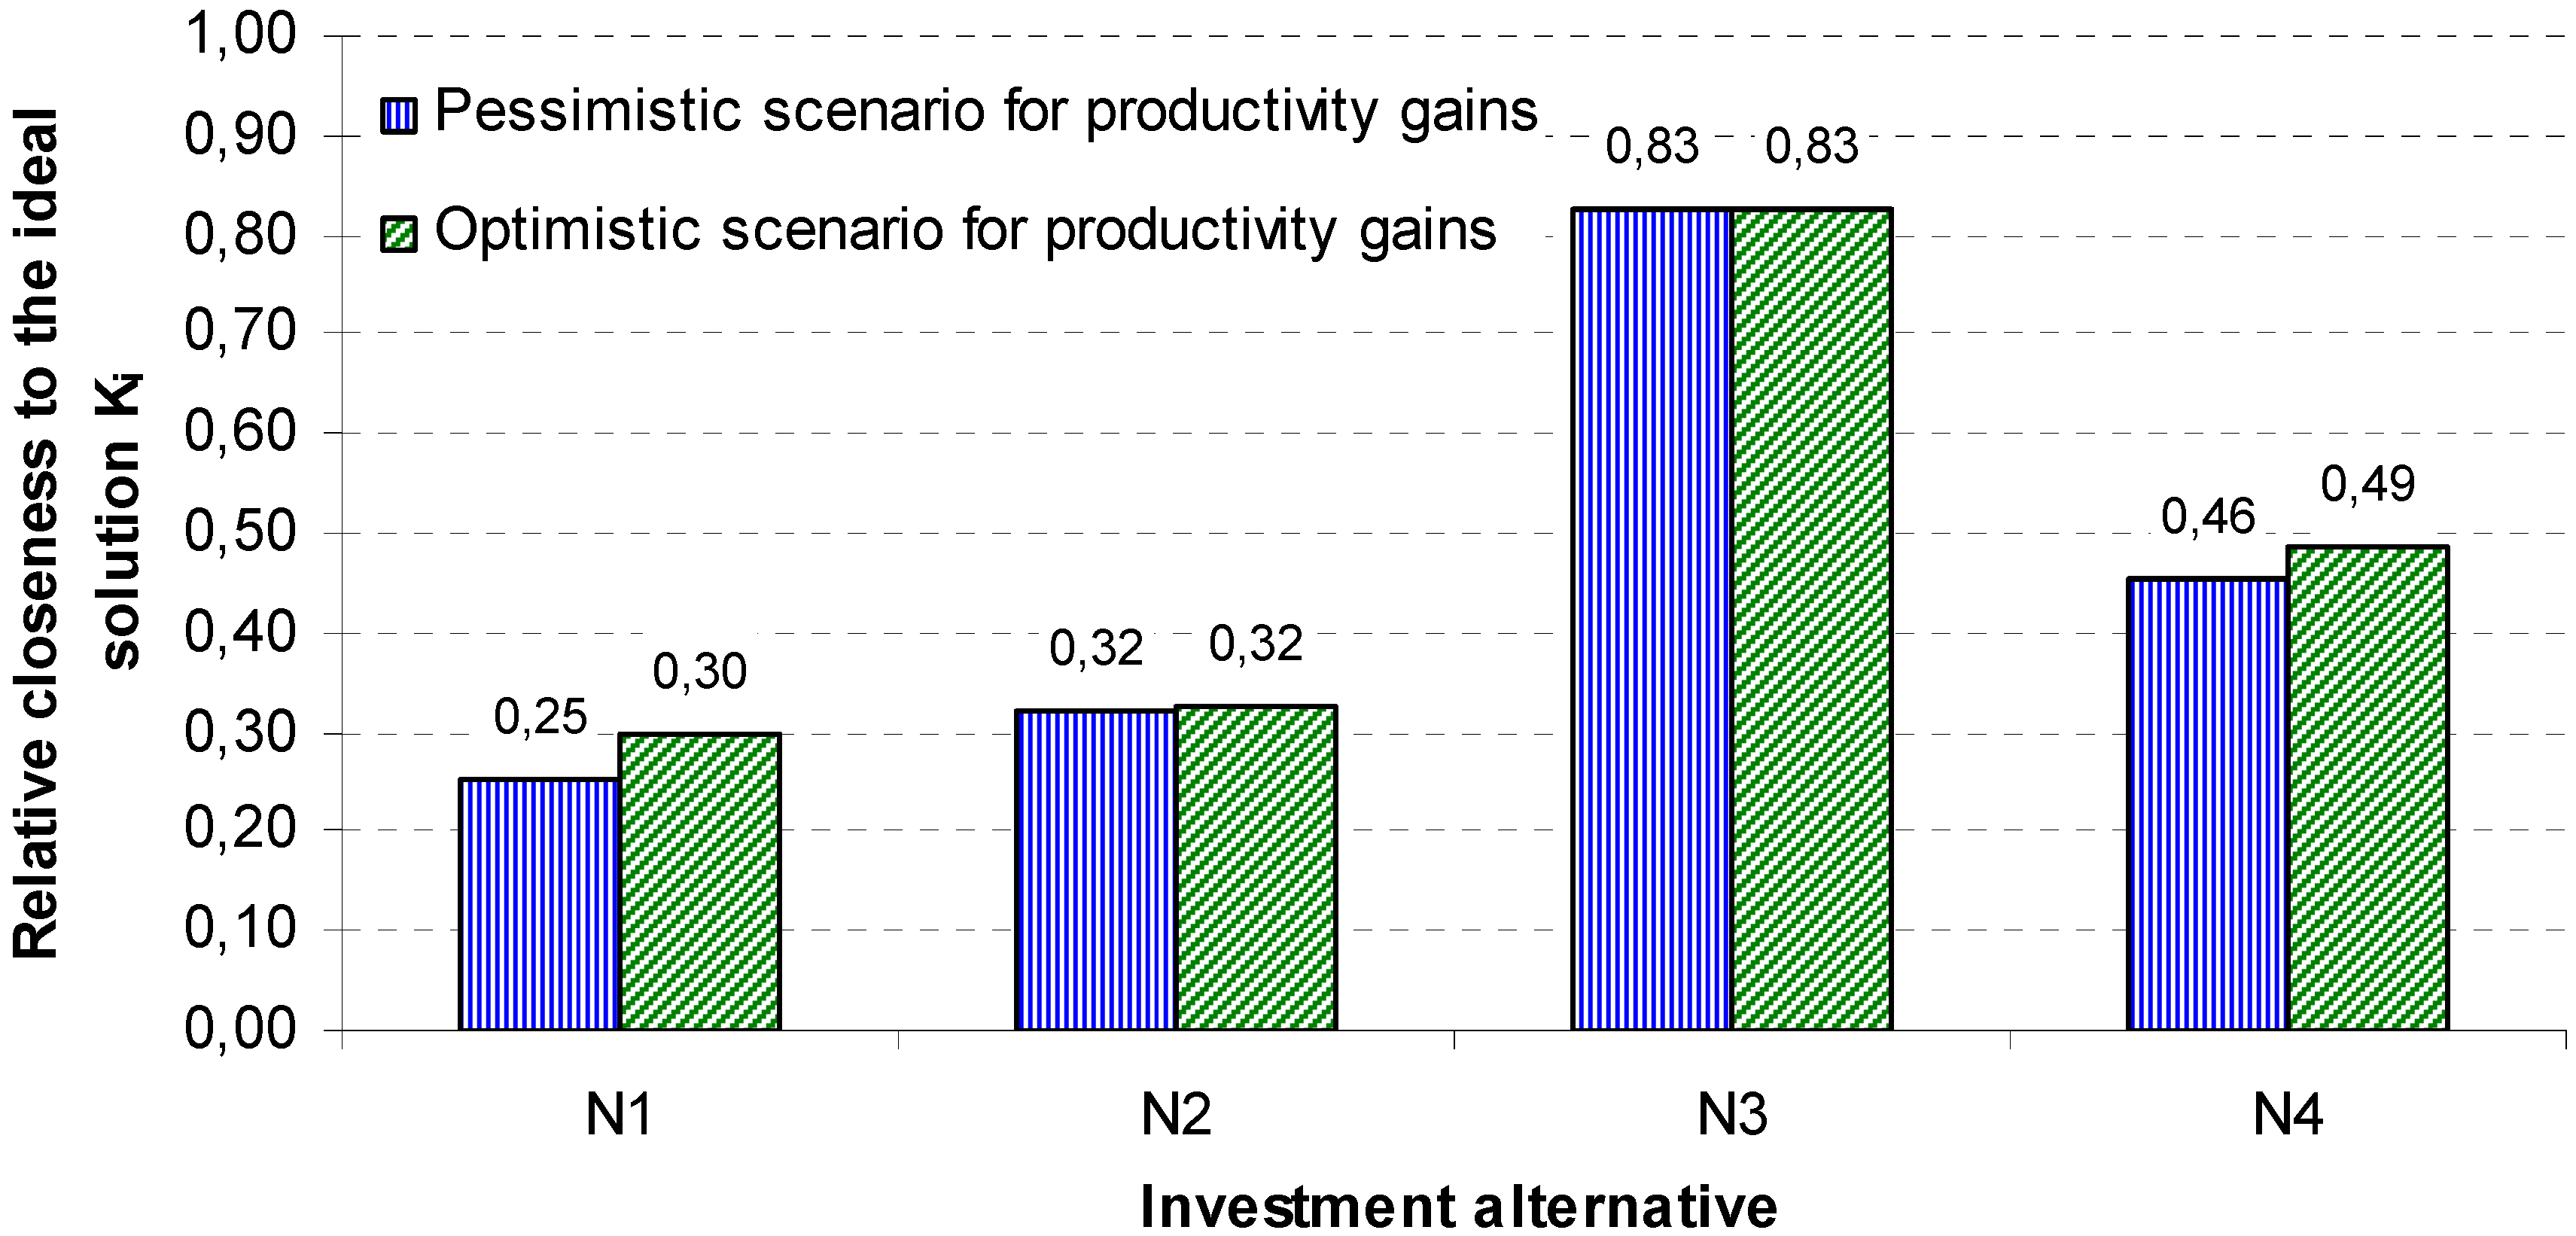
| N1 | 5.24 | 7.70 | n/a * | 0.58 (P1) |
| N2 | 0.87 | 1.54 | n/a | n/a |
| N3 | 1.32 | 4.82 | 3.21 (P2, P3) | 5.11 (P2, P3) |
| N4 | 0.57 | 3.85 | 0.14 (P1) | 0.58 (P1) |

4. Discussion
5. Conclusions
Conflicts of Interest
References
- Intergovernmental Panel on Climate Change (IPCC). Climate Change 2007; Fourth Assessment Report; IPCC: Geneva, Switzerland, 2007. [Google Scholar]
- Bosh, J.; Johnson, F.X.; Mertens, R.; Roubanis, N.; Loesoenen, P.; Gikas, A.; Gorton, J. Panorama of Energy: Energy Statistics to Support EU Politics and Solutions; ISSN 1831-3256; Eurostat: Luxembourg, 2008. [Google Scholar]
- International Energy Agency (IEA). Energy Balances of OECD Countries; ISBN 9789264180390; IEA: Paris, France, 2008. [Google Scholar]
- Levermore, G.J. A review of the IPCC assessment report four, part 1: The IPCC process and greenhouse gas emission trends from buildings worldwide. Build. Serv. Eng. Res. Technol. 2008, 29, 349–361. [Google Scholar] [CrossRef]
- Seppänen, O.; Fisk, W.J.; Lei, Q.H. Room Temperature and Productivity in Office Work. In Proceedings of the Healthy Buildings Congress, Lisbon, Portugal, 4–8 June 2006; Volume 1, pp. 243–247.
- Wyon, D.P.; Fang, L.; Meyer, H.W.; Sundell, J.; Weirsøe, C.G.; Sederberg-Olsen, N.; Tsutsami, H.; Agner, T.; Fanger, P.O. Limiting Criteria for Human Exposure to Low Humidity Indoors. In Proceedings of the 9th International Congress on Indoor Air Quality, Monterey, CA, USA, 2002; Volume 4, pp. 400–405.
- Seppänen, O.; Fisk, W.J.; Lei, Q.H. Ventilation and performance in office work. Indoor Air 2006, 16, 28–36. [Google Scholar] [CrossRef] [PubMed]
- Seppänen, O.; Fisk, W.J. Some quantitative relations between indoor environmental quality and work performance or health. HVAC R Res. 2006, 12, 957–973. [Google Scholar] [CrossRef]
- Frontczak, M.; Wargocki, P. Literature survey on how different factors influence human comfort in indoor environments. Build. Environ. 2011, 46, 922–937. [Google Scholar] [CrossRef]
- Lan, L.; Wargocki, P.; Lian, Z. Optimal thermal environment improves performance of office work. REHVA J. 2012, 49, 12–17. [Google Scholar]
- Bassam, M.; Cantin, R.; Guarracino, G. Comparison of thermal comfort algorithms in naturally ventilated office buildings. Energy Build. 2008, 40, 2215–2223. [Google Scholar] [CrossRef]
- Nikulin, G.; Kjellström, E.; Hansson, U.; Strandberg, G.; Ullerstig, A. Evaluation and future projections of temperature, precipitation and wind extremes over Europe in an ensemble of regional climate simulations. Tellus A. 2011, 63, 41–55. [Google Scholar] [CrossRef]
- Kaklauskas, A.; Zavadskas, E.K.; Raslanas, S. Multivariant design and multiple criteria analysis of building refurbishments. Energy Build. 2005, 37, 361–372. [Google Scholar] [CrossRef]
- Smid, J.W.; Nieboer, N. Energy-efficient asset management for professional landlords. Int. J. Strateg. Prop. Manag. 2008, 12, 19–34. [Google Scholar] [CrossRef]
- Tuominen, P.; Forsström, J.; Honkatukia, J. Economic effects of energy efficiency improvements in the Finnish building stock. Energy Policy 2013, 52, 181–189. [Google Scholar] [CrossRef]
- Djukanovic, R.; Wargocki, R.; Fanger, P. Cost-Benefit Analysis of Improved Air Quality in an Office Buildings. In Proceedings of the 9th International Conference on Indoor Air Quality and Climate Indoor Air, Monterey, CA, USA, 2002; pp. 808–813.
- Fisk, W.J. Health and productivity gains from better indoor environment and their relationship with building energy efficiency. Annu. Rev. Energy Environ. 2000, 25, 537–566. [Google Scholar] [CrossRef]
- Fisk, W.J.; Seppänen, O.; Faulkner, D.; Huang, J. Cost Benefit Analysis of Ventilation Control Strategies in an Office Building. In Proceedings of the Healthy Buildings 2003 Conference, Singapore, 7–11 December 2003; Volume 3, pp. 361–366.
- Fisk, W.J.; Brunner, G.; Doug, B. Benefits and Cost of Increasing Ventilation Rates in U.S. Offices. In Proceedings of the 12th International Conference on Indoor Air Quality and Climate—Indoor Air, Austin, TX, USA, 5–10 June 2011. Paper ID: 219.
- Hanssen, S.O. Economics vs. Indoor Climate—A Basis for Deciding Appropriate Measures and Rational Decision Models in Building Administration, Appendix 2. In The Economics of Indoor Climate: Providing Decision Support for Intervention; Workshop Report, ISBN 82-12-01192-5; Bake, J.V., Ed.; Research Council of Norway, Medicine and Health Division: Oslo, Norway, 2000. [Google Scholar]
- Kempinski, D.V. Air and Well Being—A Way to More Profitability. In Proceedings of the Healthy Buildings 2003 Conference, Singapore, 7–11 December 2003; Volume 3, pp. 348–354.
- Seppänen, O.; Vuolle, M. Cost Effectiveness of Some Remedial Measures to Control Summer Time Temperatures in an Office Building. In Proceedings of the Healthy Buildings Conference, Espoo, Finland, 6–10 August 2000; Volume 1, pp. 660–665.
- Wargocki, P.; Seppänen, O.; Andersson, J.; Boerstra, A.; Clements-Croome, D.; Fitzner, K.; Hanssen, S.O. Indoor Climate and Productivity in Offices: How to Integrate Productivity in Life-Cycle Cost Analysis of Building Services. In REHVA Guidebook No. 6; Federation of European Heating and Air-Conditioning Associations, REHVA: Brussels, Belgium, 2006. [Google Scholar]
- Jensen, K.L.; Toftum, J. Distribution of Thermal Sensation Votes in Offices Used to Model Annual Performance Decrements. In Proceedings of the Clima 2007 Wellbeing Indoors Conference, Helsinki, Finland, 10–14 June 2007.
- Ergonomics of the Thermal Environment E Analytical Determination and Interpretation of Thermal Comfort Using Calculation of the PMV and PPD Indices and Local Thermal Comfort Criteria; EN ISO 7730:2005; International Organisation for Standardisation: Genève, Switzerland, 2005.
- Hwang, C.L.; Yoon, K. Multiple Attribute Decision Making—Methods and Applications: A State-of-The-Art Survey; Springer-Verlag: Berlin, Germany, 1981. [Google Scholar]
- Triantaphyllou, E. Multi-Criteria Decision Making Methods: A Comparative Study; Springer: New York, NY, USA, 2000; Volume 44, pp. 5–21. [Google Scholar]
- Ventilation for Buildings—Design Criteria for the Indoor Environment; CEN Report, CR 1752; European Committee for Standardization: Brussels, Belgium, 1998.
- Comakli, K. Economic and environmental comparison of natural gas fired conventional and condensing combi boilers. J. Energy Inst. 2008, 81, 242–246. [Google Scholar] [CrossRef]
- Juodis, E. Extracted ventilation air heat recovery efficiency as a function of a building’s thermal properties. Energy Build. 2006, 38, 568–573. [Google Scholar] [CrossRef]
- Doddo, A.; Gustavsson, L.; Sathre, R. Primary energy implications of ventilation heat recovery in residential buildings. Energy Build. 2011, 43, 1566–1572. [Google Scholar] [CrossRef]
- Liao, Z.; Dexter, A.L. The potential for energy saving in heating systems through improving boiler controls. Energy Build. 2004, 36, 261–271. [Google Scholar] [CrossRef]
- Prívara, S.; Široký, J.; Ferkl, L.; Cigler, J. Model predictive control of a building heating system: The first experience. Energy Build. 2011, 43, 564–572. [Google Scholar] [CrossRef]
© 2013 by the authors; licensee MDPI, Basel, Switzerland. This article is an open access article distributed under the terms and conditions of the Creative Commons Attribution license (http://creativecommons.org/licenses/by/3.0/).
Share and Cite
Valancius, R.; Jurelionis, A.; Dorosevas, V. Method for Cost-Benefit Analysis of Improved Indoor Climate Conditions and Reduced Energy Consumption in Office Buildings. Energies 2013, 6, 4591-4606. https://doi.org/10.3390/en6094591
Valancius R, Jurelionis A, Dorosevas V. Method for Cost-Benefit Analysis of Improved Indoor Climate Conditions and Reduced Energy Consumption in Office Buildings. Energies. 2013; 6(9):4591-4606. https://doi.org/10.3390/en6094591
Chicago/Turabian StyleValancius, Rokas, Andrius Jurelionis, and Viktoras Dorosevas. 2013. "Method for Cost-Benefit Analysis of Improved Indoor Climate Conditions and Reduced Energy Consumption in Office Buildings" Energies 6, no. 9: 4591-4606. https://doi.org/10.3390/en6094591