Article

Performance Analysis of Cold Energy Recovery from CO2 Injection in Ship-Based Carbon Capture and Storage (CCS)

1
Division of Ocean Systems Engineering, Korea Advanced Institute of Science and Technology, 291 Daehak-ro, Yuseong-gu, Daejeon 305-701, Korea
2
Ocean Science and Technology School, Korea Maritime & Ocean University, 727 Taejong-ro, Youngdo-gu, Busan 606-791, Korea
*
Author to whom correspondence should be addressed.
Energies 2014, 7(11), 7266-7281; https://doi.org/10.3390/en7117266
Submission received: 30 June 2014 / Revised: 15 October 2014 / Accepted: 5 November 2014 / Published: 12 November 2014

Abstract

:
Carbon capture and storage (CCS) technology is one of the practical solutions for mitigating the effects of global warming. When captured CO2 is injected into storage sites, the CO2 is subjected to a heating process. In a conventional CO2 injection system, CO2 cold energy is wasted during this heating process. This study proposes a new CO2 injection system that takes advantage of the cold energy using the Rankine cycle. The study compared the conventional system with the new CO2 injection system in terms of specific net power consumption, exergy efficiency, and life-cycle cost (LCC) to estimate the economic effects. The results showed that the new system reduced specific net power consumption and yielded higher exergy efficiency. The LCC of the new system was more economical. Several cases were examined corresponding to different conditions, specifically, discharge pressure and seawater temperature. This information may affect decision-making when CCS projects are implemented.

Graphical Abstract

1. Introduction

Global warming caused by greenhouse gases is a significant issue. The Intergovernmental Panel on Climate Change (IPCC) reported that the emissions of greenhouse gases grew more quickly between 2000 and 2010 than in any of the three previous decades, and it is essential to lower emissions by 40 to 70 percent compared with 2010 by mid-century [1]. Many possible solutions for minimizing the effects of global warming can be categorized as low-carbon technologies, including using renewable energy, saving energy and improving system efficiency in industry. Among these efforts, carbon capture and storage (CCS) technology has been acknowledged as one of the most practical methods for reducing CO2 emissions [2].
CCS technology mitigates CO2 emissions from large-emission sources by capturing and isolating CO2. There are many ongoing injection projects in the world, and the following storage sites are regarded as reasonable candidates for injecting the CO2 after it has been isolated: a depleted gas/oil reservoir, where the CO2 is used for enhanced oil recovery (EOR), or a geological formation, such as a saline aquifer [3,4].
An injection system injects CO2 into a geological storage site and consists of a pressurization and heating process to prevent operational problems [5,6,7]. In the heating process, the temperature of the CO2 is increased by a heating medium, and the CO2 releases its cold energy into the medium; seawater is typically employed as the heating medium in offshore installations or power plants located close to the open sea [8]. The energy from the difference between the temperature of the freezing source and the environmental temperature is called cold energy, and this cold energy is wasted during the heating process in the conventional injection system.
The liquefied natural gas (LNG) industry has some practical applications for using cold energy. The LNG cold energy is utilized during regasification, which changes the phase of the natural gas from liquid to vapor. There are two ways to take advantage of LNG cold energy: direct and indirect. The direct method includes the liquefaction of oxygen and nitrogen, the production of dry ice, and frozen food complexes. The indirect method creates electrical power from the LNG cold energy. In this study, we examined indirect use. A power-generation cycle with cold-energy recovery is typically installed in LNG receiving terminals. Choi et al. [9] proposed the concept of a cascade Rankine cycle, which recovers LNG cold energy for use in power generation. This study showed the cascade Rankine cycle exhibited better performance than other conventional power cycles, including a direct expansion cycle, an organic Rankine cycle, and a combined cycle. Shi et al. [10] proposed a combined-power system that consisted of a Rankine cycle with an ammonia-water mixture as the working fluid and an LNG power generation cycle to utilize LNG cold energy. They performed several parametric analysis to improve the efficiency of the system. Wang et al. [11] refined a combined-power cycle, which can recover low-temperature waste heat by harnessing LNG cold energy, and optimized the operating parameters in terms of thermodynamics.
Although many studies have addressed electricity generation using LNG cold energy, no studies have focused on using CO2 cold energy during injection. Other studies developed solutions for general problems that arise during the injection. Vilarrasa et al. [12] proposed injecting CO2 in a liquid state rather than a super critical state and showed that the proposed way is more favorable. Hosa et al. [3] studied recent work on practical injections of CO2 and investigated geologically relevant parameters of each project, including depth, reservoir quality and injectivity, cost, and rate. Michael et al. [4] reviewed the experience gained from pilot and commercial injection projects covering a detailed examination of data from existing projects, an assessment of monitoring technologies, and potential issues associated with scaling up to multi-well, commercial CO2 injection schemes. Krogh et al. [6] simulated a dynamic model of injection for liquefied CO2.
This study proposes a new CO2 injection system with cold energy recovery and compares the specific net power consumption, the exergy efficiency and the economic effects of the new system with those of the conventional system. The system is based on a CO2 injection system in a ship-based CCS chain that stores the contents in a geological formation. After describing the main features of the conventional system, the new system is proposed. To evaluate the system efficiency, the specific net power consumption and exergy efficiency are analyzed. To estimate the economic effects, the life-cycle cost (LCC) is analyzed. Furthermore, a sensitivity analysis is investigated with respect to discharge pressure and seawater temperature.

2. Description of Injection System

2.1. System 1: Conventional Injection System

There are several existing injection models. A report by Chiyoda Corp. described the injection flow, which was composed of pressurization and heating. Liquid CO2 was pressurized and heated from −10 °C and 26.5 bar to 5 °C and 100 bar. In this report, seawater was utilized to increase the temperature of the liquid CO2 [13]. The injection concept suggested by Aspelund et al. contained a pump and a heater to process the CO2 from −52 °C and 6.5 bar to 15 °C and 200 bar. This study also explained the applicability of seawater as a heating medium. However, another type of heating system was considered, because the temperature of the seawater was too low in the North Sea; the low temperature can freeze heat exchangers [14]. The injection model used by European technology platform for zero emission fossil fuel power plants (ZEP) pressurized and heated the CO2 from −55 °C and 7 bar to 0 °C 60 bar using onboard waste heat [15]. Espen Krogh simulated two injection fields in Norway: Snøhvit and Sleipner. In the Snøhvit and Sleipner fields, the liquid CO2 went through the injection process from −53 °C and 8 bar to 0 °C and 124 bar and from −20 °C and 20 bar to 0 °C and 118 bar respectively [6].
Figure 1 shows a process-flow diagram for a conventional injection system employing seawater in the heating system. Liquefied CO2 is stored in a storage tank on the CO2 carrier at a condition near the triple point, 5.2 bar and −57 °C. First, a pump pressurizes the CO2 pressure to a target pressure. After pressurization, the CO2 is heated with sea water. Finally, the pressurized and warmed CO2 is injected into a geological formation. The stream data presented in Figure 1 is the case assumed in this study.
Pressurization and heating are utilized to avoid several operational problems. First, the pressurization serves to overcome the bottom-up pressure of the storage site and to avoid a phase transition [5]. Second, heating serves to prevent hydrate formation and icing during the injection [6]. A hydrate can form if there is water in the CO2 flow or in the reservoir at a low temperature [7]. Such a formation precipitates the breakdown of pipelines or processing facilities, including the pump. Therefore the cold CO2 needs to be warm by exchanging heat with the heating medium.
Figure 1. Conventional injection system.
Energies 07 07266 g001
In this heating process, the wasted CO2 cold energy is estimated as 33.6 million kWh when 1 million tons of CO2 is treated annually. When the CO2 is pressurized and heated to a target conditions of 5 °C and 100 bar, the cold energy in CO2 is approximately 120.8 kJ/kg, which equals a power output of 33.6 kWh per ton of CO2. This value indicates sensible heat. This amount of energy is lower than that in the application of LNG cold energy, which consumes approximately 864 kJ/kg including sensible heat and latent heat [16]. The CO2 cold energy may be recovered, but it is absorbed into the seawater with no useful effects.

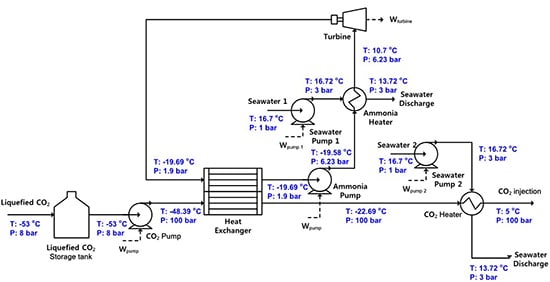
2.2. System 2: New Injection System with a Rankine Cycle

This study proposes a new injection system to recover wasted cold energy. The new injection system uses the conventional pressurization and heating mechanisms. However, as shown in Figure 2, the new system employs a Rankine cycle. In the process, the liquefied CO2 is pressurized. After pressurization, it is heated in advance by a working fluid utilized in the Rankine cycle. This working fluid should be warmer than the liquefied CO2 to absorb the cold energy from the CO2 flow. In most cases, the warmed CO2 is heated again by seawater because its temperature remains too low to prevent hydrate formation. The stream data presented in Figure 2 is the case assumed in this study.
Figure 2. New injection system.
Energies 07 07266 g002
The Rankine cycle generates electrical power and comprises four processes: heat absorption, expansion, heat discharge, and compression. As shown in Figure 3, the pressure-enthalpy diagram of ammonia explains a sequential process in the Rankine cycle. First, the working fluid is vaporized by absorbing the heat from the seawater to force vapor to enter into a turbine (B→C). After vaporization, the working fluid expands through the turbine, thereby reducing the pressure and the temperature (C→D). In this process, electrical power is produced. This electrical power represents the difference in the enthalpy between points C and D. The exhausted working fluid is condensed from the cold energy received from the CO2 liquid (D→A) and is pressurized (A→B).
Figure 3. P-h diagram of working fluid.
Energies 07 07266 g003
Ammonia serves as the working fluid of the Rankine cycle in the new injection system because it yields the highest performance in terms of power generation. Three working fluids are examined, and they can cause a phase transition between vapor and liquid inn the temperature range of the injection system. Although several considerations may be involved in selecting a working fluid, only the amount of power generation is considered here, which is summarized in Table 1.
Table 1. Characteristics of the working fluid.
Working fluidBoiling point (°C)Produced work per mass (kJ/kg)
C3H8 (Propane)−4265.4
C4H10 (i-Butane)−1323.9
NH3 (Ammonia)−33121.9

3. Comparison Approaches

3.1. Basis of Simulation

To investigate the system performance and economic effects, a process simulation is conducted using commercial code HYSYS, with Table 2 enumerating the required assumptions. The Ulleung Basin in the East Sea of Korea is assumed to be the storage location, and its environmental conditions are considered.
Table 2. Assumptions underlying the process simulation.
ItemNote
LocationUlleung Basin in the East Sea of Korea
Composition of CO2Pure CO2
Inlet conditions8 bar, −53 °C
Outlet conditions100 bar, 5 °C
Flow rate580 ton/h
Seawater temperature16.6 °C
Discharge pressure of seawater pump3 bar
Discharge seawater temperature±3 °C
Equation of statePeng-Robinson
Turbine efficiency80%
Pump efficiency75%
Working fluidNH3

3.2. Specific Net Power Consumption and Thermal Efficiency

Specific net power consumed in a system is an appropriate measure for comparison. The specific power ( w ˙ ) is defined as work divided by unit mass (ton):
w ˙ =   W ˙ / m
The specific net power consumption ( w ˙ n e t ) is defined as the difference between the power output and the power input:
w ˙ n e t =   w ˙ o u t p u t   w ˙ i n p u t
w ˙ o u t p u t indicates the power produced by the system per unit mass. The power output is generated in the shaft work performed by the turbines utilizing CO2 cold energy:
w ˙ o u t p u t =   i w ˙ t u r b i n e ,   i  
where w ˙ i n p u t indicates the required power into the system per unit mass. This power input is supplied at the pumps to boost the CO2, the working fluid, and the heating medium:
w ˙ i n p u t =   i w ˙ p u m p _ C O 2 ,   i   +   i w ˙ p u m p _ W F ,   i   +   i w ˙ p u m p _ S W ,   i  
The thermal efficiency refers to energy efficiency, specifically to how well an energy conversion is achieved. The definition of thermal efficiency depends on the type of system being examined. When a system receives heat and generates work, its thermal efficiency ( η t h ) is defined as:
η t h =   W ˙ n e t / Q ˙ i n p u t
System 1 has no energy conversion, whereas system 2 produces electrical power from the cold energy. The thermal efficiency of system 1 becomes 0 because the system only consumes work and heat, whereas the system 2 assumes a certain value for its non-zero specific net power.

3.3. Exergy Efficiency

Exergy is defined as a measure of the maximum potential of a system to perform work. This maximum potential indicates the maximum useful work that is obtainable from a system at a given state in a given environment. In other words, any system in a state different from the environment contains exergy and is capable of performing work. Exergy ( E x ̇ ) is calculated using the following equation:
E x ̇ =   n ˙ ( h     T 0 s ) n ˙ 0 ( h 0 T 0 s 0 )
The exergy efficiency can be determined for part of a certain process as a control volume, though there is no work interaction between the system and the surroundings. This provides advantages to comparing the performance of the systems in which we are interested; system 2 produces work using a heat source in its surroundings, but system 1 has no work output. Therefore, exergy efficiency is required to estimate the different features of the system. The control volume of systems 1 and 2 is presented in Figure 4.
Figure 4. Control volume of each system. (a) System 1; (b) System 2.
Energies 07 07266 g004
The general exergy efficiency ( η e x ) is calculated as the ratio between the exergy gained and the exergy expended:
η e x =   E x e r g y   g a i n e d E x e r g y   e x p e n d i t u r e
Then, exergy gained in a system and exergy loss in each equipment are:
E x e r g y   g a i n e d = E x e r g y   e x p e n d i t u r e E x e r g y   l o s s
E x e r g y   l o s s = n ˙ i n e x i n n ˙ o u t e x o u t + i Q ˙ i ( 1 T 0 T i ) + j W ˙ j
Finally, the exergy efficiency is arranged:
η e x = 1 n ˙ i n e x i n n ˙ o u t e x o u t +   i Q ˙ i ( 1 T 0 T i ) + j W ˙ j E x e r g y   e x p e n d i t u r e
In the CO2 injection system, the exergy expenditure is divided into two parts. One part refers to the work supplied to the system, and the work is a type of perfect exergy, which can be utilized fully. The other part refers to the difference between the exergy entering and the exergy leaving the system with respect to the CO2 flow. This exergy expenditure decreases as the process occurs, and the exergy gained is lower than the exergy expended because of the irreversibility of the equipment.
In the numerator, the first two terms represent the exergy entering and leaving the system with a certain flow rate ( n ˙ ). The third term is the net power obtainable from the heat transfer ( Q ˙ i ), and the final term is the net power supplied to the system ( W ˙ j ). There is no heat transfer in the two systems, so the heat transfer term is eliminated. System 2 produces electrical power. Therefore, net power supplied to the system ( W ˙ ) decreases.
Finally, the exergy efficiency of each system is defined by the following equations:
System 1
η e x = 1 n ˙ i n e x C O 2   i n n ˙ o u t e x C O 2   o u t + n ˙ i n e x S W   i n n ˙ o u t e x S W   o u t + W ˙ p n ˙ i n e x C O 2   i n n ˙ o u t e x C O 2   o u t + W ˙ p
System 2
η e x = 1 n ˙ i n e x C O 2   i n n ˙ o u t e x C O 2   o u t + n ˙ i n e x S W   i n n ˙ o u t e x S W   o u t + W ˙ p W ˙ t n ˙ i n e x C O 2   i n n ˙ o u t e x C O 2   o u t + W ˙ p
Exergy loss ( Δ E x ̇ l o s s ), which indicates exergy destruction, necessarily occurs in systems because of heat transfer, fluid friction, and energy dissipation with respect to the surrounding environment. The following equations present the exergy loss in different equipment. The exergy loss in each piece of equipment includes the exergy difference between the inlet and outlet. Here, the power consumed in a pump is added to the calculation of the exergy loss for a pump. In contrast, the power produced in a turbine is subtracted from the exergy loss of a turbine [17]:
Pump:
Δ E x ̇ l o s s =   n ˙ ( e x i n e x o u t ) + W ˙ p
Turbine:
Δ E x ̇ l o s s = n ˙ ( e x i n e x o u t ) W ˙ t
Heat exchanger:
Δ E x ̇ l o s s =   i = 1 n ˙ n ˙ i ( e x i ,   i n e x i ,   o u t )

3.4. Life-Cycle Cost

The life-cycle cost (LCC) method is employed to compare two systems. Although system 2 has higher system efficiency than system 1, it may not be cost effective. Therefore, it is important to estimate its economic effects. LCC analysis is an economic method for estimating all costs arising from the ownership, operation, and maintenance of equipment. These costs are organized as capital expenditures (CAPEX) and operational expenditures (OPEX). CAPEX are incurred when a business spends money to buy fixed assets, i.e., non-consumable parts for the system. OPEX are the costs required to operate a business or a system:
C L C C = C C A P E X + C O P E X
Only the costs of process facilities are considered to calculate the CAPEX in this study because the facilities are installed on the CO2 carrier. The costs are calculated with the commercial code, Aspen Economic Analyzer:
C C A P E X = C f a c i l i t i e s
The main costs contributing to the OPEX are those of energy consumption and maintenance. The cost of energy consumption occurs during the pressurization process, and the maintenance cost is assumed to be 1% of the CAPEX. Marine diesel oil (MDO) is used to estimate the cost of energy consumption [18]:
C O P E X = C E n e r g y   c o n s u m p t i o n + 0.01 C C A P E X
Table 3 shows assumptions for estimating the OPEX.
Table 3. Assumptions for estimating the OPEX.
ItemValue
Injection time24 h/ship
The number of voyages72/year
MDO consumption rate180 g/kWh
MDO price1,000 $/ton
Life time20 years

4. Results and Discussion

4.1. Specific Net Power Consumption

The net power supplied to system 2 is lower than that supplied to system 1, and the difference is the produced power from the Rankine cycle. The net power of system 1 is approximately 2060 kW, and this work is consumed to pressurize the liquid CO2 and seawater. System 2 has a slightly higher power input compared to the system 1. However, the generated work from the Rankine cycle reduced the net power consumption of the system by approximately 706 kW. Figure 5 explains the specific net power of each system required to treat 1 ton of CO2. In system 2, 1.2 kW/ton was saved, and the system used 2.3 kW/ton, while system 1 consumed 3.5 kW/ton.
Figure 5. Specific net power consumption of each system.
Energies 07 07266 g005

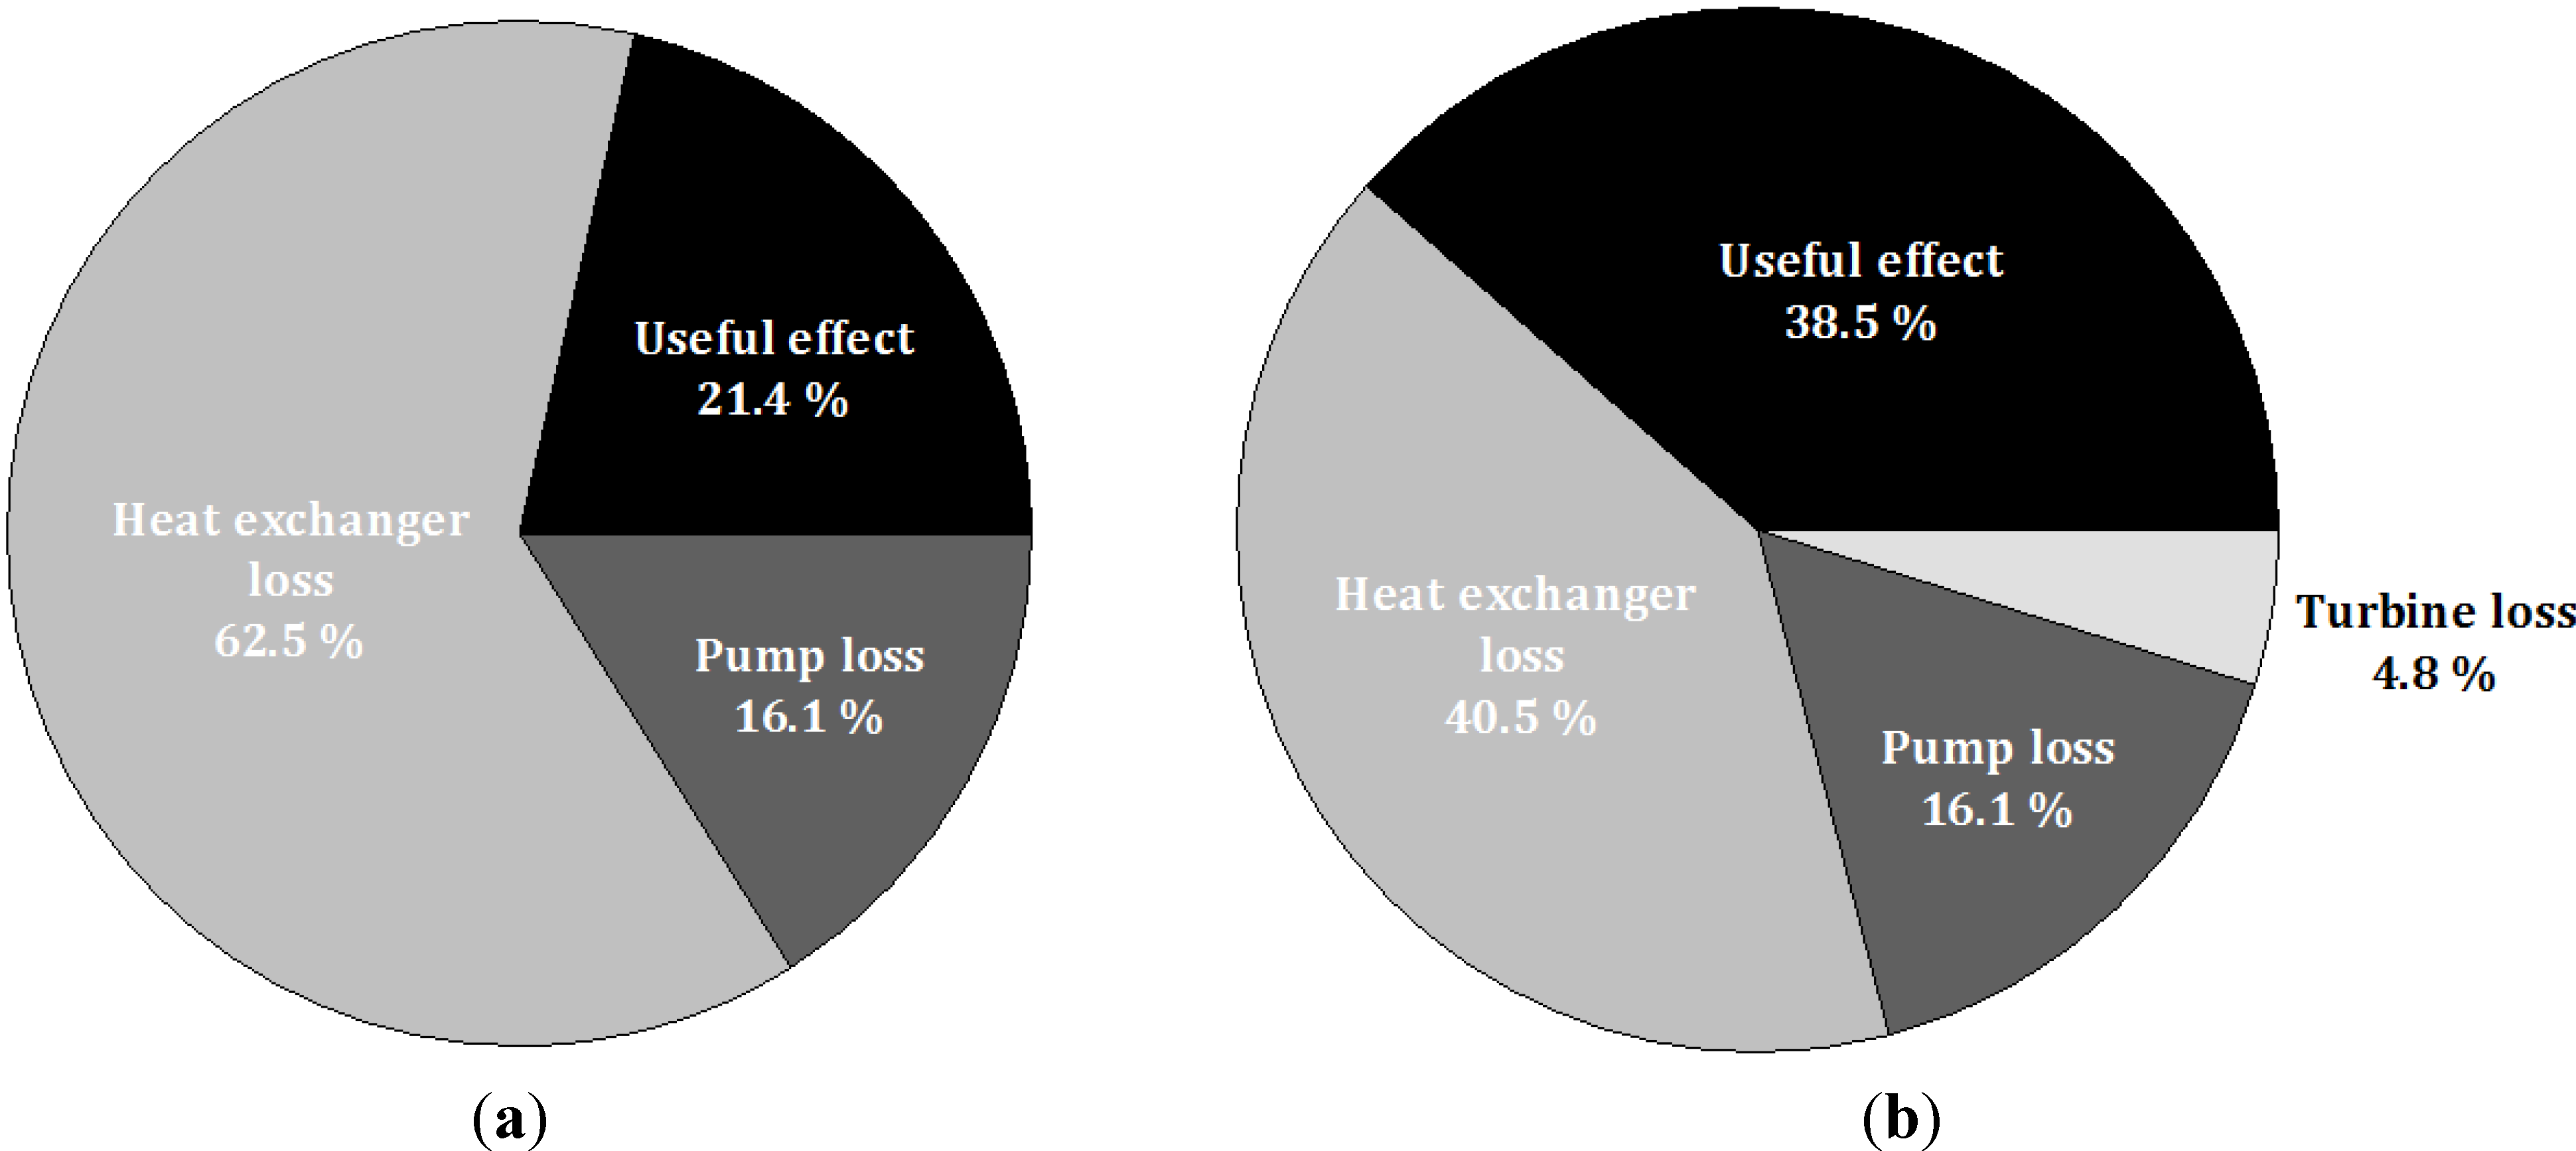
4.2. Exergy Efficiency

To determine the performance of each system, the exergy efficiency was analyzed. The useful effect of system 2 was found to be 17.1% higher than that of system 1, as shown in Figure 6. The reason for the higher exergy efficiency of system 2 is the reduced exergy loss and the produced work from the turbine. The additional exergy loss occurs at the turbine and the pump, as this system has more processing facilities than system 1. However, the exergy loss of the heat exchanger decreases considerably from 62.5% to 40.5% during the heating of the CO2 with the working fluid before heat exchange occurs with seawater.
Figure 6. Exergy efficiency of each system. (a) System 1; (b) System 2.
Energies 07 07266 g006

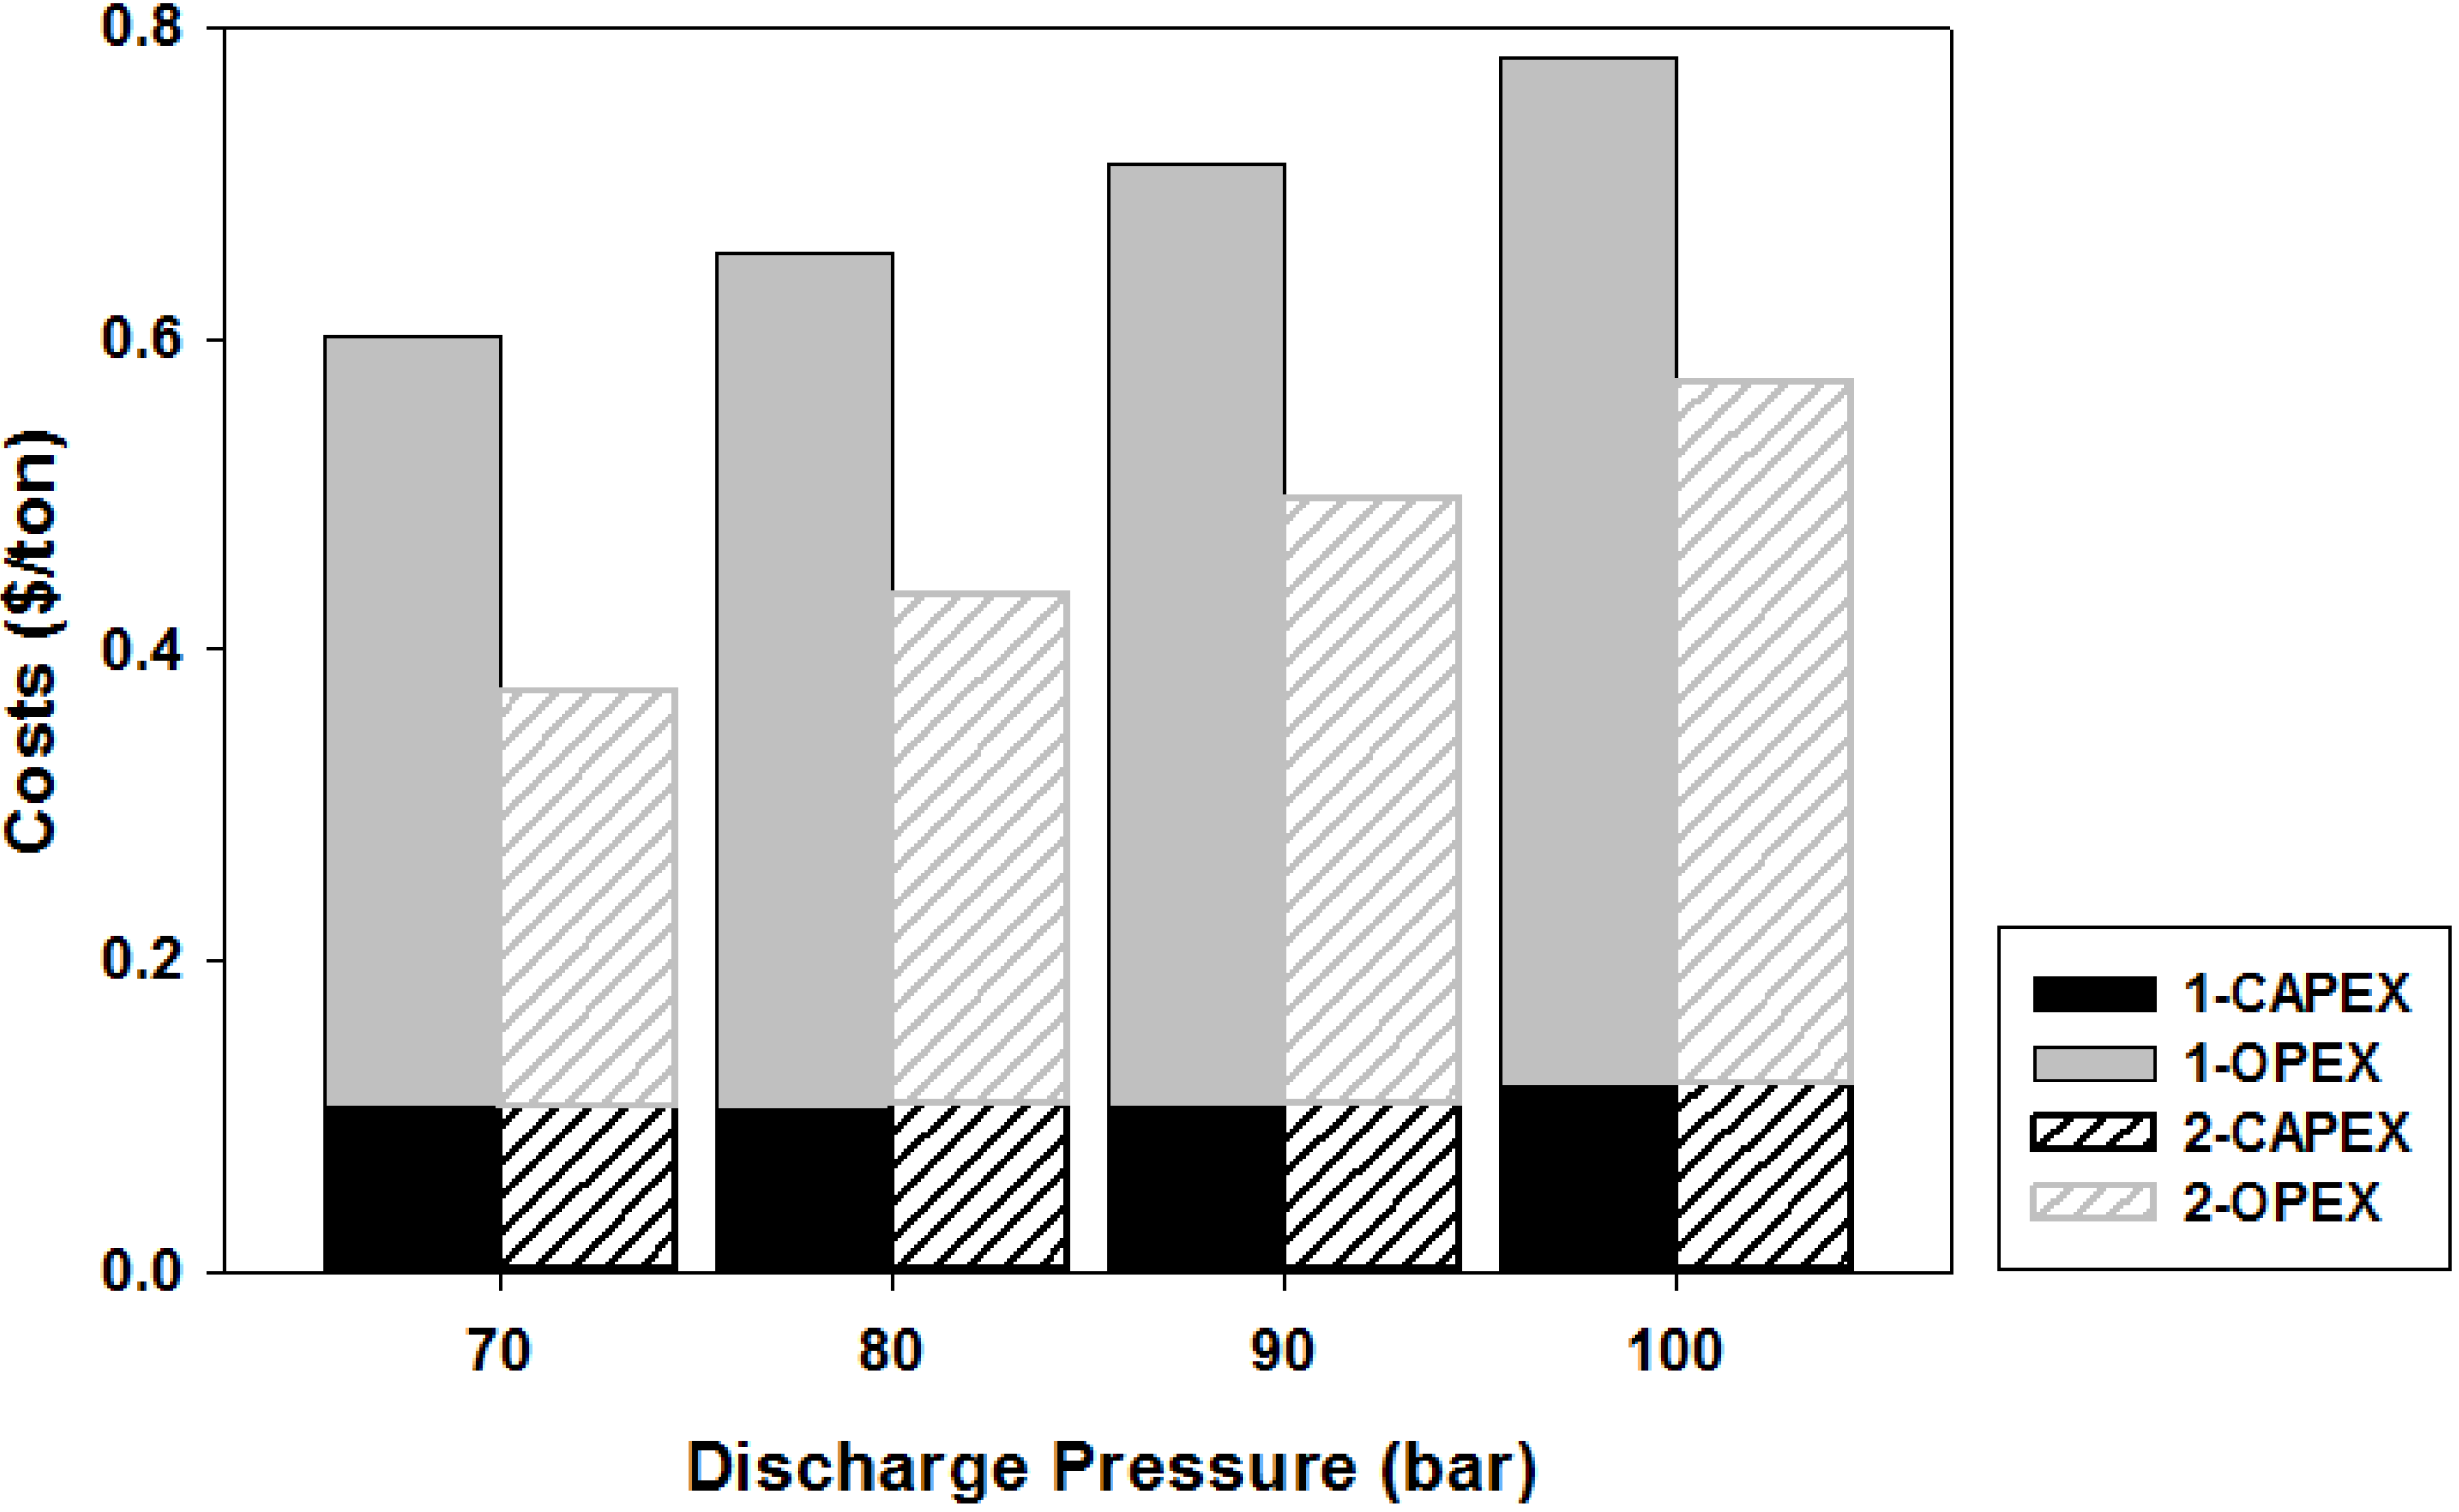
4.3. Life-Cycle Cost

The LCC indicated that the total costs of system 2 were lower than those of system 1, when 1 ton of CO2 was treated. There was a minor gap in the CAPEX between two systems, as shown in Figure 7. As more facilities are installed, the CAPEX increases slightly. However, the OPEX required by each system were considerable, with 0.21 dollars per ton of CO2, which equals costs of to 4.26 million dollars spent over the operating life of the systems.
Figure 7. Life-cycle cost of each system.
Energies 07 07266 g007

4.4. Sensitivity Analysis

This study performed a sensitivity analysis to analyze the influence of the two main factors that may influence the specific net power consumption, the exergy efficiency, and the LCC: discharge pressure and seawater temperature.

4.4.1. Discharge Pressure

Because the required injection pressure may differ depending on the location of the storage, the effects of different discharge pressures should be investigated. A larger specific net power was required when the discharge pressure increased, as shown in Figure 8. This is because the pressurization process required a higher energy input into the system.
Figure 8. Specific net power consumption at different discharge pressures.
Energies 07 07266 g008
The exergy efficiency decreased slightly, but the efficiency remained consistent across different discharge pressures within a range of 1%, as shown in Figure 9. When the discharge pressure increased, the exergy loss of the heat exchanger decreased, whereas that of the pump was increased. After the pressurization process, the temperature of the CO2 was increased, which helped to reduce the loss at the heat exchanger by minimizing the temperature difference between the heating medium and the cooling medium. Because the loss at the pump was higher than that at the heat exchanger, the exergy efficiency decreased slightly at the higher discharge pressure.
The LCC increased as the discharge pressure of the system increased, as shown in Figure 10. The main reason for this result was the increase in the specific net power resulting from the increased discharge pressure, thereby requiring greater expenditure.
Figure 9. Exergy efficiency at different discharge pressures. (a) System 1; (b) System 2.
Energies 07 07266 g009
Figure 10. Life-cycle cost at different discharge pressures.
Energies 07 07266 g010

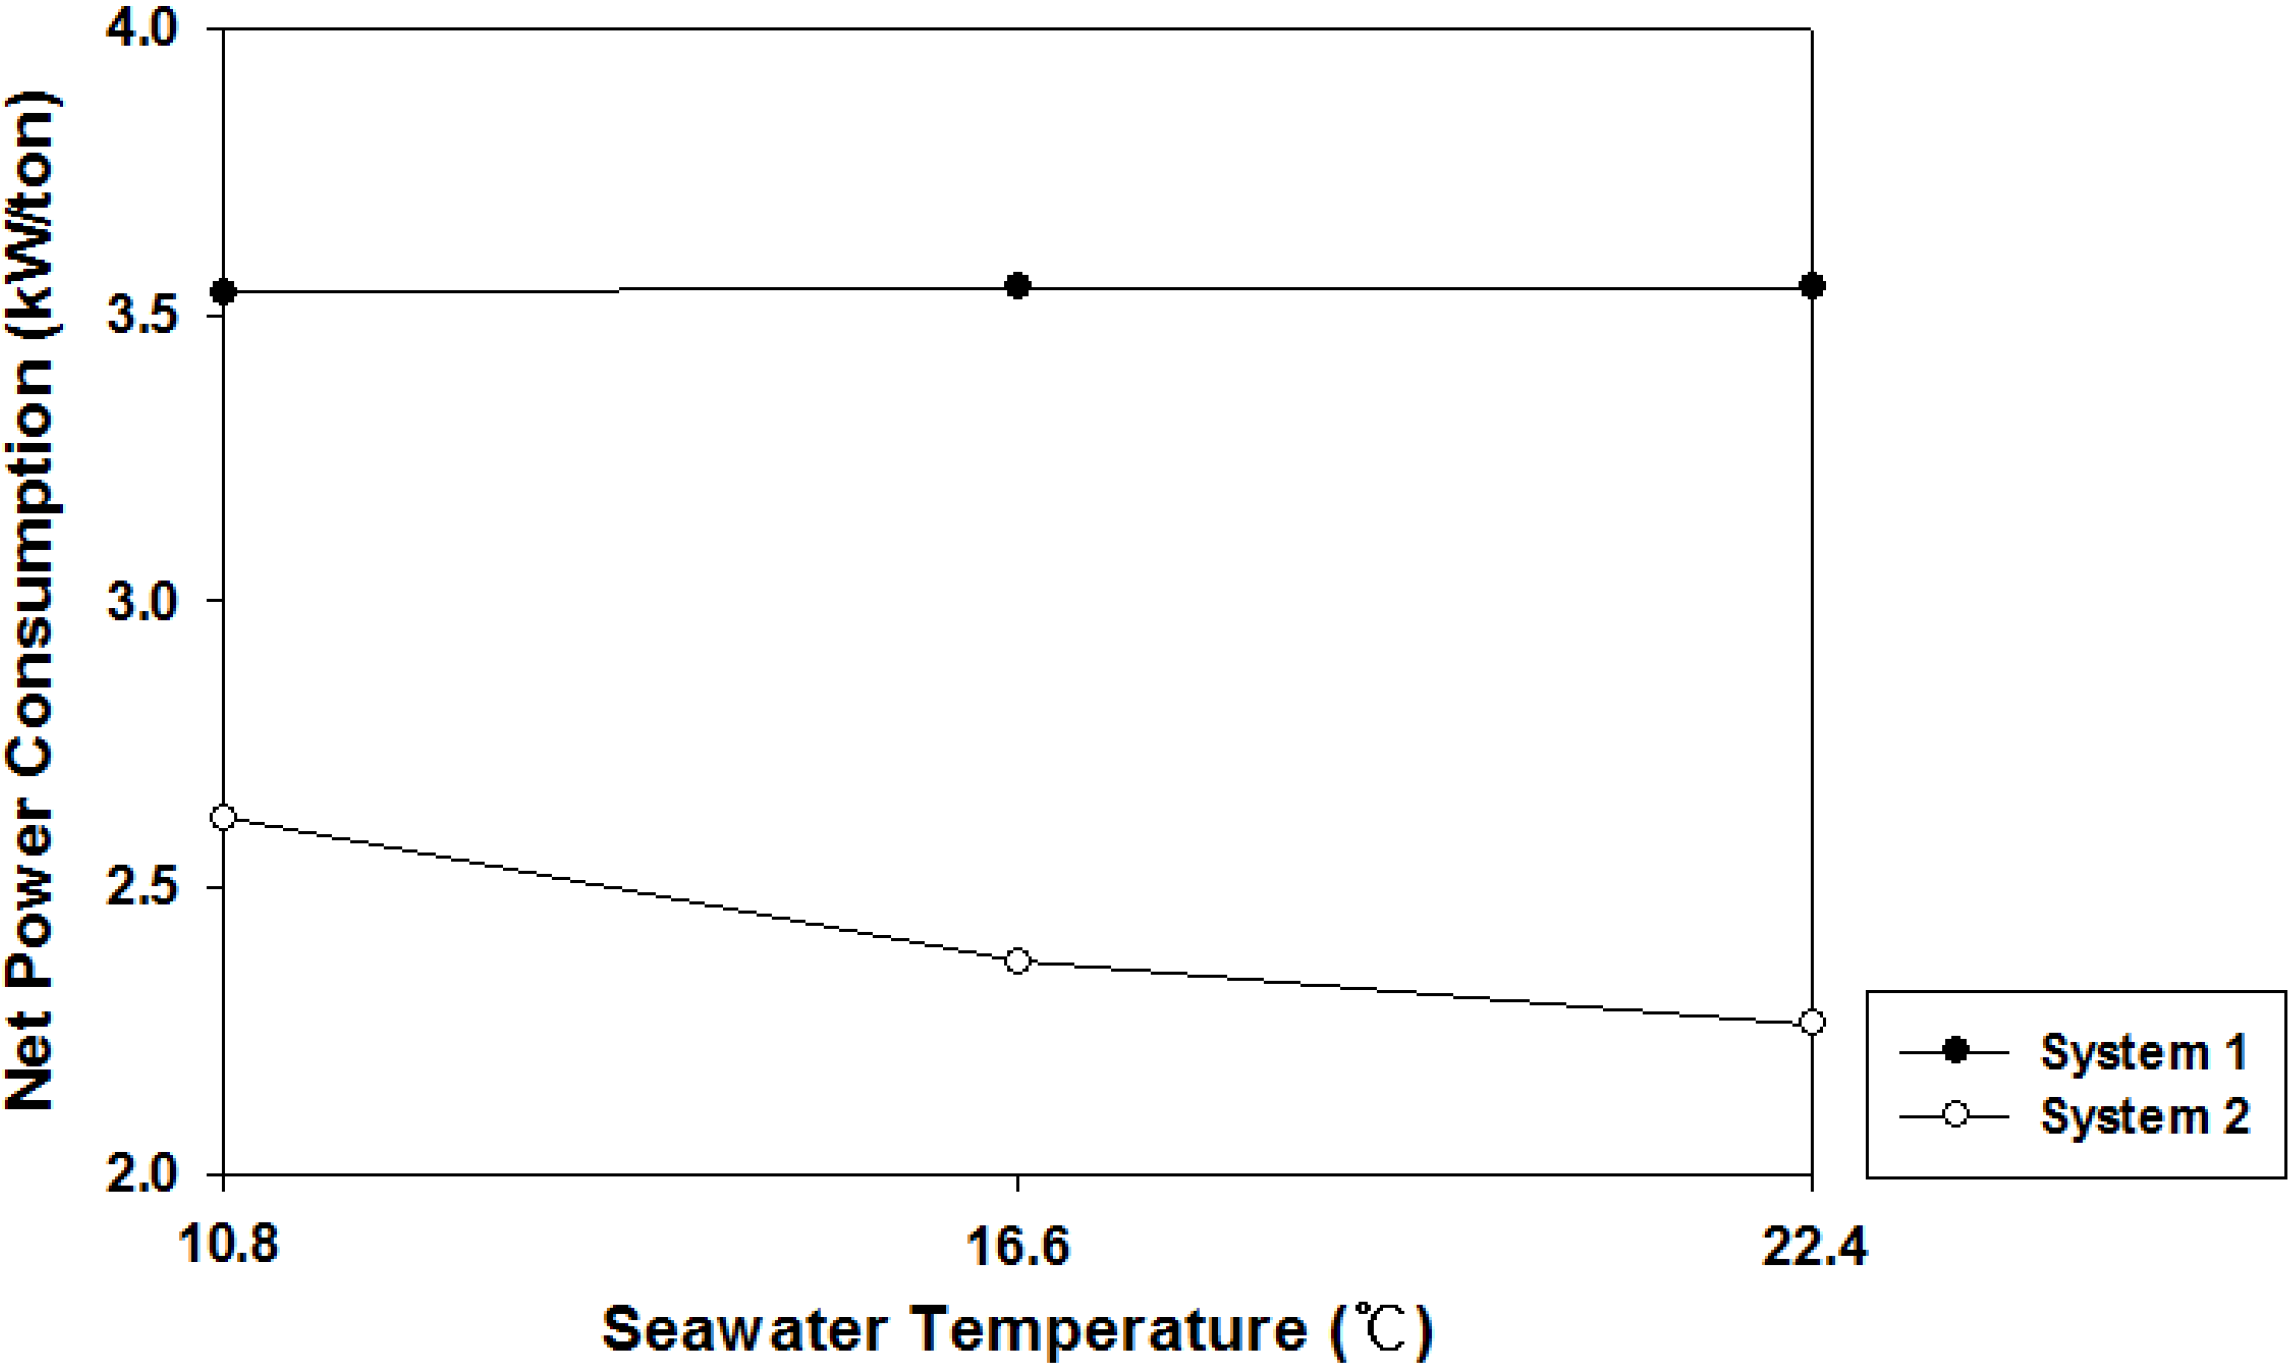
4.4.2. Seawater Temperature

The characteristics of the system change because the temperature of seawater varies with location and season. During the heating process of the injection system, seawater is used, and the temperature of the seawater affects the characteristics of the system.
The specific net power consumption of each system at different seawater temperatures is shown in Figure 11. In system 1, the specific net power consumption remained constant, but that of system 2 decreased when the seawater temperature increased. The p-h diagram in Figure 3 explains this relationship between specific net power and seawater temperature. If the seawater temperature is high, then B-C line (evaporating process) moves upward. Therefore, the difference in enthalpy from C to D increases. This gap makes the cycle produce more electrical power.
Figure 11. Specific net power consumption at different seawater temperatures.
Energies 07 07266 g011
The exergy efficiency decreased when the seawater temperature increased, as shown in Figure 12. This tendency resulted from the increase in the exergy loss of the heat exchanger. As the temperature of the heating medium increases, more heat is lost because of the high temperature difference between the heating medium and the cooling medium.
Figure 12. Exergy efficiency at different seawater temperatures.
Energies 07 07266 g012
As shown in Figure 13, The LCC decreased when the seawater temperature increased because the high temperature of the seawater enables the Rankine cycle to generate more electrical power.

4.5. Discussion

The results of this study shows the applicability of CO2 cold energy wasted in conventional injection systems. The better performance of system 2 comes from power generation through a Rankine cycle. The main reason for this is that the low temperature of liquid CO2 flow has a role as a heat sink in the cycle. It is impossible for any device that operates on a cycle to receive heat from a sole reservoir and produce the full amount of work in accordance with second law of thermodynamics. It implies the working fluid has to exchange heat with a heat sink and a heat source. In system 2, seawater provides heat to the working fluid as the heat source and liquid CO2 absorbs the heat from the working fluid as heat sink. With this principle, the produced electrical power reduces the net power required in the injection system and recovers additional exergy. This energy savings results in the reduction of energy consumption costs. As a results, the OPEX is decreased.
Figure 13. Life-cycle cost at different seawater temperatures.
Energies 07 07266 g013

5. Conclusions

A new CO2 injection system was proposed, which uses the Rankine cycle to recover wasted heat. The proposed system showed a better performance with respect to several comparison measures. The specific net power supplied into the system decreased by approximately 1.2 kW/ton, and the exergy efficiency was also higher than that of the conventional system, by approximately 17.1%. The CAPEX was slightly higher, but the OPEX was considerably reduced by approximately 0.21 dollars/ton. Two conditions were varied during the investigation: discharge pressure and seawater temperature. The exergy efficiency remained approximately unchanged, but more LCC was used as the discharge pressure increased. As seawater temperature increased, the exergy efficiency decreased, but the costs also decreased as the seawater temperature increased.
This study considered only the costs of the injection process. Therefore, further study is suggested to investigate the influence of the proposed system in view of the whole CCS chain, including capture, transport, and storage.

Acknowledgments

This study was a part of the project “Development of Technology for CO2 Marine Geological Storage”, funded by the Ministry of Oceans and Fisheries, Korea.

Nomenclature

CCSCarbon capture and storageLCCLife cycle cost
LNGLiquefied natural gasCAPEXCapital expenditures
OPEXOperational expendituresMDOMarine diesel oil
Power [kW]mMass [ton]
Specific power [kW/ton]Mole flow rate [kgmol/hr]
ΗEfficiency Q ˙ Heat transfer rate [kW]
ĖxExergy [kJ/hr]exSpecific exergy [kJ/kgmol]
hSpecific enthalpy [kJ/kgmol]sSpecific entropy [kJ/kgmol∙K]
TTemperature [K]

Subscripts

lossLossnetNet power consumption
inputInput into a systemoutputOutput from a system
inInletoutOutlet
turbine, ii-th turbinepump_CO2, ii-th pump of CO2
pump_WF, ii-th pump of working fluidpump_SW, ii-th pump of sea water
pPumptTurbine
thThermalexExergy
iInteger number (1, 2, 3, ∙∙∙)jInteger number (1, 2, 3, ∙∙∙)
CO2Carbon dioxide0Ambient condition (1 atm, 298 K)
SWSea water

References

  1. Working Group 3. Greenhouse Gas Emissions Accelerate Despite Reduction Efforts. Available online: http://www.ipcc.ch/pdf/ar5/pr_wg3/20140413_pr_pc_wg3_en.pdf (accessed on 25 September 2014).
  2. Abellera, C.; Short, C. The Costs of CCS and Other Low-carbon Technologies; No 2; Global CCS Institute: Melbourne Australia, 2011; pp. 1–12. [Google Scholar]
  3. Hosa, A.; Esentia, M.; Stewart, J.; Haszeldine, S. Injection of CO2 into saline formations: Benchmarking worldwide projects. Chem. Eng. Res. Des. 2011, 89, 1855–1864. [Google Scholar] [CrossRef]
  4. Michael, K.; Golab, A.; Shulakova, V.; Ennis-King, J.; Allinson, G.; Sharma, S.; Aiken, T. Geological storage of CO2 in saline aquifers—A review of the experience from existing storage operations. Int. J. Greenh. Gas Control 2009, 4, 659–667. [Google Scholar] [CrossRef]
  5. Nimtz, M.; Klatt, M.; Wiese, B.; Kuhn, M.; Krautz, H.J. Modelling of the CO2 process- and transport chain in CCS systems—Examination of transport and storage process. Chem. Erde 2010, 70, 185–192. [Google Scholar] [CrossRef]
  6. Krogh, E.; Nilsen, R.; Henningsen, R. Liquefied CO2 injection modelling. Energy Procedia 2012, 23, 527–555. [Google Scholar] [CrossRef]
  7. De Visser, E.; Hendriks, C.; Barrio, M.; Mølnvik, M.J.; de Koeiger, G.; Liljemark, S.; Le Gallo, Y. Dynamics CO2 quality recommendations. Int. J. Greenh. Gas Control 2008, 2, 478–484. [Google Scholar]
  8. Patel, D.; Mak, J.; Rivera, D.; Angtuaco, J. LNG vaporizer selection based on site ambient conditions. In Proceedings of the LNG 17, Houston, TX, USA, 16–19 April 2013.
  9. Choi, I.H.; Lee, S.I.; Seo, Y.T.; Chang, D.J. Analysis and optimization of cascade Rankine cycle for LNG cold energy recovery. Energy 2013, 61, 179–195. [Google Scholar] [CrossRef]
  10. Shi, X.; Che, D. A combined power cycle utilizing low-temperature waste heat and LNG cold energy. Energy Convers. Manag. 2008, 50, 567–575. [Google Scholar] [CrossRef]
  11. Wang, H.; Shi, X.; Che, D. Thermodynamic optimization of the operating parameters for a combined power cycle utilizing low-temperature waste heat and LNG cold energy. Appl. Therm. Eng. 2013, 59, 490–497. [Google Scholar] [CrossRef]
  12. Vilarrasa, V.; Silva, O.; Carrera, J.; Olivella, S. Liquid CO2 injection for geological storage in deep saline aquifers. Int. J. Greenh. Gas Control 2013, 14, 84–96. [Google Scholar] [CrossRef] [Green Version]
  13. Chiyoda Corp. Preliminary Feasibility Study on CO2 Carrier for Ship-based CCS. Available online: http://www.globalccsinstitute.com/publications/preliminary-feasibility-study-co2-carrier-ship-based-ccs (accessed on 18 July 2013).
  14. Aspelund, A.; Mølnvik, M.J.; de Koeijer, G. Ship transport of CO2 technical solutions and analysis of costs, energy utilization, exergy efficiency and co2 emissions. Chem. Eng. Res. Des. 2006, 84, 847–855. [Google Scholar] [CrossRef]
  15. Zero Emissions Platform (ZEP). The Costs of CO2 Transport. Available online: http://www.zeroemissionsplatform.eu/library/publication/167-zep-cost-report-transport.html (accessed on 18 July 2013).
  16. Liu, H.; You, L. Characteristics and applications of the cold heat exergy of liquefied natural gas. Energy Convers. Manag. 1999, 40, 1515–1525. [Google Scholar] [CrossRef]
  17. Venkatarathnam, G. Fundamental principles and processes. In Cryogenic Mixed Refrigerant Processes; Timmerhaus, K.D., Rizzuto, C., Mendelssohn, K., Eds.; Springer: New York, NY, USA, 2008. [Google Scholar]
  18. Lee, S.I.; Choi, I.H.; Chang, D.J. Multi-objective optimization of VOC recovery and reuse in crude oil loading. Appl. Energy 2013, 108, 439–447. [Google Scholar] [CrossRef]

