Exergy Destruction in Pipeline Flow of Surfactant-Stabilized Oil-in-Water Emulsions

Department of Chemical Engineering, University of Waterloo, Waterloo, ON N2L 3G1, Canada
Energies 2014, 7(11), 7602-7619; https://doi.org/10.3390/en7117602
Submission received: 8 August 2014
/
Revised: 24 October 2014
/
Accepted: 13 November 2014
/
Published: 18 November 2014
Abstract
:Exergy destruction in adiabatic pipeline flow of surfactant-stabilized oil-in-water emulsions is investigated in five different diameter pipes. The dispersed-phase (oil droplets) concentration of the emulsions is varied from 0% to 55.14% vol. The emulsions are Newtonian in that the viscosity is independent of the shear rate. For a given emulsion and pipe diameter, the exergy destruction rate per unit pipe length increases linearly with the increase in the Reynolds number on a log-log scale in both laminar and turbulent regimes. However the slope in the turbulent regime is higher. The exergy destruction rate increases with the increase in the dispersed-phase concentration of emulsion and decreases with the increase in the pipe diameter. New models are developed for the prediction of exergy destruction rate in pipeline flow of surfactant-stabilized oil-in-water emulsions. The models are based on the single-phase flow equations. The experimental data on exergy destruction in pipeline flow of emulsions shows excellent agreement with the predictions of the proposed models.
1. Introduction
According to some estimates, pumping systems alone account for nearly 20% of the world’s electrical energy demand [1]. In a number of industrial applications, pumping systems account for 25%–50% of the total electrical energy used in the process. Therefore, it is important to carry out the second law analysis of a pipeline transportation system to determine the extent to which exergy is destroyed due to irreversibilities in the pumping process. In long distance pipeline transportation of fluids, the consequences of high rate of exergy destruction are: (a) an increase in capital cost to establish more pumping stations and (b) an increase in operating cost due to high consumption of electricity.
The amount of exergy destroyed or work lost as a result of irreversibilities is directly related to entropy production in the process. It can be readily shown that [2,3,4,5]:
where is the total rate of exergy destruction; is the rate of lost work; is the surroundings temperature; and is the total rate of entropy generation due to internal (within control volume) and external (outside the control volume) irreversibilities. Note that the thermo-mechanical exergy associated with a fluid stream per unit mass is given as follows:
where h and s are specific enthalpy and specific entropy of fluid, respectively; ho and so are specific enthalpy and specific entropy of fluid in the dead state, respectively; V is fluid velocity, g is acceleration due to gravity; and z is elevation of the fluid stream with respect to the dead state.
According to the second law of thermodynamics,
for any irreversible process. Thus irreversibilities in a process cause destruction of exergy. only when the process is completely reversible (no internal and external irreversibilities). The greater the irreversibility of a process, the greater the rate of exergy destruction and the greater the amount of energy that becomes unavailable for work.
This article is related to exergy destruction in pipeline flow of surfactant-stabilized oil-in-water emulsions. Emulsions are encountered in a variety of engineering applications and systems [6,7,8,9,10,11]. Emulsions can be classified into two broad groups: (a) oil-in-water (designated as O/W) emulsions where oil droplets are dispersed in a continuum of water phase; and (b) water-in-oil (designated as W/O) emulsions where water droplets are dispersed in a continuum of oil phase.
Both types of emulsions are important industrially. For example, a significant portion of the world crude oil is produced in the form of O/W and W/O emulsions [11]. In primary oil production where the reservoir’s natural energy (pressure) is used to produce the oil, the source of water is the connate water [12,13] which is naturally present along with the oil in the formation. It is believed that the emulsification of oil and water occurs in the formation near the well bore where the velocity gradients are very high. The high shear in the production facilities such as pumps, valves, chokes, and turns, also favors the formation of the emulsions [13,14]. The source of emulsifying agents in these emulsions is the crude oil itself which may contain a variety of surface-active chemicals such as long chain fatty acids and polycyclics [12,13]. When the reservoir’s natural energy is no longer capable of pushing the oil from the formation into the oil well, a fluid is often injected into the formation through injection wells. A variety of fluids are used for this purpose, such as water, aqueous polymer solution, caustic solutions, aqueous surfactant solutions, microemulsion, and steam. Most of these fluids not only push the oil from the formation into the producing well but they also help recover the oil adhered to the walls of the pores (due to strong capillary forces). Very often, however, channeling and breakthrough of fluid into the producing well occurs, and as a result, emulsions are formed [13].
Oil-in-water (O/W) emulsions are also being considered as vehicles to transport highly viscous heavy crude oils and bitumen via pipelines [6,15]. To transport the highly viscous crude oils via pipelines, it is necessary to either heat the oil to reduce its viscosity or dilute the oil with a low viscosity hydrocarbon diluent. In the former case, heating cost and pipeline insulation costs are usually very high. In the latter case, the cost of diluent and its availability pose difficult problems. These problems, however, can be avoided if the crude oil is transported in the form of an O/W emulsion. The viscosity of O/W emulsions is in general very low compared with the crude oil.
The applications of emulsions in industries other than petroleum are numerous. The nonpetroleum industries where emulsions are of considerable importance include food, medical and pharmaceutical, cosmetics, agriculture, explosives, polishes, leather, textile, bitumen, paints, lubricants, polymer, and transport [6].
In a majority of the applications involving emulsions, flow of emulsions in pipelines and other process equipment is a common occurrence. Thus it is of practical significance to carry out exergy destruction analysis of emulsion flow in pipelines. In this article, exergy destruction in adiabatic pipeline flow of surfactant-stabilized O/W emulsions is investigated experimentally using five different diameter pipes and new predictive models are developed for the prediction of exergy destruction rates in O/W emulsion flows.
2. Theoretical Background
There are two approaches for analyzing exergy destruction in flows. In the differential approach, the local exergy destruction rate per unit volume of the fluid is determined at every point of the flow field. The total exergy destruction rate is then determined by integrating the local exergy destruction rate over the given volume [16,17]. In the control volume approach, the exergy balance is carried out over a finite control volume and the exergy destruction rate is determined for the whole control volume. In this article, the control volume approach is used.
Consider a control volume with one inlet and one outlet. Let the rate of heat transfer from heat reservoir at to the control volume be and the rate of shaft work produced from the control volume be . Let ψ be exergy of fluid per unit mass and Ψ be the total exergy. Let temperature of the control volume boundary be uniform at . Exergy balance on the control volume gives:
where is mass flow rate, subscript “1” refers to inlet, subscript “2” refers to outlet, subscript “CV” refers to control volume, and is the rate of exergy destruction in the control volume. Doing exergy balance on the surroundings, one can write:
where is the rate of exergy destruction in the surroundings. This equation could be re-cast as:
Adding the exergy balances for CV and surroundings, the following result is obtained:
From the second law:
The process must be completely reversible (no internal and external irreversibilities) in the limiting case where .
Consider now the steady and adiabatic flow of fluid in a pipe without any shaft work. According to Equation (3):
From Equation (8), it follows that:
Neglecting kinetic and potential energy changes, Equation (2) gives:
Thus, one can express the exergy destruction rate per unit pipe length
as follows:
The first law for open systems, under steady state condition, gives:
where h is specific enthalpy; V is fluid velocity; and
is the rate of shaft work. For adiabatic incompressible flow in a horizontal pipe in the absence of any shaft work, Equation (12) simplifies to:
For fluids of constant composition, the differential change in enthalpy is given by one of the fundamental thermodynamic relations as:
where T is temperature; P is pressure; and ρ is density. Taking dh = 0 in Equation (14) and combining Equations (11) and (14) gives the following result:
The Fanning friction factor f in pipe flow is defined as:
where D is the pipe diameter; and
is the average fluid velocity in the pipe. From Equations (15) and (16), it follows that:
where μ is the fluid viscosity and Re is the pipe Reynolds number defined as .
For laminar flow of Newtonian fluids in pipes, the Fanning friction factor is given as:
For turbulent flow of Newtonian fluids in hydraulically smooth pipes, the Fanning friction factor is given by the following Blasius equation:
The Blasius equation gives good predictions of friction factor in the Re range of 3000 to 100,000. Substitution of the friction factor expressions from Equations (18) and (19) into Equation (17) leads to the following relations for exergy destruction in pipe flows:
Equations (20) and (21) are predictive models for exergy destruction per unit length in pipeline flow of Newtonian fluids. These models could be applied to pseudo-homogeneous mixtures of two phases such as emulsions of oil and water.
3. Experimental Work
The exergy destruction rates in pipeline flow of surfactant-stabilized O/W emulsions were investigated experimentally in a flow rig consisting of five different diameter pipeline test sections (stainless steel, seamless) installed horizontally. The various dimensions of the test sections are summarized in Table 1. The pipelines were hydraulically smooth. The hydraulic smoothness of the pipeline test sections was verified by comparing the experimental friction factor versus Reynolds number data for turbulent flow of single-phase Newtonian fluids (oil and water) with the Blasius equation (Equation (19)). The agreement between the experimental data and the Blasius equation was excellent. The friction factor in turbulent flow of Newtonian fluids is expected to be significantly higher than the prediction of the Blasius equation if the pipe is rough.

| Pipe inside diameter (mm) | Entrance length (m) | Length of test section (m) | Exit length (m) |
|---|---|---|---|
| 7.15 | 1.07 | 3.05 | 0.46 |
| 8.89 | 0.89 | 3.35 | 0.48 |
| 12.60 | 1.19 | 2.74 | 0.53 |
| 15.8 | 1.65 | 2.59 | 0.56 |
| 26.54 | 3.05 | 1.22 | 0.67 |
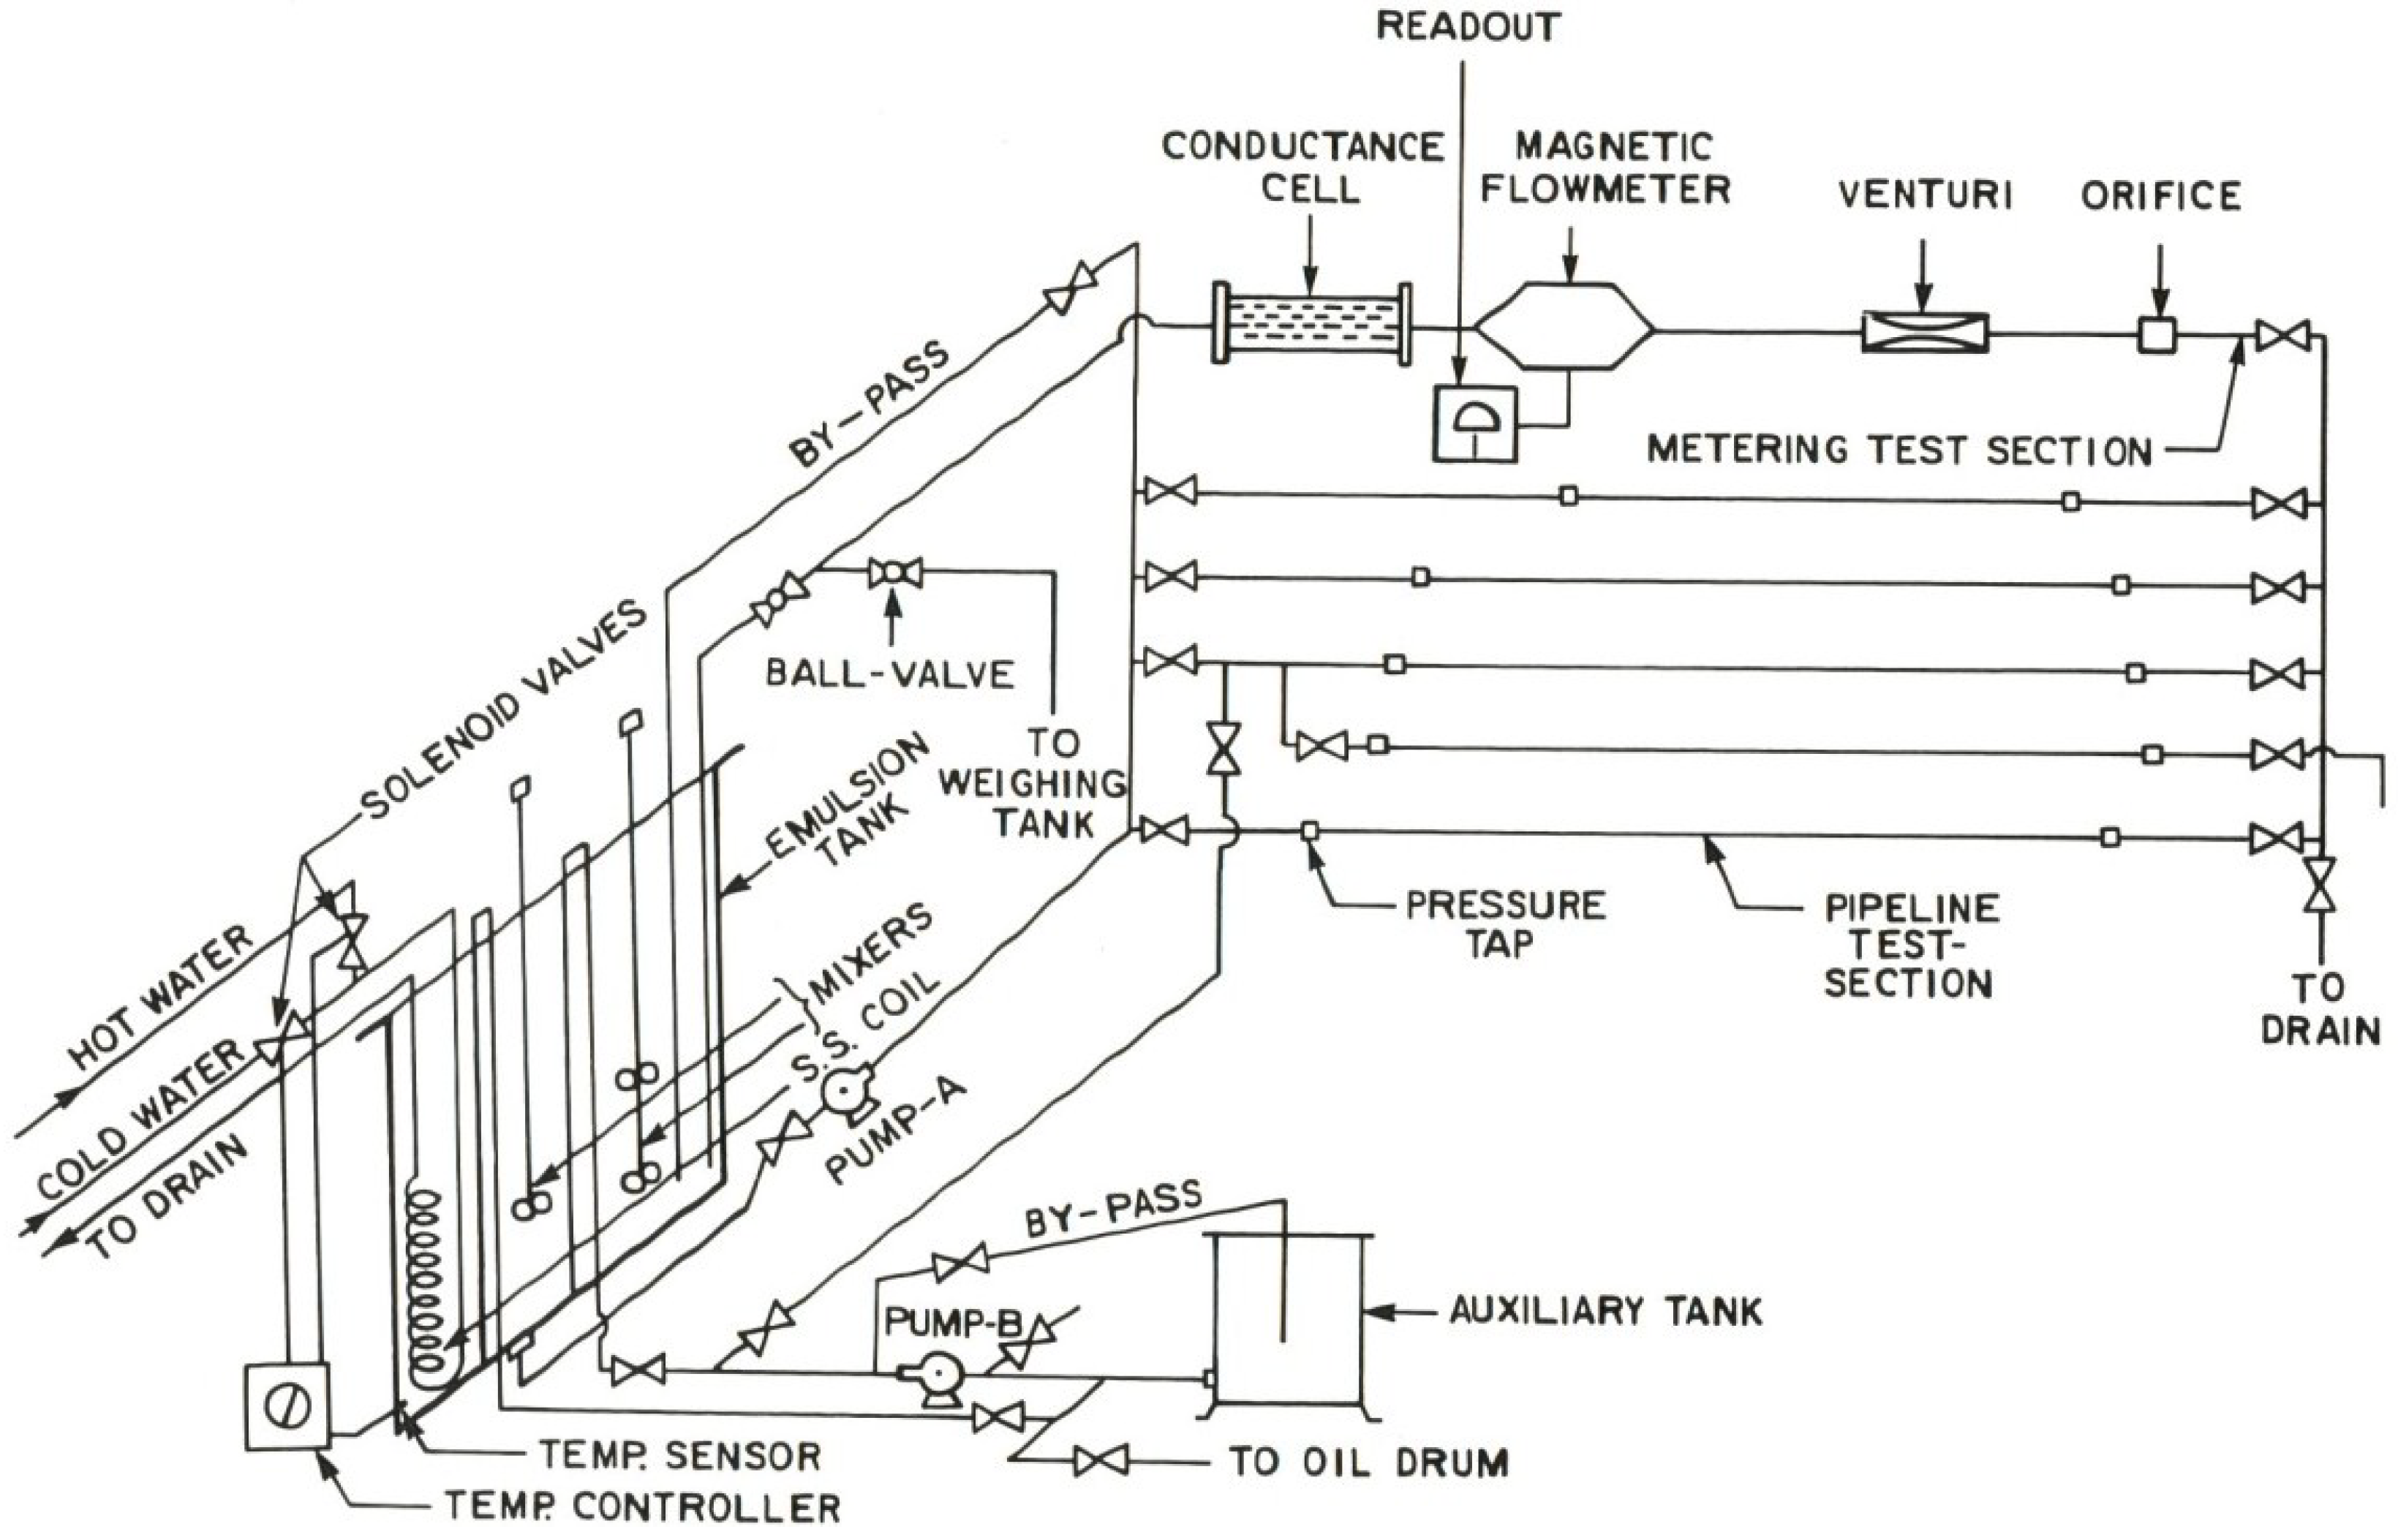
Figure 1 shows a schematic diagram of the flow rig. The emulsions were prepared in a large mixing tank (capacity about 1 m3) equipped with baffles, two high shear mixers, heating/cooling coil, and a temperature controller. From this tank, the emulsion was circulated to the pipeline test sections, one at a time, by either of the two installed centrifugal pumps.
Figure 1.
Schematic diagram of the flow rig.

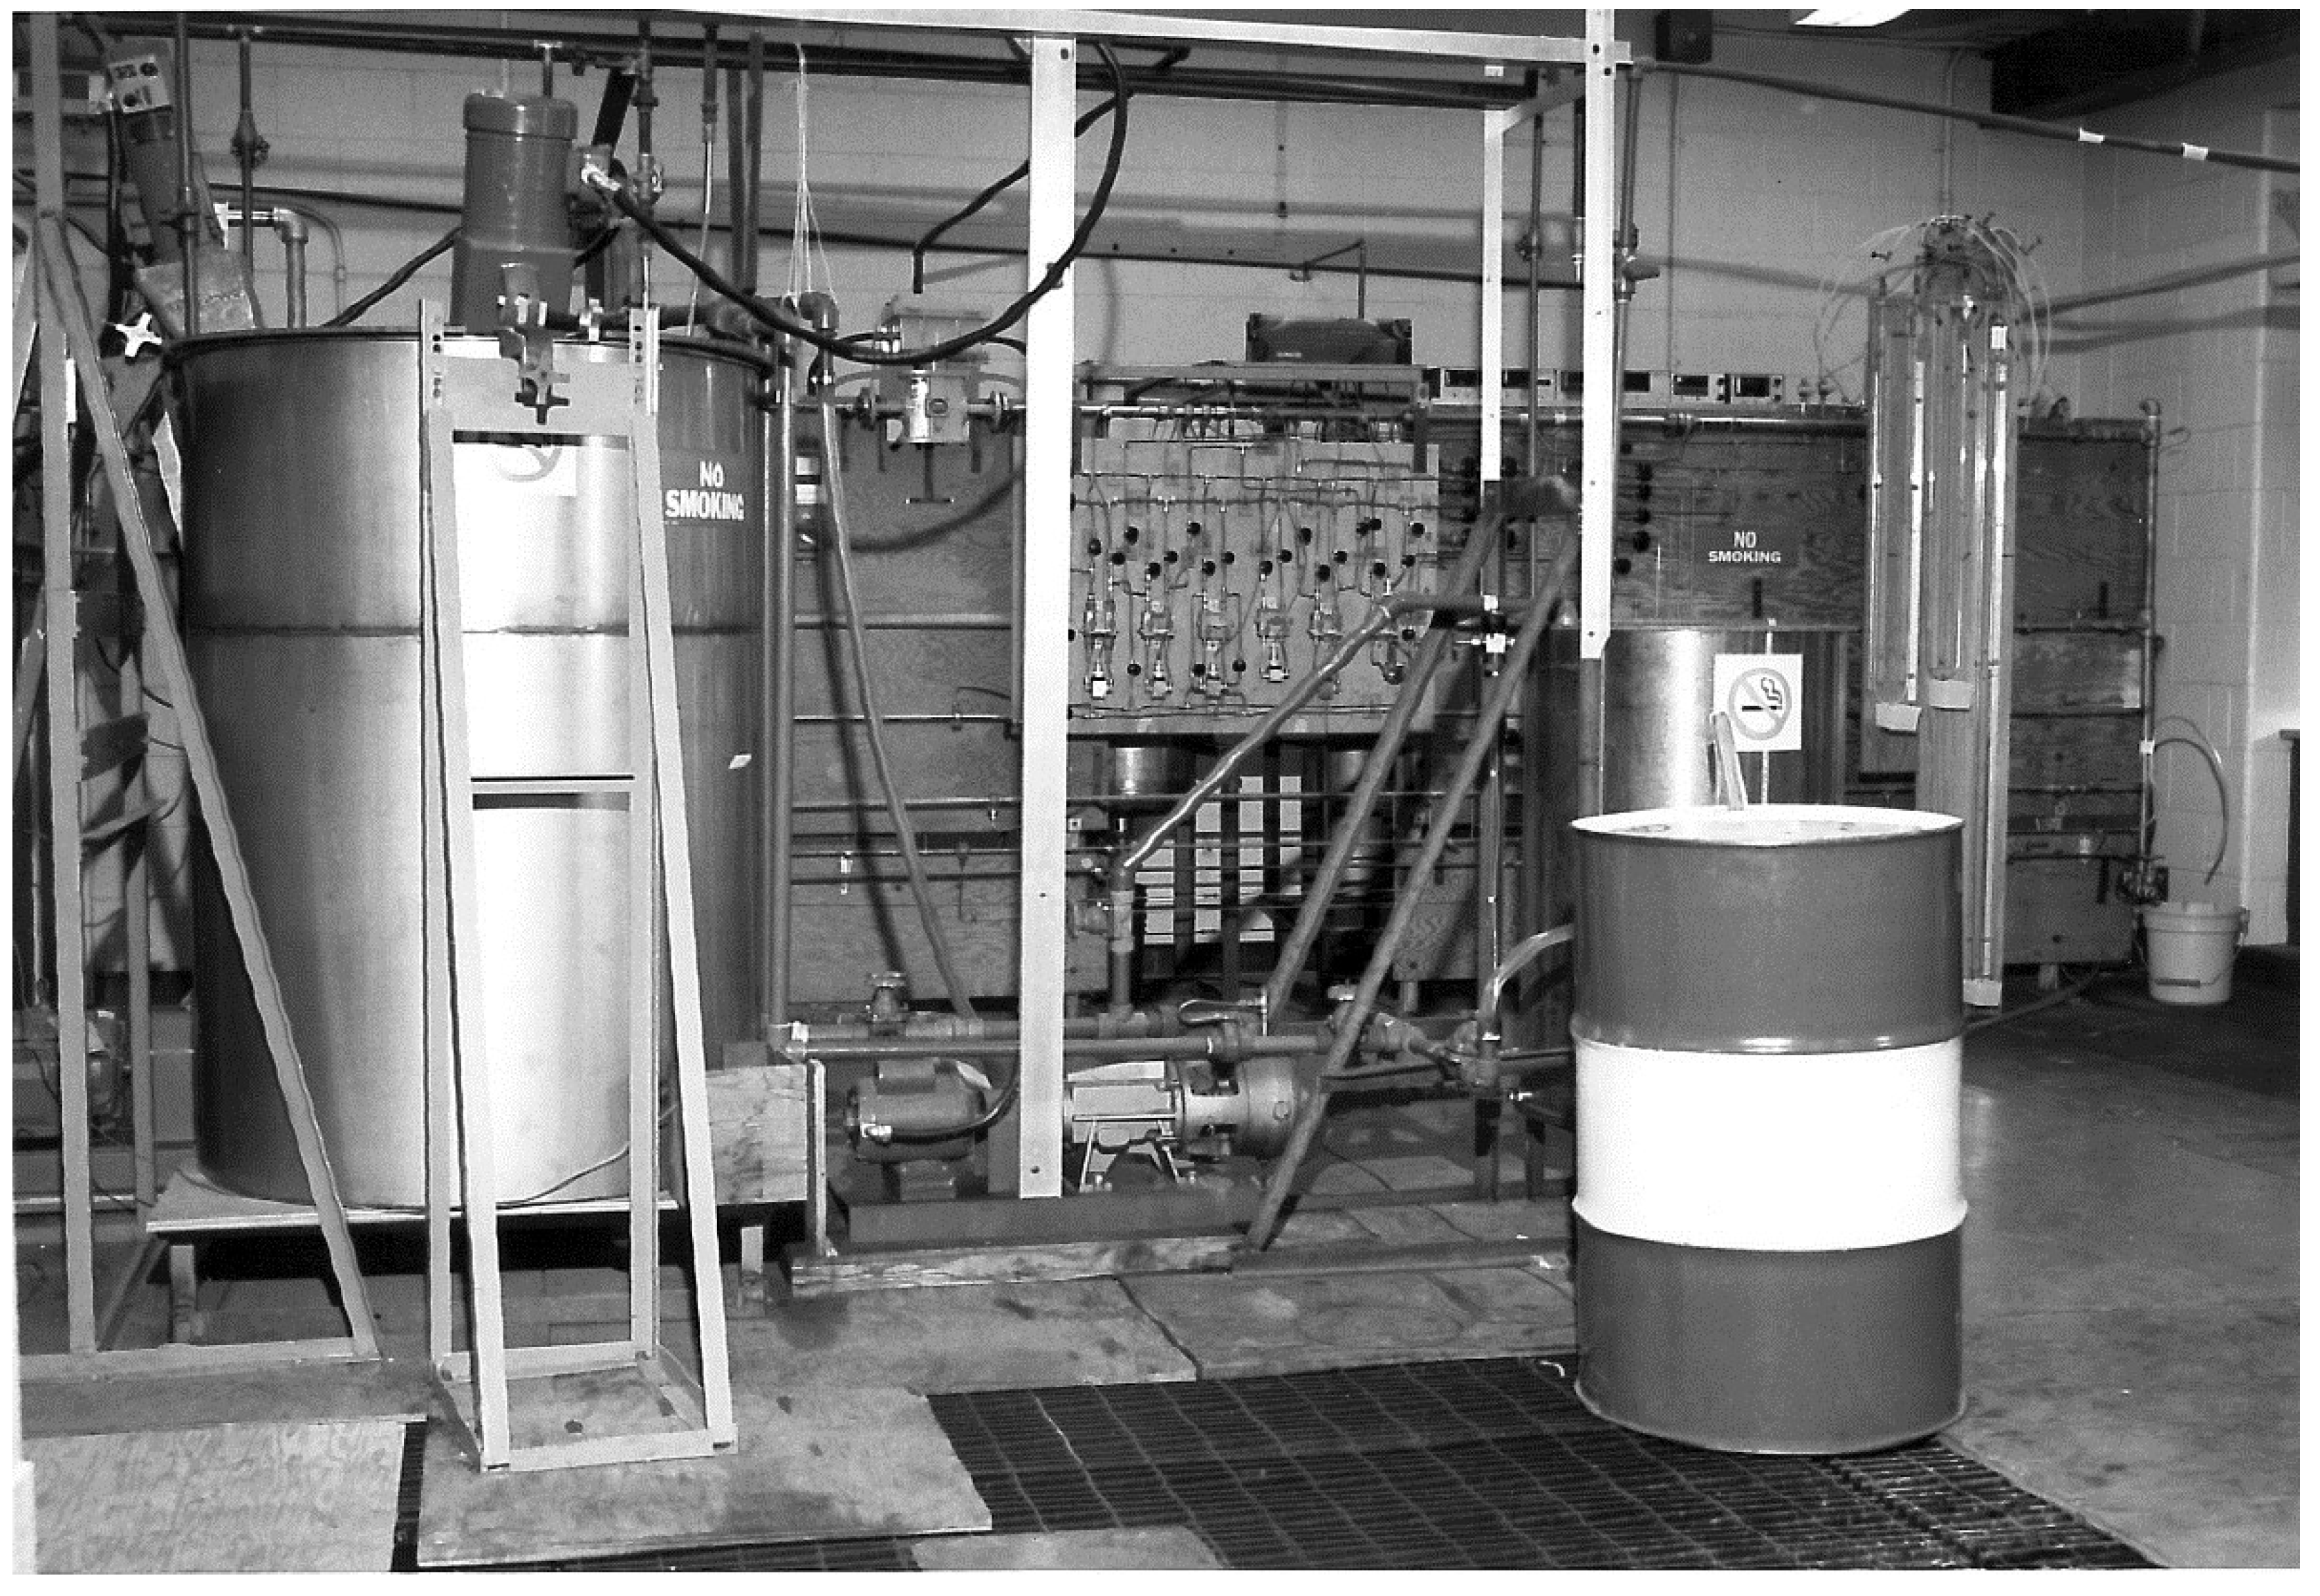
The pump-A (main pump) was used for high flow rates and the pump-B (small pump) was used for low flow rates. Both the pumps had appropriate by-pass arrangements to enable easy regulation of flow rates into the test-section. From the pipeline test section, the emulsion was allowed to return to the mixing tank via the metering section where its flow rate was measured. The metering section included a magnetic flow meter and other devices not used in the present study (orificemeter, venturimeter, and an in-line conductance cell). The magnetic flowmeter was used for the determination of flow rate in the test section at high flow rates; low flow rates were measured directly by diverting the flow outside the flow loop into a weighing tank. The pressure drops in the various pipeline test sections were measured by means of six variable magnetic-reluctance type pressure transducers (Validyne transducers, Validyne Engineering Corp, Northridge, CA, USA) covering a broad range of pressure drop. The output signals from the pressure transducers and magnetic flowmeter were recorded by a microcomputer data-acquisition system. Figure 2 shows the front view of the flow rig.
Figure 2.
Front view of the flow rig.

The rheological properties of emulsions were measured in a Fann co-axial cylinder viscometer (Fann Instrument Company, Houston, TX, USA). The emulsion samples were observed under a Zeiss optical microscope (Carl Zeiss Canada Ltd., Toronto, ON, Canada) to obtain information about the droplet sizes. The emulsions were prepared using 1% by wt. surfactant solution in tap water and mineral oil (Bayol-35). The surfactant used was Triton X-100 (isooctylphenoxypolyethoxy ethanol); this is a non-ionic water soluble surfactant. The oil had a density of 780 kg/m3 and a viscosity of 2.41 mPa.s at 25 °C. The experiments were started with aqueous surfactant solution (1% by wt. surfactant) into which a required amount of oil was added to prepare an O/W emulsion. The mixture was sheared in the flow loop for a fixed period of time. To prepare a higher concentration O/W emulsion, more oil was added to an existing emulsion. The experimental work was conducted at a constant temperature of 25 °C. The temperature was maintained constant in the flow loop with the help of a temperature controller installed in the mixing tank.
4. Results and Discussion
4.1. Droplet Size of Emulsions
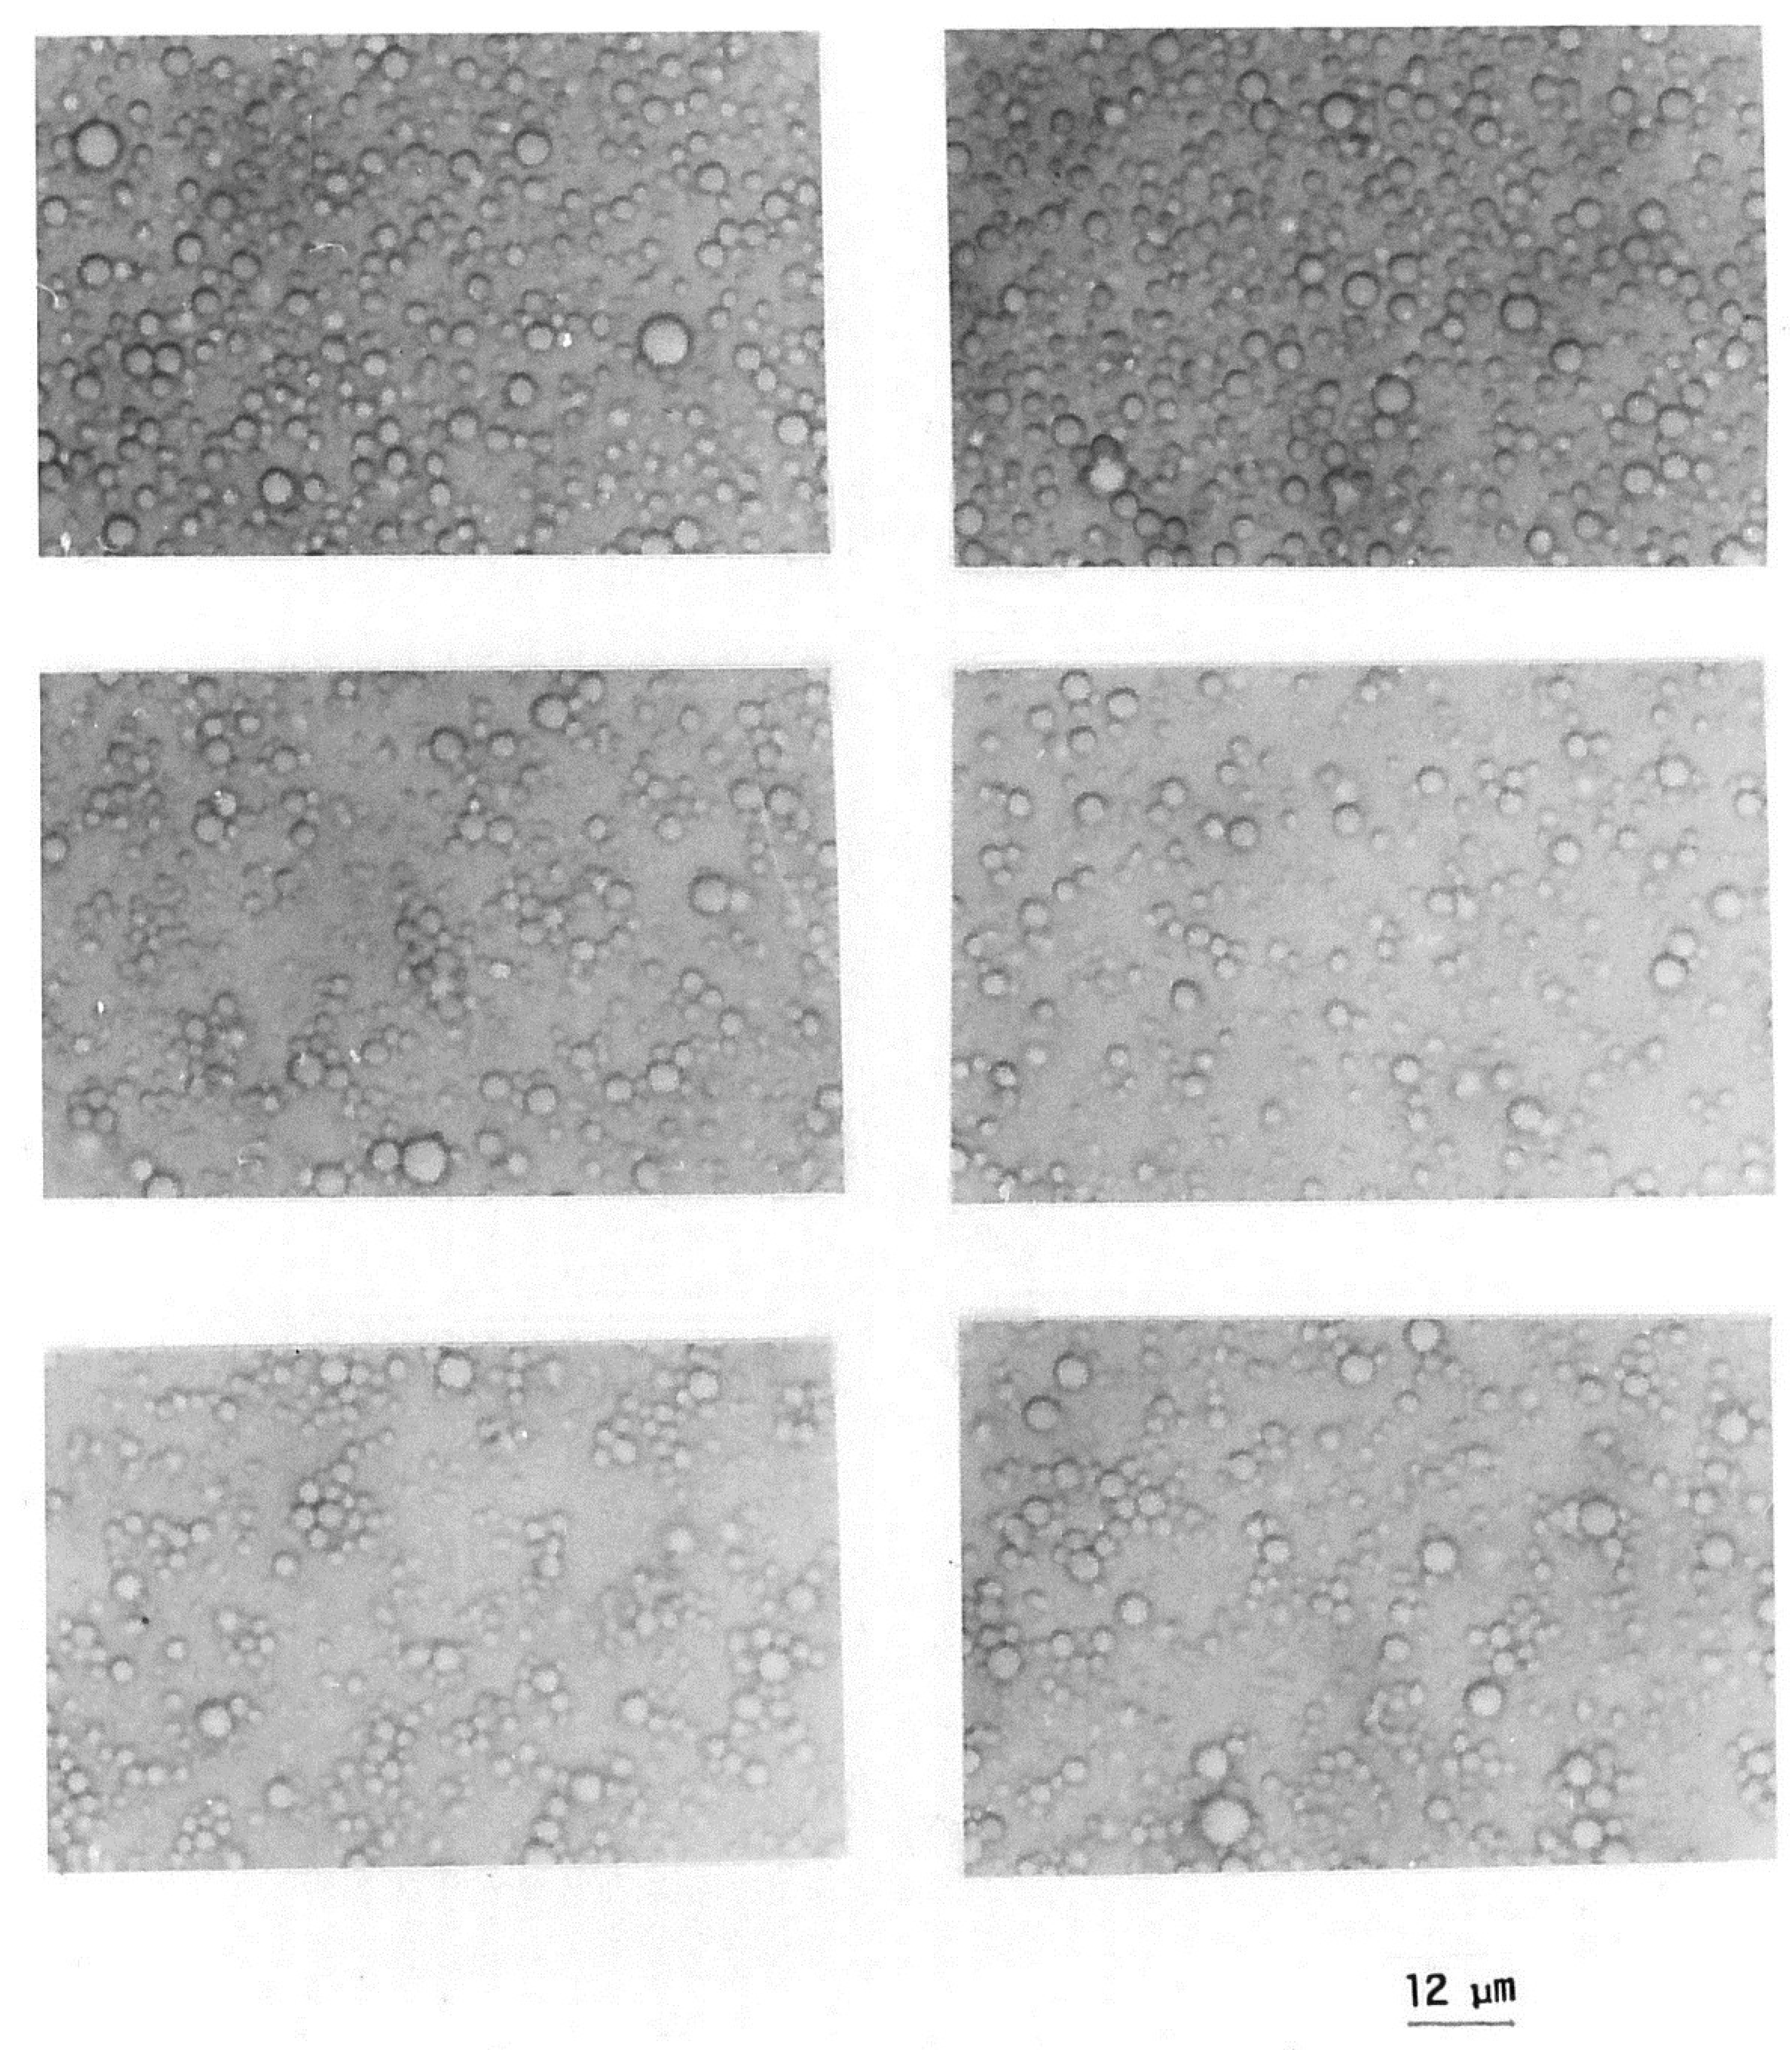
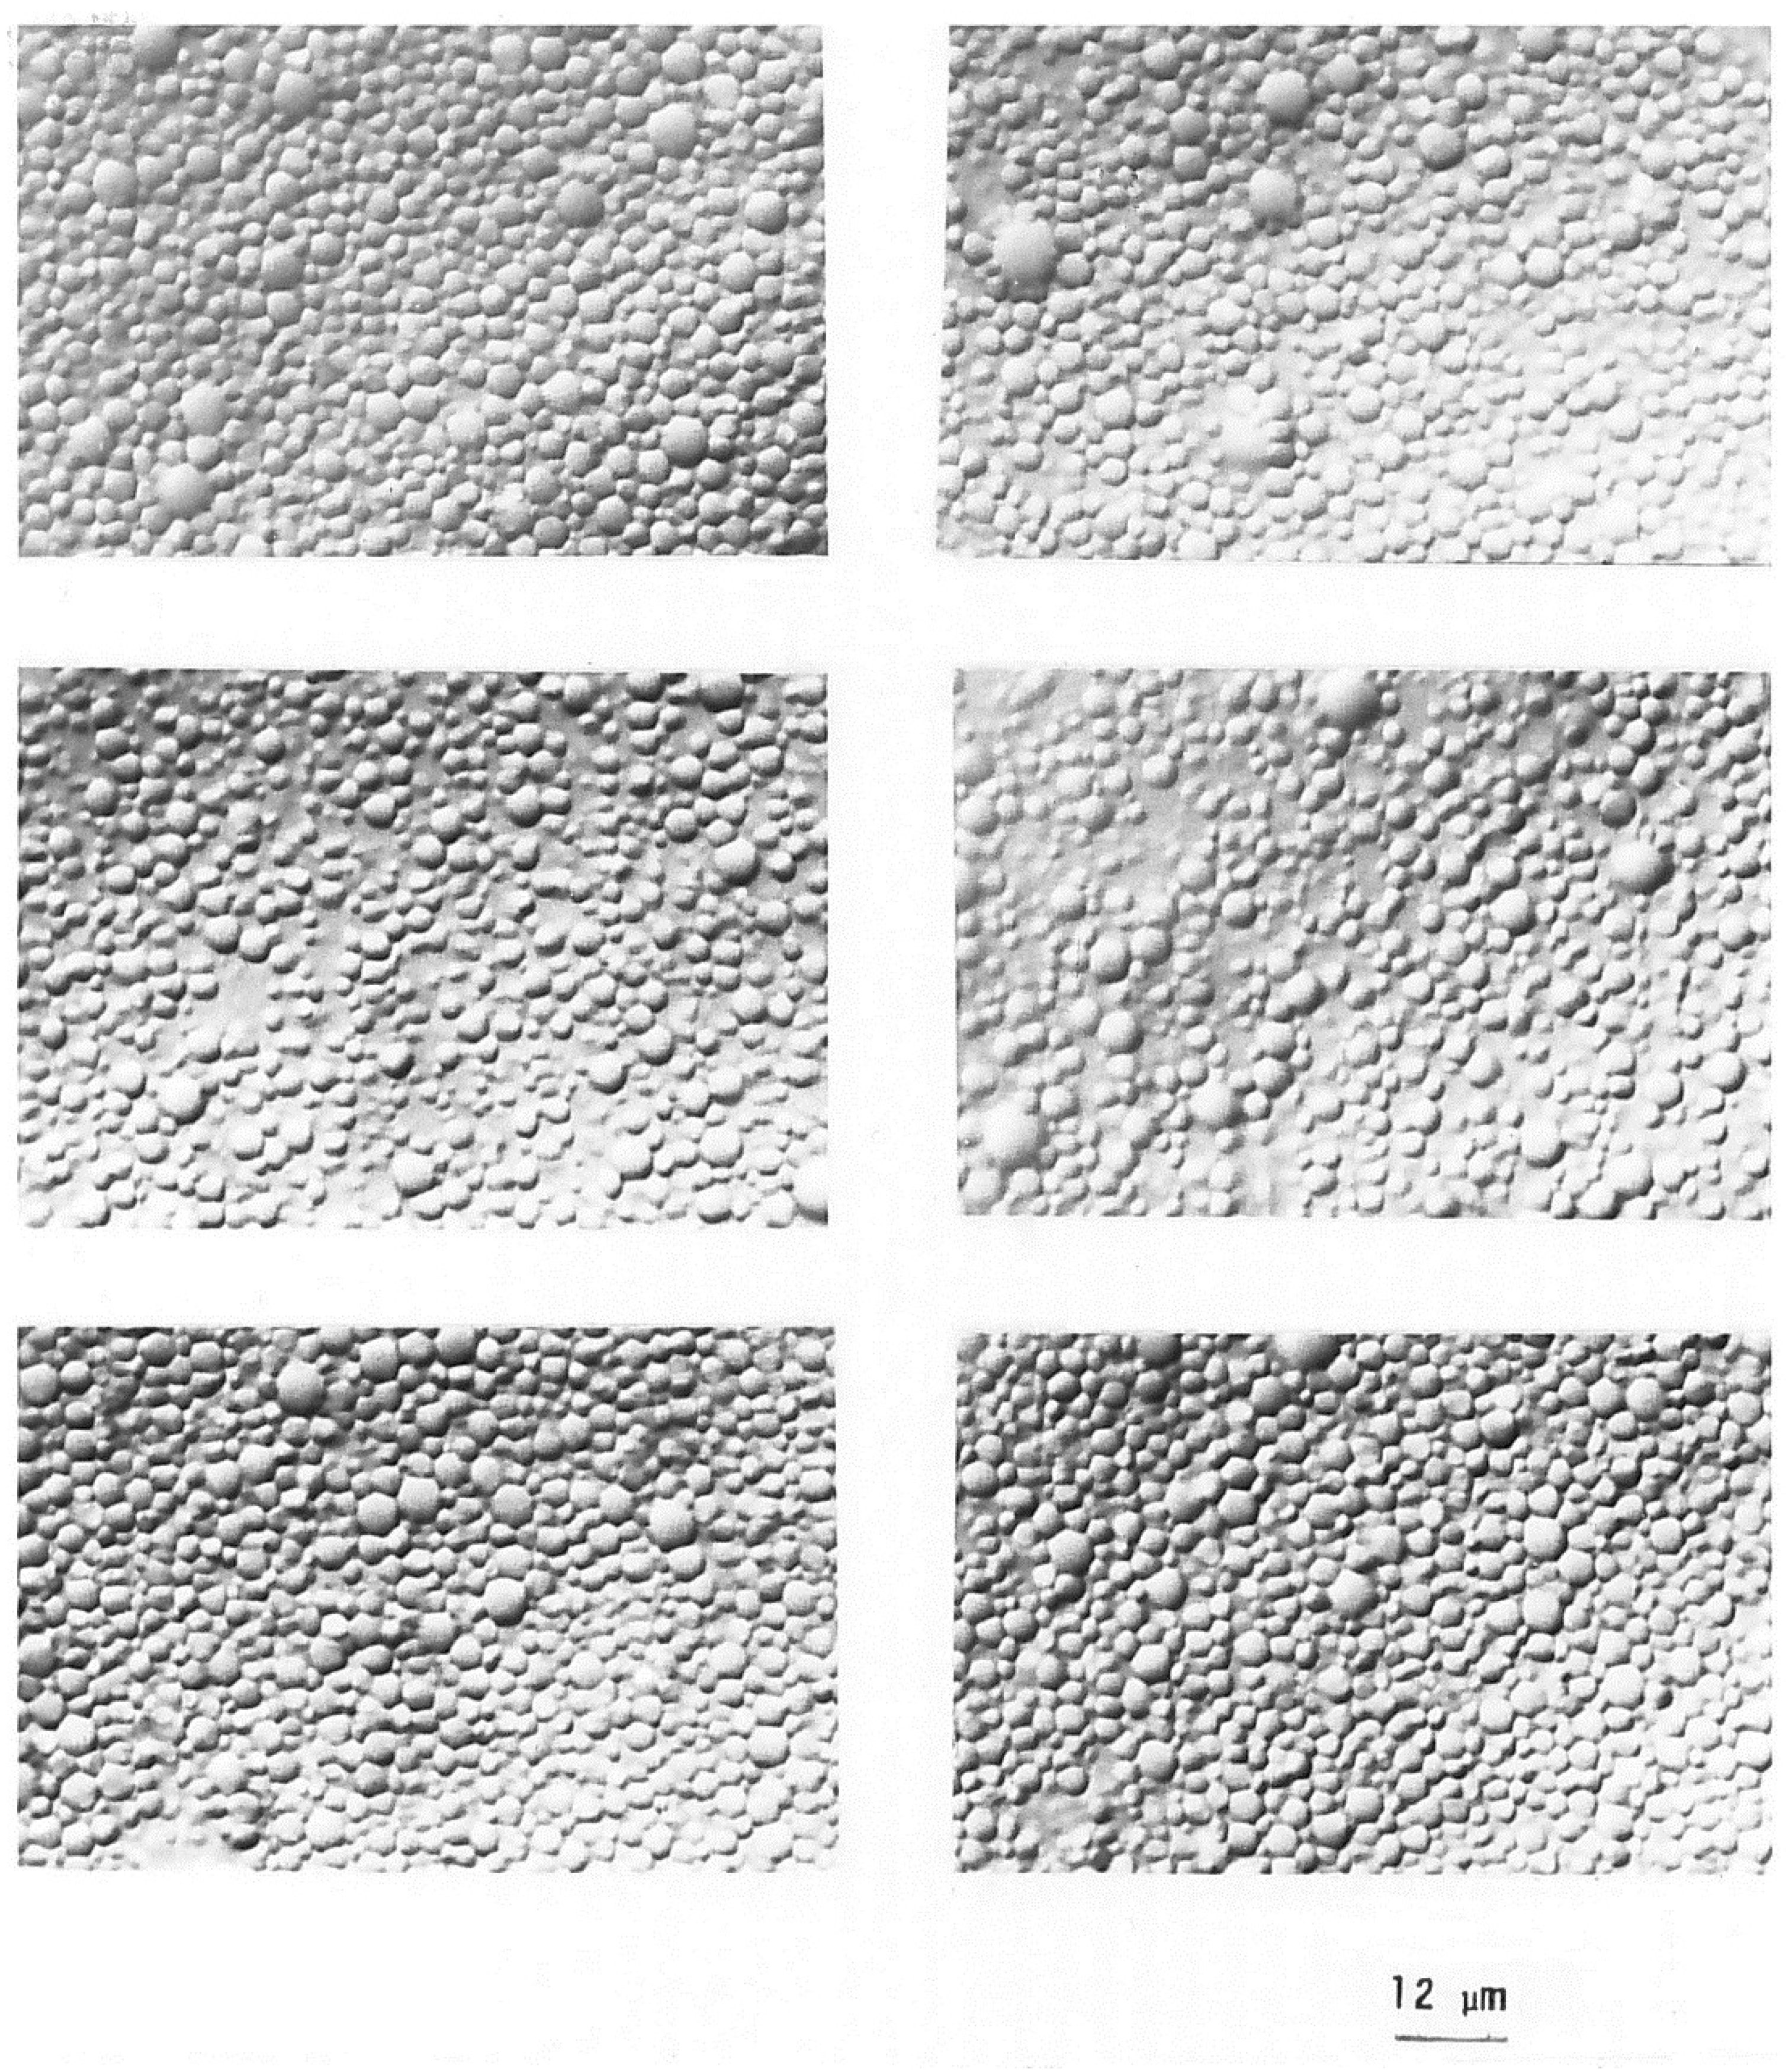
Figure 3 and Figure 4 show the typical photomicrographs of emulsion droplets (oil droplets) at low and high concentrations of dispersed-phase (oil), respectively. The droplet size ranges from approximately 1 to 10 µm. With the increase in the dispersed-phase concentration, the average droplet size increases.
Figure 3.
Typical photomicrographs of a 30.4% by volume O/W emulsion.

4.2. Viscosity of Emulsions
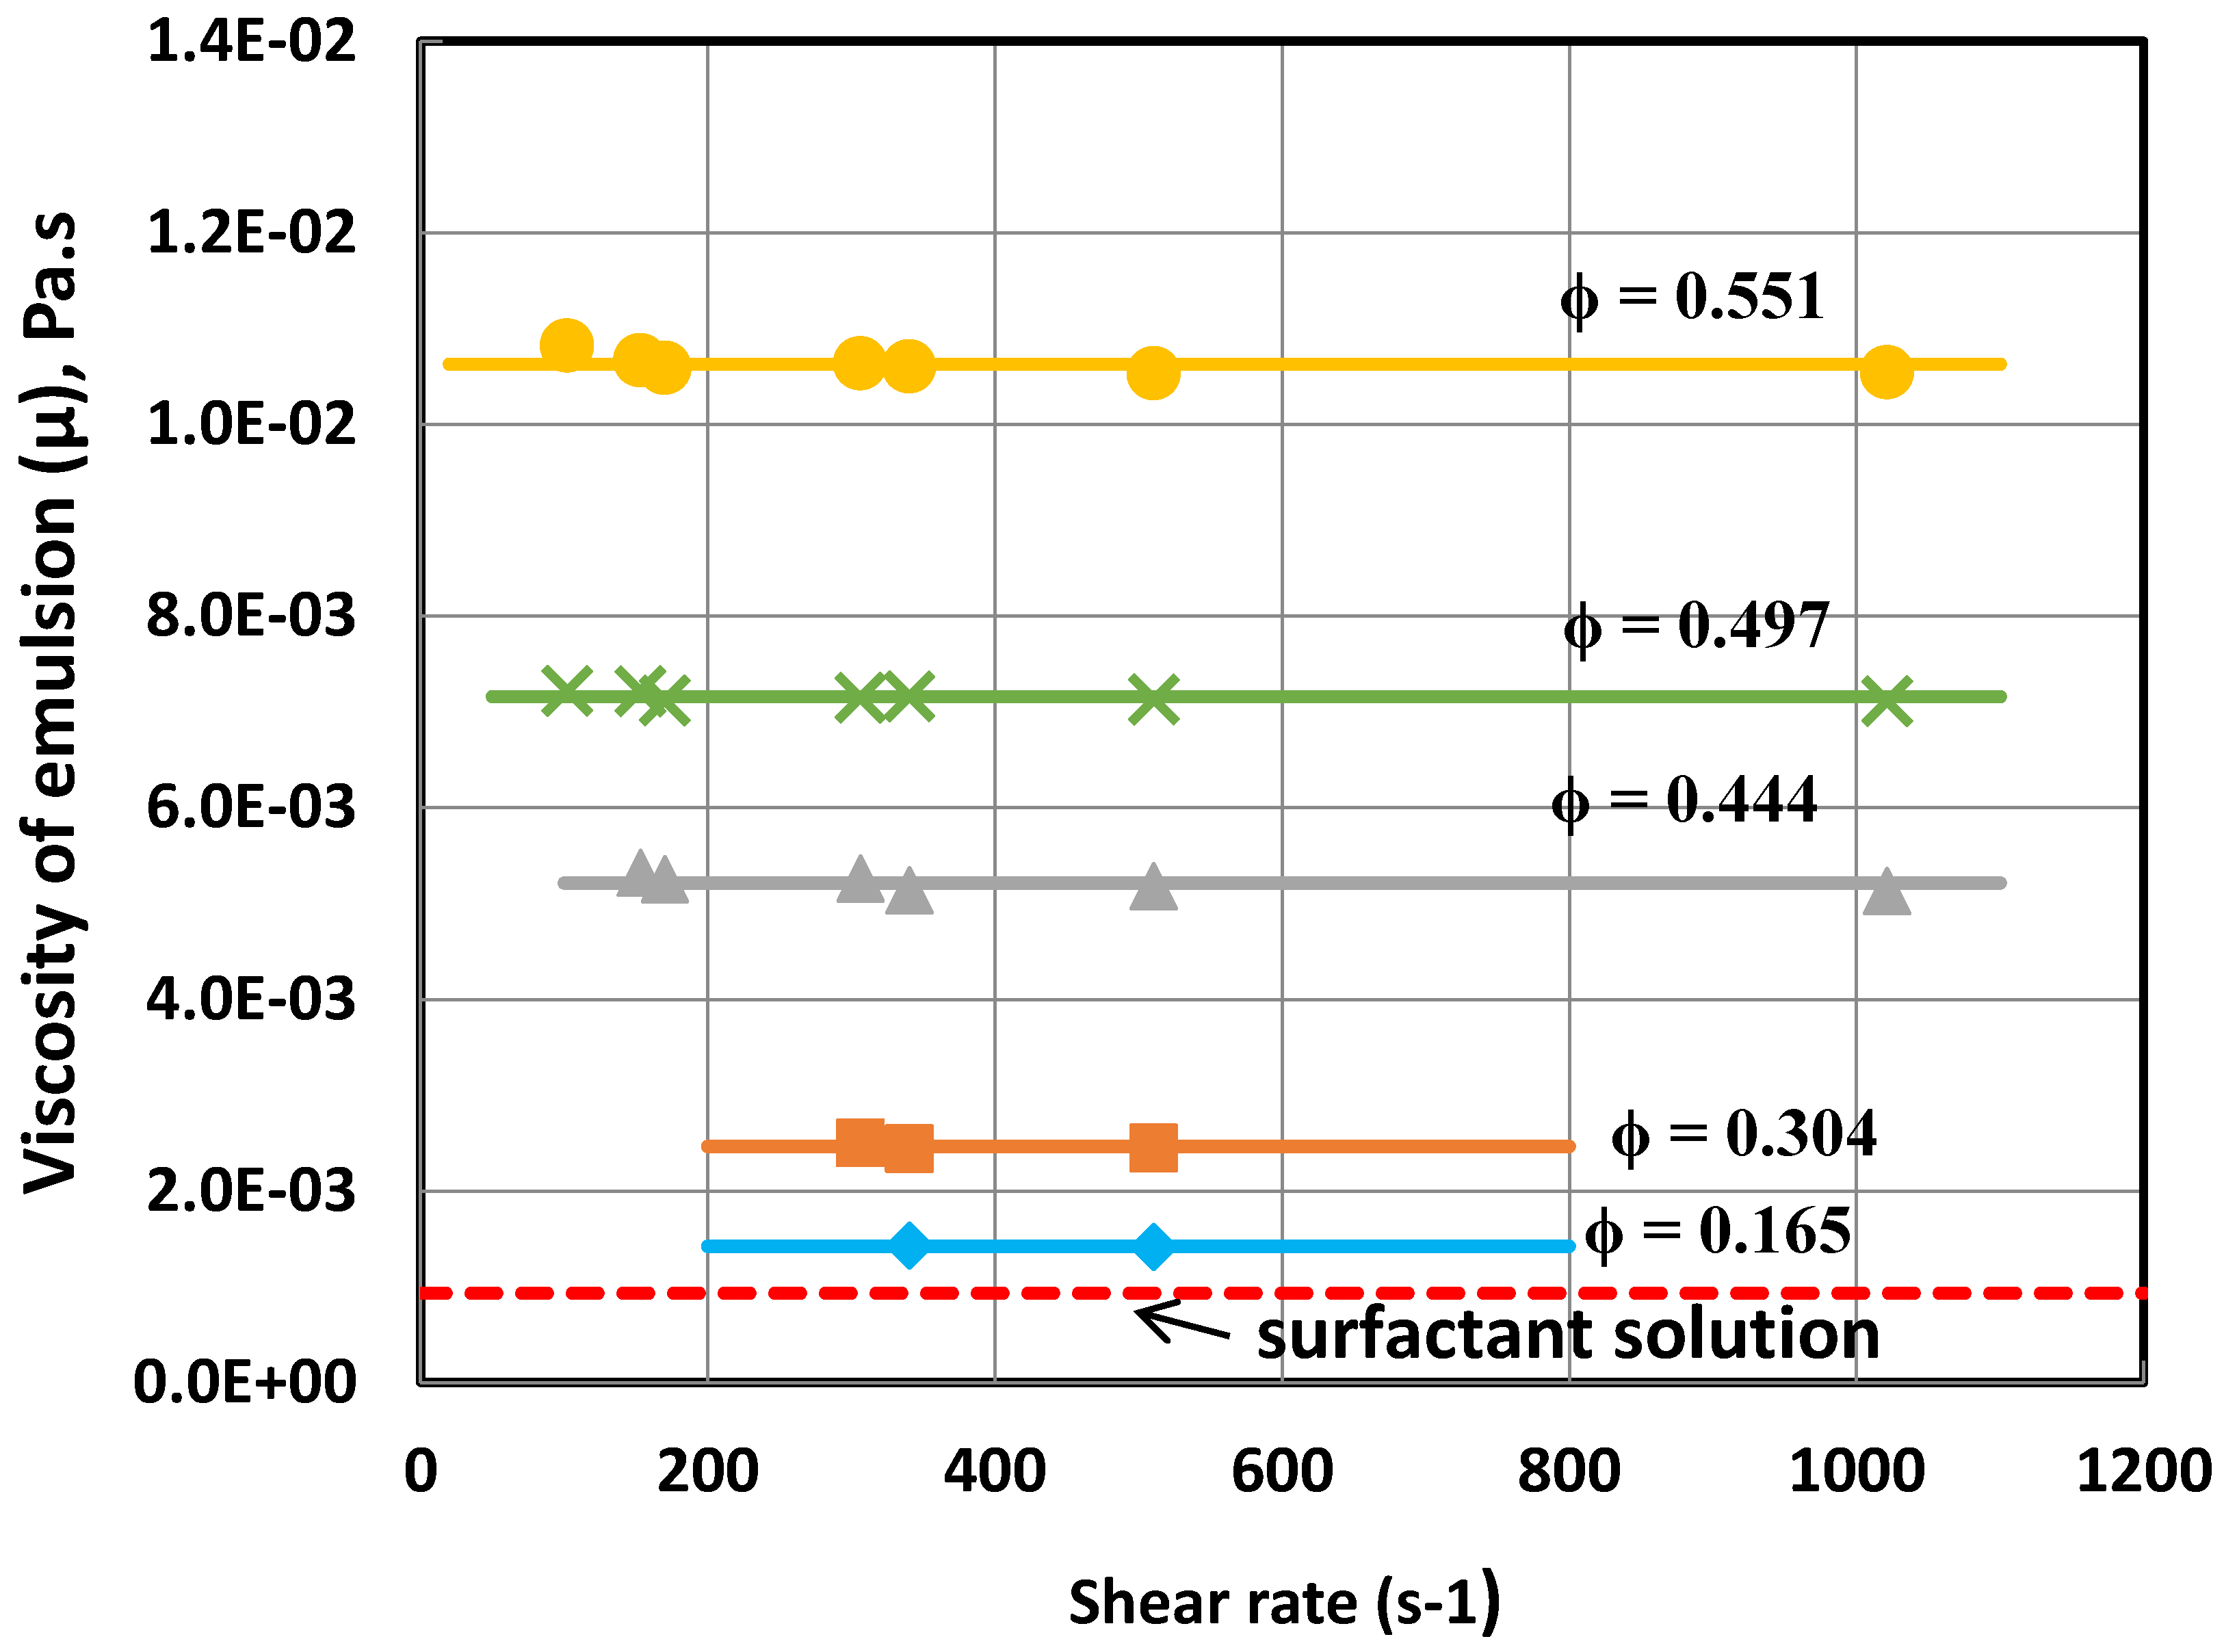
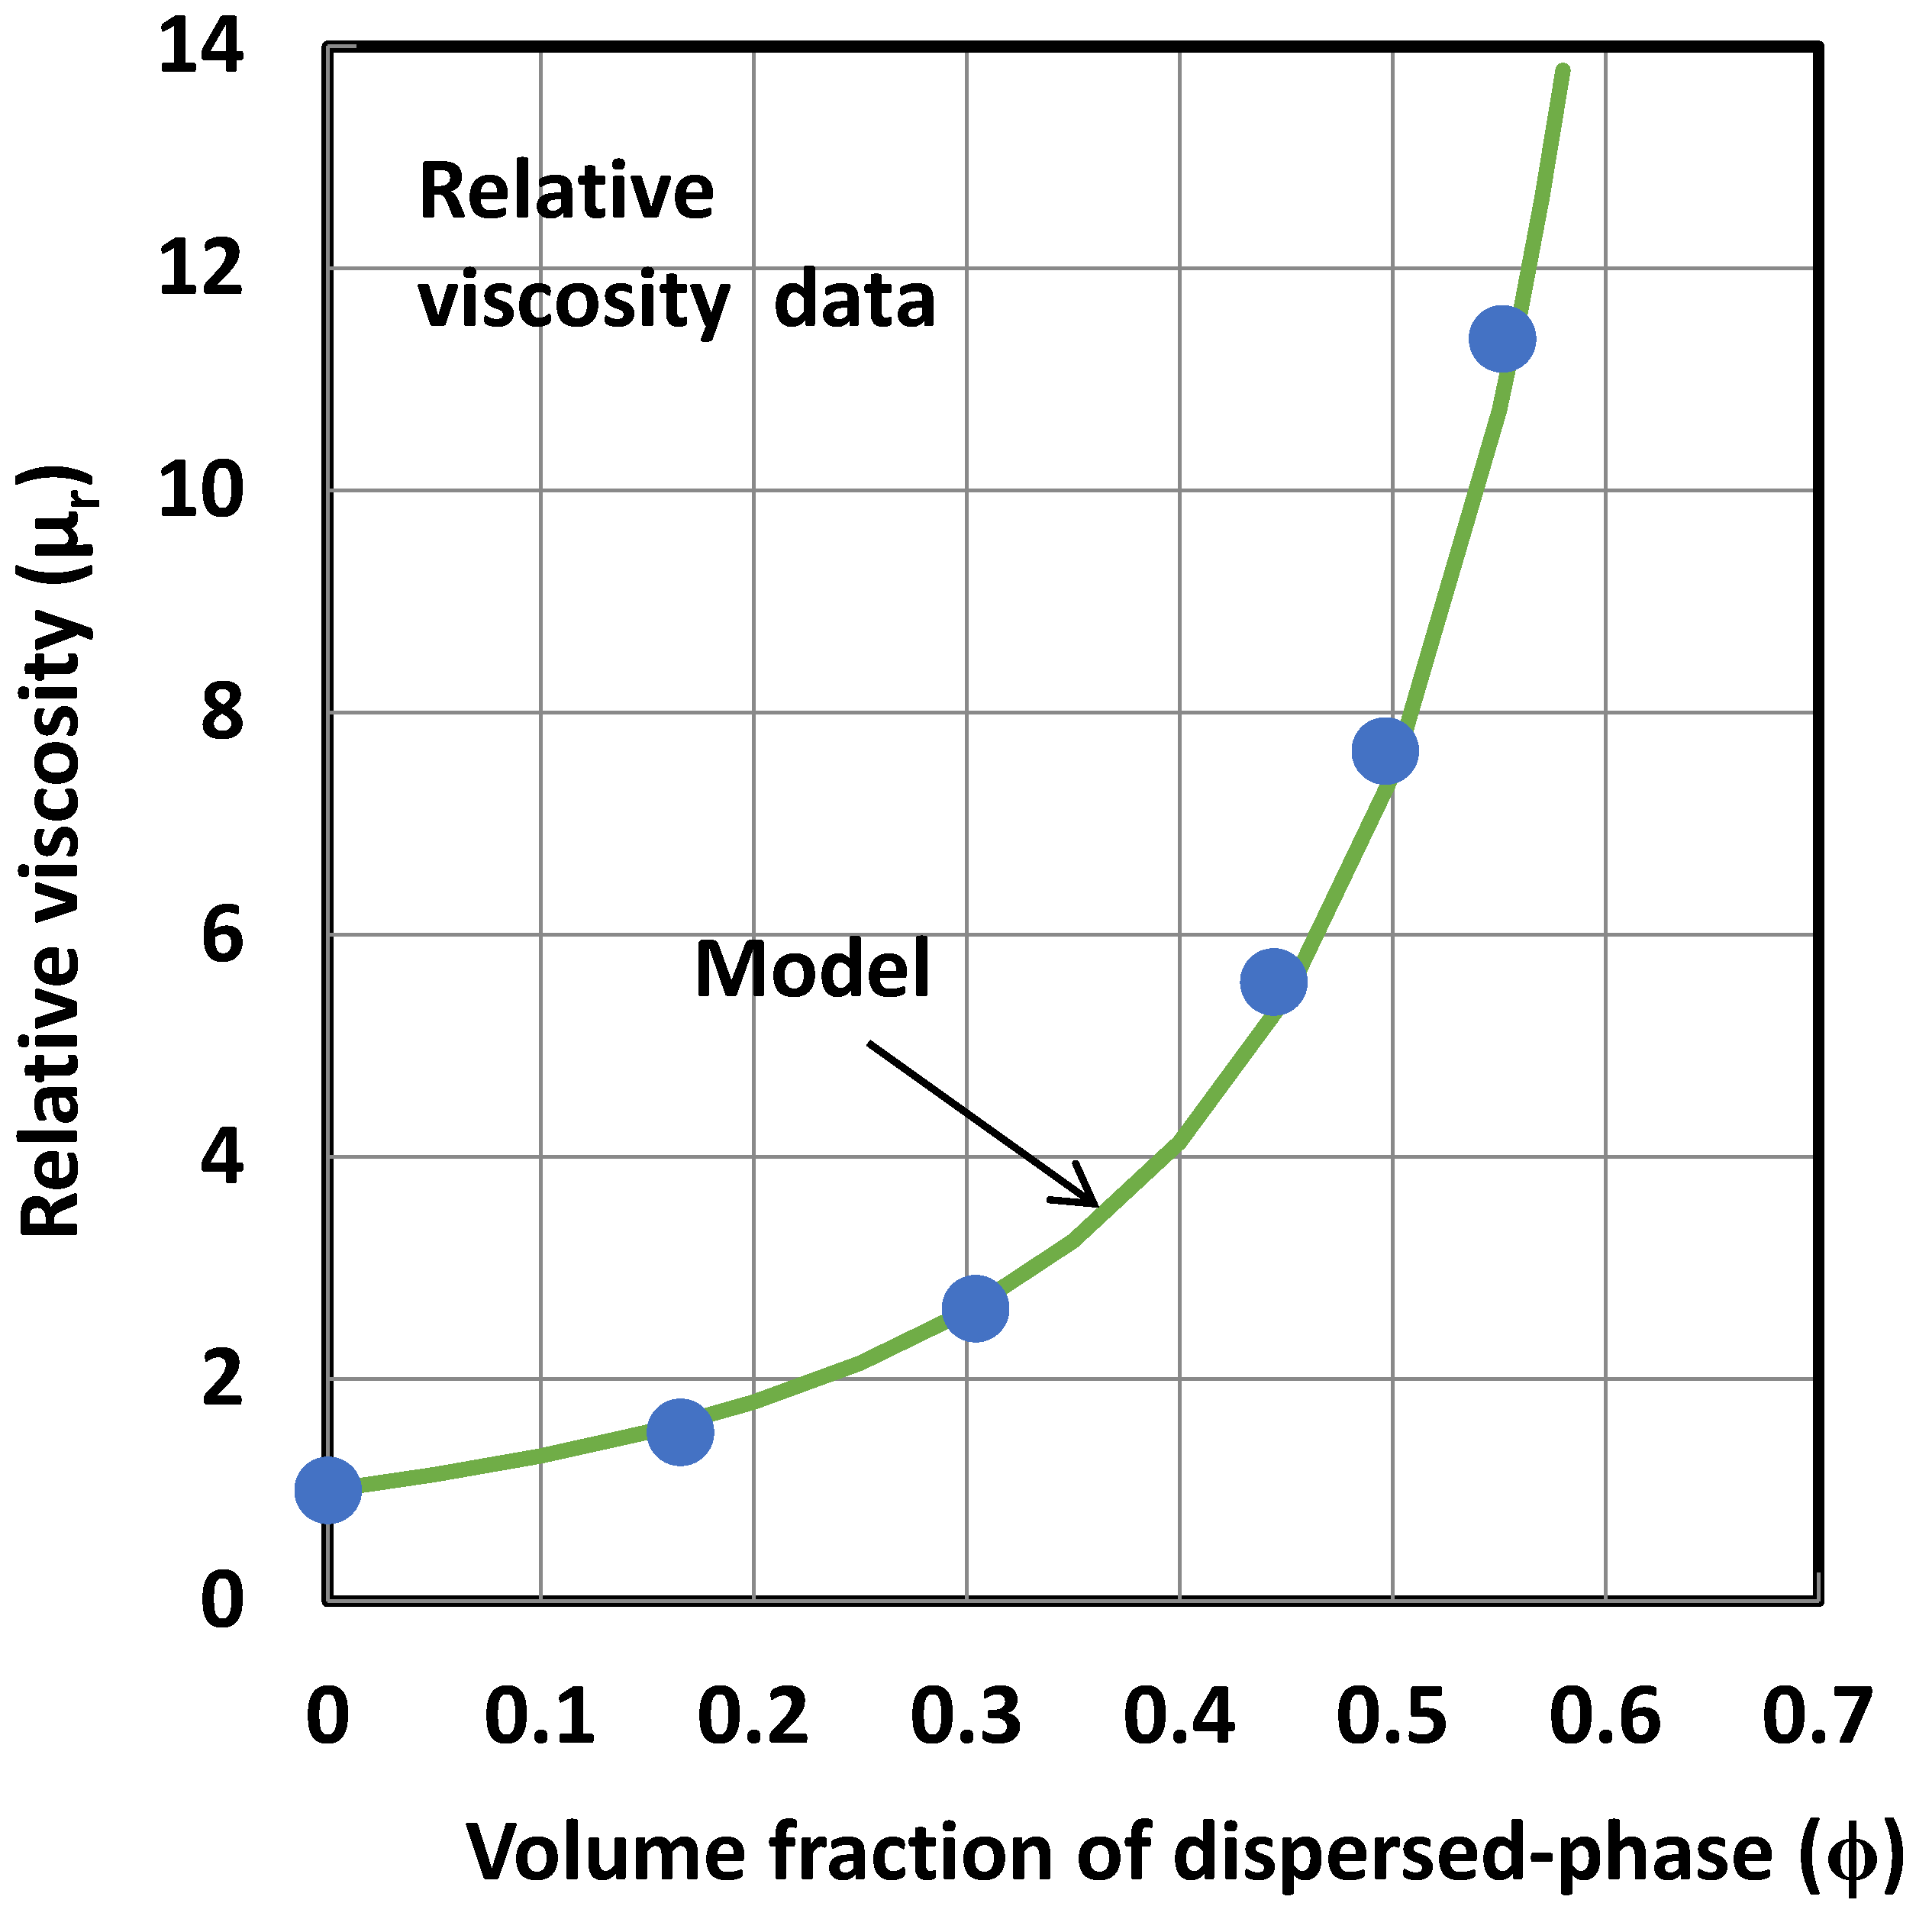
For Newtonian fluids, the shear stress versus shear rate relationship is linear passing through the origin [18]. The slope of the shear stress versus shear rate plot is the fluid viscosity. The fluid viscosity is constant independent of shear rate for Newtonian fluids. Figure 5 shows the plots of viscosity versus shear rate for various O/W emulsions investigated in this study. The viscosity versus shear rate data for emulsions was measured using the Fann co-axial cylinder viscometer. The emulsions are Newtonian in that the viscosity is independent of the shear rate. However, the viscosity increases sharply with the increase in the dispersed-phase (oil droplets) concentration. The increase in viscosity with the dispersed-phase concentration can be seen clearly in Figure 6 where the relative viscosity () is plotted as a function of the volume fraction of the dispersed-phase concentration (). Note that the relative viscosity
is defined as the ratio of emulsion viscosity () to continuous-phase (matrix) viscosity . The continuous phase (1% by wt. Triton X-100 solution in tap-water) viscosity
was 0.935 mPa.s at 25 °C. The solid curve shown in Figure 6 is generated from the following viscosity model of Pal published recently [19]:
where
is the maximum packing volume fraction of particles. For hexagonal packing of uniform spherical particles (same diameter),
is known to be 0.74. As the emulsions under consideration consisted of droplets of non-uniform size (diameters ranging from 1 to 10 µm), the
value of 0.85. It is well-known that the maximum packing concentration of particles
increases with the increase in polydispersity of particles. Using the
value of 0.85, the viscosity data of emulsions can be described accurately with Equation (22), as can be seen in Figure 6.
Figure 4.
Typical photomicrographs of a 55.14% by volume O/W emulsion.

Figure 5.
Viscosity of emulsions as a function of shear rate.

Figure 6.
Variation of emulsion relative viscosity with volume fraction of dispersed phase.

4.3. Exergy Destruction in Pipeline Flow of Oil-in-Water (O/W) Emulsions
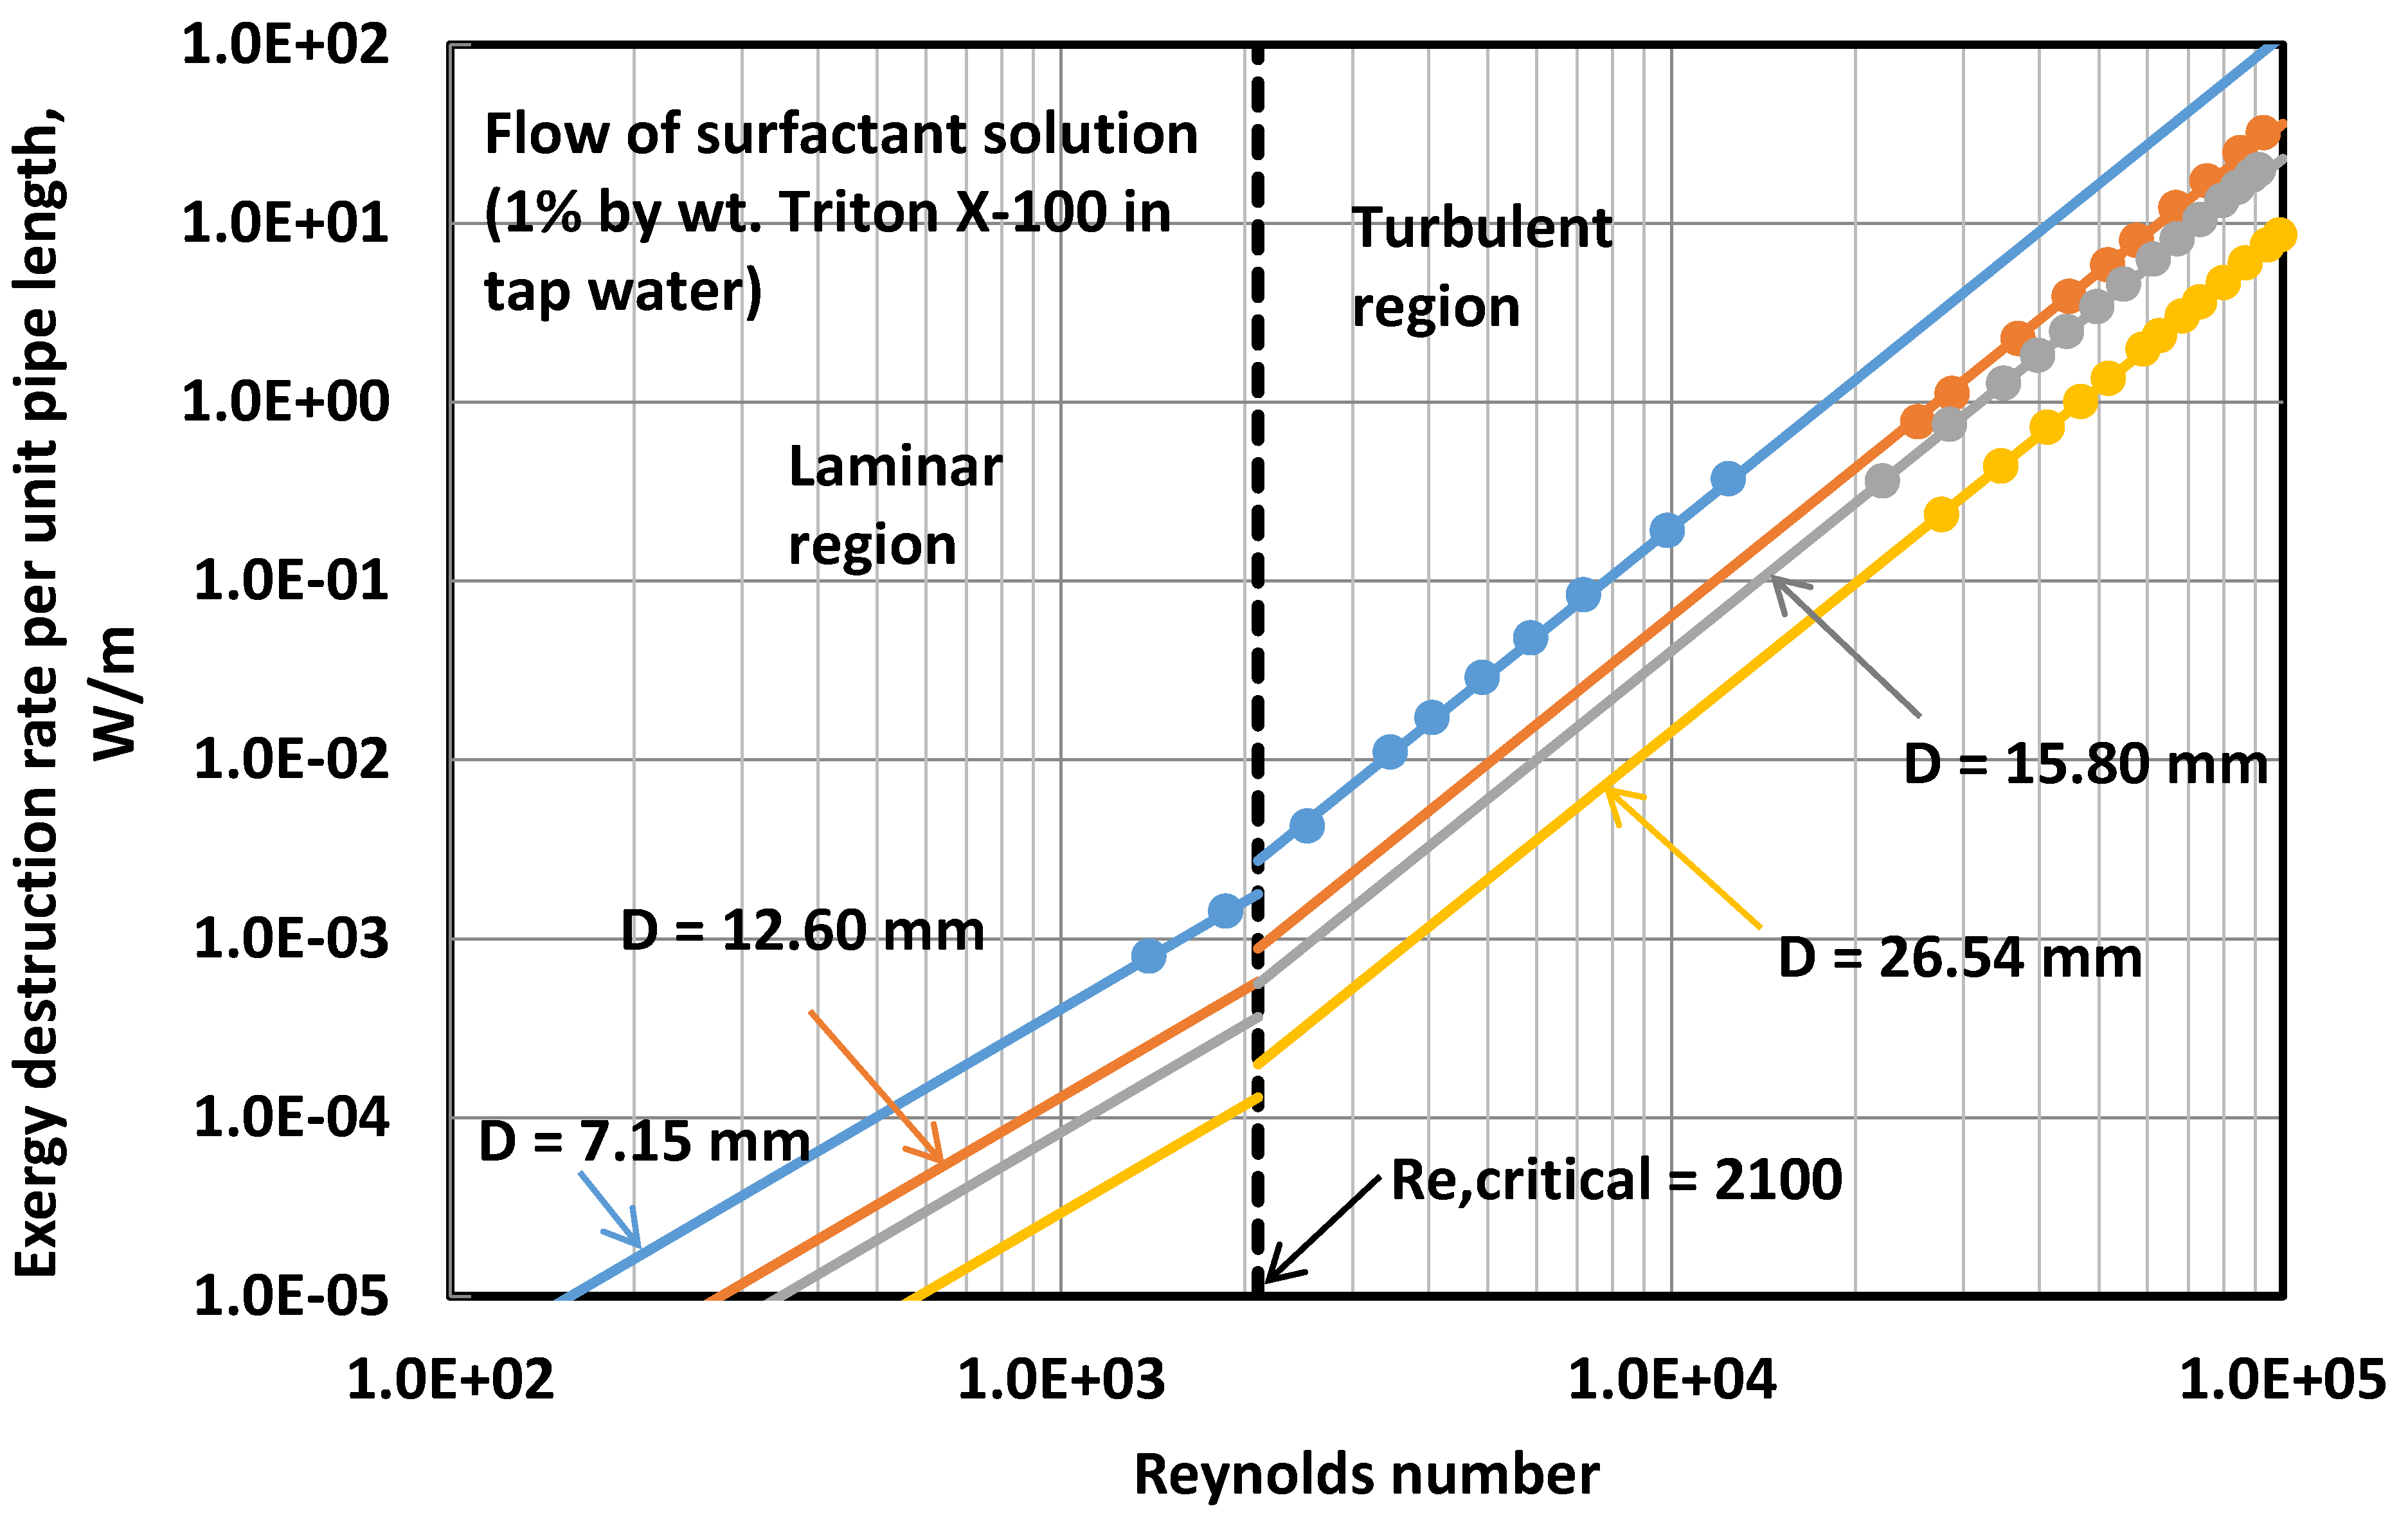
The rate of exergy destruction per unit pipe length () can be determined from Equation (17). It requires the knowledge of friction factor, fluid properties (μ and ρ), Reynolds number, pipe diameter, fluid temperature (T), and surrounding temperature (To). In the present study, T = To = 298.15 K. Figure 7 shows the plots of versus Re data for the surfactant solution (1% by wt. Triton X-100 aqueous solution) in different diameter pipes. The exergy destruction rate
increases with the increase in Reynolds number (Re) for a given diameter pipe. With the increase in pipe diameter,
decreases at any given Reynolds number.
Figure 7.
versus Re plots for the surfactant solution (1% by wt. Triton X-100 aqueous solution) in different diameter pipes.
Figure 7.
versus Re plots for the surfactant solution (1% by wt. Triton X-100 aqueous solution) in different diameter pipes.

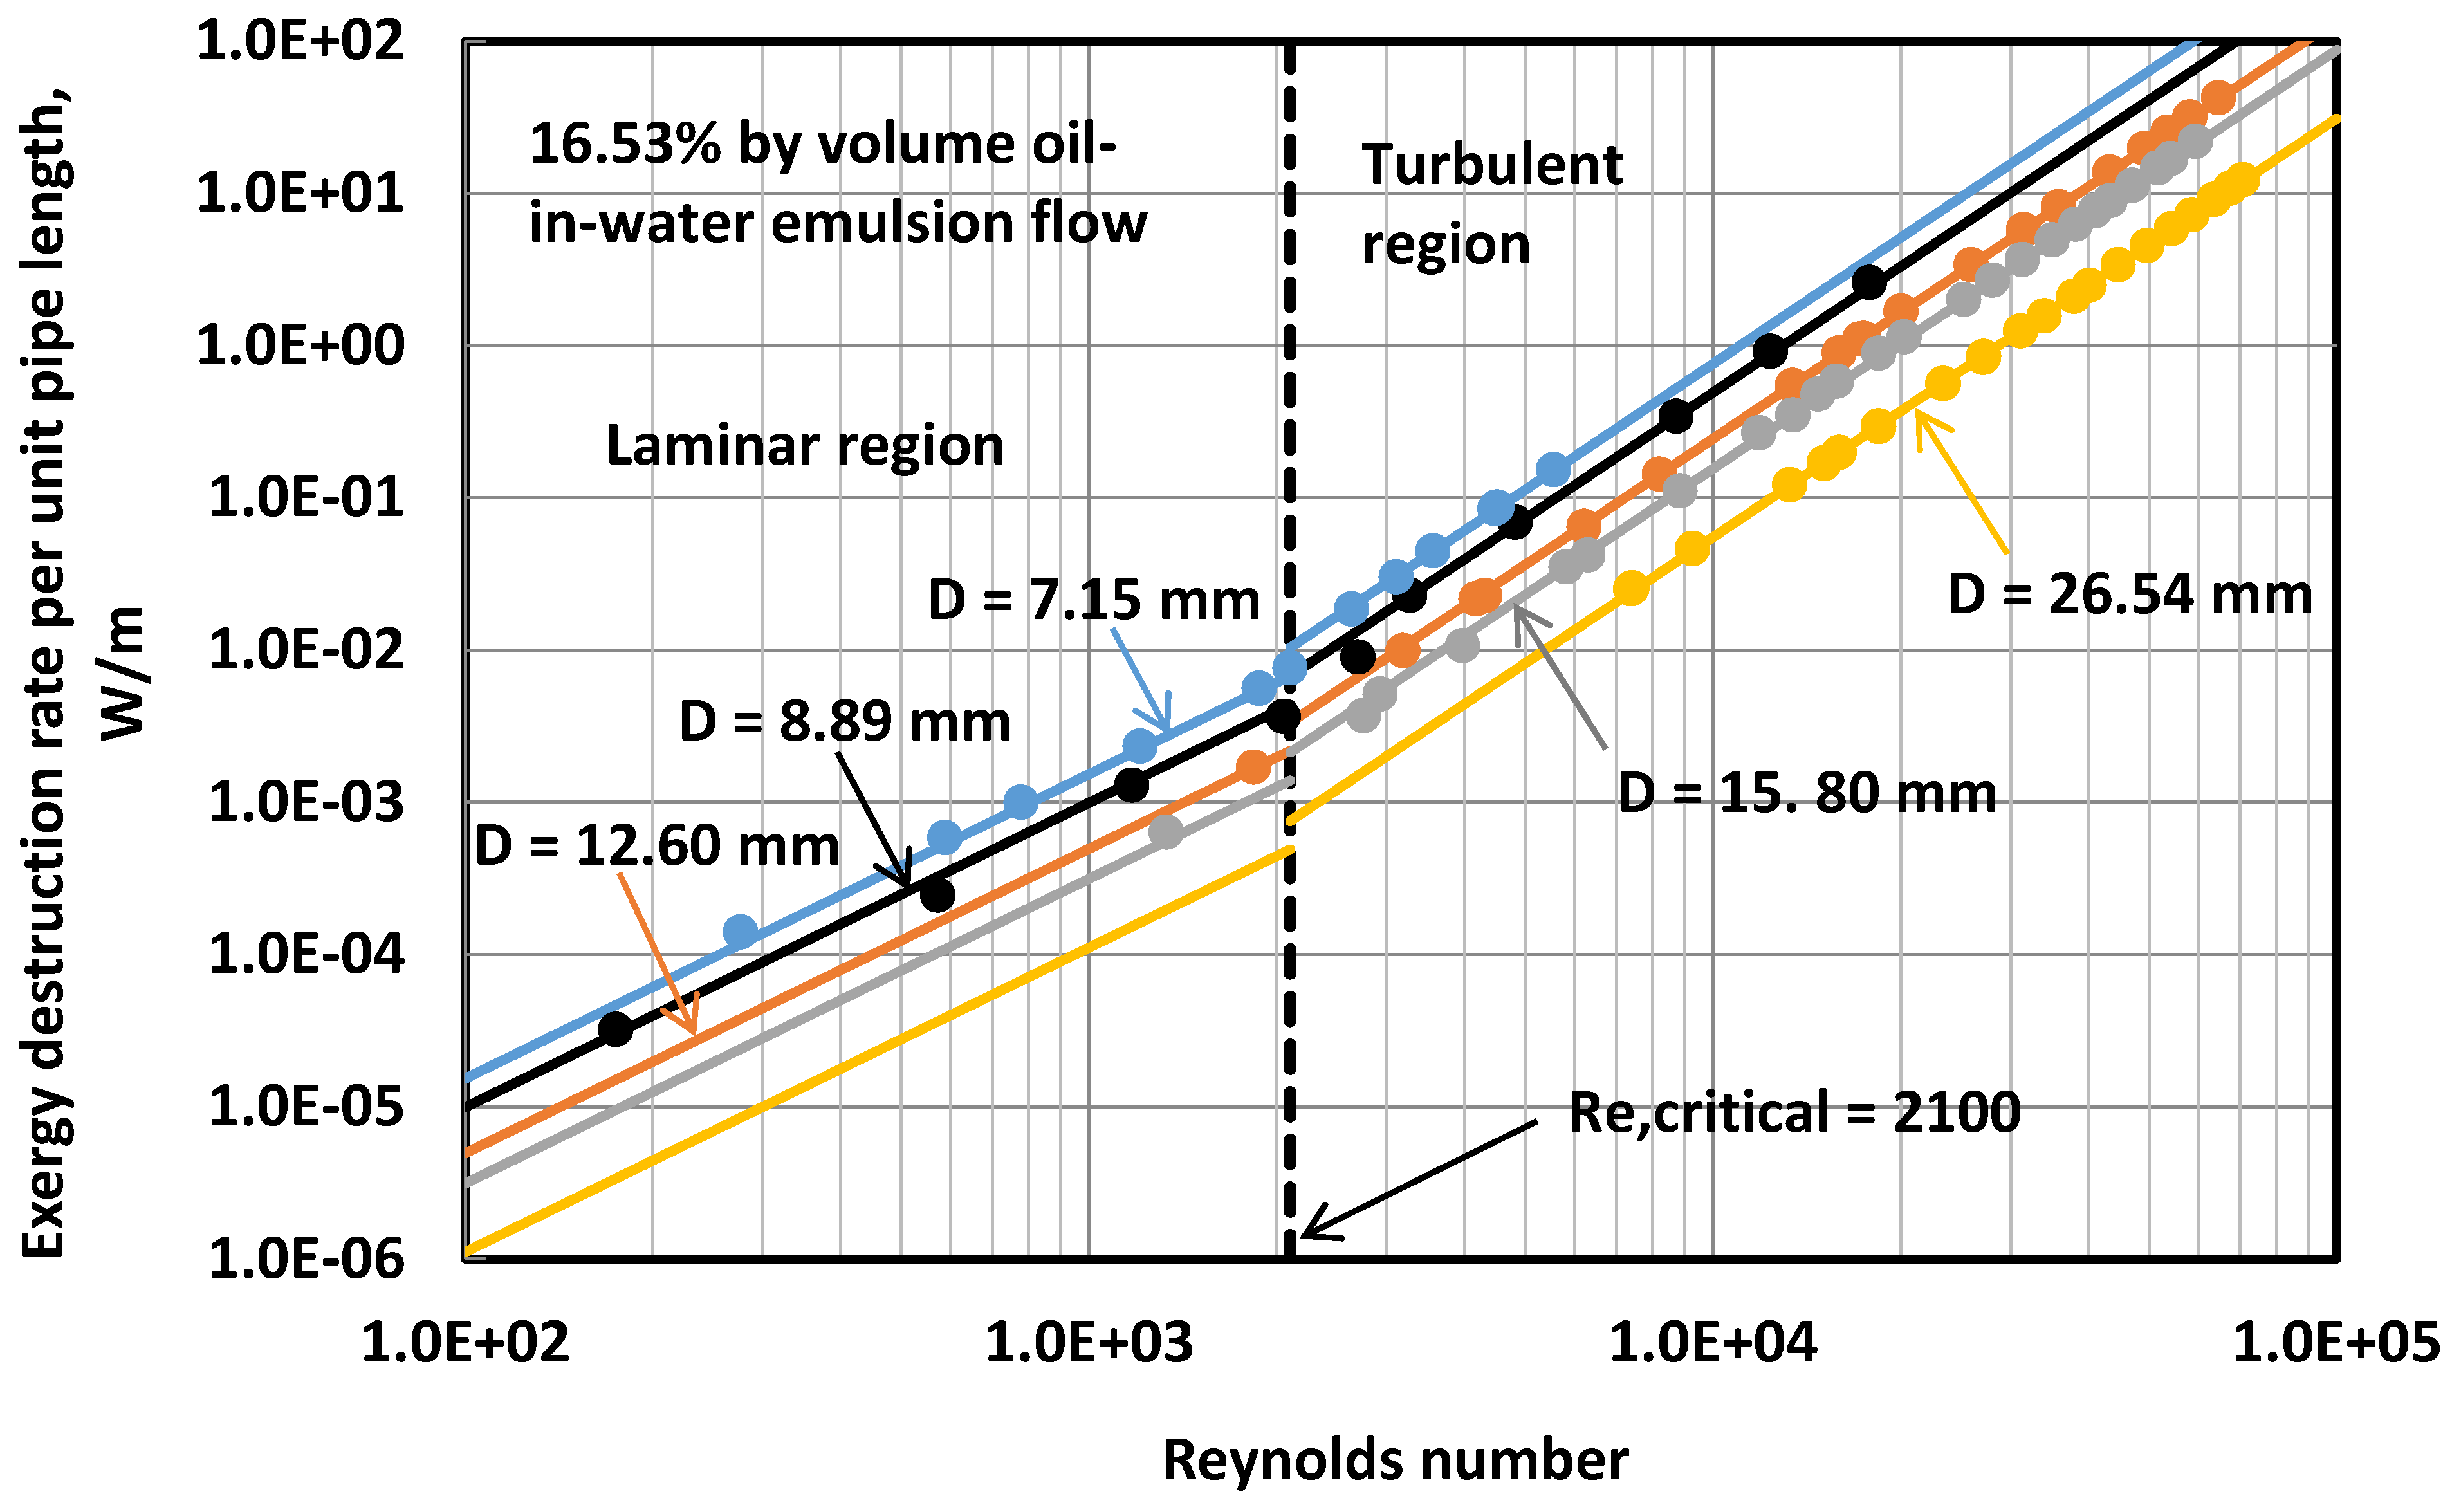
For a given diameter pipe, the experimental data (versus Re) exhibit a linear relationship on a log-log scale in both laminar and turbulent regimes. However the slope in the turbulent regime is higher. Note that due to low viscosity of the surfactant solution, the experimental data collected are mostly in the turbulent regime. The solid lines shown in the figure correspond to the predictions of the models, Equation (20) for laminar flow and Equation (21) for turbulent flow. The experimental data for the surfactant solution show good agreement with the predictive models. Figure 8, Figure 9, Figure 10, Figure 11 and Figure 12 show the plots of versus Re data for surfactant-stabilized oil-in-water (O/W) emulsions with different volume fractions of the dispersed-phase (oil). The experimental exergy destruction data of O/W emulsion flow in pipelines are in excellent agreement with the predictive models (Equation (20) for laminar flow and Equation (21) for turbulent flow) shown as solid lines in the figures.
Figure 8.
versus Re plots for 16.53% by vol. O/W emulsion flow in different diameter pipes.

Figure 9.
versus Re plots for 30.4% by vol. O/W emulsion flow in different diameter pipes.

Figure 10.
versus Re plots for 44.41% by vol. O/W emulsion flow in different diameter pipes.

Figure 11.
versus Re plots for 49.65% by vol. O/W emulsion flow in different diameter pipes.

Figure 12.
versus Re plots for 55.14% by vol. O/W emulsion flow in different diameter pipes.

4.4. Scaling of Exergy Destruction in Pipeline Flow of Oil-in-Water (O/W) Emulsions
According to the predictive models, Equations (20) and (21),
is a function of only Reynolds number for a given fluid (µ and ρ fixed). Thus the experimental data, for a given fluid, from different diameter pipes can be brought together by plotting
as a function of Reynolds number. Figure 13 shows all our experimental data for different emulsions, plotted as versus Reynolds number. As expected, the data for a given emulsion from different diameter pipes fall on the same curve both in laminar and turbulent regions. The solid lines shown in the figure are generated from Equations (20) and (21). With the increase in the dispersed-phase concentration, the experimental data shifts upward indicating an increase in exergy destruction rate at a given Reynolds number. The increase in the exergy destruction rate with the increase in the dispersed-phase concentration is mainly due to an increase in the viscosity of the emulsion.
Figure 13.
versus Re plots for surfactant-stabilized O/W emulsions with different volume fractions of dispersed-phase.
Figure 13.
versus Re plots for surfactant-stabilized O/W emulsions with different volume fractions of dispersed-phase.

In order to bring together all the experimental data (different dispersed-phase concentrations, different diameters) on to a single master curve, the data of Figure 13 are re-plotted in Figure 14 as versus Reynolds number, where
is given as:
In Equation (23), λ is the ratio of dispersed-phase (oil) density to continuous-phase (water) density and
is the maximum packing volume fraction of droplets. In the present study, λ = 0.782 and
= 0.85. The solid lines describing the master curve in Figure 14 are represented by the following equations:
where
is given by Equation (23); and
and
are continuous-phase viscosity and density, respectively. In the present study, T = To = 298.15 K,
(viscosity of surfactant solution) and
. Note that Equations (24) and (25) are new models capable of predicting the exergy destruction rate in pipeline flow of surfactant-stabilized O/W emulsions. The new models are derived from Equations (20) and (21) using the viscosity model given by Equation (22).
Figure 14.
Master curve,
versus Re plot, covering all the experimental exergy destruction data for surfactant-stabilized O/W emulsions.
Figure 14.
Master curve,
versus Re plot, covering all the experimental exergy destruction data for surfactant-stabilized O/W emulsions.

5. Conclusions
Based on the experimental work and analysis of exergy destruction in adiabatic pipeline flow of surfactant-stabilized oil-in-water emulsions, the following conclusions can be made: (a) for a given dispersed-phase concentration of emulsion, the exergy destruction rate in emulsion flow per unit length of pipe increases linearly with the increase in the Reynolds number on a log-log scale. However, the slope is higher in the turbulent region; (b) for a given emulsion, the exergy destruction rate decreases with the increase in the pipe diameter at the same Reynolds number in both laminar and turbulent regimes; (c) for a given emulsion, the experimental exergy destruction data obtained from different diameter pipes collapses on a single curve when the data are plotted as versus Reynolds number; (d) with the increase in the dispersed-phase concentration of emulsion, the exergy destruction rate increases substantially due to an increase in the viscosity of emulsion; (e) new models are developed for the prediction of exergy destruction rate in pipeline flow of emulsions; and (f) the experimental data on exergy destruction in pipeline flow of surfactant-stabilized oil-in-water emulsions shows excellent agreement with the predictions of the proposed models.
Acknowledgments
Financial support from NSERC is appreciated. The assistance provided by the technical staff of the Department of Chemical Engineering, University of Waterloo, in constructing the flow rig is appreciated.
Conflicts of Interest
The author declares no conflict of interest.
References
- Energy Efficiency Guide for Industry in Asia, Energy Equipment: Pump and Pumping Systems, United Nations Environment Programme 2006. Available online: http: //www.energyefficiencyasia.org (accessed on 8 July 2014).
- Smith, J.M.; van Ness, H.C.; Abbott, M.M. Introduction to Chemical Engineering Thermodynamics, 7th ed.; McGraw-Hill: New York, NY, USA, 2005; pp. 635–636. [Google Scholar]
- Abbott, M.M.; van Ness, H.C. Theory and Problems of Thermodynamics, Schaum’s Outline Series, 2nd ed.; McGraw-Hill: New York, NY, USA, 1989; pp. 302–307. [Google Scholar]
- Cengel, Y.; Boles, M. Thermodynamics: An Engineering Approach, 7th ed.; McGraw-Hill: New York, NY, USA, 2011; Chapter 8. [Google Scholar]
- Bejan, A. Entropy Generation through Heat and Fluid Flow; Wiley & Sons: New York, NY, USA, 1982; pp. 105–107. [Google Scholar]
- Pal, R. Rheology of Particulate Dispersions and Composites; CRC Press: Boca Raton, FL, USA, 2007. [Google Scholar]
- Pal, R. Effect of droplet size on the rheology of emulsions. AIChE J. 1996, 42, 3181–3190. [Google Scholar] [CrossRef]
- Pal, R. Pipeline flow of unstable and surfactant-stabilized emulsions. AIChE J. 1993, 39, 1754–1764. [Google Scholar] [CrossRef]
- Pal, R.; Rhodes, E. Emulsion flow in pipelines. Int. J. Multiph. Flow 1989, 15, 1011–1017. [Google Scholar] [CrossRef]
- Pal, R. Rheology of simple and multiple emulsions. Curr. Opin. Colloid Interface Sci. 2011, 16, 41–60. [Google Scholar] [CrossRef]
- Pal, R. Techniques for measuring the composition (oil and water content) of emulsions—A state of the art review. Colloids Surfaces A 1994, 84, 141–193. [Google Scholar] [CrossRef]
- Steinhauff, F. Modern oilfield demulsification. Part I. Petroleum 1962, 25, 294–296. [Google Scholar]
- Lissant, K.J. Emulsification and demulsification in oil recovery. In AIChE Symposium on Improved Oil Recovery by Surfactant and Polymer Flooding; Shah, D.O., Schechter, P.S., Eds.; AIChE: New York, NY, USA, 1978; pp. 93–100. [Google Scholar]
- Raghavan, R.; Marsden, S.S. Theoretical aspects of emulsification in porous media. SPEJ 1971, 11, 153–161. [Google Scholar] [CrossRef]
- Marsden, S.S.; Raghvan, R. A system for producing and transporting crude oil as an oil/water emulsion. J. Inst. Pet. 1973, 59, 273–278. [Google Scholar]
- Mahian, O.; Kianifar, A.; Kleinstreuer, C.; Al-Nimr, M.A.; Pop, I.; Sahin, A.Z.; Wongwises, S. A review of entropy generation in nanofluid flow. Int. J. Heat Mass Transfer. 2013, 65, 514–532. [Google Scholar] [CrossRef]
- Farran, R.; Chakraborty, N. A direct numerical simulation-based analysis of entropy generation in turbulent premixed flames. Entropy 2013, 15, 1540–1566. [Google Scholar] [CrossRef]
- Pal, R.; Yan, Y.; Masliyah, J. Rheology of emulsions. Adv. Chem. Ser. 1992, 231, 131–170. [Google Scholar]
- Pal, R. New models for the viscosity of nanofluids. J. Nanofluids 2014, 3, 260–266. [Google Scholar] [CrossRef]
© 2014 by the authors; licensee MDPI, Basel, Switzerland. This article is an open access article distributed under the terms and conditions of the Creative Commons Attribution license (http://creativecommons.org/licenses/by/4.0/).
Share and Cite
MDPI and ACS Style
Pal, R. Exergy Destruction in Pipeline Flow of Surfactant-Stabilized Oil-in-Water Emulsions. Energies 2014, 7, 7602-7619. https://doi.org/10.3390/en7117602
AMA Style
Pal R. Exergy Destruction in Pipeline Flow of Surfactant-Stabilized Oil-in-Water Emulsions. Energies. 2014; 7(11):7602-7619. https://doi.org/10.3390/en7117602
Chicago/Turabian StylePal, Rajinder. 2014. "Exergy Destruction in Pipeline Flow of Surfactant-Stabilized Oil-in-Water Emulsions" Energies 7, no. 11: 7602-7619. https://doi.org/10.3390/en7117602