Compact Design of 10 kW Proton Exchange Membrane Fuel Cell Stack Systems with Microcontroller Units

Abstract
: In this study, fuel, oxidant supply and cooling systems with microcontroller units (MCU) are developed in a compact design to fit two 5 kW proton exchange membrane fuel cell (PEMFC) stacks. At the initial stage, the testing facility of the system has a large volume (2.0 m × 2.0 m × 1.5 m) with a longer pipeline and excessive control sensors for safe testing. After recognizing the performance and stability of stack, the system is redesigned to fit in a limited space (0.4 m × 0.5 m × 0.8 m). Furthermore, the stack performance is studied under different hydrogen recycling modes. Then, two similar 5 kW stacks are directly coupled with diodes to obtain a higher power output and safe operation. The result shows that the efficiency of the 5 kW stack is 43.46% with a purge period of 2 min with hydrogen recycling and that the hydrogen utilization rate μf is 66.31%. In addition, the maximum power output of the twin-coupled module (a power module with two stacks in electrical cascade/parallel arrangement) is 9.52 kW.1. Introduction
Fuel cells are considered to be the most promising power source for electric vehicles because of their high power density, low pollution, quick startup capability and long lifetime. Bao et al. [1,2] developed a control-oriented dynamic model of air stream and hydrogen flow with recirculation in a proton exchange membrane fuel cell (PEMFC) system. He et al. [3] introduced both an ejector and a blower for a PEMFC stack as a fuel efficiency configuration because the hydrogen recirculation is dependent on the current load. At a low current load, a low-pressure regulator was used to independently supply the hydrogen and keep the input gas pressure nearly constant, while a blower was used to re-circulate the hydrogen exhausted from the stack. At a relatively high current load, a flow control valve was activated to supply the additional hydrogen flow, and an ejector with a blower re-circulated the exiting hydrogen. Meiler et al. [4] investigated the dynamic behavior of the mean cell voltage of a PEMFC stack. The variations in humidity of the reactant gases were relative to the performance of the cells. Blanco et al. [5] developed micro-porous layers (MPLs) in a cathode gas diffusion layer, which improved water management and allowed the cell to have a better performance at both fully humidified and low humidity conditions compared with a gas diffusion layer without MPLs. Li et al. [6] indicated that the temperature variation has a significant influence on the performance and lifespan of the PEMFC stack. Ahn et al. [7] found that excessive use of coolants lowers the temperature in the stack and reduces the rate of chemical reactions. The corresponding parasitic power dissipated at the electrical coolant pump increases, and the overall efficiency of the power system decreases. Inlet water (liquid and vapor) effects may play an important role in the performance of a PEMFC stack [8]. The dynamic performance of the PEMFCs is time dependent and involves several typically transient processes: start-up, shut-down and load changes. The transient responses of the operating conditions are an indication of the complex interactions between the related parameters and the dynamic performance of PEMFCs [9].
It is difficult to insert adapted sensors in a closed stack to measure the internal physical parameters, such as the temperature distribution over the plates. Moreover, experimental tests that have been performed in a lab were able to reproduce some of the critical operating conditions of the stack; therefore, it is important to design external sensing elements for each subsystem to determine the physical parameters of the stack performance [10].
Bernardinis et al. [11] showed that in order to supply a DC electrical load with a significant power level, a multi-stack fuel cell generator is required to attain the power demands. Candusso et al. [12] indicated that there are four examples of topologies for a four-stack coupling, which could be used as a power source for further applications. The FC modules can be autonomously or serially coupled with their power converter and connected to the load. Furthermore, the modules can be twin-coupled to increase the voltage per module. Additionally, four FC stacks can be coupled before being connected to the power converter; this arrangement increases the total output voltage, but the system can be severely weakened when one or more FCs fails. Furthermore, previous studies [13–15] showed that a low-powered piezoelectric PEMFC stack (PZT-Stack) with a pseudo-bipolar design does not exhibit open circuit behavior even if one of the component cells fails in the electrical cascade configuration. The pseudo-bipolar design is used as the common cathode collector, and the collector support is constructed from a gold-plated copper plate to allow for conduction between the two component cells. The three bi-cells are arranged in electrical parallel/cascade configurations connected by external wires. In the electrical parallel configuration, the anodes of the three bi-cells are connected by external wires to the negative pole of the electronic load, and the cathodes of the bi-cells are connected to the positive pole of the electronic load to form the electrical parallel configuration. In the electrical cascade configuration, the common cathode collector of Bi-Cell #1 is connected to the anode of Bi-Cell #2. Similarly, the common cathode collector of Bi-Cell #2 is connected to the anode of Bi-Cell #3 to form the electrical cascade.
As a result of the fuel cells' low output voltage, a static converter has to be used to step-up the voltage magnitude of the sources to a regulated direct current (DC) bus. Shahin et al. [16] performed a study where the step-up voltage ratio was approximately 10, and the converter was connected to a battery pack. To reach a high voltage ratio, isolated converter structures are usually applied. Bernardinis et al. [11] indicated that a diode can avoid a reverse current flowing back to the stacks, and metal oxide semiconductor field emission transistors' switches allow the coupling of an additional FC stack to maintain and control the total output voltage. To prevent an unexpected open circuit, Candusso et al. [12] showed that the value of the stack impedance has a key role in triggering the diode conduction as a by-pass circuit when multiple stacks are connected in an electrical cascade arrangement. According to previous studies, a converter appears to be essential to unifying the voltage levels of all stacks before being coupled together to obtain a higher output voltage. However, Andreasen et al. [17] showed that if the fuel cell stack voltages are dimensioned properly to the battery pack voltage, then a direct fuel cell/battery connection is a simple and efficient way of charging the batteries.
The motivations of this study are: (1) to create a micro control unit to control two 5 kW stack systems; (2) to achieve 10 kW power output, two 5 kW stack systems with similar performance may directly couple with diodes in an electrical cascade/parallel arrangement in a compact way; and (3) create a hydrogen recycling system. By varying the purge periods of the fuel gas, the consumption and humidity of the hydrogen is well controlled; therefore, the usage of hydrogen is more efficient and the stack performance is steadier than the design without hydrogen recycling.
2. Compact Design of the 5 kW Fuel Cell Stack
A 5 kW fuel cell stack has 75 cells in one set [18]. In the testing facility design, three subsystems (fuel, oxidant supply and water cooling) with a long pipeline and excessive control sensors were tested separately. It is difficult for these systems to fit in a limited space as a power unit with uniform temperature distribution. The compact design of the three subsystems with an MCU is packaged in an aluminum box as a power module.
2.1. Microcontroller Units (MCU) System
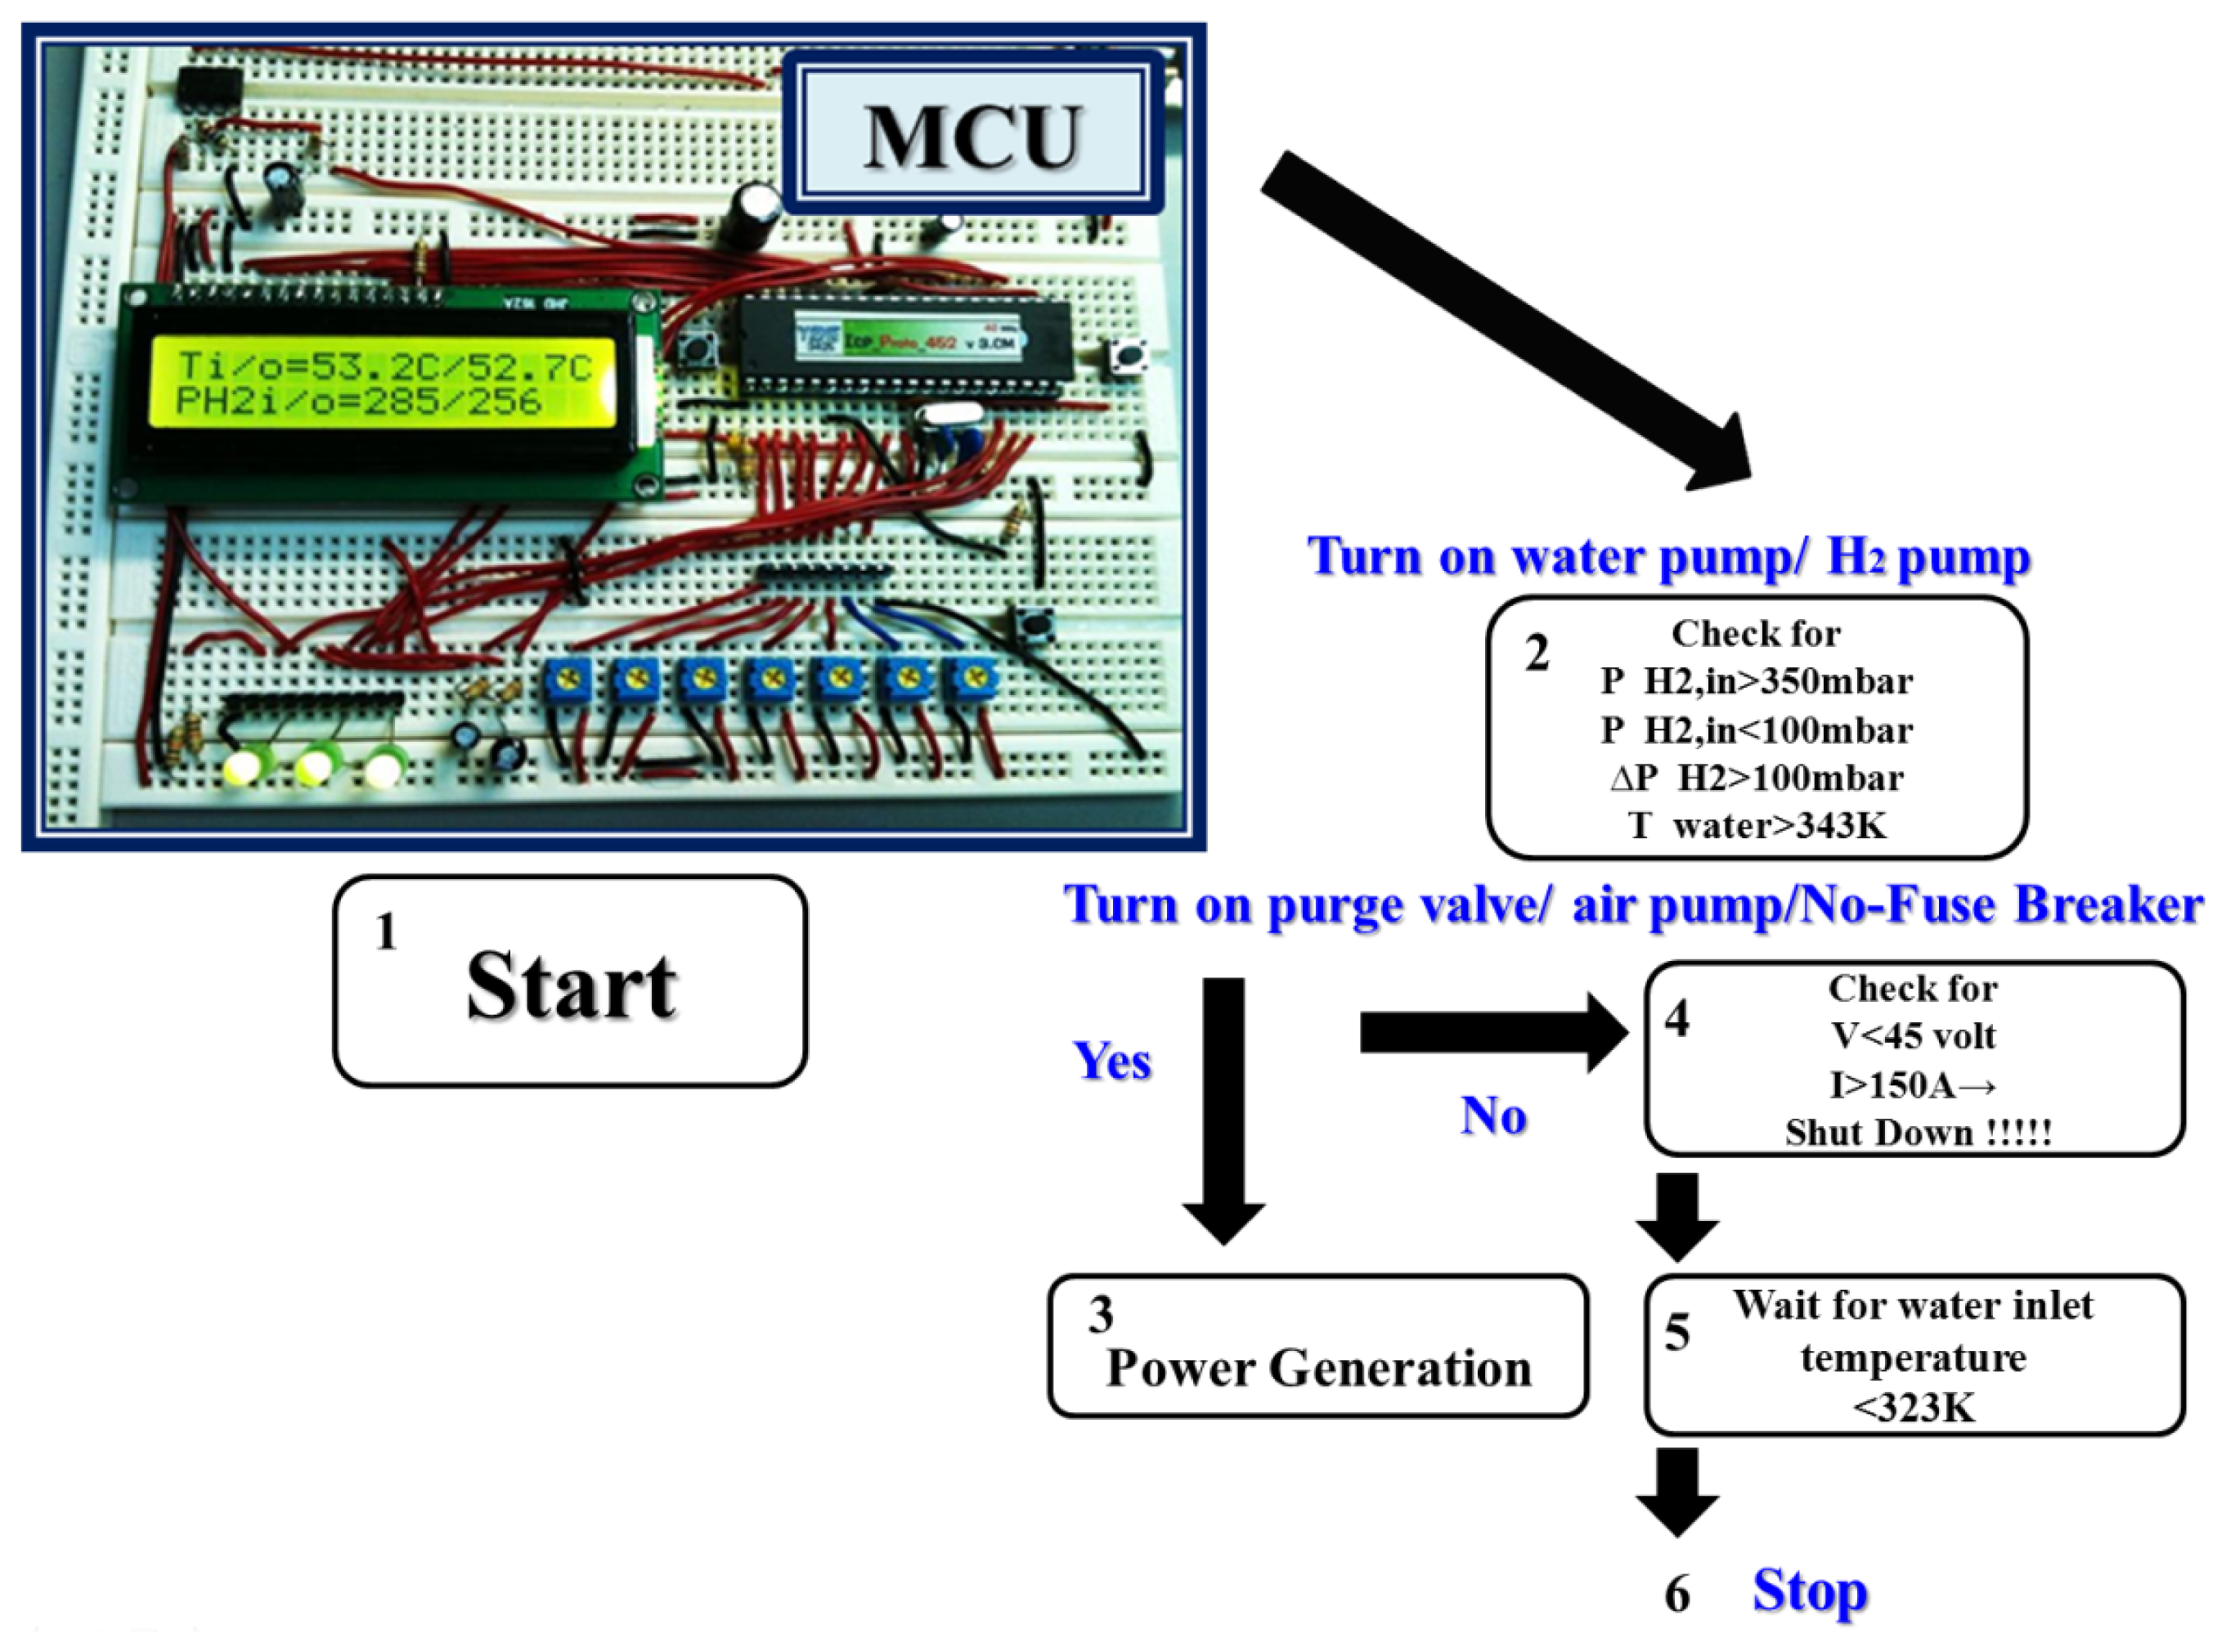
The MCU is a small computer for automatic device control and data recording. This study uses microprocessor and LabVIEW platform to control the system. As shown in Figure 1, the MCU system controls the water pump, on/off valves, recirculation pump, purge valves, air blower, and so forth. When the stack voltage is less than 45 V, the system will shut down. After starting up, the system will open the water pump, the valves in the water cooling system and the gas pump in the fuel supply system. The input hydrogen pressure is maintained between 150 mbar and 350 mbar. The system opens the purge valve with 8 × 10⁻⁴ m3/s rate for a period of time to reduce the internal flooding. After starting the air supply system, the no-fuse breaker begins to protect the stack. If the stack is overloaded, the system shut downs automatically. The Lab-View control interface is used to control the system on-screen. After the signal is transmitted to the MCU, the hydrogen pressure, air temperature, and water temperature are automatically displayed on-screen. In this study, the control logic is pure protective control, because the performance of each stack is very steady and the operated environment is very stable. Therefore, we just need few diodes for multi-stack's electrical connection. The control system has difficulty to keep the stack's performance in equilibrium state if the performance between each stack is in big difference. If the performance between each stack is similar, the designers can connect the stacks only with diodes in electrical cascade or parallel configuration. In the other words, the designer can reduce the complexity and cost for system control.
2.2. Fuel Supply System
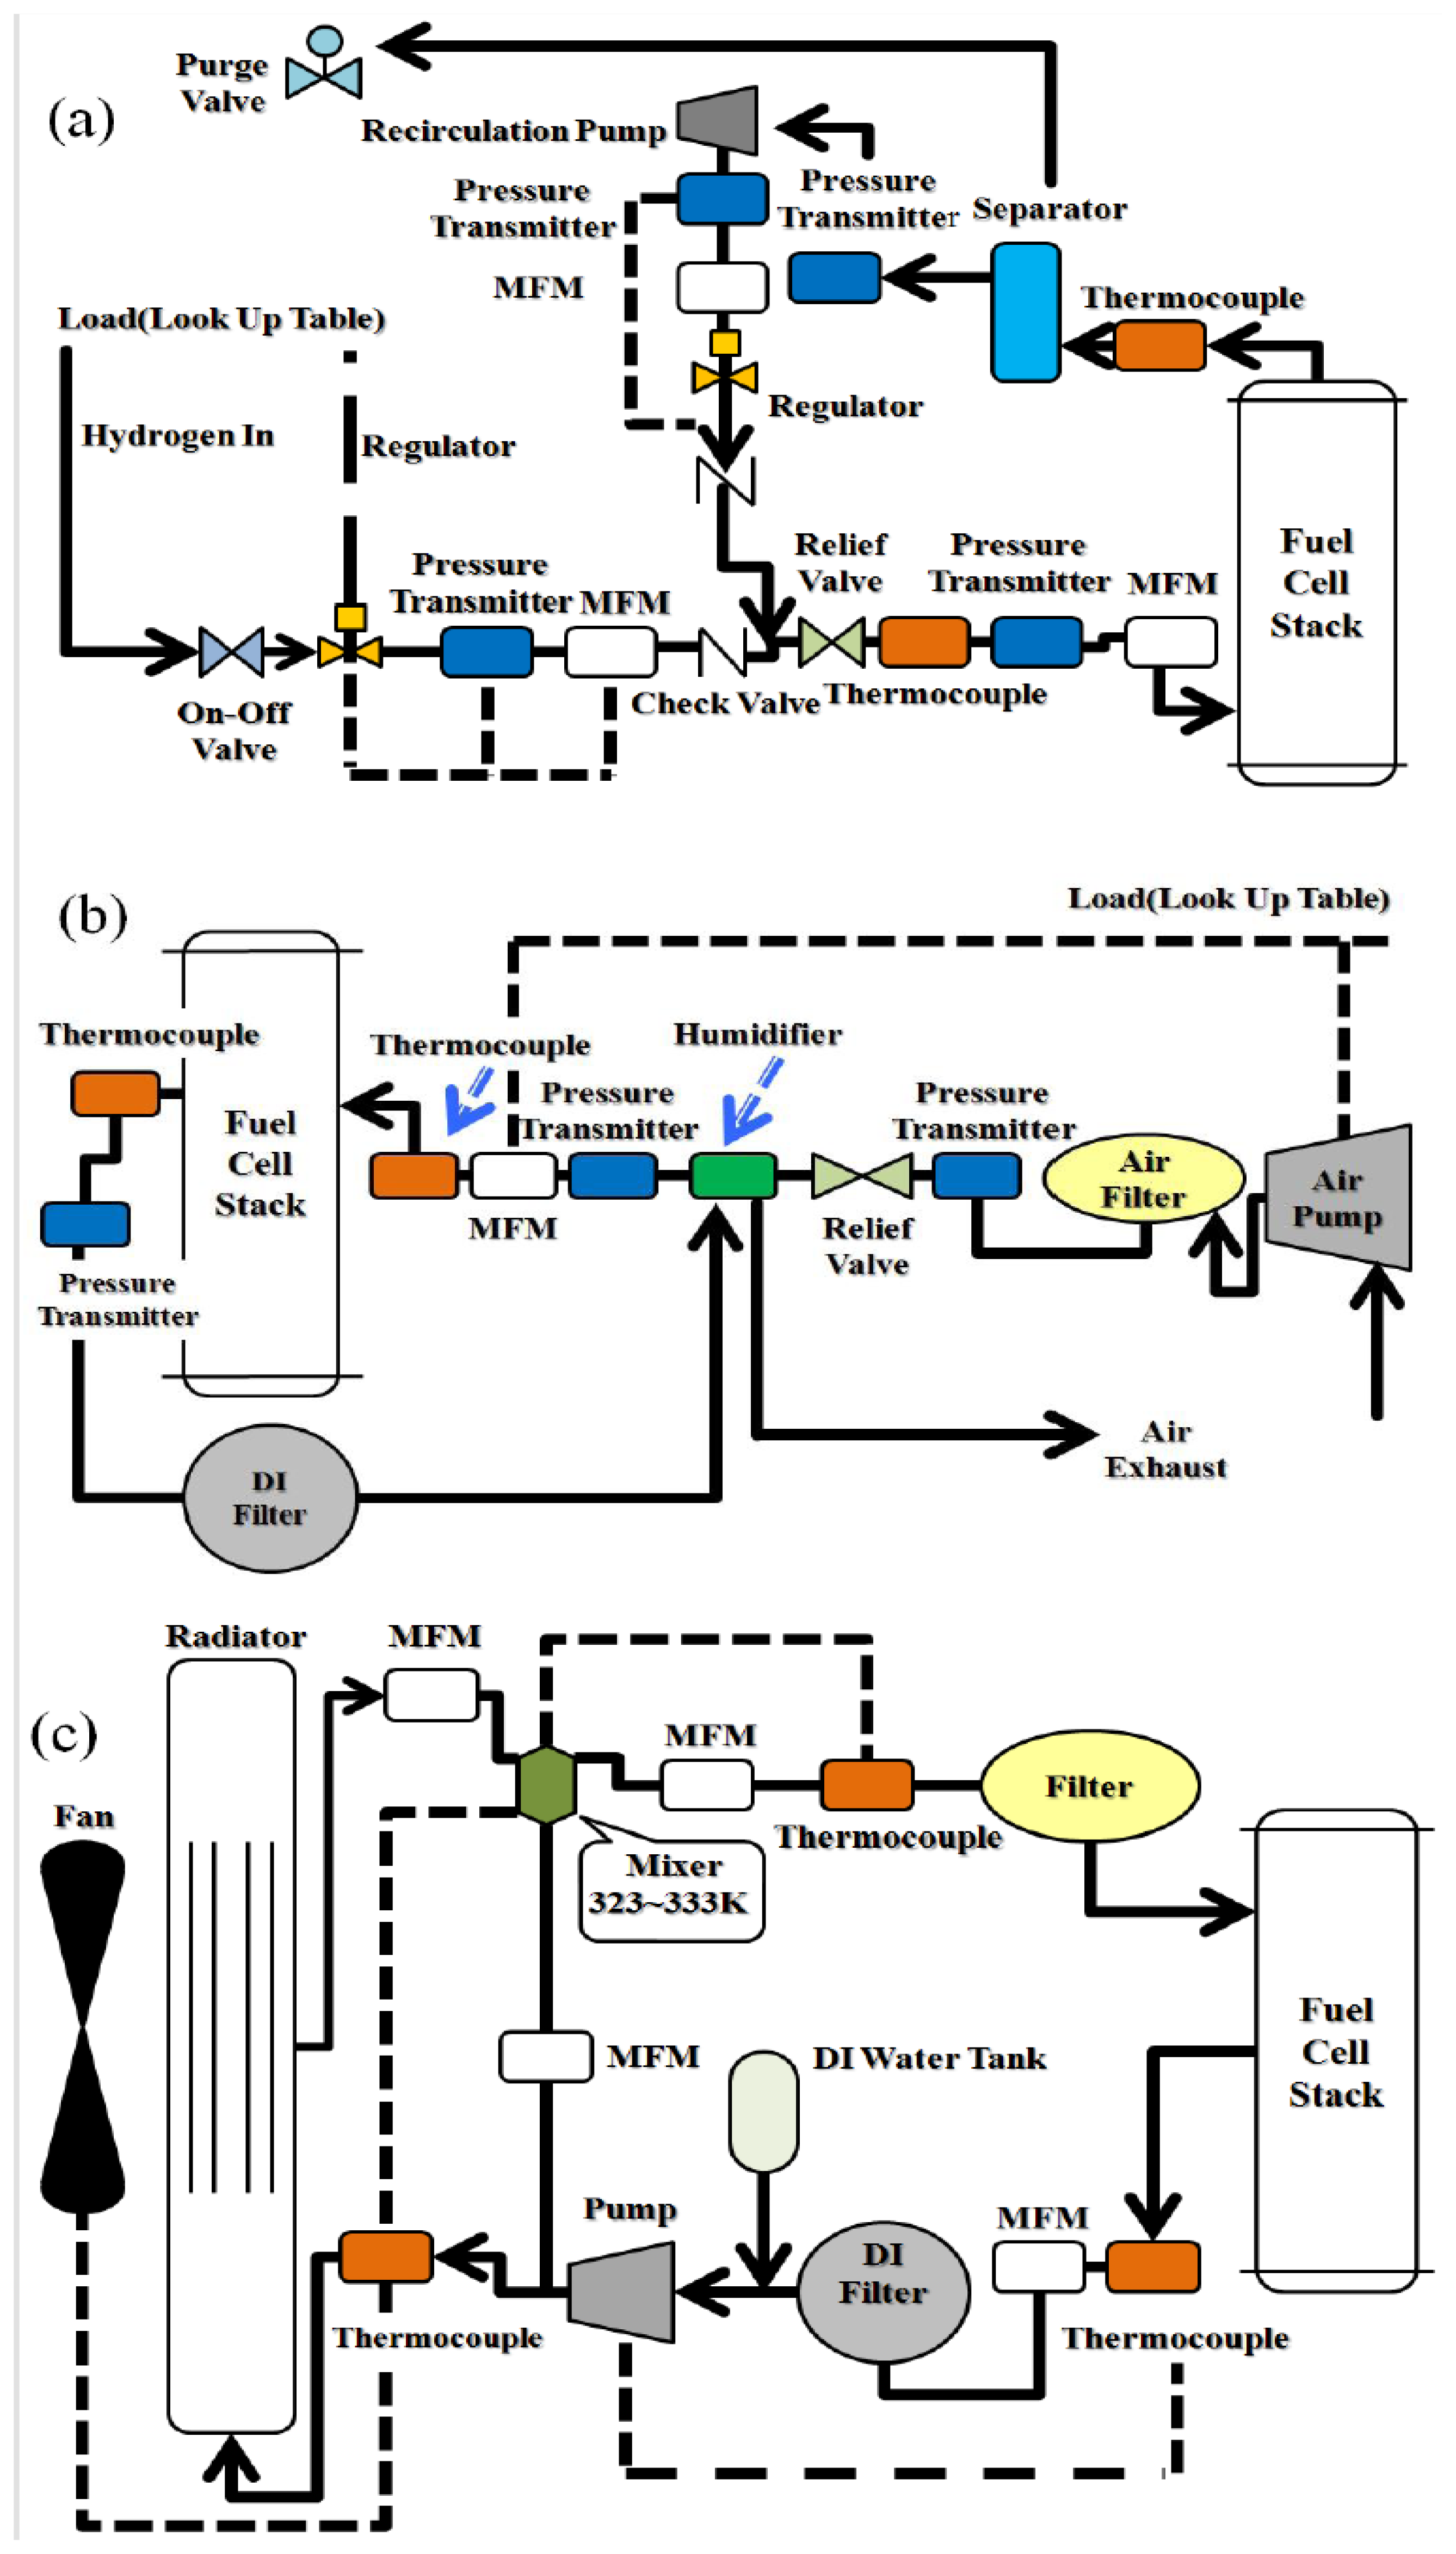
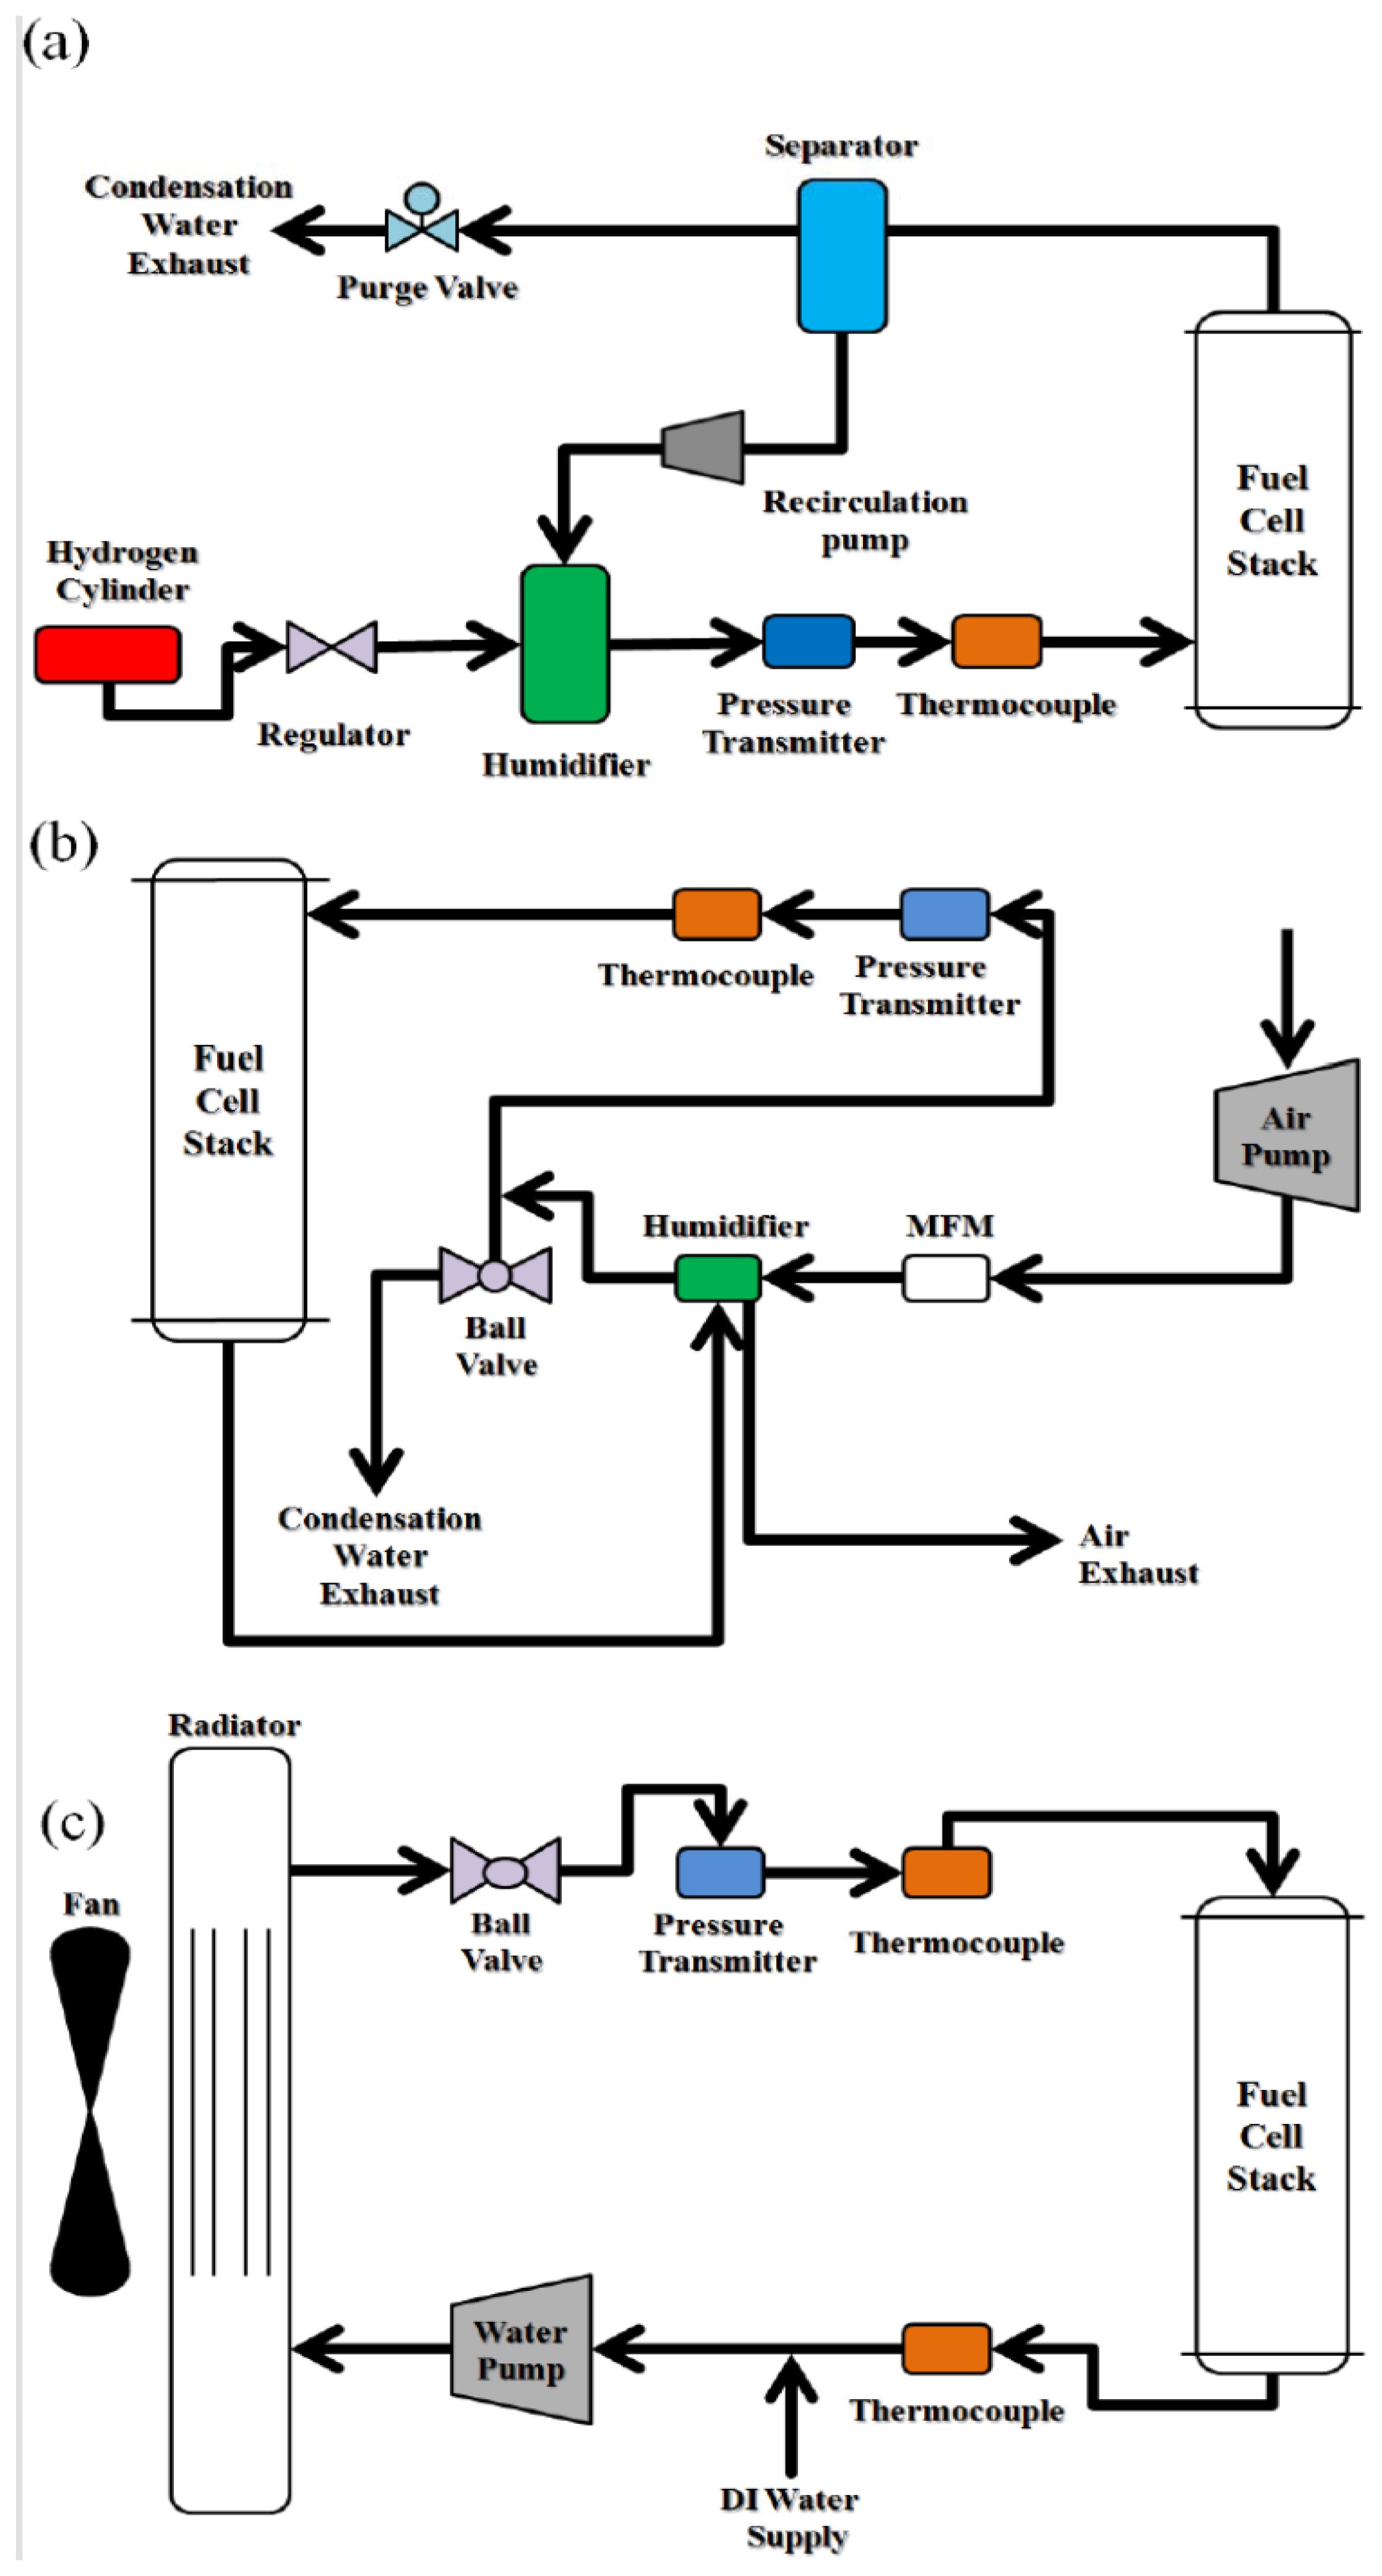
The testing facility design of the fuel supply system is shown in Figure 2a. After the system initiates, the regulator adjusts the hydrogen pressure to 300 mbar before it enters the stack, and the mass flow meter (MFM) monitors the quantity of the input hydrogen flow. The check valve prevents the hydrogen from flowing back, which will cause the stack performance to be unstable. Thermocouples monitor the temperature of the input and output hydrogen flow. The separator isolates the remaining hydrogen gas, which will be mixed with pure hydrogen for recycling. Because the humidity and temperature of the input hydrogen flow influence the stack performance significantly, a reduced number of measurement components and shorter pipe length may stabilize the stack performance better. The number of measurement components can be reduced from 18 to 7, as shown in Figure 3a.
2.3. Oxidant Supply System
The testing facility design is shown in Figure 2b. After the system initiates, the air pump draws ambient air into the system. Then, the pressure transmitter monitors the air pressure. If the air pressure is too high, the relief valve will purge the high pressure air to the atmosphere to protect the stack and humidifier. The air is monitored by a flux meter and thermocouple before it enters the stack. The water produced at the cathode is recycled back to the humidifier. However, the testing facility design, which has an excessive number of measurement components and oversized tubes that will cause significant pressure loss. In addition, it is difficult to obtain a steady air temperature and stabilize the stack performance. To improve the design of the oxidant supply system, the air pressure and temperature sensors are set only in the cathode entrance, which ensures that the quantity of air entering the systems in appropriate and protects the stack from failing. The number of experimental components can be reduced from 11 to 6 to reduce the cost, as shown in Figure 3b.
2.4. Water Cooling System
The testing facility design is shown in Figure 2c. After the cooling water decreases the amount of excess heat in the stack, the temperature of the cooling water is measured by the thermocouple before being pumped into the radiator or heat mixing valve. In the start-up stage, the stack needs to warm up to its operating temperature 323–333 K; therefore, the cooling water is guided to the internal loop rather than the radiator. If the water temperature reaches 333–343 K, the majority of the cooling water is pumped to the external loop and then to the radiator. This design ensures that the stack operates at its optimal operating temperature of 323–333 K. However, it is difficult to integrate the oversized tubes in a small power module. The cooling system is then modified so that the fan speed is adjustable based on the temperature difference between the inlet and outlet temperature of the stack. The number of measurement components can be reduced from 14 to 7 to save place, as shown in Figure 3c. The number of experimental components in the testing facility and compact design is shown in Table 1. The number of components almost decreases 50% in each system.
2.5. The Performance Comparison between the Testing Facility and the New Compact Design
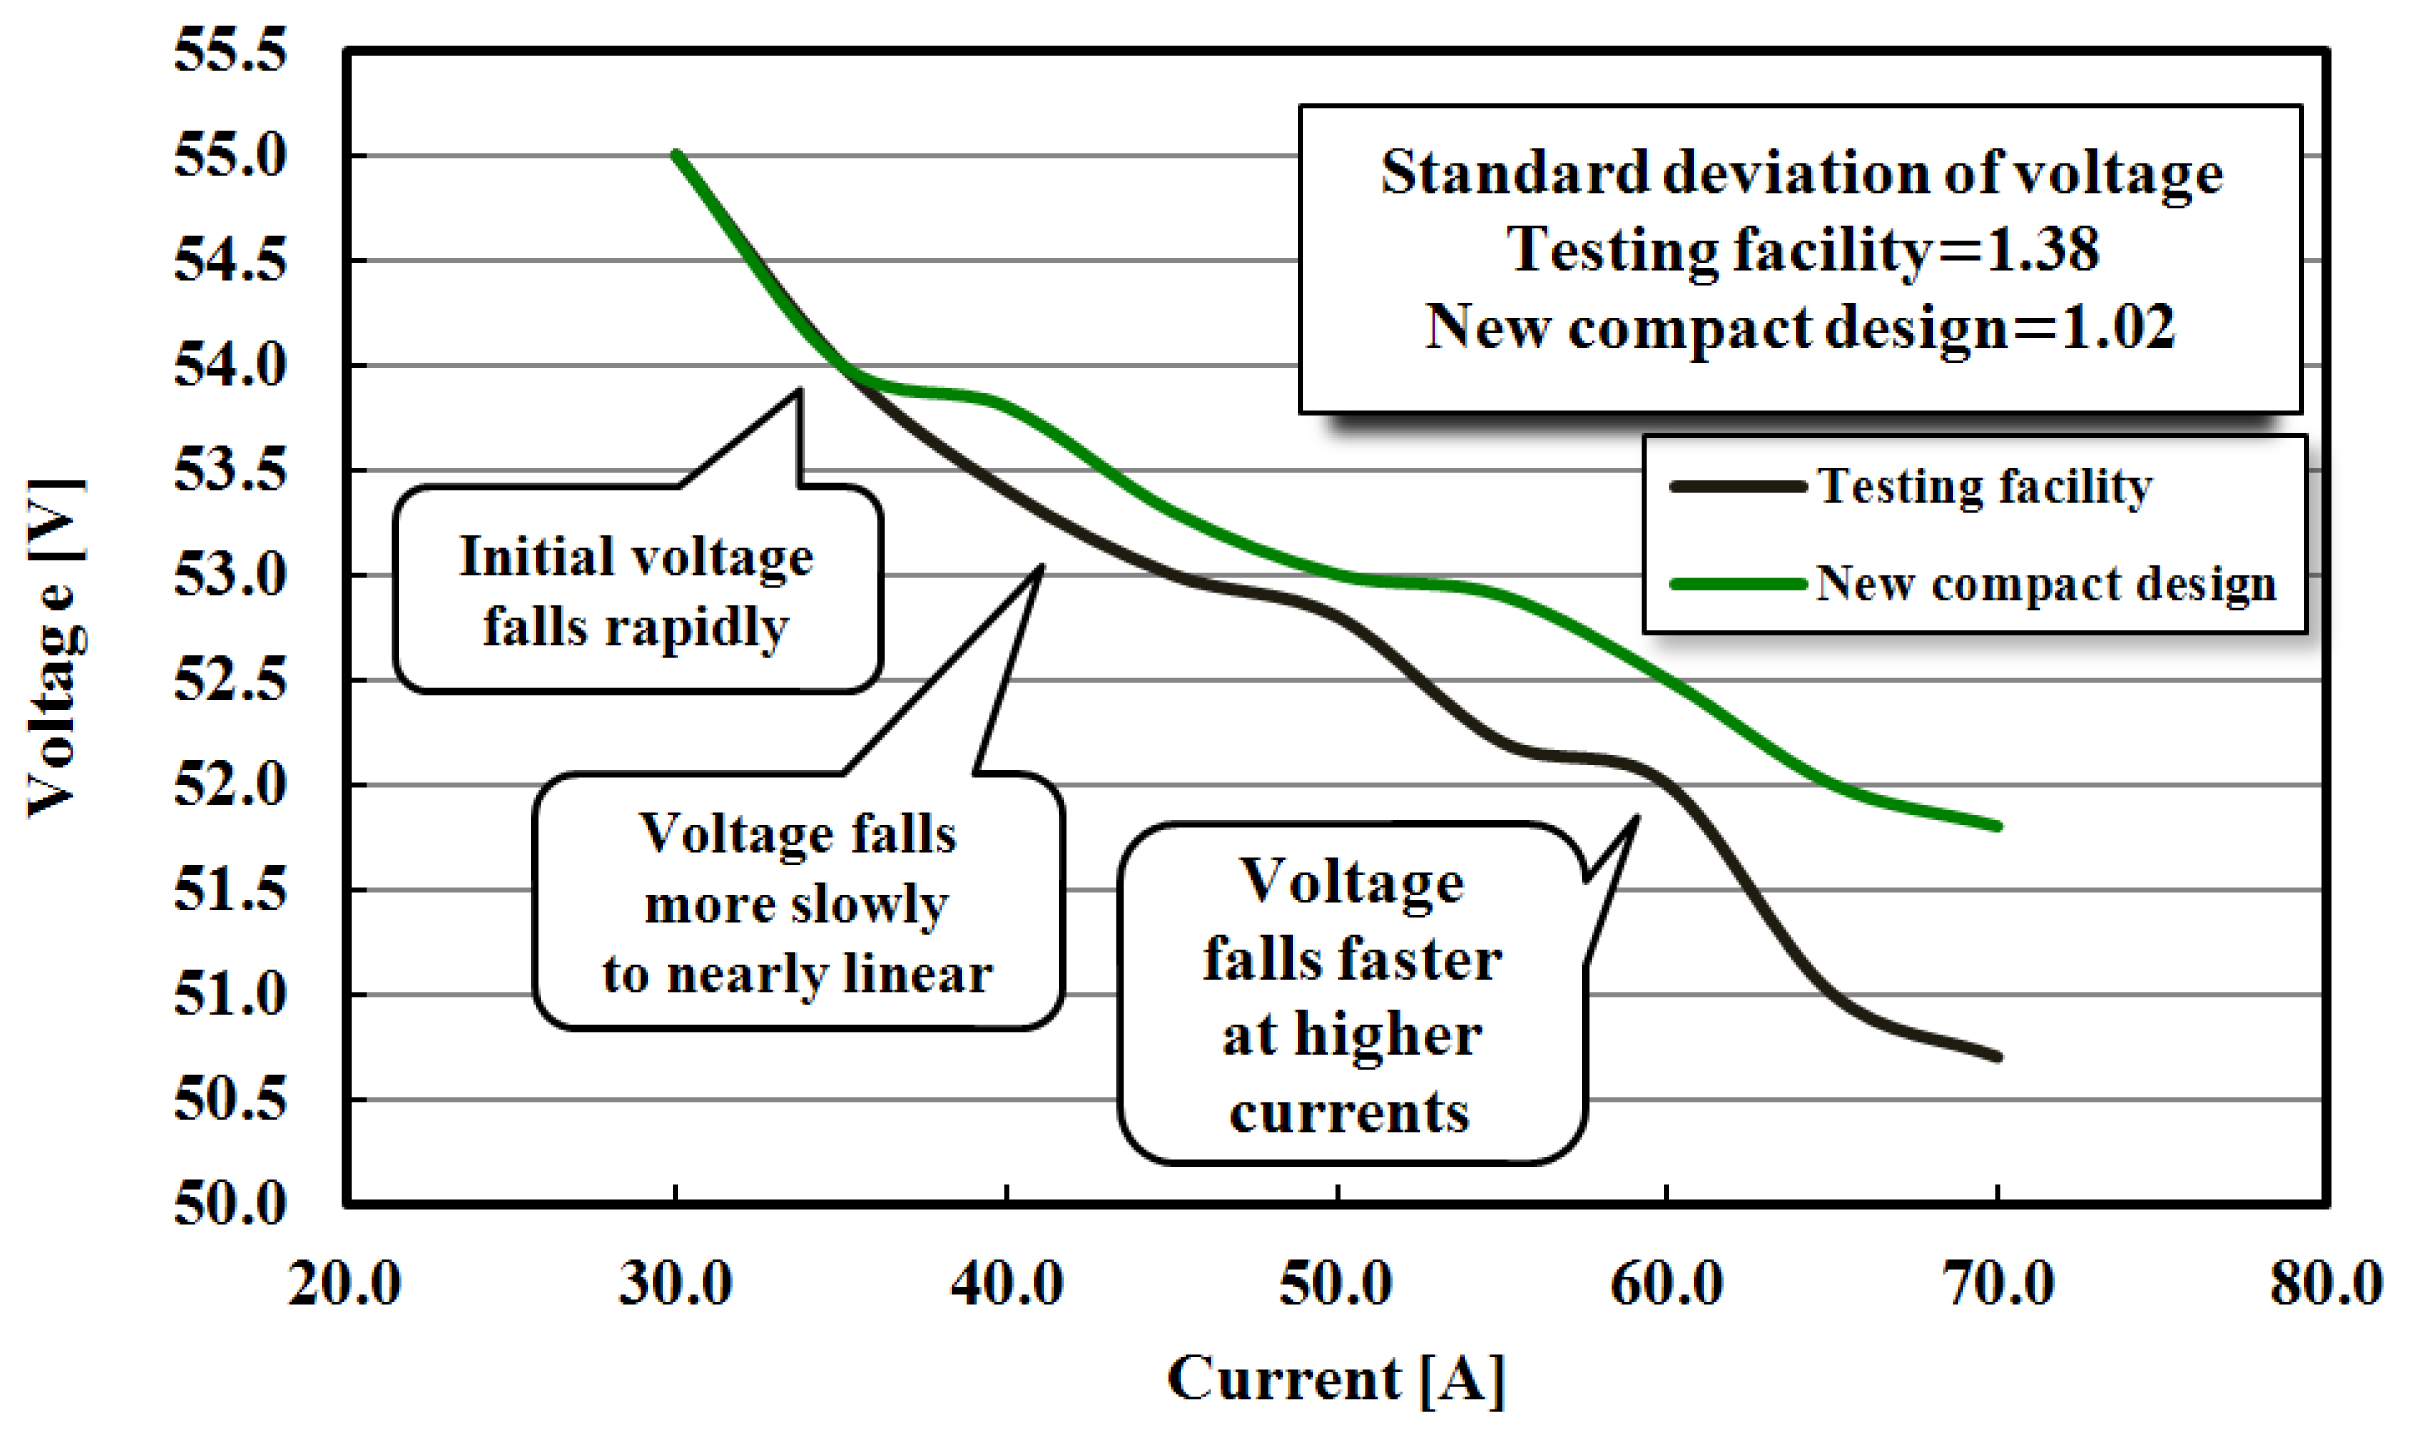
The performance comparison between testing facility and compact design and the standard deviation of voltage are shown in Figure 4.
These data are measured directly in the National Taiwan University (NTU) laboratory. The output voltage of compact design is higher than testing facility after loading 30 A. In the other words, the performance of new compact design is better than testing facility. The characters about the cell voltage against current density are also shown in Figure 4. Fast kinetics is related to the positive slope. The slope of the curves is not very smooth. Because the system's pipelines (nearly 1.8 m) are too long in begging, the heat dissipation was still not very good, this problem cause the performance be a little unsteady. Our teams improved this problem with steady water cooling and shortened pipelines (nearly 1.3 m). The final results are shown in Figures 5 and 6. However, these two curves still follow the basic trend of the fuel cell's I-V curve [19], this result prove the design is available. After recognizing the performance and stability of stack, the system is redesigned to fit in the limited space.
2.6. The Calculation of Stack Efficiency and Hydrogen Utilization Rate
Hydrogen is supplied from the high pressure cylinder to the stack; the practical stack efficiency, η, for a single stack at T = 291.15 K is defined as and is shown in Equation (1) [19]:
The hydrogen utilization coefficient, μf, is defined in Equation (2):
3. Results and Discussion
3.1. A Compact Design of the 5 kW Fuel Cell Stack
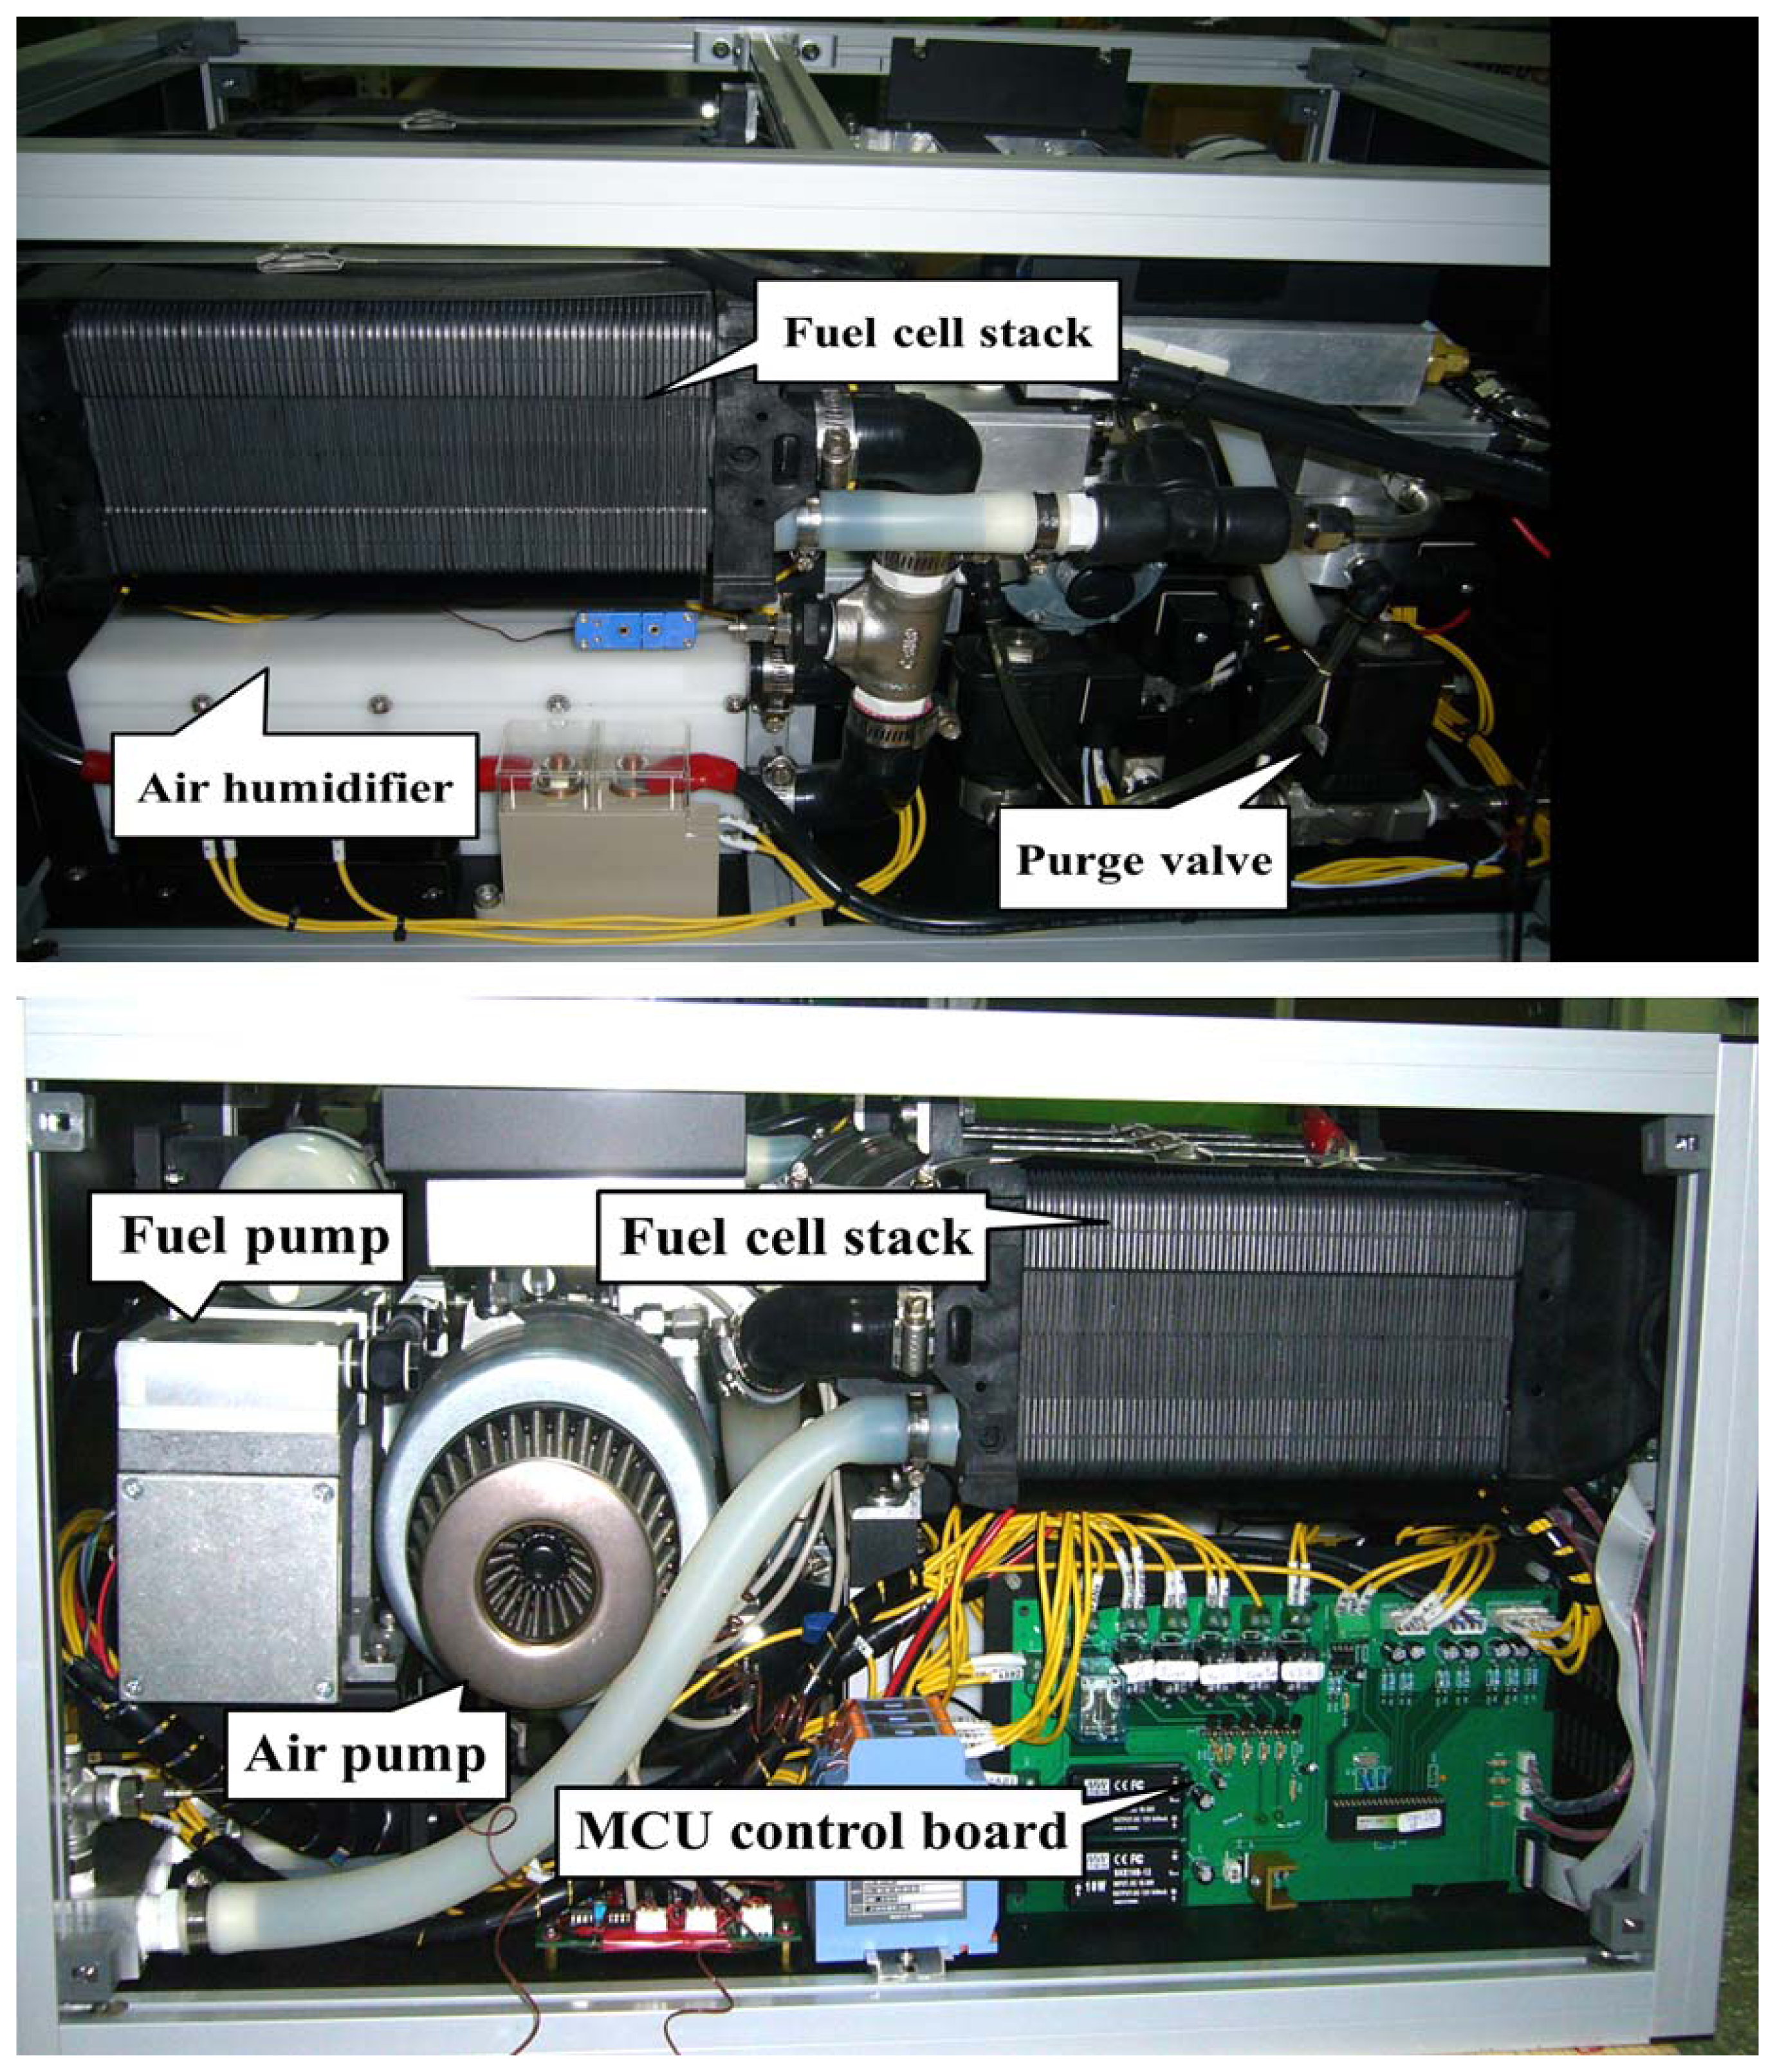
Figure 7 shows the final setup of the fuel supply, oxidant supply, and water cooling systems. The maximum power output of the final design is approximately 5.30 kW, and the size of the power module is 0.40 m × 0.50 m × 0.80 m iron trunk, with a total weight of 55.00 kg.
3.2. Two Stacks in Electrical Parallel and Electrical Cascade Configuration with Diodes
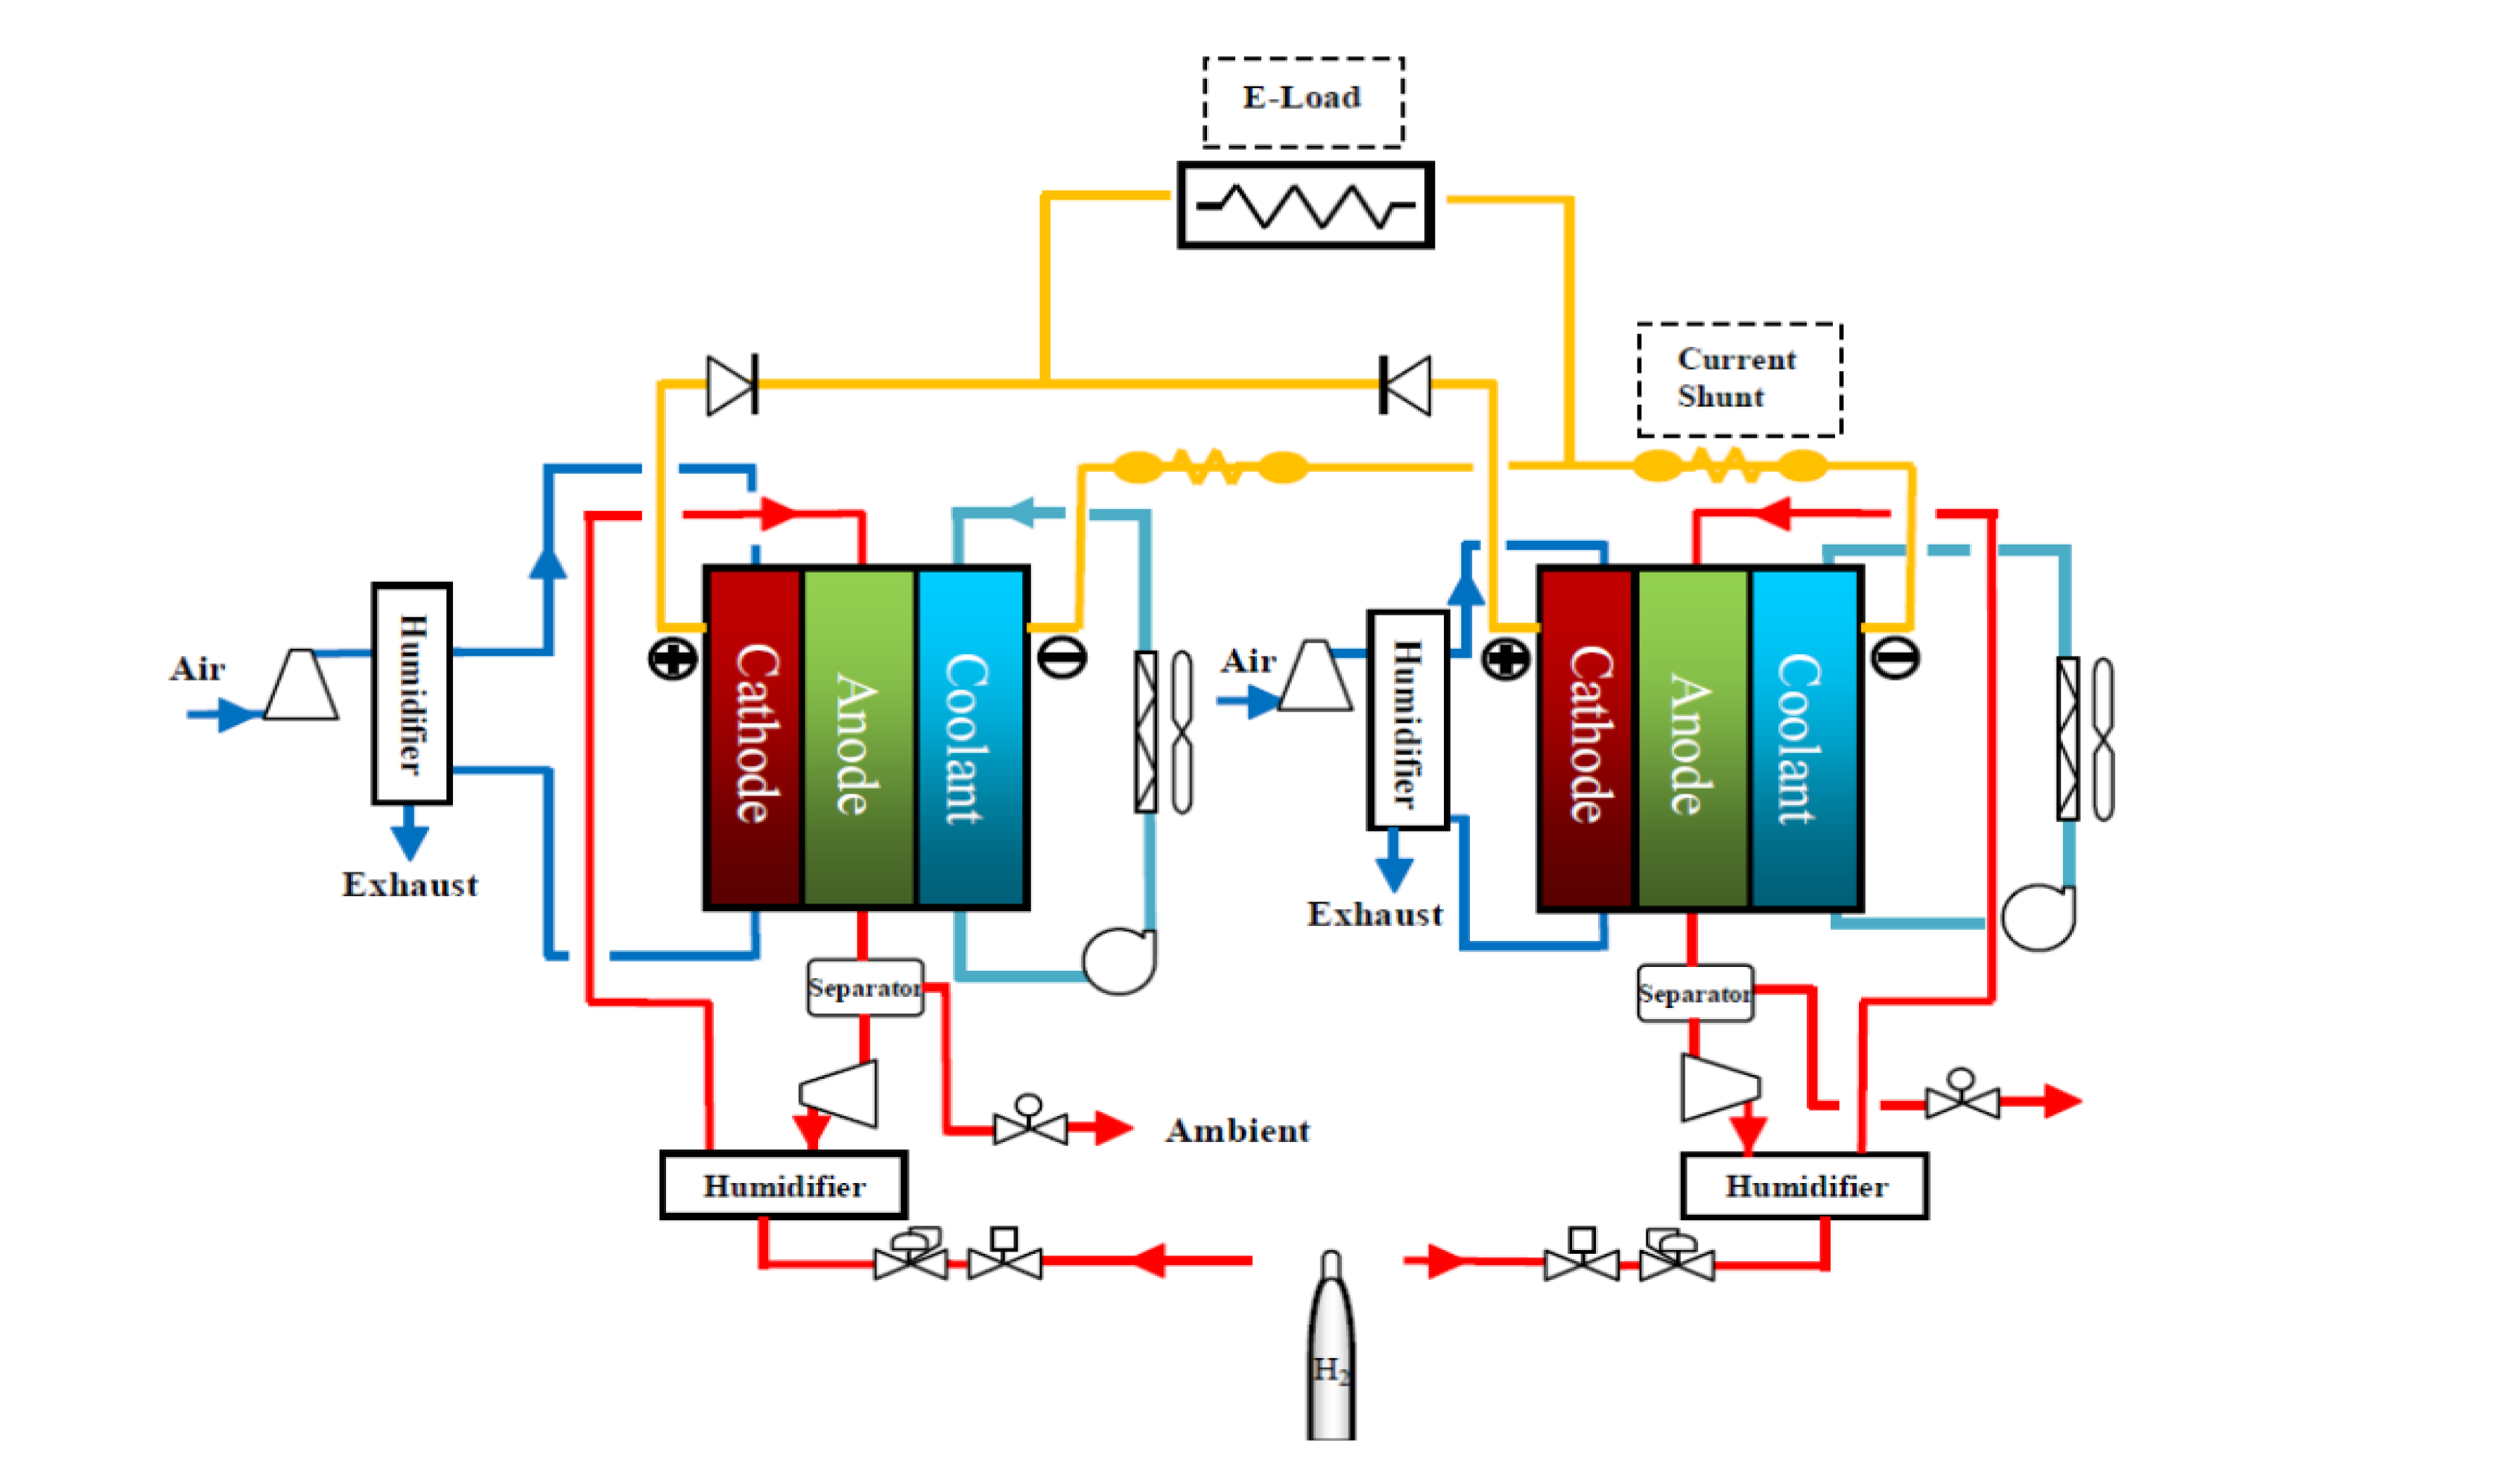
In this study, the constant load voltage (CV) and constant load current (CC) modes are chosen when the two stacks are arranged in electrical parallel and cascade configurations. Figure 8 shows the schematic of the electrical parallel configuration of the stacks. In this configuration, the anodes of the two stacks are connected by diodes to the negative pole of the electronic load, and the cathodes of the stacks are connected to the positive pole of the electronic load to form the electrical parallel configuration.
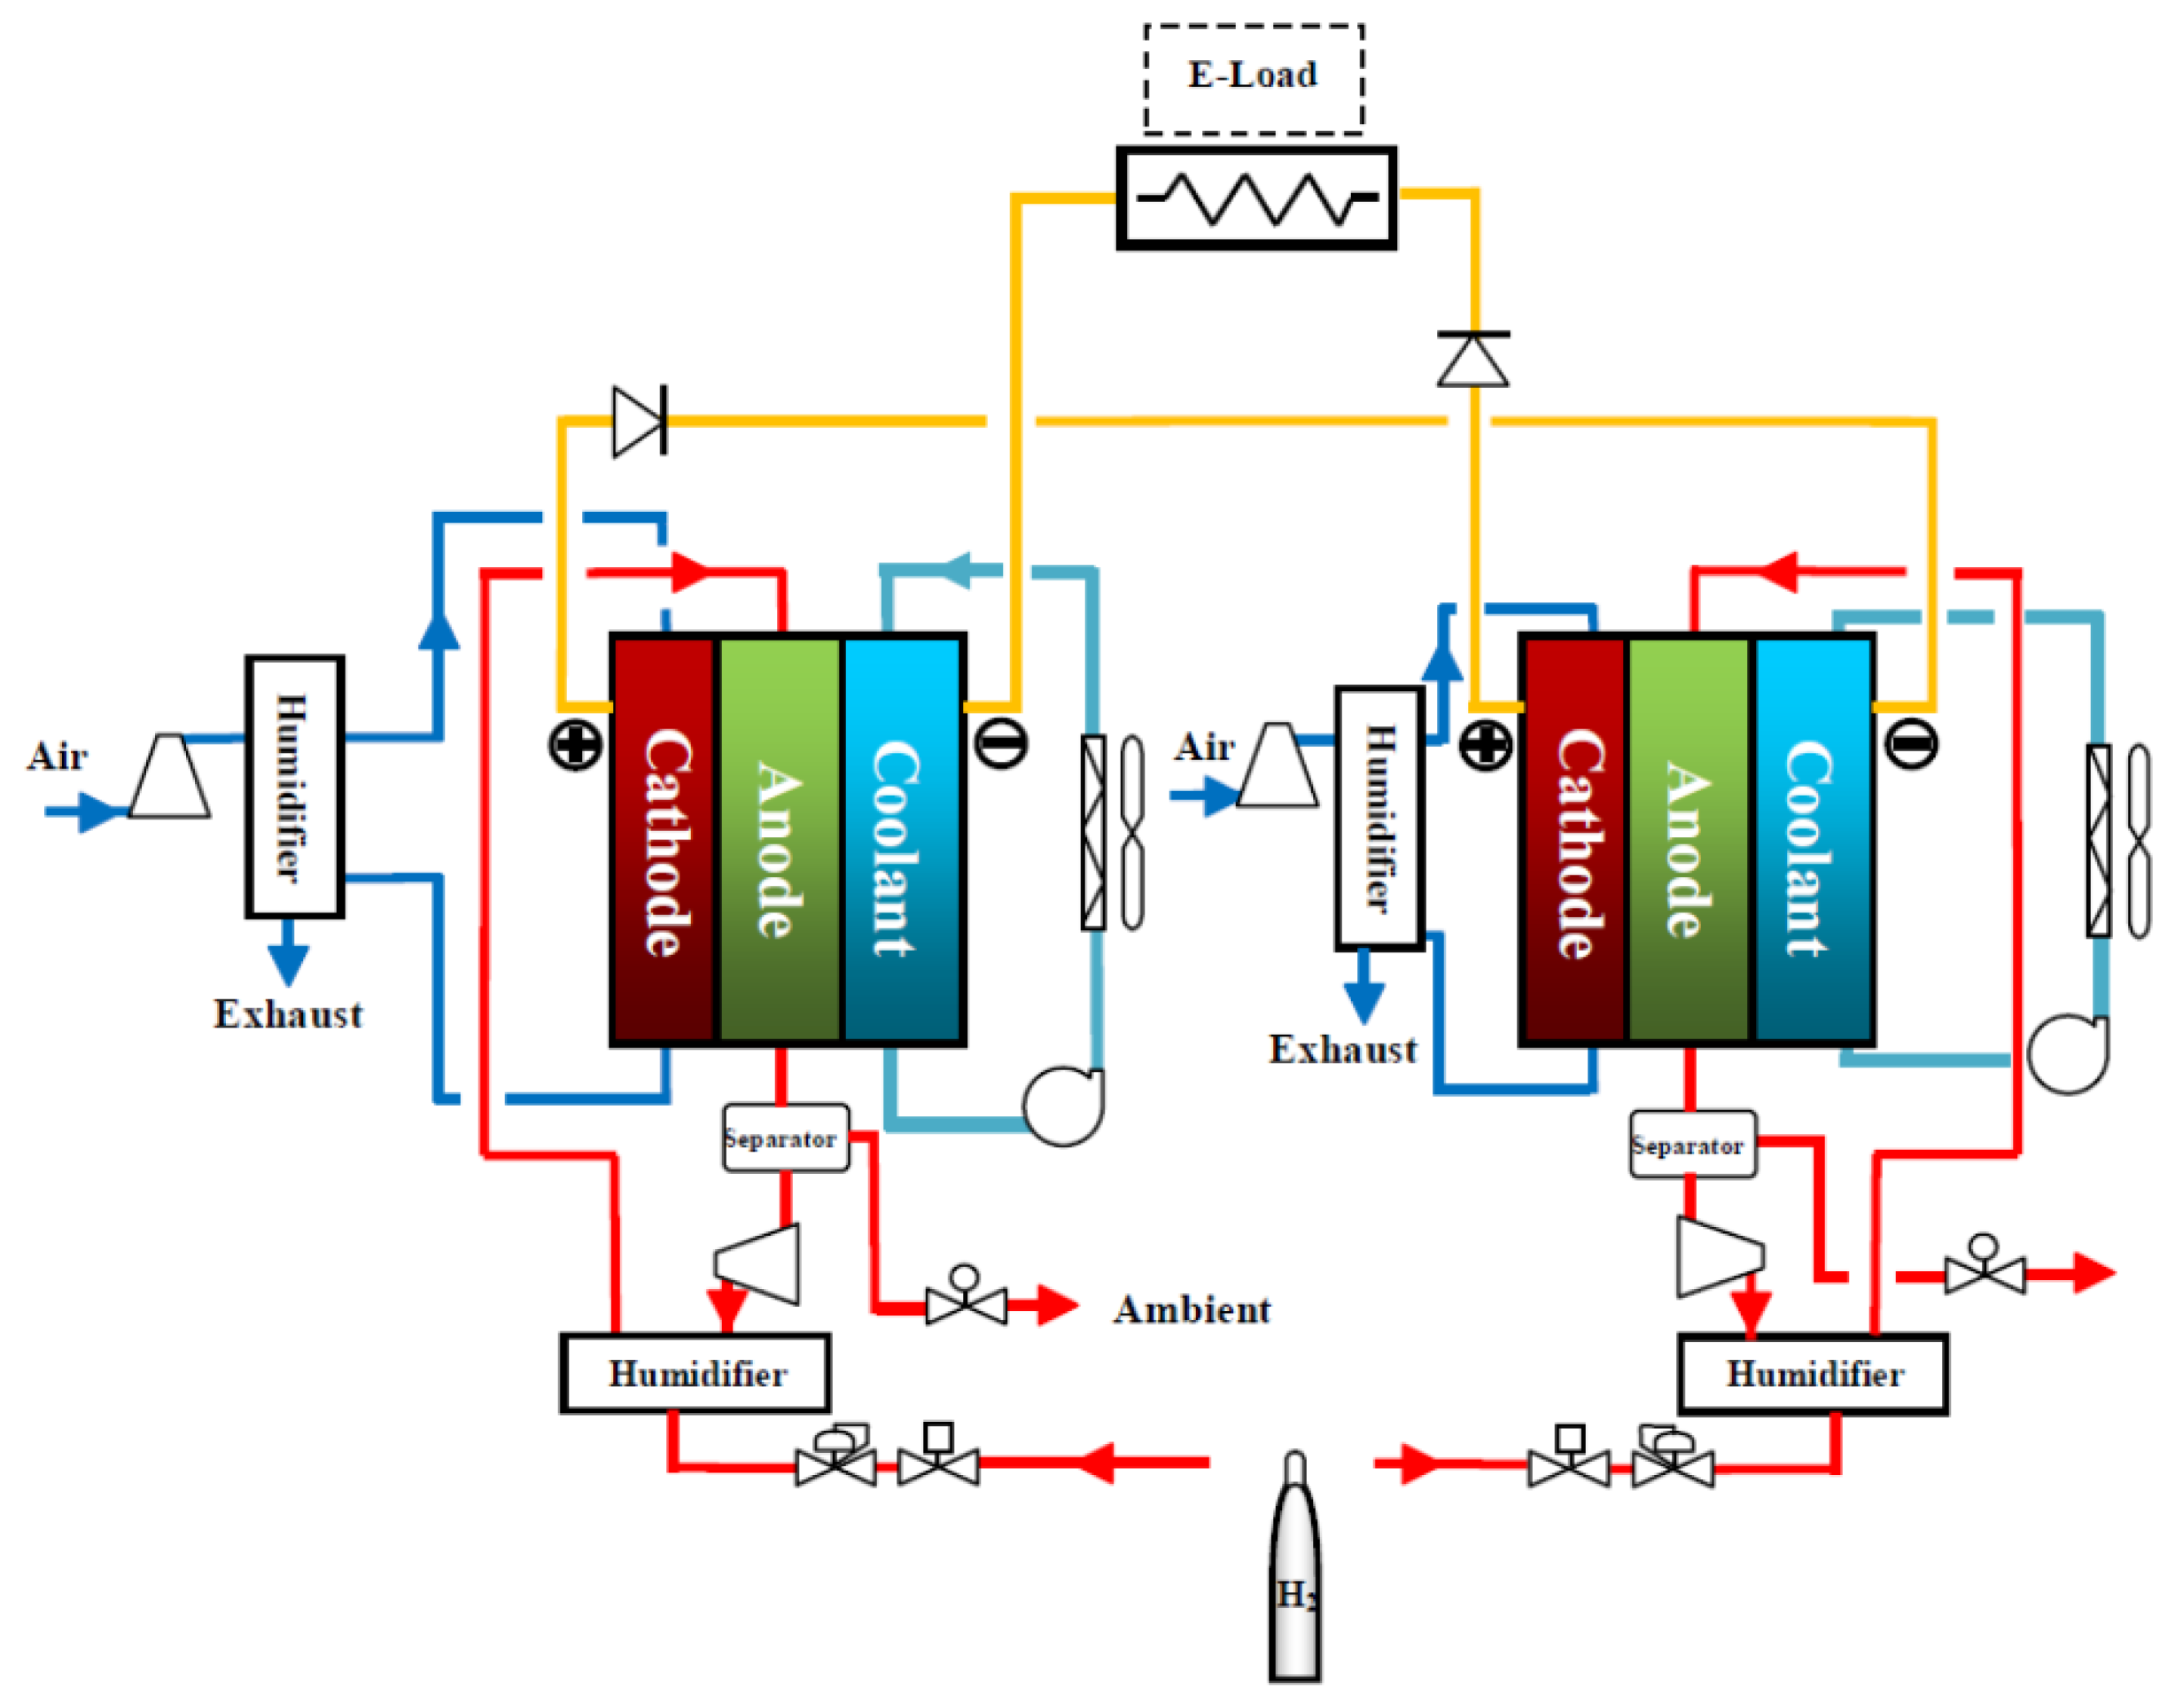
Figure 9 shows the schematic of the electrical cascade configuration of the stacks. A DC electronic load is used to simulate the electronic loading of the voltage and current; the electronic load can be set under modes of CV and CC. In the electrical parallel configuration, a constant voltage mode was chosen, and the I-V curve was obtained by decreasing the load voltage from 60 V to 50 V by 2 V/5 min. In the electrical cascade configuration, a constant current mode was chosen, and the I-V curve was obtained by increasing the load current from 20 A to 90 A by 10 A/5 min.
3.3. The Performance of the Stacks in the Electrical Parallel Configuration
3.3.1. Constant Voltage Loading
To obtain the optimal total power output, for this test, the CV starts at 60 V and gradually decreases by 2 V/5 min. The forward voltage drop of the diode is approximately 1.38 V.
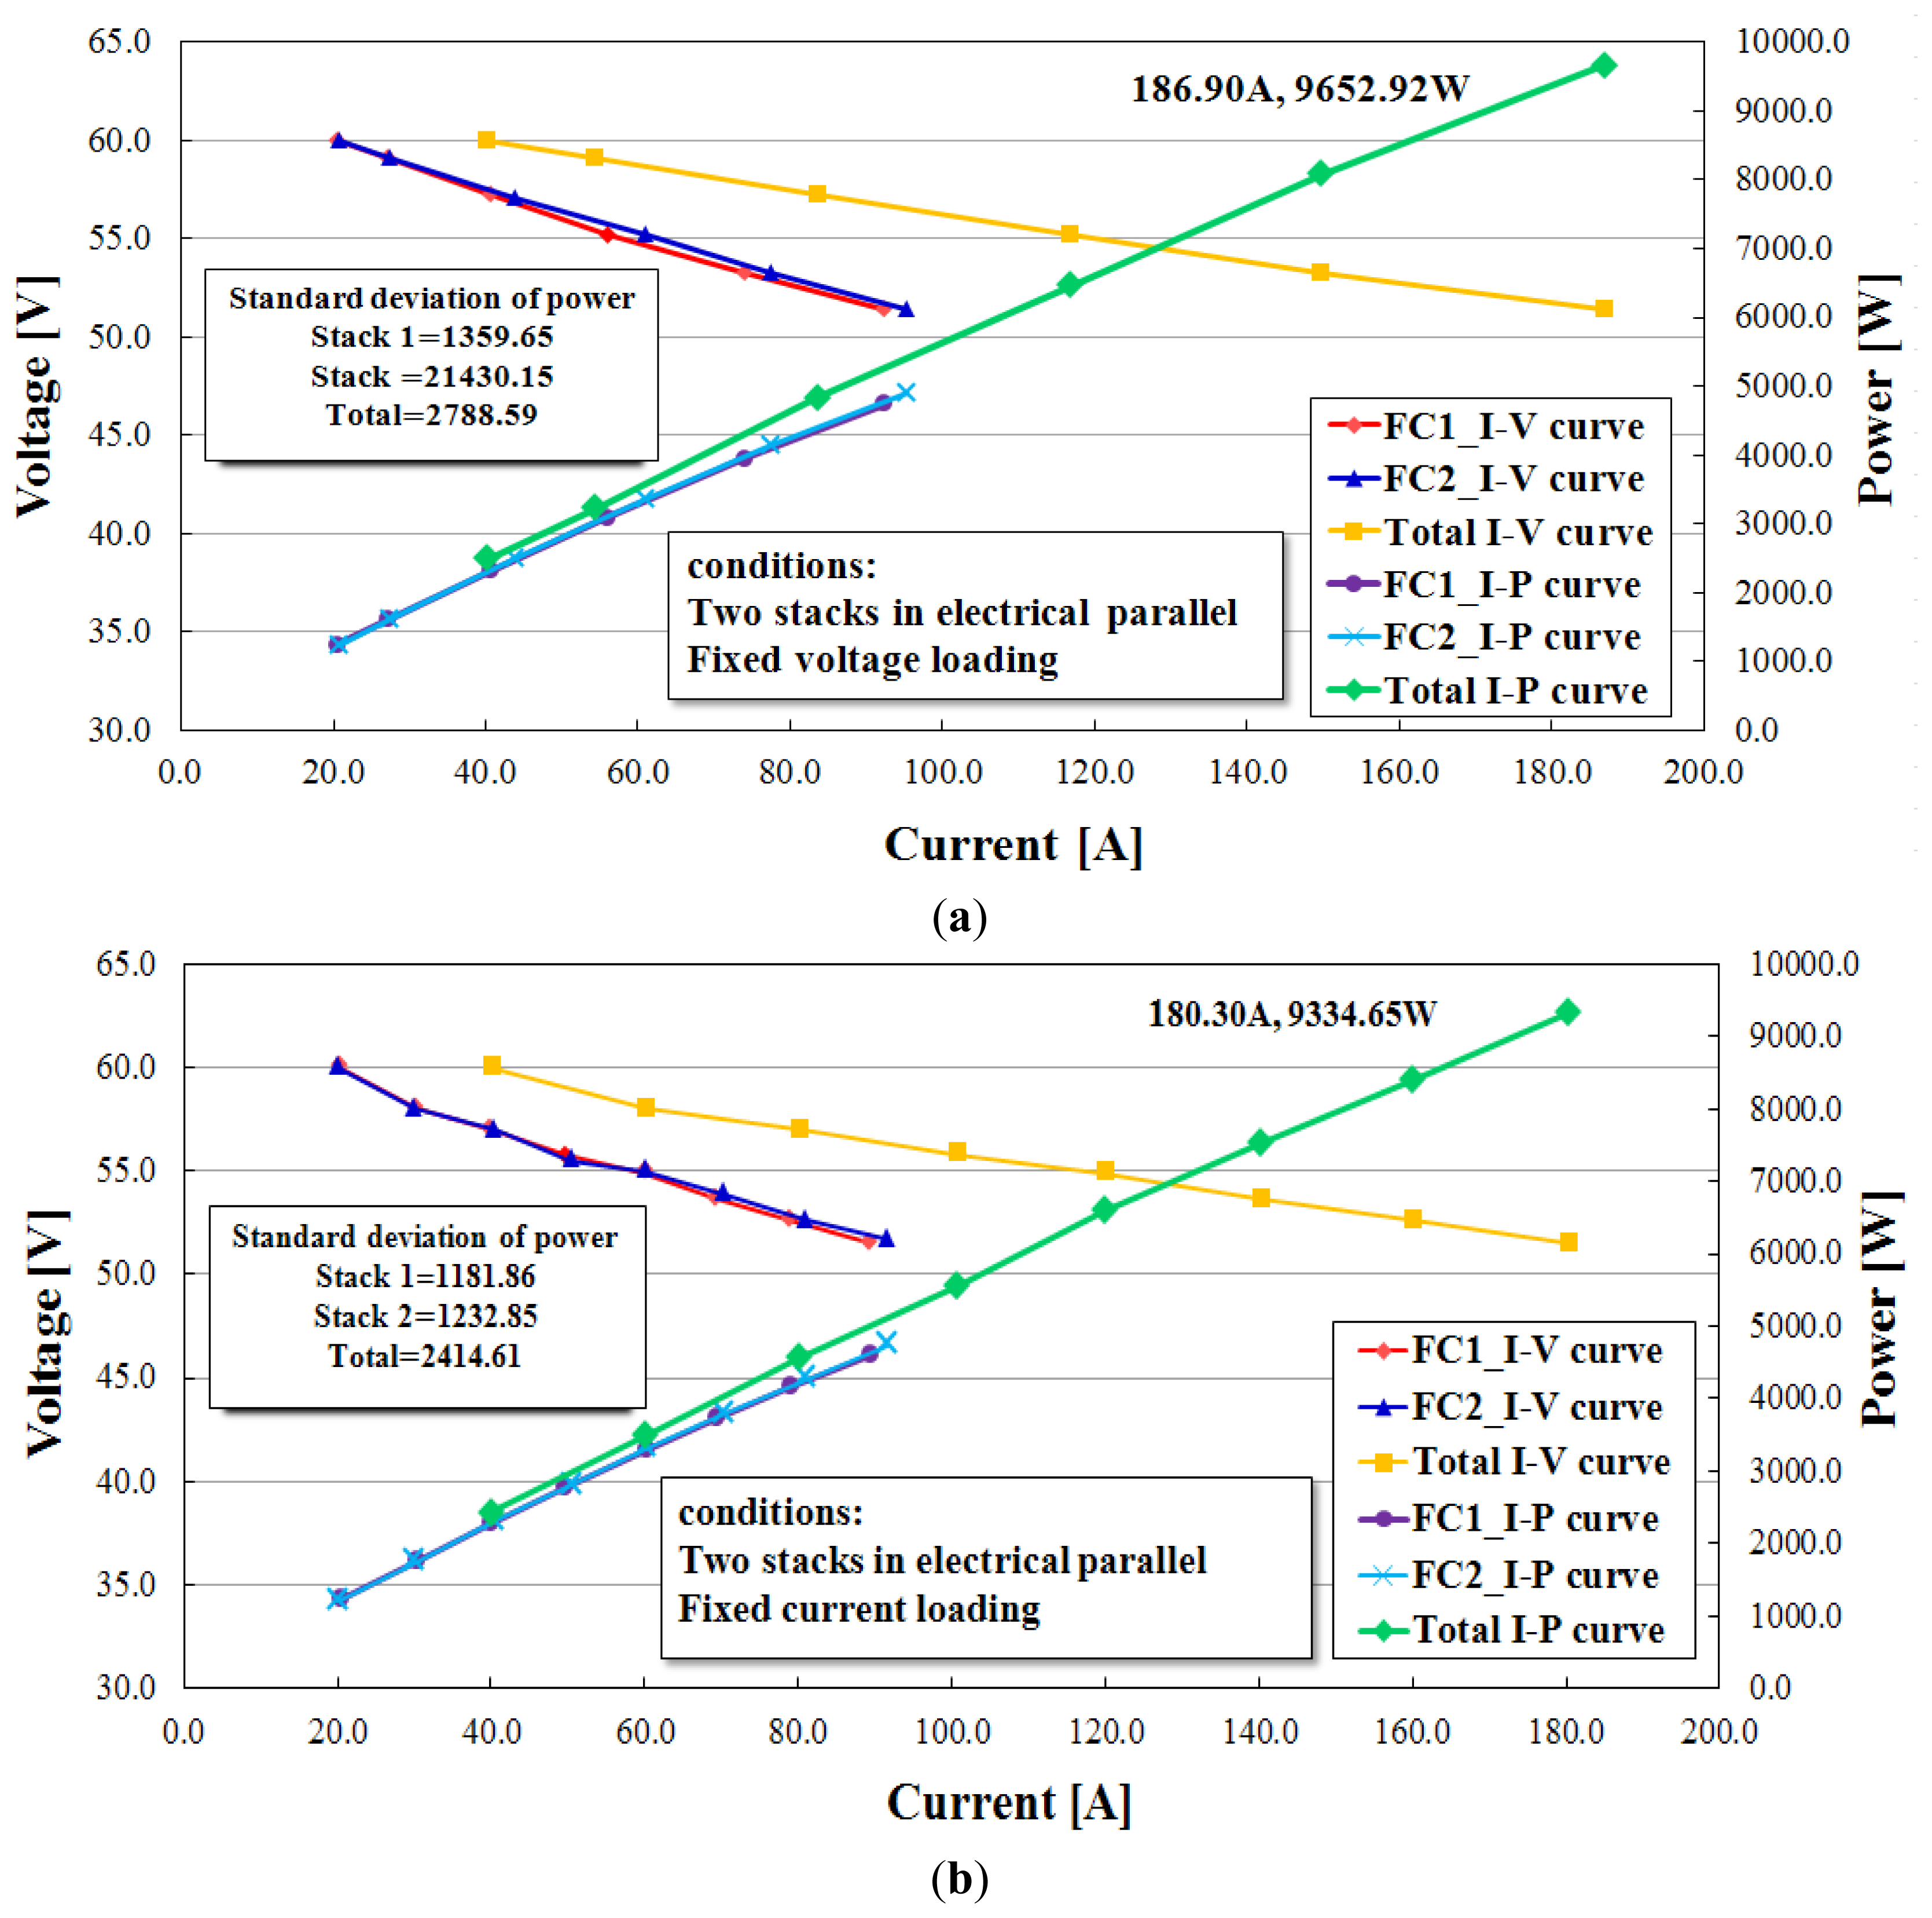
At a voltage of 55 V, the current of Fuel Cell Stack 2 (FC2) is 3–4 A higher than that of Fuel Cell Stack 1 (FC1), as shown in Figure 5a. The gray arrows show the negative slopes are I-V curve and the positive slope are I-P curves. It indicates that the power of FC2 is approximately 200 W higher than that of FC1. At a voltage of 51.4 V, the maximum power output is 4749.36 W and 4903.56 W for FC1 and FC2, respectively. When the power consumption of the two diodes is considered, the total power output is 9652.92 W, while the net power output is approximately 9395.00 W.
3.3.2. Constant Current Loading
For this test, the CC starts at 40 A and gradually increases by 20 A/5 min. At a load current of 160 A, the current of FC2 is 2 A higher than that of FC1, which indicates that the power of FC2 is approximately 100 W higher than that of FC1, as shown in Figure 5b. At a voltage of 51.5 V, the maximum power output is 4604.10 W and 4730.55 W for FC1 and FC2, respectively. The total power output is 9334.65 W. Considering the power consumption of the two diodes, the net power output is approximately 9085.84 W. The standard deviation of power is also shown in Figure 5.
3.4. The Performance of the Stacks in the Electrical Cascade Configuration
3.4.1. Constant Current Loading
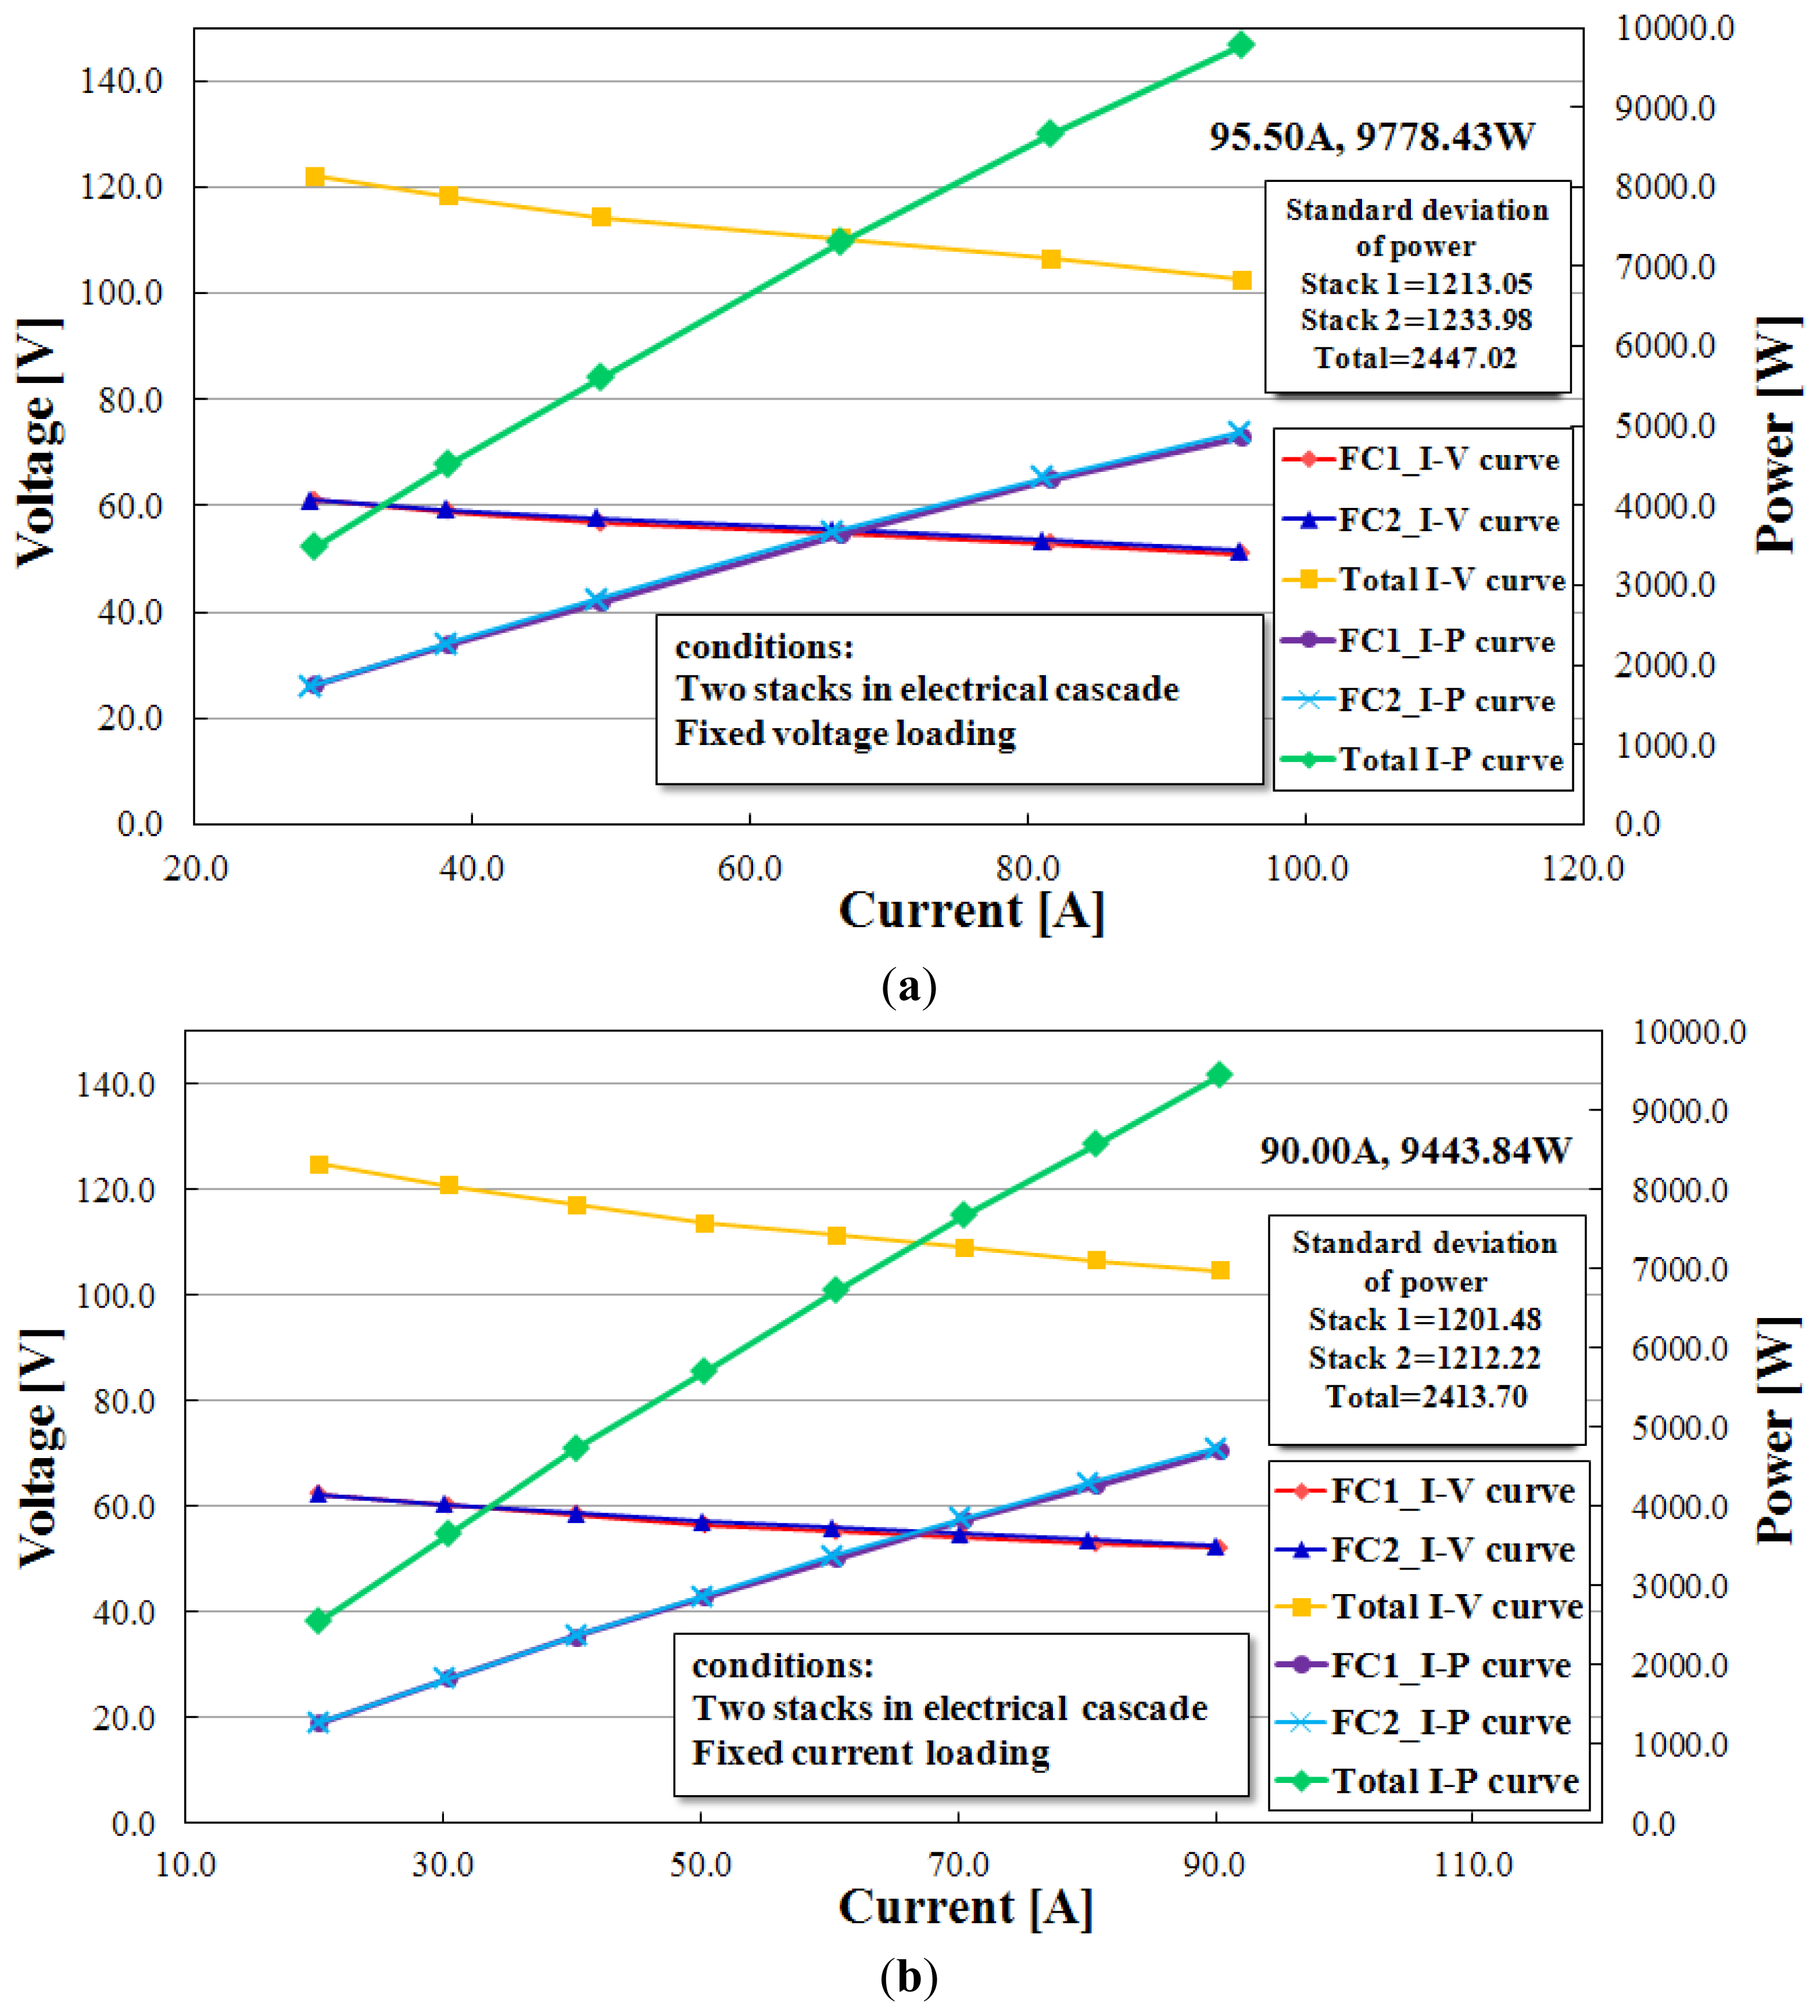
For this test, the CC starts at 20 A and gradually increases by 10 A/5 min. Figure 6a shows that the I-V curves of FC1 and FC2 are nearly overlapping, therefore, the power outputs are roughly the same in the electrical cascade configuration. The gray arrows show the negative slopes are I-V curve and the positive slopes are I-P curves. At a current of 90 A, the maximum power output is 4709.84 W and 4734.00 W for FC1 and FC2, respectively. Considering the power consumption of the two diodes, the total power output is 9443.84 W, while the net power output is approximately 9194.89 W.
3.4.2. Constant Voltage Loading
For this test, the CV starts at 120 V and gradually decreases by 4 V/5 min. Figure 6b shows that the I-V curves of FC1 and FC2 are nearly identical. At a current of 95.3 A, the maximum power output is 4860.95 W and 4917.48 W for FC1 and FC2, respectively. Considering the power consumption of the two diodes, the total power output is 9778.43 W, while the net power output is approximately 9515.13 W. The standard deviation of power is also shown in Figure 6.
3.5. The Output Voltage and Performance of a Stack with/without Hydrogen Recycling
In the fuel supply system, pressured hydrogen is supplied to the stack through a regulator. Before the purge valve is opened, the unreacted hydrogen is recycled back to the stack by the gas pump in hydrogen recycling mode. After the purge valve is opened, the reacted product will be purged to the atmosphere. Simultaneously, the high pressure pure hydrogen is supplied to the stack to be recycled again. The purged rate is 8 × 10⁻⁴ m3/s and the hydrogen recycle rate is 5.26 × 10⁻⁴ m3/s.
3.5.1. Without Hydrogen Recycling
The output voltage decays about 1.04 V within a purge period of 30 s, and the stack efficiency is about 39.46%, as shown in Figure 10a. However, shortening the purge period to 15 s can achieve better voltage stability. Figure 10a,c shows that the consumption times for Case A and Case C are 7′36″ and 6′53″, respectively. Therefore, the output voltage is obtained in an unsteady situation without hydrogen recycling.
3.5.2. With Hydrogen Recycling
Case B shows that there is nearly no voltage decay in a purge period of 30 s with H2 recycling, as shown in Figure 10b. In Case B, the average output voltage is 50.95 V, and the stack efficiency is 39.68%. There is no need to purge H2 out to the atmosphere so frequently with the recycling mechanism. Case D shows a longer purge period of 2 min with a minimal voltage decay of 0.2 V, as shown in Figure 10d, and the average output voltage is 50.42 V, with an efficiency of 43.46%.
With the hydrogen recycling system, the hydrogen concentration inside the stack is more stable, and the voltage decay is smaller, which leads to a stable output voltage. In other words, the hydrogen utility rate is increased by extending the purge cycle for a longer residence time.
4. Conclusions
In this study, fuel, oxidant supply and cooling systems with MCU are developed in a compact design to fit two 5 kW PEMFC stacks. For the two same 5 kW type units, the diodes are suitable to be used for the electrical connection to avoid back current in a simple protective mechanism. The major findings are as follows:
- (1)
The stability of the output voltage can be improved by applying a hydrogen recycling mechanism, and the fuel utilization rate of the 5 kW stack can be increased by extending the hydrogen purge period for a longer residence time.
- (2)
The maximum efficiency of the 5 kW stack system is approximately 43.46% (51.36% in lower heating value (LHV)) under a purge period of 2 min with hydrogen recycling, and the hydrogen utilization rate, μf, is approximately 66.31%. The regular PEMFC's efficiency is from 43% to 58% (LHV) [20], the waste heat recovery will be applied in the future for higher efficiency.
- (3)
The electrical coupling of multiple stacks can be implemented when the power outputs of the stacks are properly dimensioned. To achieve a 10 kW, 100 V power module, two similar 5 kW stack can be directly coupled with diodes in a simple and efficient way.
- (4)
The maximum power output is 9.40 kW in the electrical parallel configuration and 9.52 kW in the electrical cascade configuration.
Acknowledgments
This research was funded by the Chung Shan Institute of Science and Technology (XV00C42P and CSIST-808-V106).
Conflicts of Interest
The authors declare no conflict of interest.
References
- Bao, C.; Ouyang, M.; Yi, B. Modeling and control of air stream and hydrogen flow with recirculation in a PEM fuel cell system—I. Control-oriented modeling. Int. J. Hydr. Energy 2006, 31, 1879–1896. [Google Scholar]
- Bao, C.; Ouyang, M.; Yi, B. Modeling and control of air stream and hydrogen flow with recirculation in a PEM fuel cell system—II. Control-oriented modeling. Int. J. Hydr. Energy 2006, 31, 1897–1913. [Google Scholar]
- He, J.-L.; Ahn, J.-W.; Choe, S.-Y. Analysis and control of a fuel delivery system considering a two-phase anode model of the polymer electrolyte membrane fuel cell stack. J. Power Sources 2011, 196, 4655–4670. [Google Scholar]
- Meiler, M.; Andre, D.; Schmid, O.; Hofer, E.P. Nonlinear empirical model of gas humidity-related voltage dynamics of a polymer-electrolyte-membrane fuel cell stack. J. Power Sources 2009, 190, 56–63. [Google Scholar]
- Blanco, M.; Wilkinson, D.-P.; Wang, H.-J. Application of water barrier layers in a proton exchange membrane fuel cell for improved water management at low humidity conditions. J. Hydr. Energy 2011, 36, 3635–3648. [Google Scholar]
- Li, X.; Deng, Z.-H.; Wei, D.; Xu, C.-S.; Cao, G.-Y. Novel variable structure control for the temperature of PEM fuel cell stack based on the dynamic thermal affine model. Energy Convers. Manag. 2011, 52, 3265–3274. [Google Scholar]
- Ahn, J.-W.; Choe, S.-Y. Coolant controls of a PEM fuel cell system. J. Power Sources 2008, 179, 252–264. [Google Scholar]
- Yu, X.-C.; Zhou, B.; Sobiesiak, A. Water and thermal management for Ballard PEM fuel cell stack. J. Power Sources 2005, 147, 184–195. [Google Scholar]
- Tang, Y.; Yuan, W.; Pan, M.; Li, Z.; Chen, G.; Li, Y. Experimental investigation of dynamic performance and transient responses of a kW-class PEM fuel cell stack under various load changes. Appl. Energy 2010, 87, 1410–1417. [Google Scholar]
- Candusso, D.; Harel, F.; De Bernardinis, A.; François, X.; Péra, M.C.; Hissel, D.; Schott, P.; Coquery, G.; Kauffmann, J.-M. Characterisation and modelling of a 5 kW PEMFC for transportation applications. Int. J. Hydr. Energy 2006, 31, 1019–1030. [Google Scholar]
- Bernardinis, A.-D.; Péra, M.-C.; Garnier, J.; Hissel, D.; Coquery, G.; Kauffmann, J.-M. Fuel cells multi-stack power architectures and experimental validation of 1 kW parallel twin stack PEFC generator based on high frequency magnetic coupling dedicated to on board power unit. Energy Convers. Manag. 2008, 49, 2367–2383. [Google Scholar]
- Candusso, D.; Bernardinis, A.-D.; Péra, M.-C.; Harel, F.; François, X.; Hissel, D.; Coquery, G.; Kauffmann, J.-M. Fuel cell operation under degraded working modes and study of diode by-pass circuit dedicated to multi-stack association. Energy Convers. Manag. 2008, 49, 880–895. [Google Scholar]
- Ma, H.-K.; Wang, J.-S.; Chang, Y.-T. Development of a novel pseudo bipolar piezoelectric proton exchange membrane fuel cell with nozzle and diffuser. J. Power Sources 2011, 196, 3766–3772. [Google Scholar]
- Ma, H.-K.; Wang, J.-S.; Su, W.-H.; Cheng, W.-Y. The performance of a novel pseudo-bipolar bi-cell piezoelectric proton exchange membrane fuel cell with a smaller nozzle and diffuser. J. Power Sources 2011, 196, 7564–7571. [Google Scholar]
- Ma, H.-K.; Cheng, H.-M.; Cheng, W.-Y.; Luo, W.-F. Development of a piezoelectric proton exchange membrane fuel cell stack (PZT-Stack). J. Power Sources 2013, 240, 314–322. [Google Scholar]
- Shahin, A.; Huang, B.; Martin, J.-P. New non-linear control strategy for non-isolated DC/DC converter with high voltage ratio. Energy Convers. Manag. 2010, 51, 56–63. [Google Scholar]
- Andreasen, S.-J.; Ashworth, L.; Remón, I.-N.-M.; Kær, S.-K. Directly connected series coupled HTPEM fuel cell stacks to a Li-ion battery DC bus for a fuel cell electrical vehicle. Int. J. Hydrog. Energy 2008, 33, 7137–7145. [Google Scholar]
- Ballard FCgen-1310 Fuel Cell Stack, Product Manual and Integration Guide; Ballard Power Systems Inc.: Burnaby, BC, Canada, 2011.
- Larminie, J.; Dicks, A. Fuel Cell Systems Explained; John Wiley & Sons: West Sussex, UK, 2003. [Google Scholar]
- Huang, J.-J. Fuel Cell; Chuan Hwa Book Co., Ltd.: Tucheng District/Taichung City/Kaohsiung City, Taiwan, 2005. [Google Scholar]
Abbreviations
| Δh̄f | higher heating value |
| η | stack efficiency |
| μf | hydrogen utilization coefficient |
| Vc | open circuit voltage |


| Comparison | Testing facility | New compact design |
|---|---|---|
| Fuel supply system | Purge valve × 1; On-Off valve × 1; Regulator × 2;Pressure transmitter × 4; MFM × 3; Check valve × 2;Relieve valve × 1; Thermocouple × 2; Separator × 1; Recirculation pump × 1 | Purge valve × 1; Separator × 1; recirculation pump × 1; Pressure transmitter × 1; Regulator × 1; humidifier × 1; Thermocouple × 1 |
| Total components: 18 | Total components: 7 | |
| Oxidant supply system | Thermocouple × 2; Pressure transmitter × 3; DI filter × 1; MFM × 1; Relief valve × 1; Air filter × 1; Air pump × 1; Humidifier × 1 | Pressure transmitter × 1; Thermocouple × 1; Humidifier × 1; MFM × 1; Ball valve × 1; Air pump × 1 |
| Total components: 11 | Total components: 6 | |
| Water cooling system | Radiator × 1; Thermocouple × 3; MFM × 4; DI filter × 1; DI water tank × 1; Mixer × 1; Filter × 1; Pump × 1; Fan × 1 | Ball valve × 1; Pressure transmitter × 1; Thermocouple × 2; Water pump × 1; Radiator × 1; Fan × 1 |
| Total components: 14 | Total components: 7 | |
© 2014 by the authors; licensee MDPI, Basel, Switzerland. This article is an open access article distributed under the terms and conditions of the Creative Commons Attribution license ( http://creativecommons.org/licenses/by/3.0/).
Share and Cite
Ma, H.; Cheng, W.; Fang, F.; Hsu, C.; Lin, C. Compact Design of 10 kW Proton Exchange Membrane Fuel Cell Stack Systems with Microcontroller Units. Energies 2014, 7, 2498-2514. https://doi.org/10.3390/en7042498
Ma H, Cheng W, Fang F, Hsu C, Lin C. Compact Design of 10 kW Proton Exchange Membrane Fuel Cell Stack Systems with Microcontroller Units. Energies. 2014; 7(4):2498-2514. https://doi.org/10.3390/en7042498
Chicago/Turabian StyleMa, Hsiaokang, Weiyang Cheng, Fuming Fang, Chinbing Hsu, and Chengsheng Lin. 2014. "Compact Design of 10 kW Proton Exchange Membrane Fuel Cell Stack Systems with Microcontroller Units" Energies 7, no. 4: 2498-2514. https://doi.org/10.3390/en7042498