Optimum Peak Current Hysteresis Control for Energy Recovering Converter in CDI Desalination

 ,
,  ,
,  and
and
Abstract
: Capacitive De-Ionization (CDI) is becoming a suitable alternative for desalination. The low cost of the materials required and its reduced energy consumption can be critical factors for developing this technique. CDI technology does not require a high-pressure system and the energy storage capability of CDI cells allows it to be reused in other CDI cells, thus minimizing consumption. The goal of the power stage responsible of the energy recovery is transferring the stored energy from one cell to another with the maximum possible efficiency, thus allowing the desalination process to continue. Assuming hysteresis current control is implemented at the DC/DC (direct current) converter, this paper aims to determine the optimum peak current through the inductor in each switching period with a view to maximizing overall efficiency. The geometrical parameters of the desalination cell and the NaCl concentration modify the cell electrical properties. The peak current control of the power stage should be adapted to the cell characteristics so that the efficiency behavior of the whole CDI system can be improved. The mathematical model defined in this paper allows the CDI plant automation using the peak inductor current as control variable, adapting its value to the salt concentration during the desalination process.
1. Introduction
Water availability is not guaranteed for large regions of the world due to current issues such as population increase, pollution or global warming. Desalination of sea water could be a possible solution to this problem, but it is not widely used yet because of the high power consumption required to make water drinkable. Cost-effective and efficient methods are demanded due to the rising cost of energy. There are already several processes being used in this field such as reverse osmosis, distillation or electrodialysis. Reverse osmosis is a widely-used process for large water production; it involves energy consumption around 4 kWh/m3 [1,2]. Other technologies involve high diesel consumption with higher energy requirements and CO2 emissions. However, Capacitive De-Ionization (CDI) presents an important potential of development compared to other technologies. Furthermore, CDI has lower energy requirements and membranes can be avoided. It is estimated that the energy required when using CDI + energy recovery control systems can be reduced up to one fourth that required by reverse osmosis [3,4]. The aim of this work is to take advantage of the energy stored in the desalination modules and to re-use it with high efficiency by means of a buck-boost converter.
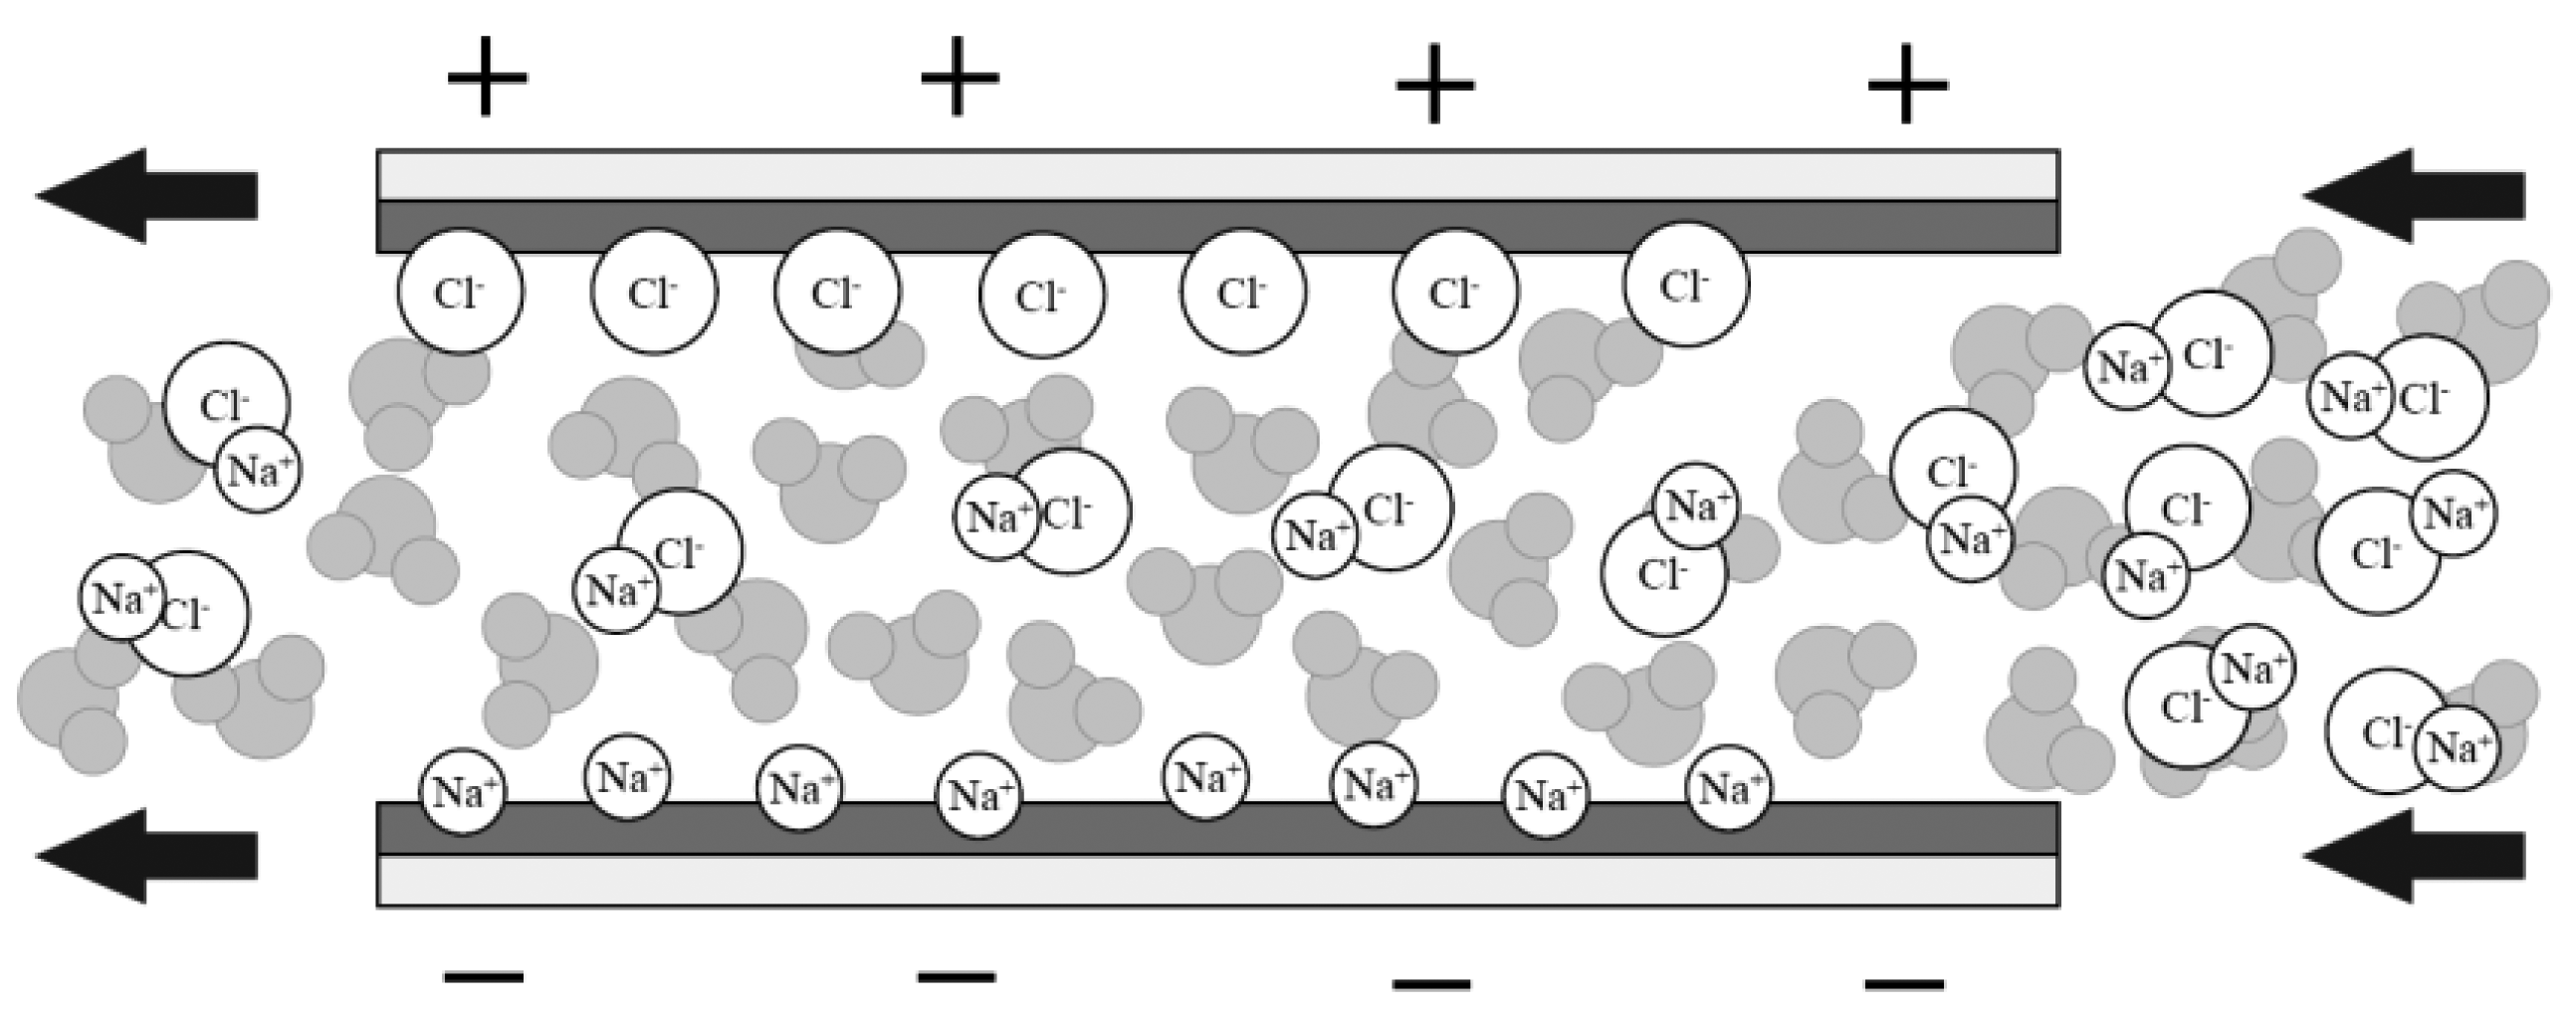
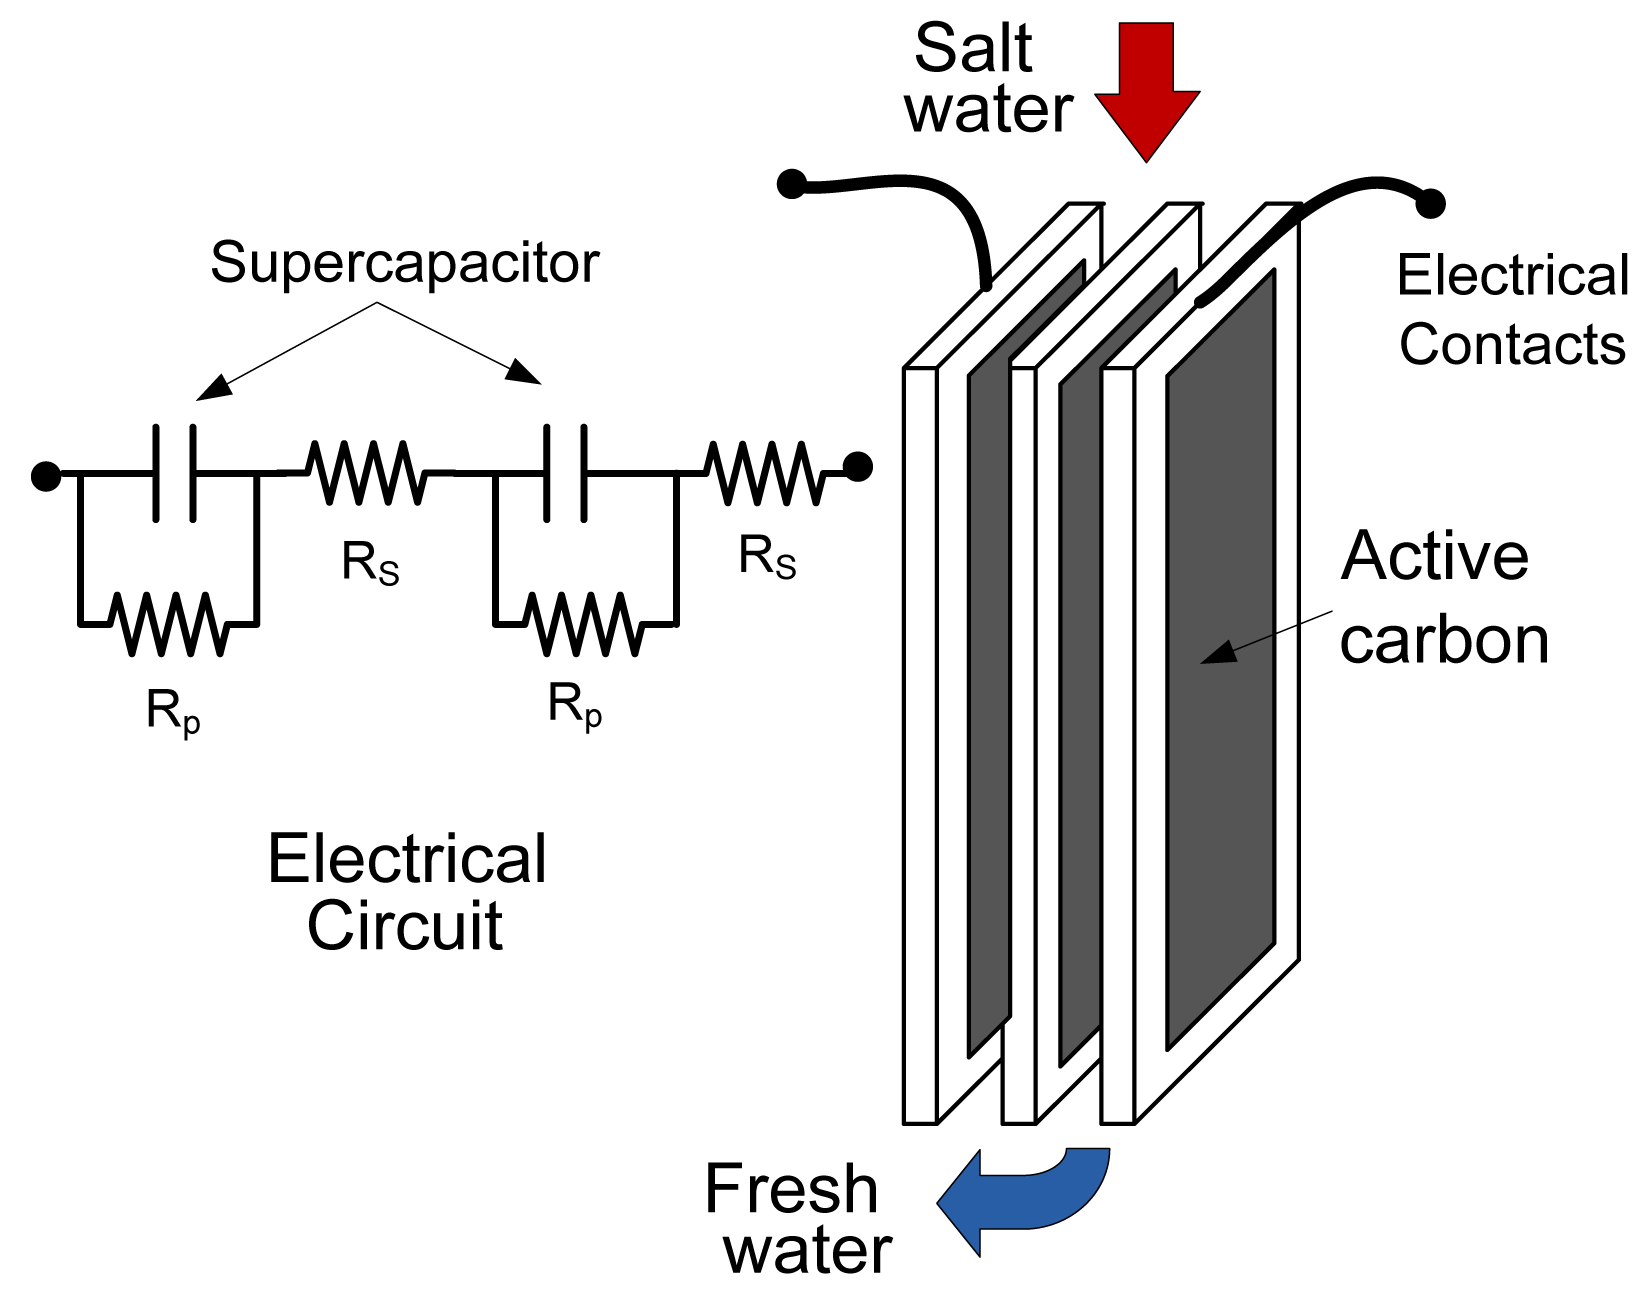
As already mentioned, CDI is a low-pressure desalination process. The ions are removed from water by making the water flow between the plates of an electric capacitor. As can be seen in Figure 1, when the plates are polarized, they attract the ions present in salt water with an opposite sign, thus creating an electrical double layer and eliminating the ions from the water. When the plates are saturated with ions, the water flow is stopped, the plates are depolarized and a brine stream is used to remove the adsorbed ions. During this cleaning process a second module is polarized using the depolarization energy stored in the first module, thus continuing with the water desalination. This means that the primary energy source, which could be renewable energy such as wind power, must only provide the energy to compensate the losses produced when energy is transferred from one module to the next one.
The electrodes of each module must be able to adsorb as many ions as possible. In addition, they should have a good conductivity. In the prototype developed they were made with graphite covered with a 100-μm active carbon layer that has high specific surface area. These electrodes are connected to create an electrical equivalent circuit similar to that of a supercapacitor, as represented in Figure 2.
The carbon substances which are used in the electrodes must have good conductivity, high surface area and a suitable pore size distribution [5–9]. The National Coal Institute (INCAR), located in Spain, has developed nanoporous carbon materials with high surface areas that show high electrochemical activity as electrodes when used in supercapacitors [10,11]. In this system, the energy storage is based on the accumulation of ions on the electrode surface. These materials have been used in the development of a laboratory prototype. The main advantage of CDI is its capacity to harness energy. There are two main stages in the operation of the supercapacitor: purification and purge.
During the purification stage, a voltage is applied to the plates in order to remove the salt ions, which are attracted by the carbon electrodes due to the electric field. It must be taken into account that, even if the desalination module is made with several plates (Figure 2), it is necessary to keep a limitation on the voltage between two plates (<1.5 V) in order to avoid hydrogen generation. Then, the ions are removed off the plates during the purge stage when no voltage is applied. The charge and discharge of the supercapacitor during these processes is the key to energy saving [12–21]. Similar situations can be found in vehicle applications where the supercapacitors are used as energy storage devices [22–25]. It is interesting to point out the ultracapacitor promising future [20] alone and combined with batteries as a storage element, which improves the dynamic behavior of the mentioned storage system.
In this paper, a CDI method with energy recovery control system is proposed. Buck-boost topology has been used for the energy transfer in order to achieve high efficiency. The current control proposed improves the efficiency with low salt concentration, which is the situation involving large series resistance in the equivalent circuit and higher conduction losses. Therefore it is possible to keep the efficiency of the CDI system very close to 80% regardless of the salt concentration. This technology is able to make relevant improvements in desalination processes according to simulation results and experimental data from laboratory.
2. CDI Module Characterization
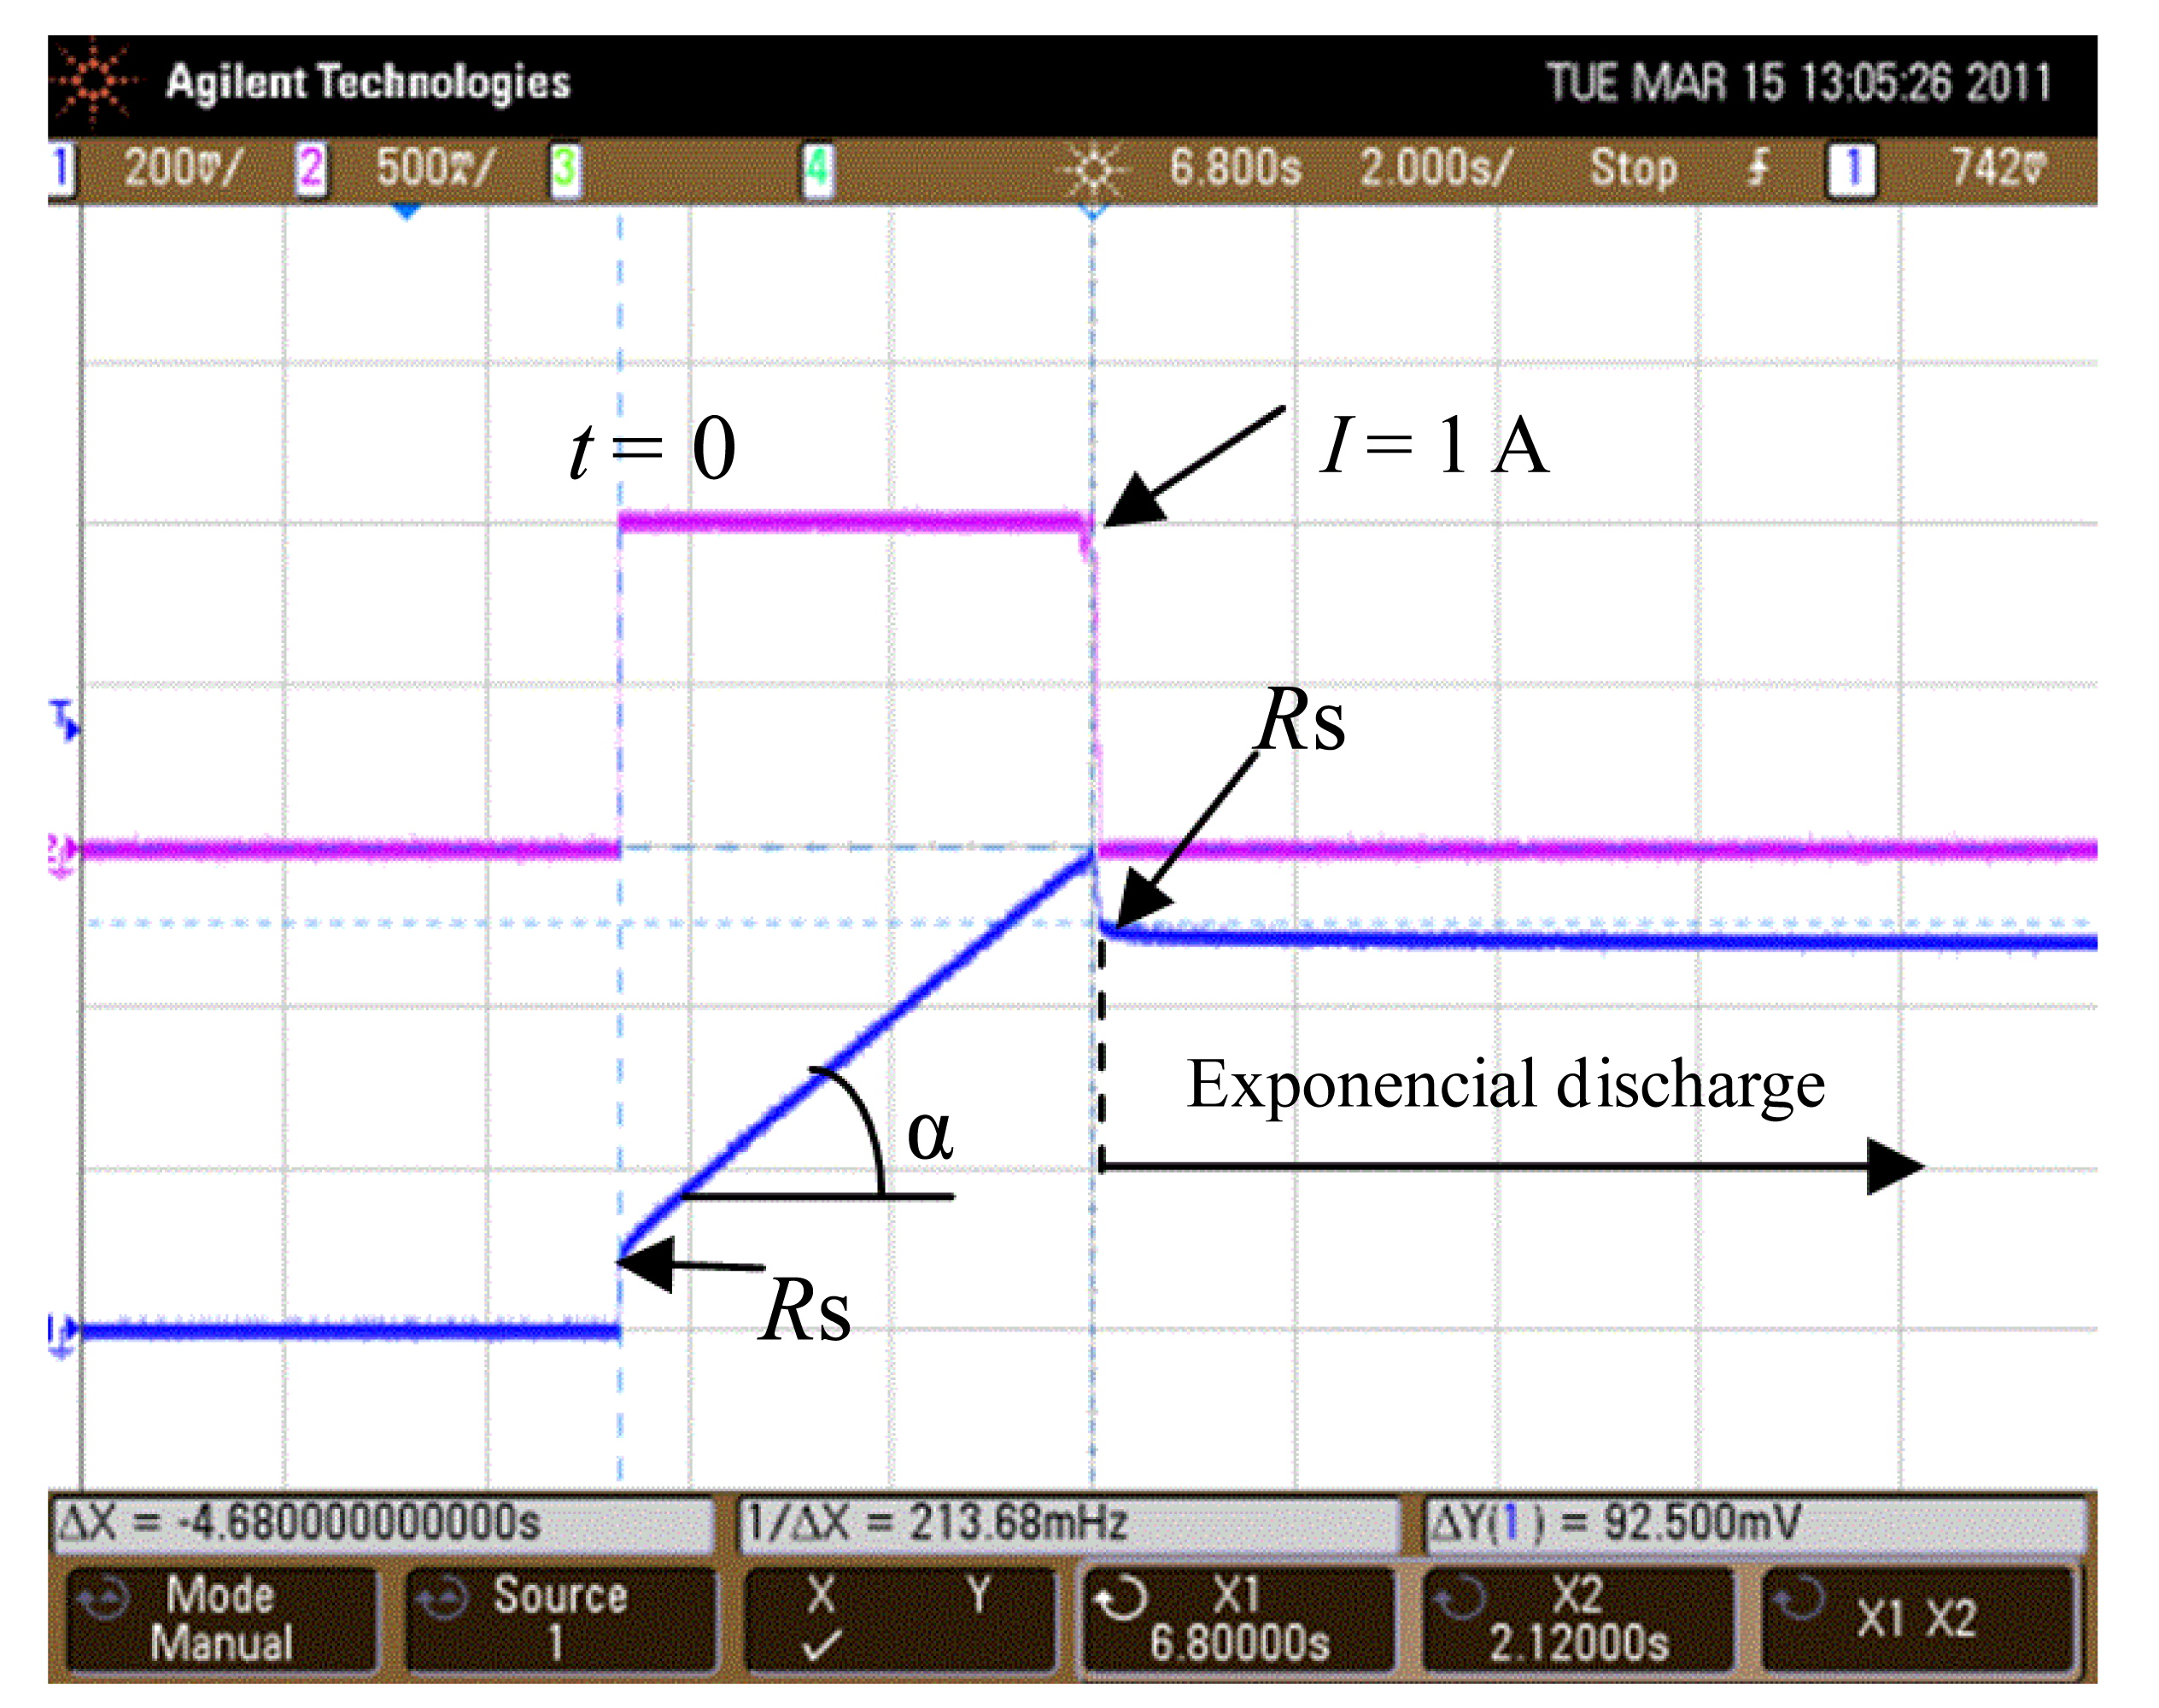
The electrical characterization of the CDI-module allows the desalination system to be simulated. Each CDI stage can be modeled just like a supercapacitor: with a series resistance RS, a parallel resistance RP, and the capacitance value C (Figure 3). These parameters take different values depending on the geometrical configuration of the CDI stage and the salt molar concentration, M. In order to measure these parameters, a DC source was used to charge the CDI module. Figure 4 shows the evolution of the input CDI voltage (VC) during the charging and discharging process. Initially the CDI module is discharged and at t = 0, 1 A DC current is applied at its input. Therefore, since the equivalent capacitor C is initially discharged, the value of the voltage measured VC (t = 0+), will represent the value of RS expressed in Ω.
The capacitance C of the CDI module can be obtained from the linear charging process, during which the parallel resistance RP can be neglected:
Finally, when the current source is turned off, voltage VC experiences a voltage drop corresponding to that across the series resistance RS, and an exponential evolution of VC defined by the values of C and RP follows that can be approximated by the expression:
The information shown in Table 1 has been obtained from a prototype with 250 × 250 mm2 graphite electrodes. The thickness of the nanoporous carbon layer is 100 μm. A photograph of the prototype can be seen in Figure 5. The high-salt-concentration water goes into the cell at the top and, after the salt retention process, the water flows out of the bottom end. In order to be able to transfer the energy stored in the desalination cell to another one, it is necessary to include a DC/DC converter in the system. This element will allow the desalination process to be continued by charging a new CDI module and sending the previous processed water to this new module.
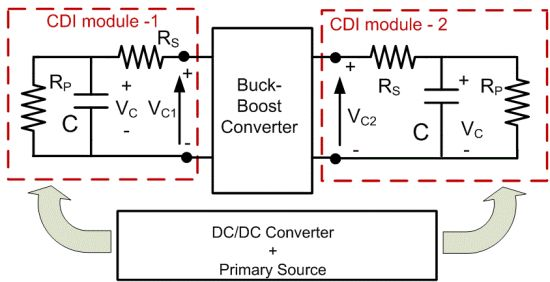
According to Figure 6, the buck-boost converter will have the module-1 voltage (VC1) at the input and the stage-2 voltage (VC2) at the output. The primary source provides the energy to compensate the losses produced when energy is transferred from one module to the next one.
During the energy transfer from module-1 to module-2 the power losses in the whole system will depend on the electrical parameters (Rs, Rp, C) and on the current handled by the converter. The electrical parameters (Rs, Rp, C) also depend on the geometric configuration of the CDI cell and the molar concentration, M, of the salt. Therefore, these parameters will change all through the desalination process and this variation will be reflected in the overall efficiency of the system.
3. Buck-Boost DC/DC Converter
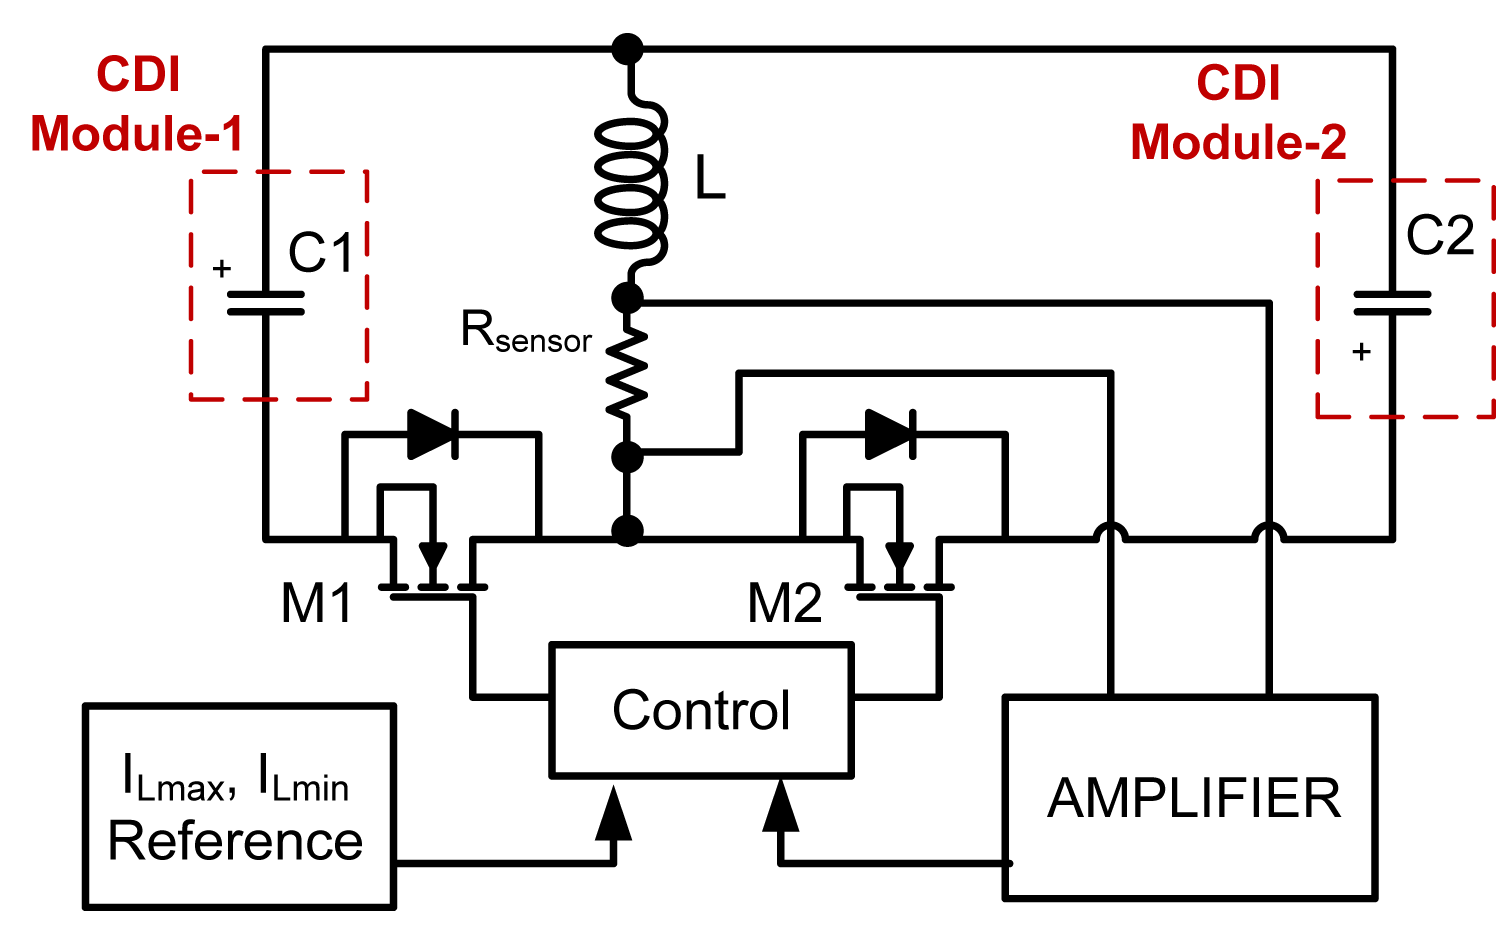
For the sake of simplicity, a system consisting of only two CDI modules connected through an up-down converter (Figure 6) will be considered. Actual systems would have several desalination modules connected in series, with the first module receiving the water with a higher salt concentration, and the last one receiving the water with the lowest salt concentration. As already mentioned, the behaviour of the CDI modules will depend on geometrical parameters and salt concentration. The electric model of the CDI modules must be defined as a function of their geometry and of the salt molar concentration: RS (d,n,M), RP (d,n,M) and C (d,n,M). These values are changing during the desalination process, therefore if we aim to obtain the maximum possible efficiency, the up/down converter must be adapted during the process. The control variables that can be used in the DC/DC converter in order to modify the efficiency of the desalination system are ILmax and ILmin. Both currents define the hysteresis control, making the switching frequency change as the input voltage decreases while the output voltage increases.
Figure 7 represents two CDI modules. When module 1 is charged and the carbon electrodes are saturated of NaCl, the energy stored in this stage must be transferred to module 2, which will continue with the desalination process. Once module 1 is discharged, a brine water stream will clean the carbon electrodes so that the module is ready for a new desalination process.
Since both desalination modules are supposed to operate alike, it does not matter which module works as input or output module. The reference block is used to define the reference values, the maximum and minimum inductor current (ILmax, ILmin), in order to adapt the converter to the optimum operation, i.e., maximum efficiency, during the energy transfer.
The electric model of the module determines the optimum converter control, and this control should be adapted depending on the parasitic element evolution (RP, RS, C) with the geometry and the NaCl concentration.
The correct selection of the reference currents ILmax, ILmin for each electric model configuration (Table 1) will determine the efficiency of the converter in each one and, hence, the efficiency of the energy recovery carried out at the CDI modules. The maximum voltage between two electrodes must be lower than 1.5 V in order to avoid water decomposition into H2 and O2. In all the tests performed, 1 V was used between electrodes in order to avoid equalization problems in the process.
3.1. Topology
The proposed system utilizes a DC/DC buck-boost converter with variable frequency (Figure 7). This is a well-known topology that uses two MOSFET transistors (metal–oxide–semiconductor field-effect transistor) and an inductor [8]. In addition, a control system based on hysteresis has been included that sets the limits of the inductor current (ILmax, ILmin). The efficiency of the whole CDI system will be conditioned by these two values. The aim will be to define the value of both ILmax and ILmin in order to maximize the efficiency during each switching period.
3.2. Operation
Firstly, MOSFET M1 is switched on while MOSFET M2 remains turned off. In this situation, the inductor current reaches the maximum limit (ILmax). During this time (ton), supercapacitor C1 is being discharged. Then, MOSFET M1 is turned off during toff time and MOSFET M2 is turned on by means of the driver. Now, the current charges supercapacitor C2 until the inductor current reaches the minimum limit (ILmin). This cycle is repeated until supercapacitor C1 is completely discharged. The ton and toff parameters will change every switching cycle because input and output voltages are also changing during the process.
Given the operation described above, and assuming the modules of the CDI system have been geometrically defined to minimize the effect of their series and parallel resistance, and therefore their losses, it is necessary now to analyze the control strategy of the converter. When defining this control strategy, it is relevant to aim for high efficiency in the conversion in order to achieve a high energy recovery balance.
Initially ILmin = 0 was selected in order to obtain ZCS (Zero Current Switching) during the ton switching. On the other hand ILmax is going to be defined every switching period in order to obtain the highest efficiency in that period. That means the value of ILmax will change during the energy transfer in each switching period.
3.3. Equations
To perform an analysis of the converter operation, a mathematical model of the proposed converter has been developed and tested [9]. This enables the possibility of determining the voltage evolution of the desalination stage with a simple model. Assuming ideal components, ton time is obtained by assuming linear current evolution in the inductor current and constant voltage in C1 during each switching cycle. This inductor current evolution involves an energy transfer from the input capacitor to the inductor, which results in the voltage across the capacitor decreasing. To calculate the capacitor voltage reduction in each switching period, it can be assumed that the input capacitor is discharged by an average current source obtained from the actual inductor current evolution:
Similarly, supercapacitor C2 increases its voltage in each switching cycle:
In order to estimate the losses in the system during each switching period, it is necessary to calculate the root-mean-square of the current during the two stages defined by times ton and toff. Due to the fact that the converter operates at variable frequency, these values change every cycle:
Converter conduction losses during the total transfer time “T” can be obtained considering the overall series resistance: the inductor series resistance, RSL, and the switch on-resistance, RSon:
In addition to conduction losses, switching losses must be taken into account. They could be relevant when the operation frequency is high, which depends on the inductor selected. These switching losses [24] can be calculated as shown below by considering the rise and fall time of the transistors (“tr” and “tf”):
In order to obtain ZVS (Zero Voltage Switching) in both switches a capacitor snubber can be added in parallel with each switch and a negative ILmin(i) current can be allowed to charge/discharge the snubber during turn-on to eliminate the switching losses. ILmax will be used as the control variable during the energy transfer. According to the equations above, it can be seen that, depending on the values assigned to this current limit, power losses can change dramatically. Therefore, this parameter will also determine the efficiency of the system.
Once the power losses in the DC/DC converter have been modelled, the losses in the whole desalination system can be determined by calculating the losses in the CDI cells during each switching period. Using the RMS current at the input (iRMSC1(i)) and at the output (iRMSC2(i)) of the converter, which depend on ILmax(i), the energy lost in the CDI series resistance, RS, during ton and toff can be calculated as:
The energy lost in the parallel resistance ERp can be easily derived if we assume that the capacitor discharge is mainly due to the current handled by the converter. Then the equation to calculate the energy losses in both input and output CDI modules, ERp, will be:
With the power losses derived from the previous equations, the voltage at the input and output can be recalculated in order to obtain the actual value of both parameters [9]. The following step is to calculate the efficiency of the desalination system during switching period (i) for different values of current ILmax:
If the data shown in Table 1 is introduced in the previous equation system, the efficiency of the desalination system can be derived for different types of CDI modules and different values of salt concentration, M. Current ILmax will serve as control parameter for this efficiency value. Initially a constant current ILmax = 2 A is considered. This value was selected in order to have the maximum efficiency with constant ILmax current when M = 0.06, d = 0.85 mm and n = 4. The calculation was carried out by means of the mathematical model presented. A constant current ILmax = 2 A was also used to obtain the efficiency in all the cases shown in Table 2. This value avoids large conduction losses and long transfer time. If this parameter is reduced to 1 A or increased to 3 A, the efficiency in most of the cases is reduced more than 5%. Table 2 shows the results obtained in this case for a 250 × 250 mm2 electrode system (Figure 5).
It has been checked that using the proposed mathematical model to calculate the optimum value for ILmax in every switching period (instead of considering a constant value for ILmax), the efficiencies obtained will have an important increase. How ILmax should be modified depends on each calculating point.
Therefore the previous expressions were evaluated from ILmax = 0 up to the maximum value assigned to ILmax in order to determine the ILmax(i) set of values for the different switching periods that provides the maximum efficiency in the entire system. This process is also achieved for each geometrical configuration of the CDI modules defined by parameters d, n and M.
Assuming that the maximum efficiency in the energy transfer is obtained when each switching period (Ti) also exhibits minimum losses, a set of ILmax values can be obtained from the previous information that defines the evolution of the maximum inductor current ILmax(t), during the total energy transfer time for each geometric CDI module configuration:
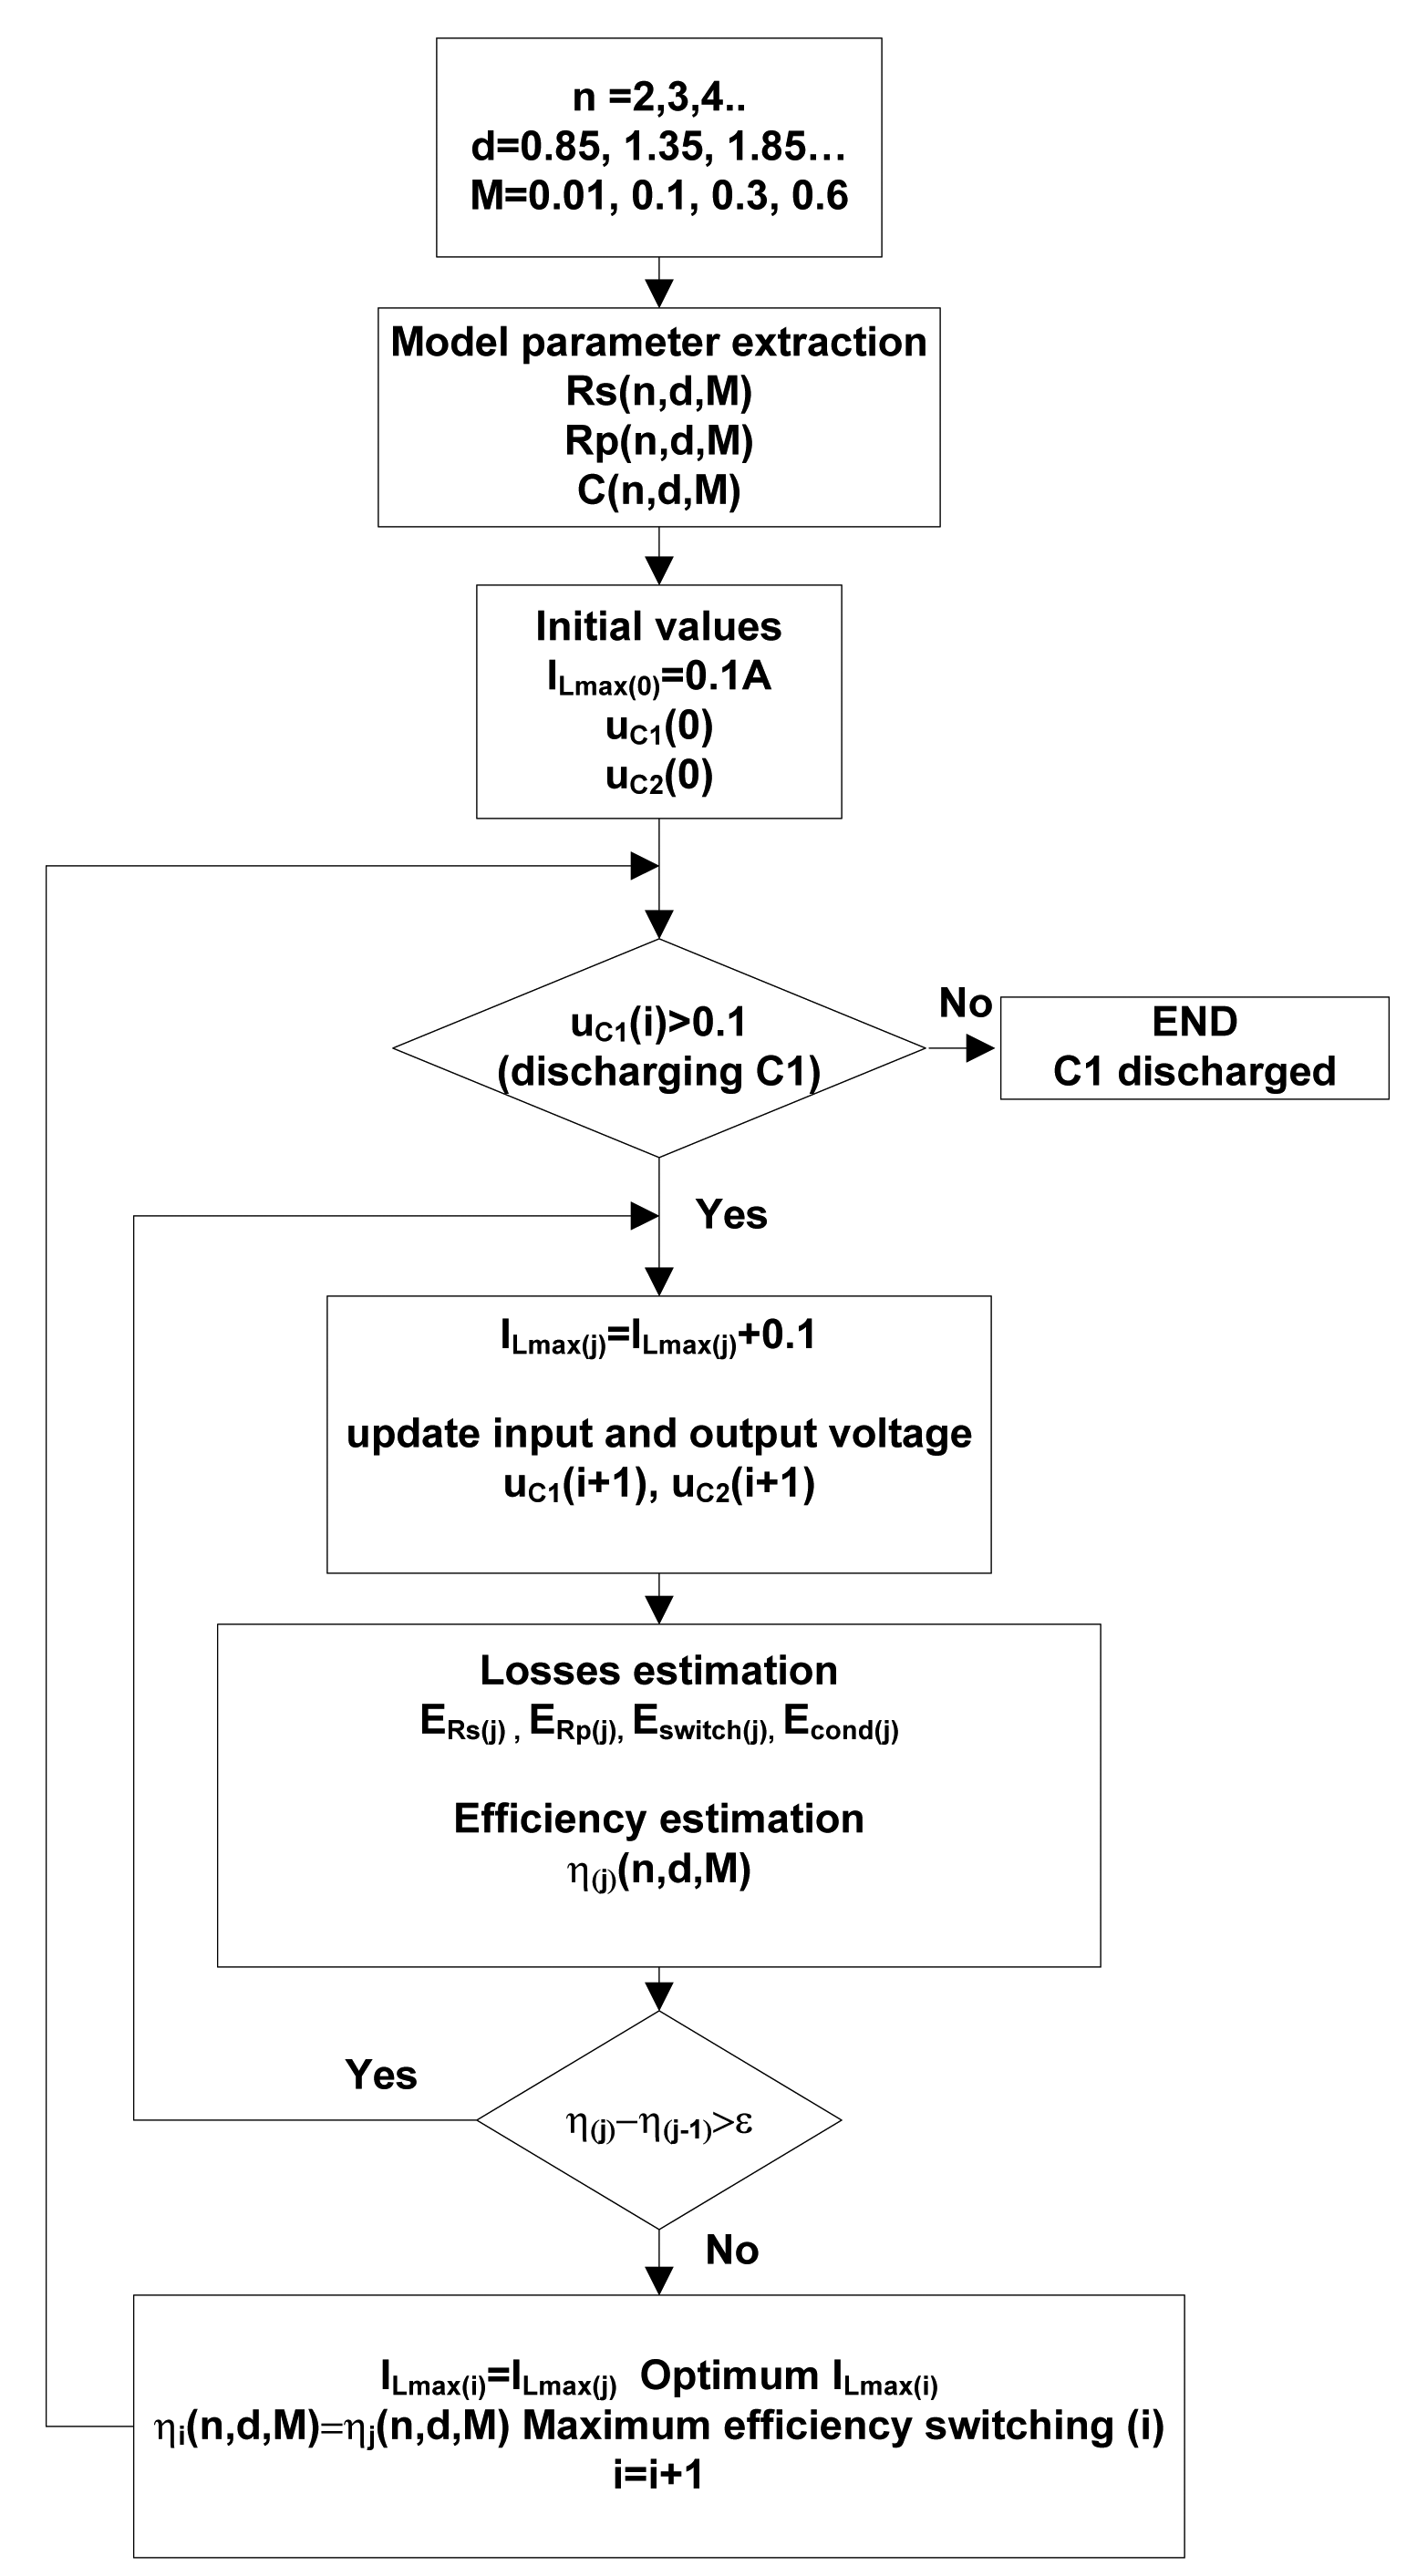
The following diagram (Figure 8) shows the calculation process for both ILmax(i) and efficiency during each switching interval. Initially, the set of values for RS, RP and C is obtained considering different distance between electrodes, d, number of electrodes, n, and salt concentration, M. The result of this calculation provides a three dimensional matrix (the dimensions are defined by d, n, M, see Table 1) for each electric parameter.
Rs(n,d,M), Rp(n,d,M) and C(n,d,M). With this information, the core of the mathematical model is based on a loop where the input voltage decreases due to the energy transfer until its value is only 0.1 V. The loop contains the set of expressions to derive all energy losses and the efficiency of the desalination system during switching periods (i). An inner loop is used in order to obtain the optimum solution (maximum efficiency) within a given switching period (i). This inner loop is used to sweep the values of the maximum current ILmax(j) from 0.1 A until the efficiency cannot be improved any more (ηj − ηj−1) < ε. Where ε represents the maximum error allowed.
With this calculation process (Figure 8) the efficiencies have been recalculated in all the configurations described (Table 3). The new results show an important improvement in the desalination system efficiency. This efficiency is determined by the correct adjustment of the converter operation to each cell configuration in order to minimize the power losses. The screen printing technology allows good manufacture repeatability therefore the converter adjustment for one cell can be standardized for similar ones, thus avoiding the need to individually adjusting all the converters in the system. The desalination capability of the cell is directly related to its capacity which depends on the geometry. This capacity remains quite constant during the cycling process as it is introduced by CSIC-INCAR in reference [10]. In this case a desalination capacity of 250 mg/m2 was obtained with two graphite electrodes at d ≈ 1.5mm using 100 μm nanoporous carbon (carbon mass 6 g) layer in 0.6 M water.
4. Experimental Results
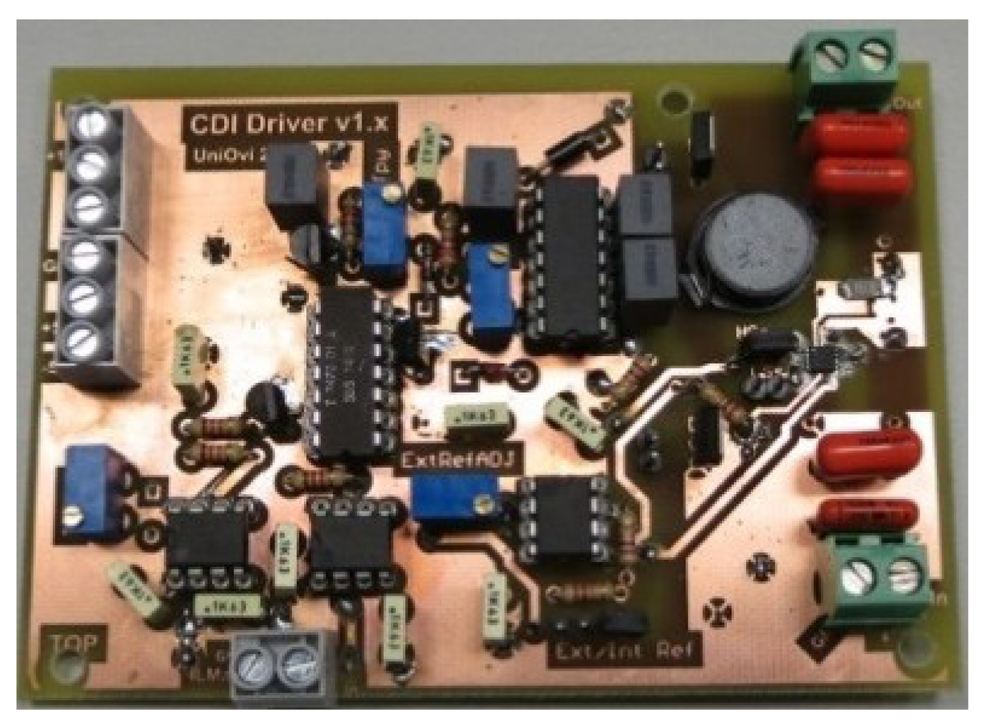
The proposed buck-boost converter has been built in order to verify the described theory and the simulations. Since it is a low-power application, the use of specific components is required in order to avoid high losses, which would considerably diminish the global performance. High efficiency and speed switching MOSFETs (IRLU3636PBF) and an inductor value L = 50 μH have been used. The hysteresis current control system is implemented using TL3016 ultrafast precision comparators (Texas Instruments, Dallas, TX, USA) and the current-sense amplifier MAX4377 (Maxim-integrated, San Jose, CA, USA) (Figure 9).
The hysteresis control of the inductor current involves a variable operating frequency, because a steady state is never really reached: the input capacitor is discharged while the output voltage increases during the process: ton and toff are constantly changing.
ILmax Control
In order to obtain zero current switching (ZCS) during the turn-on of M1 and turn-off of M2, ILmin = 0 A was selected. The value of ILmax will condition the power losses and the efficiency of the whole system. The importance of this fact can be proven by comparing two different converter operations. Firstly, a constant value will be fixed for ILmax during all the energy transfer process and the efficiency results will be compared with those corresponding to the optimum current control. For this test, low salt concentration was selected so that parameters RS and RP of the electrical model were relevant. The geometry configuration selected considered d = 0.85 mm, N = 4 electrodes and M = 0.06, which results in an electrical model, as defined in Section II, with the following parameters: C = 12.3 F, RS = 0.121 Ω, RP = 64.4 Ω. The value used for current ILmax was 2 A, which resulted in an evolution of input and output voltages during the energy transfer from C1 to C2 as shown in Figure 10. The efficiency obtained was measured to be 64%. The efficiency predicted by the model in the same conditions was 66.2% (see Table 2). This 2% discrepancy might be due to the contacts, the wiring and the tolerance in the electric parameters calculation.
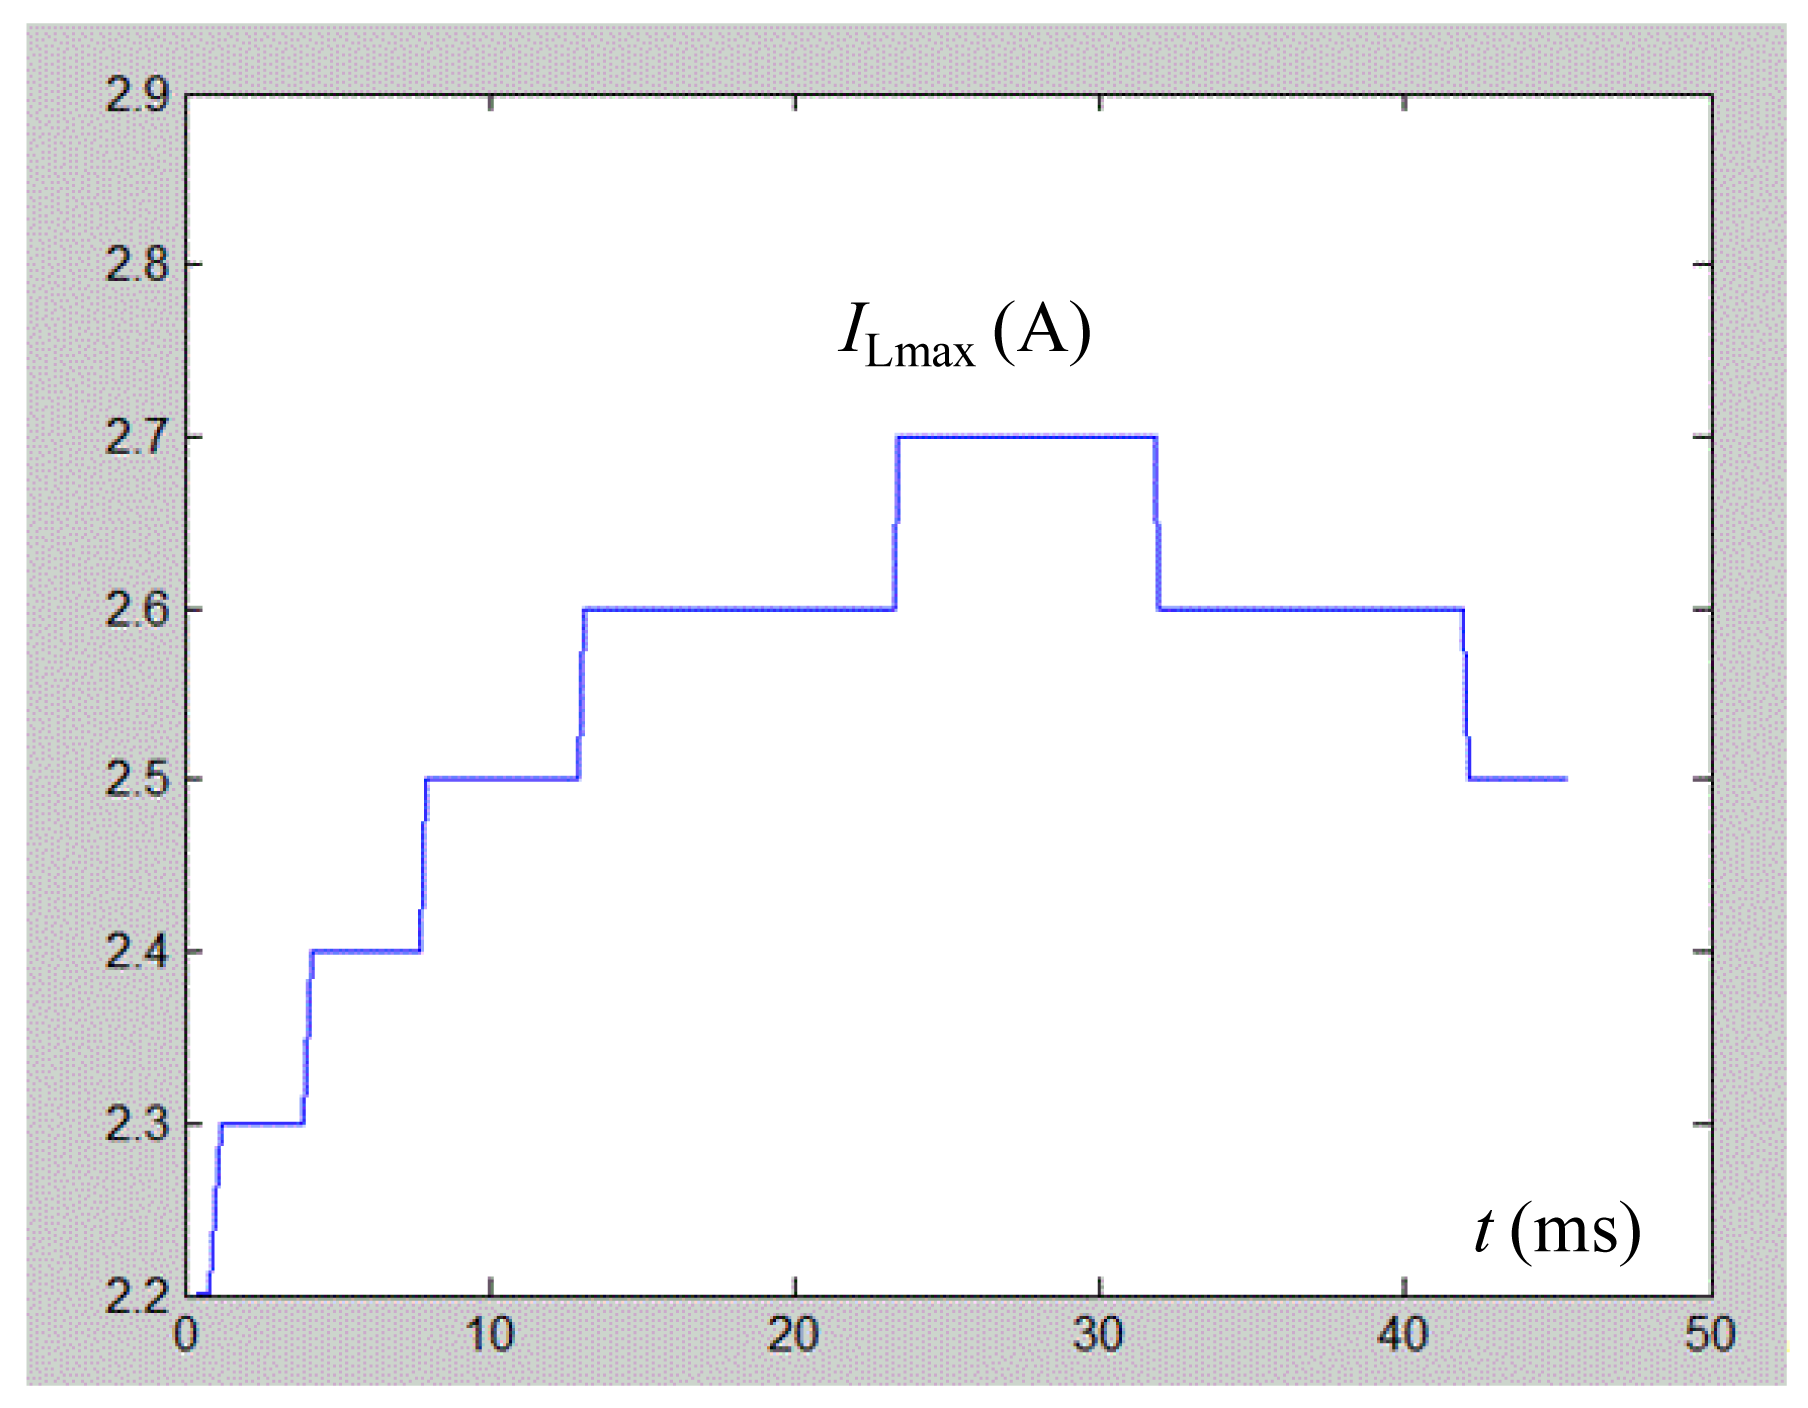
The second test performed used the algorithm proposed in the previous section so that current ILmax was adapted during the transfer process as shown in Figure 11.
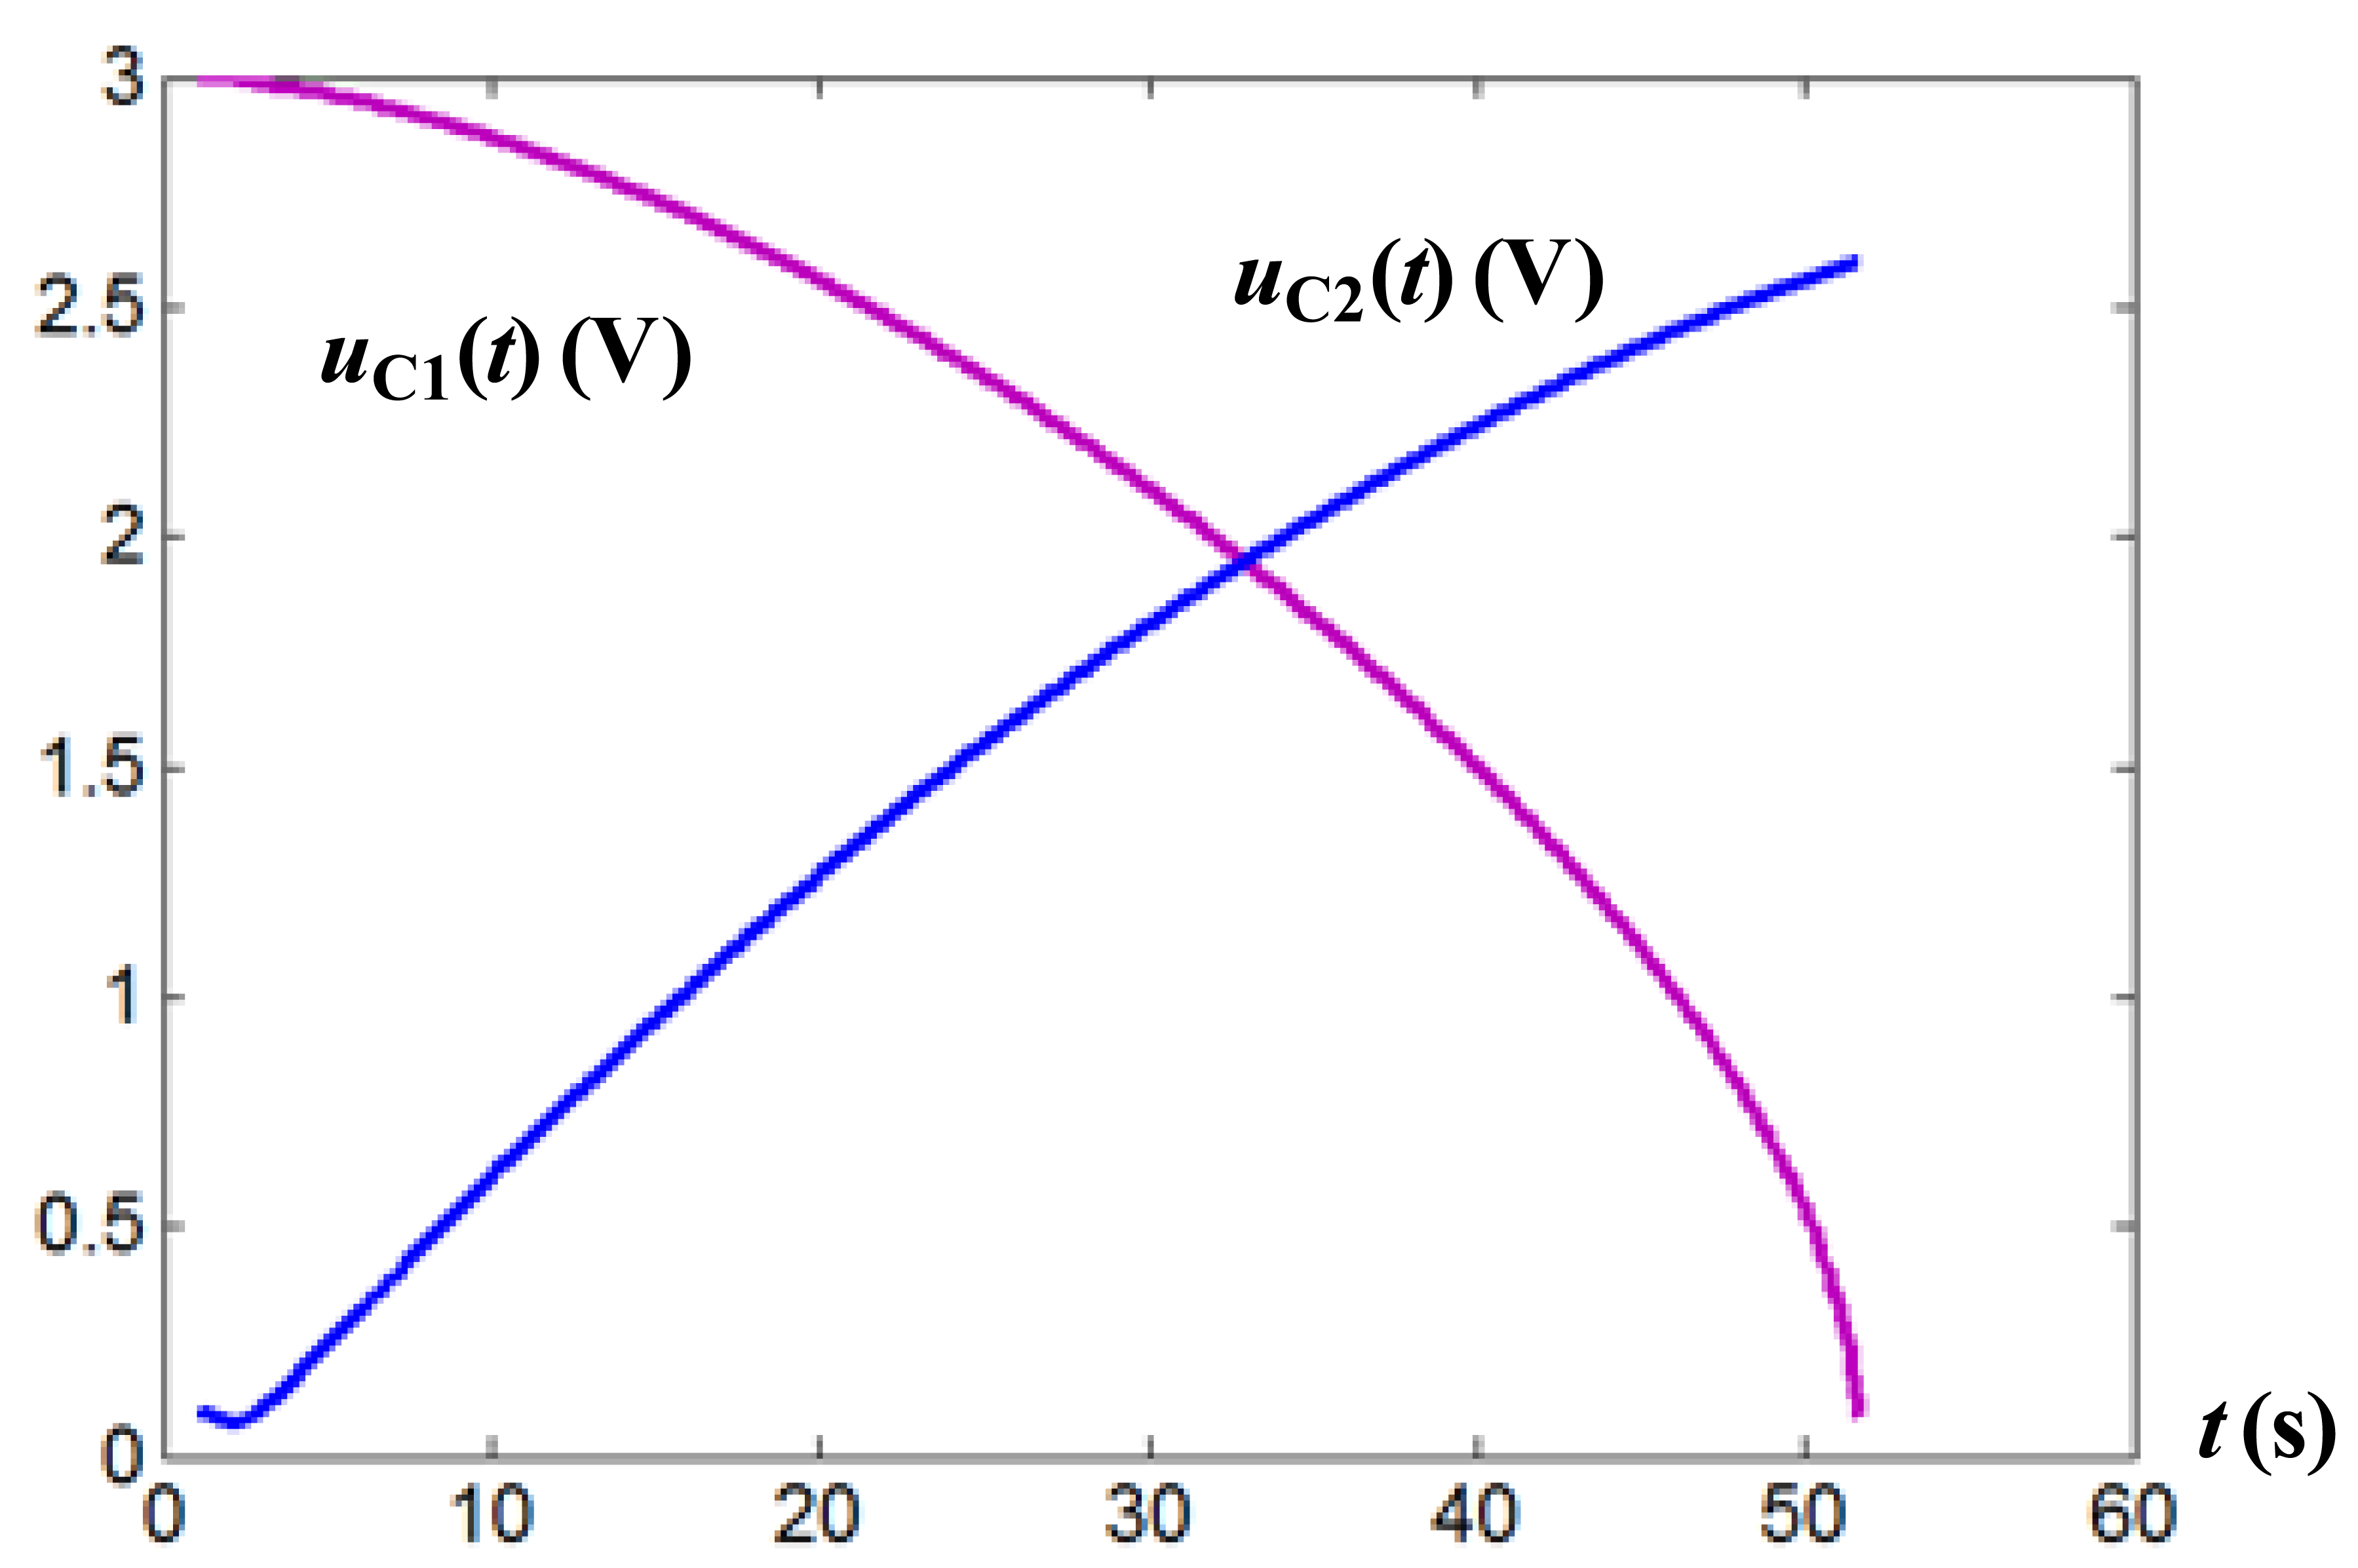
This evolution of ILmax was considered to be optimal (as far as overall efficiency is concerned) and should result in the discharge of the input module and the charge of the output one as represented in Figure 12. The efficiency calculated with the mathematical model (η = 76.17%, according to Table 3) is quite similar to the experimental one η = 74.3%. There is also a great agreement in the total transfer time: 47 s approximately.
Figure 13 shows the experimental measurements of the energy transfer when the optimum ILmax current evolution is used.
5. Conclusions
The Capacitive De-Ionization process has a promising future in desalination thanks to its capability to store and recover energy. A converter mathematical algorithm has been developed which simplifies simulations and avoids long computing times.
A modelling of the CDI stages versus several parameters (d,n,M) has been developed to predict their influence on the efficiency in the system. A new control strategy for the maximum inductor current ILmax has been proposed. By defining the optimum ILmax value in each switching period it is possible to optimize the efficiency of the converter, period by period during all the process. The result is an important improvement in the total energy transferred.
It has been demonstrated that high efficiencies in energy recovery are achievable even with low salt concentration and therefore with large series, RS, and parallel, RP, equivalent resistors. The proposed computer analysis to calculate the appropriate ILmax, involves the possibility of controlling the DC/DC converter in such a way that it can be adapted to the salt concentration, which defines the electrical parameters of the CDI module, during the desalination process. This fact simplifies the automation of the CDI plant just measuring the NaCl concentration during the water processing. Once the CDI module has been characterized all the parasitic components (RS,RP,C) as a function of M (molar concentration) are known. Therefore an optimal ILmax evolution can be obtained for every value of the salt concentration at the input of the module.
Acknowledgments
This paper has been supported by the Spanish Government through its National Research Plan by means of project MICINN-10-MAT2010-20601-C02-02.
Conflicts of Interest
The authors declare no conflict of interest.
References
- Younos, T.; Tulou, K.E. Overview of desalination techniques. J. Contemp. Water Res. Educ. 2009, 132, 3–10. [Google Scholar]
- Fraidenraich, N.; Vilela, O.C.; Lima, G.A.; Gordon, J.M. Reverse osmosis desalination: Modeling and experiment. Appl. Phys. Lett. 2009, 94, 124102–124103. [Google Scholar]
- Welgemoed, T.J.; Schutte, C.F. Capacitive deionization technology: An alternative desalination solution. Desalination 2005, 183, 327–340. [Google Scholar]
- Oren, Y. Capacitive deionization (CDI) for desalination and water treatment-past, present and future (a review). Desalination 2008, 228, 10–29. [Google Scholar]
- Gao, Y.; Li, H.B.; Cheng, Z.J.; Zhang, M.C.; Zhang, Y.P.; Zhang, Z.J.; Cheng, Y.W.; Pan, L.K.; Sun, Z. Electrosorption of cupric ions from solutions by carbon nanotubes and nanofibres film electrodes grown on graphite substrates. Proceedings of the IEEE Nanoelectronics Conference INEC 2008, Shanghai, China, 24–27 March 2008; pp. 242–247.
- Hwang, S.; Hyun, S. Capacitance control of carbon aerogel electrodes. J. Non Cryst. Solids 2004, 347, 238–245. [Google Scholar]
- Xu, P.; Drewes, J.E.; Heil, D.; Wang, G. Treatment of brakish produced water using carbon aerogel-based capacitive deionization technology. Water Res. 2008, 42, 2605–2617. [Google Scholar]
- Planes, G.A.; Miras, M.C.; Barbero, C.A. Double layer properties of carbon aerogel electrodes measured by probe beam deflection and AC impedance techniques. Chem. Commun. 2005, 16, 2146–2148. [Google Scholar]
- Pernía, A.M.; Norniella, J.G.; Martín-Ramos, J.A.; Díaz, J.; Martínez, J.A. Up–down converter for energy recovery in a CDI desalination system. IEEE Trans. Power Electron. 2012, 27, 3257–3265. [Google Scholar]
- Villar, I.; Roldan, S.; Ruiz, V.; Granda, M.; Blanco, C.; Menéndez, R.; Santamaría, R. Capacitive Deionization of NaCl Solutions with Modified Activated Carbon Electrodes. Energy Fuels 2010, 24, 3329–3333. [Google Scholar]
- Jung, H.; Hwang, S.; Hyun, S.; Lee, K.; Kim, G. Capacitative deionization characteristics of nanostructured carbon aerogel electrodes synthesized via ambient drying. Desalinization 2007, 216, 377–385. [Google Scholar]
- Restrepo, C.; Konjedic, T.; Calvente, J.; Milanovic, M.; Giral, R. Fast transitions between current control loops of the coupled-inductor buck–boost DC–DC switching converter. IEEE Trans. Power Electron. 2013, 28, 3648–3652. [Google Scholar]
- Camara, M.B.; Gualous, H.; Gustin, F.; Berthon, A.; Dakyo, B. DC/DC converter design for supercapacitor and battery power management in hybrid vehicle applications—Polynomial control strategy. IEEE Trans. Ind. Electron. 2010, 57, 587–597. [Google Scholar]
- Young-Joo, L.; Khaligh, A.; Emadi, A. A compensation technique for smooth transitions in a noninverting buck–boost converter. IEEE Trans. Power Electron. 2009, 24, 1002–1015. [Google Scholar]
- Samosir, A.S.; Yatim, A.H.M. Implementation of dynamic evolution control of bidirectional DC–DC converter for interfacing ultracapacitor energy storage to fuel-cell system. IEEE Trans. Ind. Electron. 2010, 57, 3468–3473. [Google Scholar]
- Grbovic, P.J.; Delarue, P.; le Moigne, P.; Bartholomeus, P. Modeling and control of the ultracapacitor-based regenerative controlled electric drives. IEEE Trans. Ind. Electron. 2011, 58, 3471–3484. [Google Scholar]
- Lu, R.; Tian, L.; Zhu, C.; Yu, H. A new topology of switched capacitor circuit for the balance system of ultra-capacitor stacks. Proceedings of the Vehicle Power and Propulsion Conference, Harbin, China, 3–5 September 2008; pp. 1–5.
- Rizoug, N.; Bartholomeüs, P.; Moigne, P.L. Modeling and characterizing supercapacitors using an online method. IEEE Trans. Ind. Electron. 2010, 57, 3980–3990. [Google Scholar]
- Grbović, P.J.; Moigne, P.L. The ultracapacitor-based controlled electric drives with braking and ride-through capability: Overview and analysis. IEEE Trans. Ind. Electron. 2011, 58, 925–936. [Google Scholar]
- Hu, X.; Murgovski, N.; Johannesson, L.M.; Egardt, B. Comparison of three electrochemical energy buffers applied to a hybrid bus powertrain with simultaneous optimal sizing and energy management. IEEE Trans. Intell. Transp. Syst. 2014, 15, 1193–1205. [Google Scholar]
- Linzen, D.; Buller, S.; Karden, E.; de Doncker, R.W. Analysis and evaluation of charge-balancing circuits on performance, reliability, and lifetime of supercapacitor systems. IEEE Trans. Ind. Appl. 2005, 41, 1135–1141. [Google Scholar]
- Yan, Y.; Lee, F.C.; Mattavelli, P. Comparison of small signal characteristics in current mode control schemes for point-of-load buck converter applications. IEEE Trans. Power Electron. 2013, 28, 3405–3414. [Google Scholar]
- Cao, J.; Emadi, A. A new battery/ultracapacitor hybrid energy storage system for electric, hybrid, and plug-in hybrid electric vehicles. IEEE Trans. Power Electron. 2012, 27, 112–132. [Google Scholar]
- Kuperman, A.; Aharon, I.; Malki, S.; Kara, A. Design of a semiactive battery-ultracapacitor hybrid energy source. IEEE Trans. Power Electron. 2013, 28, 806–815. [Google Scholar]
- Xiong, Y.; Sun, S.; Jia, H.; Shea, P.; Shen, Z.J. New physical insights on power mosfet switching losses. IEEE Trans. Power Electron. 2009, 24, 525–531. [Google Scholar]


| 2 Electrodes | 3 Electrodes | 4 Electrodes | |||||||
|---|---|---|---|---|---|---|---|---|---|
| d (mm) | d (mm) | d (mm) | |||||||
| 0.85 | 1.35 | 1.85 | 0.85 | 1.35 | 1.85 | 0.85 | 1.35 | 1.85 | |
| M | Capacitance—(F) | ||||||||
| 0.06 | 33.9 | 36.4 | 36.0 | 15.7 | 17.7 | 17.5 | 12.3 | 13.1 | 13.1 |
| 0.1 | 41.6 | 39.4 | 37,5 | 19.2 | 19.7 | 19.1 | 14.1 | 14.7 | 14.8 |
| 0.3 | 44.4 | 43.1 | 41.8 | 21.6 | 21.9 | 21.5 | 16.5 | 16.8 | 16.1 |
| 0.6 | 46.9 | 45.1 | 44.8 | 22.8 | 23.1 | 22.6 | 18.1 | 17.8 | 17.2 |
| M | Series Resistance—(Ω) | ||||||||
| 0.06 | 0.047 | 0.073 | 0.093 | 0.099 | 0.113 | 0.168 | 0.121 | 0.163 | 0.248 |
| 0.1 | 0.038 | 0.050 | 0.079 | 0.064 | 0.081 | 0.114 | 0.081 | 0.114 | 0.171 |
| 0,3 | 0.024 | 0.029 | 0.038 | 0.035 | 0.047 | 0.057 | 0.046 | 0.052 | 0.078 |
| 0.6 | 0.019 | 0.024 | 0.028 | 0.028 | 0.028 | 0.041 | 0.030 | 0.039 | 0.047 |
| M | Parallel Resistance—(Ω) | ||||||||
| 0.06 | 39.6 | 44.8 | 47.9 | 57.4 | 69.4 | 82.6 | 64.4 | 72.9 | 81.8 |
| 0.1 | 34.5 | 43.8 | 55.6 | 49.7 | 59.0 | 73.8 | 56.8 | 72.0 | 69.7 |
| 0.3 | 31.9 | 38.7 | 52.7 | 42.5 | 43.9 | 52.7 | 45.6 | 43.5 | 43.1 |
| 0.6 | 33.0 | 37.1 | 44.2 | 38.5 | 37.3 | 39.5 | 36.9 | 33.5 | 36.0 |
| n = 2 Electrodes | n = 3 Electrodes | n = 4 Electrodes | |||||||
|---|---|---|---|---|---|---|---|---|---|
| d (mm) | d (mm) | d (mm) | |||||||
| 0.85 | 1.35 | 1.85 | 0.85 | 1.35 | 1.85 | 0.85 | 1.35 | 1.85 | |
| M | Efficiency (%) | ||||||||
| 0.06 | 76.8 | 70.5 | 65.4 | 70.3 | 70.6 | 63.9 | 66.2 | 65.6 | 58.4 |
| 0.1 | 77.8 | 76.7 | 70.0 | 73.9 | 73.7 | 70.8 | 68.8 | 70.4 | 64.1 |
| 0.3 | 81.2 | 81.7 | 81.8 | 75.8 | 74.5 | 75.9 | 67.4 | 66.6 | 63.2 |
| 0.6 | 83.1 | 82.9 | 83.2 | 74.8 | 74.1 | 73.3 | 63.9 | 59.6 | 61.4 |
| 2 Electrodes | 3 Electrodes | 4 Electrodes | |||||||
|---|---|---|---|---|---|---|---|---|---|
| d (mm) | d (mm) | d (mm) | |||||||
| 0.85 | 1.35 | 1.85 | 0.85 | 1.35 | 1.85 | 0.85 | 1.35 | 1.85 | |
| M | Efficiency—(%) | ||||||||
| 0.06 | 81.05 | 81.45 | 81.90 | 76.95 | 77.02 | 77.013 | 76.17 | 75.81 | 75.01 |
| 0.1 | 82.81 | 82.81 | 79.52 | 79.80 | 79.71 | 79.10 | 77.80 | 77.21 | 76.50 |
| 0.3 | 85.45 | 85.00 | 84.48 | 84.15 | 81.89 | 81.82 | 81.60 | 81.02 | 76.60 |
| 0.6 | 87.15 | 85.81 | 85.47 | 85.15 | 85.85 | 82.49 | 84.18 | 82.28 | 80.50 |
© 2014 by the authors; licensee MDPI, Basel, Switzerland. This article is an open access article distributed under the terms and conditions of the Creative Commons Attribution license ( http://creativecommons.org/licenses/by/3.0/).
Share and Cite
Pernía, A.M.; J. Alvarez-González, F.; Díaz, J.; Villegas, P.J.; Nuño, F. Optimum Peak Current Hysteresis Control for Energy Recovering Converter in CDI Desalination. Energies 2014, 7, 3823-3839. https://doi.org/10.3390/en7063823
Pernía AM, J. Alvarez-González F, Díaz J, Villegas PJ, Nuño F. Optimum Peak Current Hysteresis Control for Energy Recovering Converter in CDI Desalination. Energies. 2014; 7(6):3823-3839. https://doi.org/10.3390/en7063823
Chicago/Turabian StylePernía, Alberto M., Francisco J. Alvarez-González, Juan Díaz, Pedro J. Villegas, and Fernando Nuño. 2014. "Optimum Peak Current Hysteresis Control for Energy Recovering Converter in CDI Desalination" Energies 7, no. 6: 3823-3839. https://doi.org/10.3390/en7063823