Review

Gamma-ray Spectrometry in Geothermal Exploration: State of the Art Techniques

by
Alistair T. McCay
1,*,
Thomas L. Harley
1,
Paul L. Younger
1,
David C. W. Sanderson
2 and
Alan J. Cresswell
2
1
School of Engineering, University of Glasgow, James Watt (South) Building, Glasgow G12 8QQ, UK
2
The Scottish Universities Environmental Research Centre (SUERC), Rankine Avenue, Scottish Enterprise Technology Park, East Kilbride G7 0QF, UK
*
Author to whom correspondence should be addressed.
Energies 2014, 7(8), 4757-4780; https://doi.org/10.3390/en7084757
Submission received: 30 April 2014 / Revised: 23 June 2014 / Accepted: 7 July 2014 / Published: 24 July 2014
(This article belongs to the Special Issue Geothermal Energy: Delivering on the Global Potential)

Abstract

:
Gamma-ray spectrometry is a surveying technique that allows the calculation of the heat produced during radioactive decay of potassium, uranium, and thorium within rock. Radiogenic heat producing rocks are often targets for geothermal exploration and production. Hence, refinements in gamma-ray spectrometry surveying will allow better constraint of resources estimation and help to target drilling. Gamma-rays have long half-lengths compared to other radiation produced during radiogenic decay. This property allows the gamma-rays to penetrate far enough through media to be detected by airborne or ground based surveying. A recent example of ground-based surveying in Scotland shows the ability of gamma-ray spectrometry to quickly and efficiently categorize granite plutons as low or high heat producing. Some sedimentary rocks (e.g., black shales) also have high radiogenic heat production properties and could be future geothermal targets. Topographical, atmospheric and spatial distribution factors (among others) can complicate the collection of accurate gamma-ray data in the field. Quantifying and dealing with such inaccuracies represents an area for further improvement of these techniques for geothermal applications.

1. Introduction

In this paper, we review gamma-ray spectroscopy as a survey tool for geothermal resource exploration. We hope the paper will also be useful as a practical guide for those unfamiliar with gamma-ray surveying, who might benefit from using it in geothermal exploration.
Gamma-ray spectroscopy allows determination of concentrations of selected radioelements from which the heat being produced from radioactive decay can be calculated. This may be by counting gamma-rays produced either in a rock sample during a laboratory test or an area of land during an in-situ survey. However, the relationship between recorded gamma fluence and radioelemental concentration in the geosphere is complex. Factors such as decay series disequilibria, topographical errors, and atmospheric influence during surveying can lead to results that are not representative of the underlying rock. The radioelements of interest for geothermal resources are potassium (K), uranium (U), and thorium (Th). Rocks of high concentrations of these radioelements can be characterised by high heat flow, and the geothermal gradient can thus be favourably enhanced. Such enhancement creates useable heat at shallower depths than would otherwise be the case, thus reducing the drilling costs of a geothermal project.
Many granites are enriched in the radioelements potassium, thorium and uranium, and thus typically have higher radioactivity than many other rocks. Granite is therefore a favoured target in geothermal exploration worldwide, e.g., USA [1], Japan [2], UK [3], France [4], Switzerland [5], Australia [6]. This heat producing property of granite is particularly effective when the pluton is buried beneath layers of low heat conductivity “duvet rocks” such as coal or shale [7]. There can be crossover between classifications of duvet rocks and caprocks (i.e., reservoir topseals), where the rocks both have low thermal conductivity and permeability. However, some potential duvet rocks such as the Clyde Plateau Lavas in the Midland Valley of Scotland would likely not be effective caprocks, in this case due to extensive fracturing. Where such duvet rocks cap highly radiogenic granite, vastly enhanced heat can be obtained [8,9,10]. Radiogenic heat production is not just a phenomenon peculiar to granite as all rocks contain some concentration of radio-elements. Depending on the depositional environment, mudstones can have elevated concentrations of radio-elements compared to other sedimentary rocks. Due to their low thermal conductivities (because of their low quartz content) this heat can remain in place within mudstones over geological time, which may result in viable geothermal resources. Metamorphic rocks, on the other hand, tend to be depleted in radio-elements [11,12]; such depletion is actually part of the process that feeds the upper crust with relatively higher concentrations of radioelements [13].
Within geothermal exploration, gamma-ray surveying can be put to a number of uses beyond heat production investigations. In geothermal investigations, gamma-ray surveying is also useful for fracture identification. Fractures in the subsurface have previously been associated with elevated uranium concentrations [14,15] due to the mobility of uranium in subsurface fluid circulation. Such mobility can cause a significant issue for gamma-ray spectrometry survey interpretation known as disequilibrium (discussed in Section 4.2). Fractures can be a source of significantly enhanced permeability [15,16,17] providing key conduits for fluid extraction in a geothermal system; thus, it is advantageous to accurately characterise the fluid flow properties of a fracture network during resource evaluation. The duvet layers of low heat conduction, e.g., mudstone, can also be detected by their higher gamma-ray output compared to surrounding formations. These gamma-ray counts show up during wire-line logging of boreholes.
Gamma-ray surveying also has a wide range of applications beyond geothermal exploration including: uranium exploration [18,19], sedimentary facies identification for oil and gas exploration [20,21,22], detection of radioactive contamination [23,24], and mineral exploration [25]. It can also be used for pure earth science discoveries, e.g., constraining deep crustal processes from potassium, uranium, and thorium concentrations in modern day outcrops [26,27].

2. Revision of Physical Concepts

2.1. Gamma-ray Formation and Detection

Gamma-ray is the name generally given to high-energy photons emitted during decay of atomic nuclei. Gamma-rays have frequencies greater than 1019 Hz, wavelengths less than 10−12 m, and have energies above 104 eV; gamma-rays are generally the highest energy photons in the electro-magnetic spectrum. Radioelements spontaneously decay leading to emission of alpha, beta, and/or gamma radiation depending on the decaying element. These radio-elements are naturally present in most rocks, but tend to be concentrated at higher levels in certain types (e.g., granite, mudstone). Potassium, uranium, and thorium are of particular interest for geothermal production because they contribute significantly to the heat produced during radioactive decay in the rock. The concentrations of these elements show an approximate trend to increase with silica content [28]; the same relationship has been found for gamma ray intensity in volcanic rocks [29].
Gamma-rays penetrate through materials (e.g., rock and air) much further than the other forms of radiation (alpha or beta). This penetrating ability is what makes gamma-rays useful for detecting radioelement concentrations within rock. They can penetrate up to 0.5 m through rock, allowing a sample to be collected by a portable gamma-surveyor which is large enough to not be grossly biased by local concentration heterogeneity. However, the half-length of a gamma-ray in rock such as granite is much less than 0.5 m; half-length is the distance through a material where half the gamma-rays will be attenuated. During an in-situ survey, most of the gamma-rays detected will effectively come from the top 0.15 m of material. For example, a portable detector placed on a rock surface will sample gamma-rays from approximately a 0.15 m deep by 1.0 m diameter disc (Figure 1); with a small contribution from deeper sources. Penetration through air can be up to several hundreds of metres; therefore, aerial surveys are typically conducted 30–300 m above the surface [30,31]. Although the penetrating property of gamma rays allow surveys to be conducted, having most gamma radiation coming from the top 0.15 m at the surface does present problems. Aerial surveys (explained in Section 3) sample a wide area during each reading; such a sample may be a mixture of bare rock, peat cover, and water courses. The portion of the measured gamma-rays that originated from bare rock can be a significant uncertainty when interpreting the results. A further issue is weathering can alter the concentration of potassium, uranium, and thorium at the rock surface [28]. These issues can be compensated for by calibrating aerial results with direct surveying of a freshly created rock surface or testing borehole samples in the laboratory [32,33].
Figure 1. Schematic showing approximate areas of rock sampled by portable gamma surveyor placed on rock surface.
Energies 07 04757 g001
The concentrations of specific radioelements can be determined as they each impart a specific energy signature onto the photon produced during decay. The isotope 40K produces photons with energy of 1.46 MeV. However, uranium and thorium are detected by their daughter products; therefore, uranium and thorium concentrations are detected as equivalent uranium (eU) and equivalent thorium (eTh). The early spectrometers used the daughter products 214Bi (1.76 MeV) for uranium and 208Tl (2.62 MeV) for thorium. These daughter products were originally used because their produced gamma-ray energy signatures are relatively large (e.g., 0.8 MeV for Bi214 compared with 0.2 MeV for U235 or no gamma-ray produced for U238) and can be more easily distinguished. Modern spectrometers are not limited to solely these daughter products to estimate eU and eTh as improvements in spectrometers means that many of the lines in the uranium or thorium decay series can be distinguished. This allows adequate confidence in estimates of potassium, uranium, and thorium derived from gamma-ray sources. Additionally, Compton Scattering affects gamma-rays as they pass through rock due to gamma-rays “bouncing off” electrons which absorb some of the energy from the gamma-ray. This Compton Scattering means that when a photon is detected by the surveyor it may have much less energy than when it was created during decay. This diminishing energy results in photons created by thorium decay arriving at the detector with energy expected from uranium or potassium decay, in addition to U photons arriving with the expected potassium decay energy. However, these scattering affects can be compensated for in spectral analysis.
The photoelectric effect [34,35] is utilised to detect gamma-rays [36] with many detectors made from material which undergo scintillation; i.e., visible light is produced when struck by gamma-rays (the use of this effect is described further in Section 3). Detectors made from sodium-iodine are typically used in in-situ surveys [20,26,37,38]. Many other materials are used for scintillators such as bismuth germinate; ceasium-iodide detectors may also be used but these have poor resolution. Alternatively, lanthanum bromide detectors provide good resolution but have self-dose issues; cerium bromide has less self-dose problems but remains expensive. Also in use are semiconductor detectors such as intrinsic germanium. This is used for lab studies as it requires cryogenic cooling.

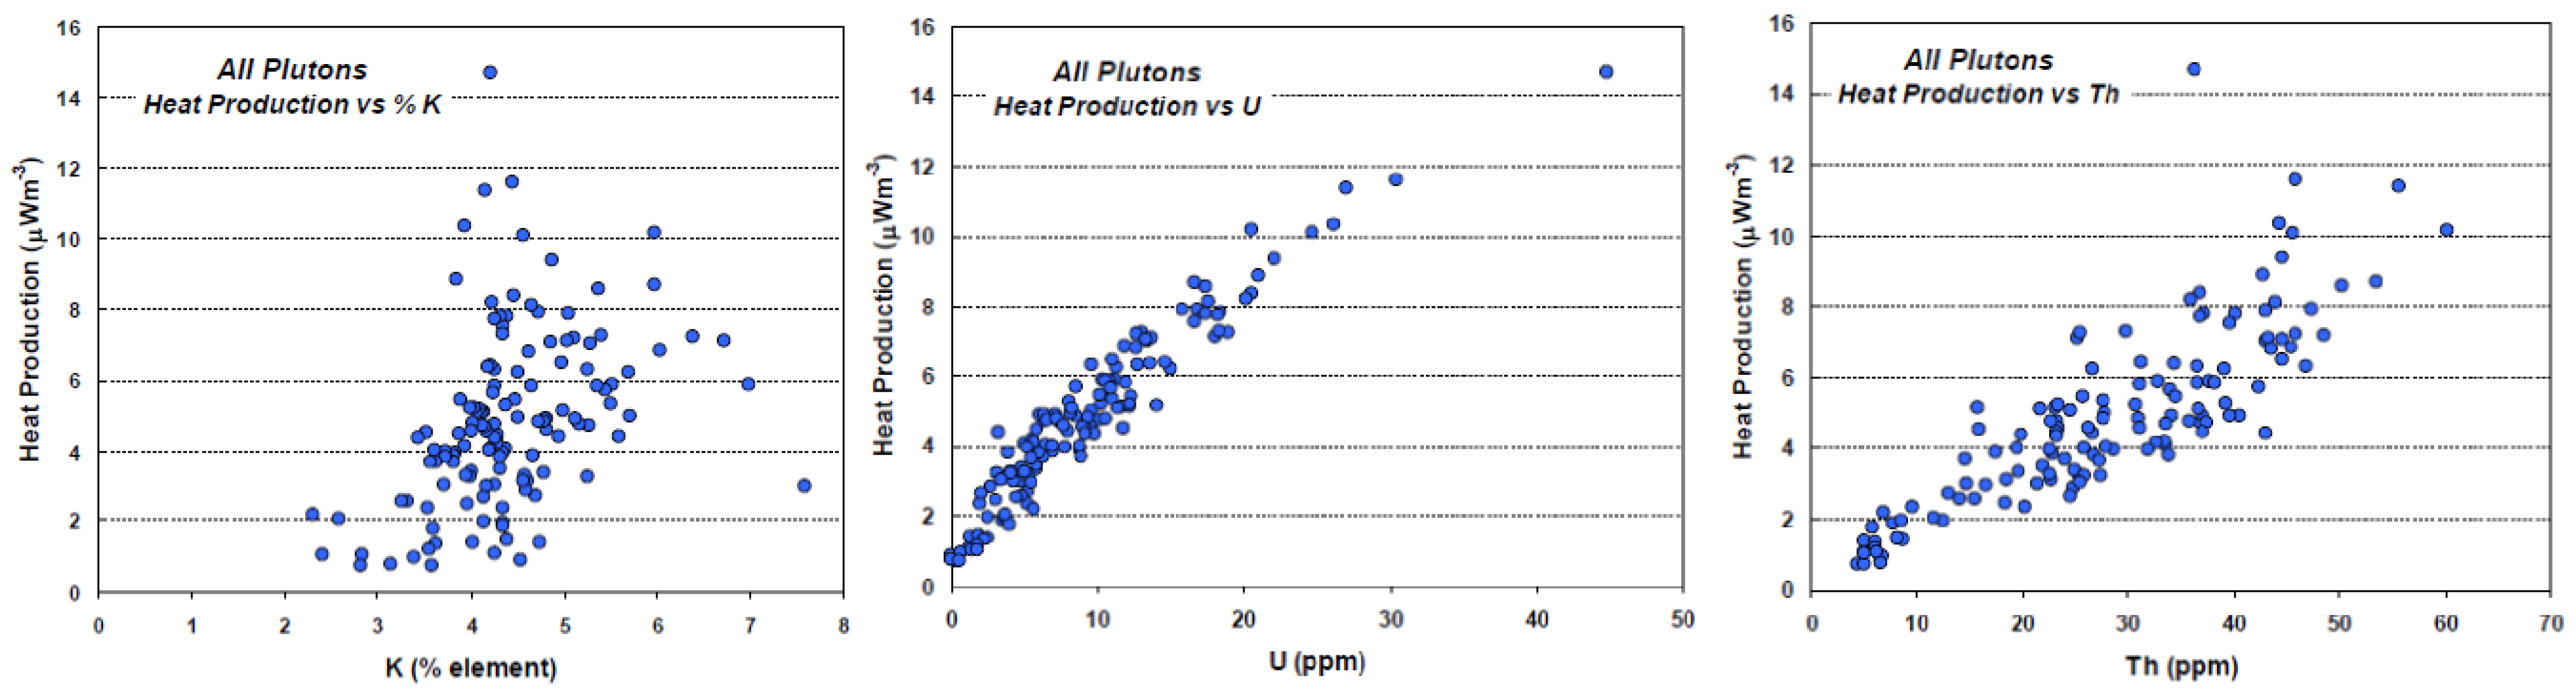
2.2. Heat Production from Radioelements

The heat from radioactive decay is produced in accordance with the well-known Einsteinian expression E = mc2 [39]. This summarises the fact that energy cannot be created or destroyed, but mass can be converted into energy and vice-versa. During the decay processes, some mass must be converted into the energy that produces the heat. Initially, this energy exists in the form of the emitted particle’s kinetic energy. During subsequent collisions, this energy is absorbed and converted to heat.
It is important to note that, although gamma-rays are used to determine the quantities of potassium, uranium, and thorium in rock, the gamma-rays themselves are not actually responsible for significant quantities of the heat produced. Alpha and Beta components of decay produce much more heat than gamma-rays; in particular, the alpha decay of uranium [40]. Such heat producing decays come from different parts of the decay series to the detected gamma-rays, thus disequilibrium of the decay series (further discussed in Section 4.2) can lead to radioelemental concentrations that do not represent the radiogenic heat being produced by the rock. Neutrinos are also produced during decay but pass through the planet, thus some energy of the Earth is lost to outer space [41].

3. Instrumentation

Several different types of gamma spectrometers can be used in-situ in the field or laboratory, but all share a common basic architecture (Figure 2). Detectors are either based on scintillation or semiconductors. Scintillation detectors consist of both a scintillator and photomultiplier. The scintillator is made out of material which reacts with gamma-ray photons producing photons of visible light. The visible light forces electrons to be ejected from the photomultiplier which are then multiplied [42]. The electrons strike an anode, which produces a negative voltage pulse which is proportional to the energy of the photon which struck the scintillator. This proportionality is how the energy can be determined by the spectral analyzer and thus the origin of the gamma-ray can be determined. Semiconductor detectors are diodes in which incident radiation generates electron-hole pairs which migrate to electrodes due to a high voltage across the diode. This produces a current pulse proportional to the energy deposited by the incident radiation.
Figure 2. Block diagram showing the main sections which are common to most gamma-ray spectrometers. Figure adapted from International Atomic Energy Agency (IAEA) 2003 report [42].
Energies 07 04757 g002
Many geothermal exploration studies utilise lab-based gamma-spectrometers. These gamma-spectrometers can be very precise, such as intrinsic germanium semiconductor counters. They deliver reliable results because they can be regularly checked against standards and the surrounding environment remains largely stable. To conduct the gamma readings, a sample of approximately 100 g is crushed (less material may be used for more highly radioactive samples). The crushed sample is then put in the chamber with the counter; the chamber being housed in minimizes influences of externally created gamma rays. Lab techniques are often used during geothermal drilling since small drill cutting samples can be used for the analysis. Using the drill cuttings has the advantage that drilling does not have to be interrupted for wire-line logging to gain data about the heat production of the geothermal exploration target rocks. Laboratory measurements have typical errors of 0.03%–0.1% K, 0.5–2 ppm eU, and 0.1–0.3 ppm eTh [42].
Large-scale in-situ gamma-ray surveys can be conducted using airborne spectrometers mounted on aeroplanes [43] or helicopters [33]. The aircraft are fitted with special mounts to suspend the scintillation counters; sampling time for airborne surveys can vary from 1 s to min [32]. Such aerial surveys exploit the favourable penetration of gamma-rays through air [42]. However, this does mean that the survey flights must be conducted within a few hundred metres of the ground surface [31]. Their advantage is the huge expanse of terrain that can be covered in a few days of surveying. The height of the airborne surveys means that each reading represents an average of a wide area; e.g., at 100 m altitude the sample area may have a diameter of approximately 190 m [44]. The survey sample area will therefore be spatially variable [45]; e.g., in Scotland, patches of exposed high heat production-granite will be recorded alongside areas of peat cover masking the heat production-granite below. However, case studies show that areas of high gamma-ray intensity and therefore high heat production can still be identified despite this averaging of properties [32]. The results from airborne surveys are not trivial to analyse and require a range of careful corrections for influences such as topography and altitude [31,42]; these influences can even be further compounded by material heterogeneity. Such information is, however, readily collectable during airborne gamma-ray readings [23]. Count rates during airborne surveys typically have standard deviations of 6.3% for potassium, 12.3% for uranium, and 13.7% for thorium if the surveyed material had concentrations of 2% K, 2.5 ppm eU, and 9 ppm eTh [42].
In-situ surveys can also be conducted using hand-held portable spectrometers. These surveys have the advantage of being extremely flexible; to cover a wider area in minimal time, for instance, readings can be taken at 100 s of metres spacing, while for collection of detailed information, readings can be taken every 0.5 m [20,21,22,38,46]. In addition to lateral spacing, the counter can be placed on rock surfaces for small volume sampling (see Figure 1) or else held above rock surfaces to sample significantly wider areas at once [18,47]. Sampling time also varies in surveys from seconds [48] to several minutes [46,49] depending on the surveyor and survey design. Typically in areas of lower radioactivity rock, longer sample times are needed for suitably accurate results [22]. An alternative approach used by some surveys is to monitor continuously then integrate the count times in intervals, e.g., every 5–10 s [50]. Rock and soil samples can also be collected during these in-situ surveys, to compare with the in-situ gamma results or to conduct more general rock mineral analysis [32,33,44,51] and be able to quantify near surface geometrical effects [52]. Modern hand-held surveyors are very portable, weighing in at a few kilograms and being small enough to fit inside a small backpack. Indeed some designs have been specifically mounted on backpacks and readings taken at automatic intervals [32,50]. Such portable spectrometers have precisions of approximately 0.1%–0.14% K, 0.6–0.8 ppm eU, and 0.6–1.5 ppm eTh [42,53].
Car-borne surveys can offer a useful compromise between wide area, low resolution airborne surveys and high resolution, narrow area hand-held portable surveys. However, the car-borne surveys are limited to locations that permit vehicular access. Even so, given the right settings, car-borne surveys can effectively survey a much larger area in a shorter space of time compared with walkover surveys and could also provide a valuable mix of surveying scales [32,33]. Car-borne surveys have similar survey times as airborne surveys of several seconds [32] but these could be increased if the needs of a survey warranted longer survey times.
A comprehensive survey may include several of these techniques. Walkover and car-borne surveys can be run at complementary scales with airborne surveys [23], to calibrate the airborne surveys [32]. Each of these techniques is best suited to different desired outcomes of a survey, so thought must be given as to which would be most suited to the survey needs.

4. Calculation

4.1. Data Corrections

The collected data require correcting prior to any analysis of the results. The corrections depend upon which of the survey modes were utilized. In commercially available instruments, some of these corrections are done automatically; otherwise the corrections and calculations must be completed by the surveyor. Geothermal explorationists need to understand the transformations of the raw data to K, eU, and eTh concentrations, if they are to use the results confidently, and be able to engage sufficiently with survey physicists to help design field campaigns. An outline of where corrections may be needed in gamma-ray spectrometry surveying is provided in this section.
Due to operating at heights hundreds of metres above ground, airborne surveys are particularly susceptible to influence from gamma-rays produced by cosmic-rays. These cosmic-rays interact with the Earth’s atmosphere and produce gamma-rays as secondary radiation [42]. Cosmic ray intensity gets higher with altitude, doubling almost every 2000 m from an intensity of about 32 nGy/h at sea level [54]. Additionally, increases in altitude results in decreasing fluence of gamma radiation originating from the ground surface, as these are progressively scattered and absorbed by the atmosphere. For these reasons, airborne surveys are usually conducted within a 30–300 m altitude [30,31]. Such a height gives each airborne survey measurement a ground sample area of approximately 300 by 300 m with the sample area increasing proportionally with altitude. Surveys are also susceptible to influence from gamma-rays originating in the atmosphere due to radon decay, the intensity of such are variable both spatially and temporally. The gamma-ray count associated with cosmic rays and radon can be found by flying at several heights over a large body of water; as the water shields the aircraft from the gamma-radiation that is produced by the ground surface below. This atmospheric gamma-ray count can then be subtracted from the results as appropriate. The body of water should preferably be several metres deep, and should also be fresh-water because sea-water has a modest uranium content. Consideration may also be given for the count produced by the vessel on which measurement is taken over the body of water.
Airborne surveys are strongly affected by undulating terrain, as this affects how the area of ground surface is exposed to the gamma spectrometer on the aircraft. Such influences can increase the count rates by 100% in valleys and decrease by 10%–30% over mountain ridges [31]. Corrections for topography can be conducted [31] but can assume a homogeneous medium for airborne surveys. Additionally information about the underlying topography at the moment each measurement is acquired must also be collected. Small scale topographical features have been found to show variations of radioactivity by up to six times due to source redistribution by natural processes [55]; which shows the issue of a homogeneous assumption during topographical corrections. Such varying topography can also be an issue for maintaining a constant survey height above the ground surface. Another potential issue is the variation of half-lengths gamma-rays in different materials; surveys may be weighted towards material of lower density in which gamma-rays can penetrate more easily. Further corrections may be needed for biomass, as vegetation affect gamma-ray data [56,57] due to covering exposed rock and emitting their own gamma-rays.
Portable surveys are typically calibrated assuming that the surveyor is taking readings from an area that is 2π. A 2π area is where there is a solid angle with the surface, i.e., the rock is flat, >2π would be where the surveyor is placed in a depression leading to overestimation, <2π where surveyor is placed on a mound or at edge of rock leading to underestimation (Figure 3). Due to gamma-rays travelling for hundreds of metres through air, note must be taken that even distant topographical features can influence the results. Figure 4 shows how, as readings are taken approaching a small granodiorite cliff (10 m high), there is a steady increase in the total gamma count due to the influence of the cliff. This phenomenon is particularly important where some readings may be taken in valleys or cirques surrounded by slopes of 100 s of metres; on the other hand, readings on ridge crests may not be as subjected to such sources of error. Careful noting of any field conditions that may affect the results should be taken, and then compared with the data during analysis to avoid any spurious conclusions over anomalously high results.
Figure 3. Schematic cross-section of rock outcrop showing different possibilities for the locations of gamma-ray readings. Location (a) would collect readings from an area of >2π so would overestimate results, location (b) is next to a ledge so would collect readings from an area <2π and underestimate gamma-ray counts. Location (c) is a relatively flat section of outcrop more than a meter away from ledges; this would likely be a 2π area where the results are not affected by topography.
Energies 07 04757 g003
Figure 4. Total gamma counts taken on a beach at the Solway Firth, SW Scotland (54°51′15′′N, 3°40′59′′W). Red dots indicate locations that gamma-ray readings were taken; red line indicates gamma-ray dose rates at each location showing gradual increase in counts as granodiorite cliff approached.
Energies 07 04757 g004
The data also need to be corrected for the interference of photons derived from the decay of thorium and uranium in the “count windows” of the other heat producing radioelements. Correcting for this is done in spectral analysis, one method is “stripping” [30,58,59,60] but principle component analysis and least square fitting analytical techniques are also used regularly. Count windows are the energy levels at which photons from a particular element in the decay series create distinctive peaks. An example of such peaks that may be used are shown in Figure 5, and correspond to 208Tl (2.62 MeV) in the thorium decay series, 214Bi (1.76 MeV) in the uranium decay series, and 40K (1.46 MeV) for potassium. Figure 5 also highlights how photons from the decay series of thorium interfere in the uranium and potassium windows, and how photons form the decay series of uranium interfere in the potassium window. This interference is partly due to photons scattering as they travel through a medium; the scattering reduces the energy of the moving photons, and/or creates new photons of lower energy. Interference also occurs due to other gamma-ray emissions from the decay series. For uranium, stripping can be done by assessing the ratio of the count of scattered thorium photons in the uranium window (1.76 MeV) with the count in the thorium window (2.62 MeV). The same process strips the scattered uranium and thorium photons in the potassium window (1.46 MeV). These scattered photon counts are subtracted from the total window counts to get the true count produced by 214Bi in the uranium window and 40K in the potassium window.
The counts corrected by stripping in the respective windows can then be used to estimate the concentrations in parts per million of uranium (Uppm) and thorium (Thppm) and the percentage by weight (K%) of potassium. To do this, gamma-ray surveyors are calibrated at concrete pads which are doped with a known concentration of potassium, uranium, or thorium [30]. These pads are used both to determine the stripping characteristics of a scintillation crystal and to estimate its sensitivity. Such calibration is required because each scintillation crystal will react differently to bombarding photons; producing different counts for the same radioelement concentration.
Figure 5. Figure showing typical counts of different energies produced by scattering of photons produced by the decay of thorium and uranium with daughters, and potassium. The distributions of energy photons demonstrate how thorium daughters produce photons in the uranium and potassium window and uranium daughters produce photons also in the potassium window. Figure adapted from [49].
Energies 07 04757 g005

4.2. Heat Production

Once reliable values for K%, Uppm, and Thppm have been obtained, these values can be used to calculate the heat that is being produced by the radioactive decay in the rock (i.e., the radiogenic heat production). Heat production (HP) can be found using Equation (1) which was developed by calculating the energy released during alpha, beta, and gamma decay of the radioelements [40,41]:
HPWm−3) = ρ (0.035CK + 0.097CU + 0.026CTh)
where: ρ is rock density (kg m−3), CK is concentration of potassium by % weight, Cu and CTh are concentration of uranium and thorium in ppm.
In Equation (1) each of the radioelement concentrations are multiplied by a numerical constant. These constants reflect the differing contributions to the radiogenic heat production of each radioelement; in nW per kg of rock per unit of potassium, uranium or thorium. The constant for uranium (0.097) is more than double the constants for potassium (0.035) or thorium (0.026); reflecting the dominant role that uranium has in producing heat compared with thorium or potassium. In fact, it is the alpha decay of uranium which provides most of the radiogenic heat production [41]. This means that often granites with high U/Th ratios tend to have favourable radiogenic heat production properties [10,61]. However, when U/Th ratios are 0.25, then cumulatively U and Th produces similar amounts of heat. It is important to note that Equation (1) relies on the assumption that there is a fixed ratio between the daughter products used to estimate eU and eTh. However, the various daughter products of uranium and thorium have differing mobility properties under reducing or oxidizing conditions; i.e., some daughter products may be transported away from the rock over time. This would result in disequilibrium meaning that there could truly be a higher or lower concentration of uranium or thorium than is indicated by the gamma surveyor. Disequilibrium occurs when discrepancies exist in the ratios between parent isotopes and daughter products. Due to differing leaching rates from the subsurface, certain daughter products can be preferentially removed or remain relative to the parent atom (U235, U238, Th232). Such mobilization and leaching of daughter products can mean the detected radioactive decay not be proportional to the amount of uranium or thorium in the rock. This effect is most prominent in the U decay series which is mobile under oxidizing conditions but is precipitated under reducing conditions [62] (resulting in some ocean originated black shales having very large U concentrations [41]). Radium [28] and radon in particular due to it being a gas can also be causes of disequilibrium due to both being mobile and part of the uranium and thorium decay series. It is important to stress that the gaseous highly mobile state of radon means if a post radon decay of the uranium series is used to determine eU, then the likelihood of disequilibrium is high enough that it makes it questionable whether it is accurate to use the full decay series for the calculation of heat production. Supplementary work may be required to examine the state of radon loss in the decay series to produce a reliable heat production value. Uranium is of particular interest for disequilibrium because it is the dominant producer of heat compared to potassium or thorium.
The dominant role that uranium plays in heat production is highlighted in the graphs in Figure 6. Figure 6 shows three graphs showing K%, U (ppm), or Th (ppm) against calculated heat production. The data was taken from the survey described in Section 6. The graphs in Figure 6 demonstrate the strong correlation between uranium concentration and heat production, compared with the weaker correlations with thorium and potassium concentration.
Figure 6. Heat production versus potassium, uranium, and thorium concentrations, for data collected during the Scottish case study described in Section 6.
Energies 07 04757 g006

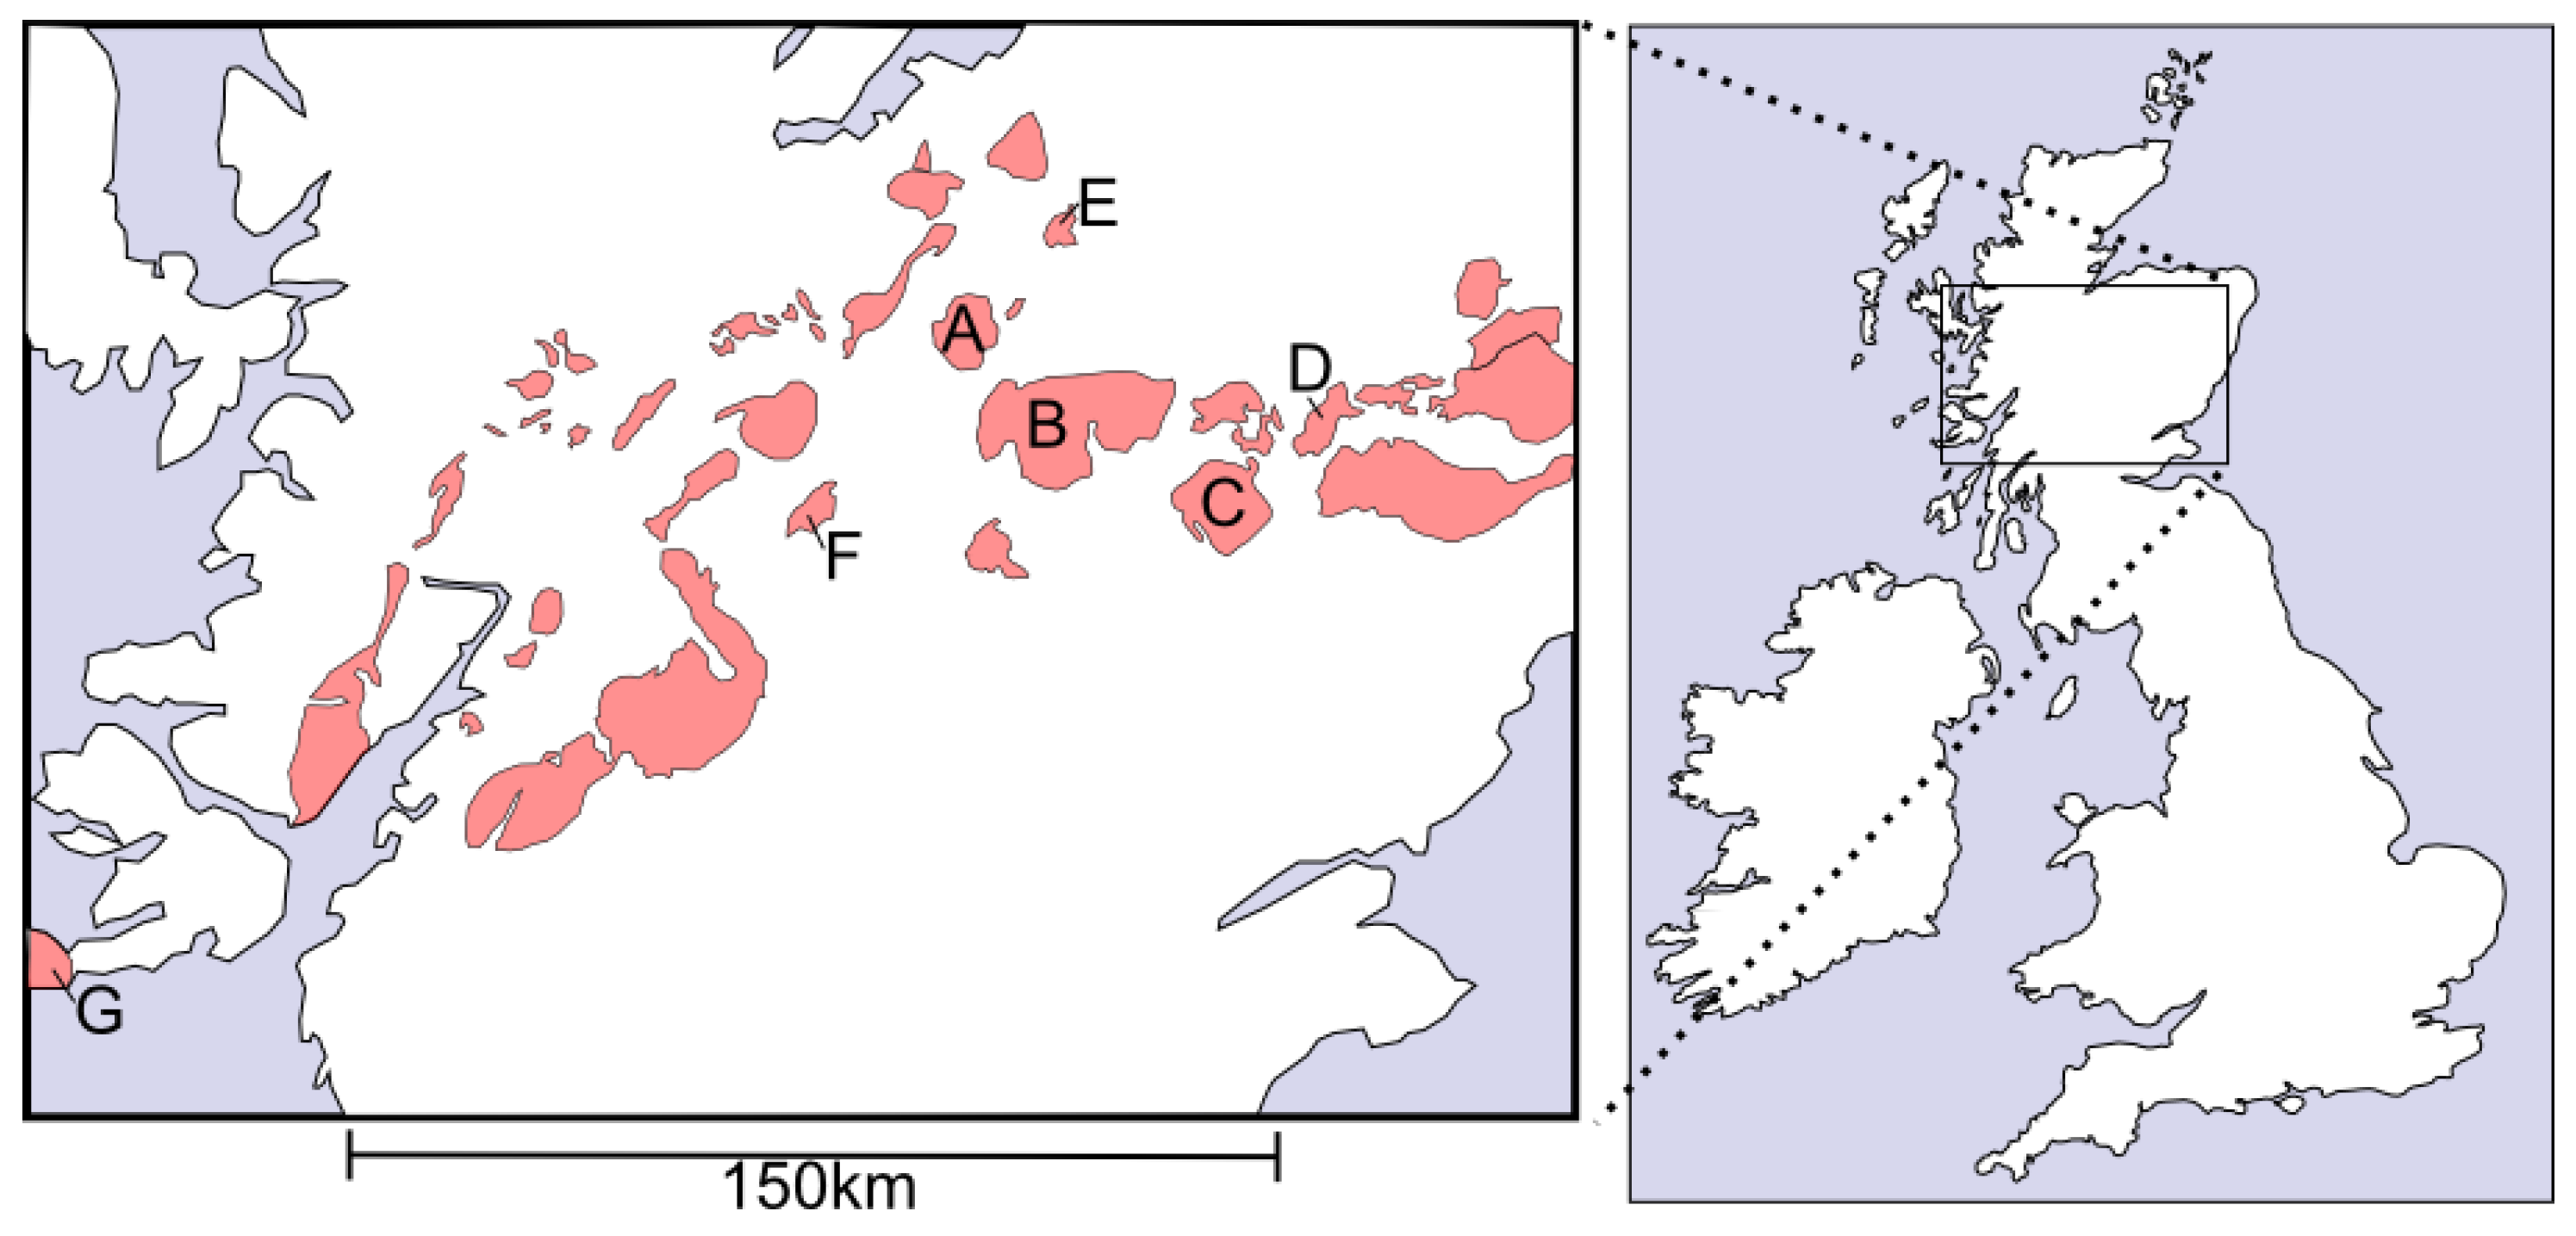
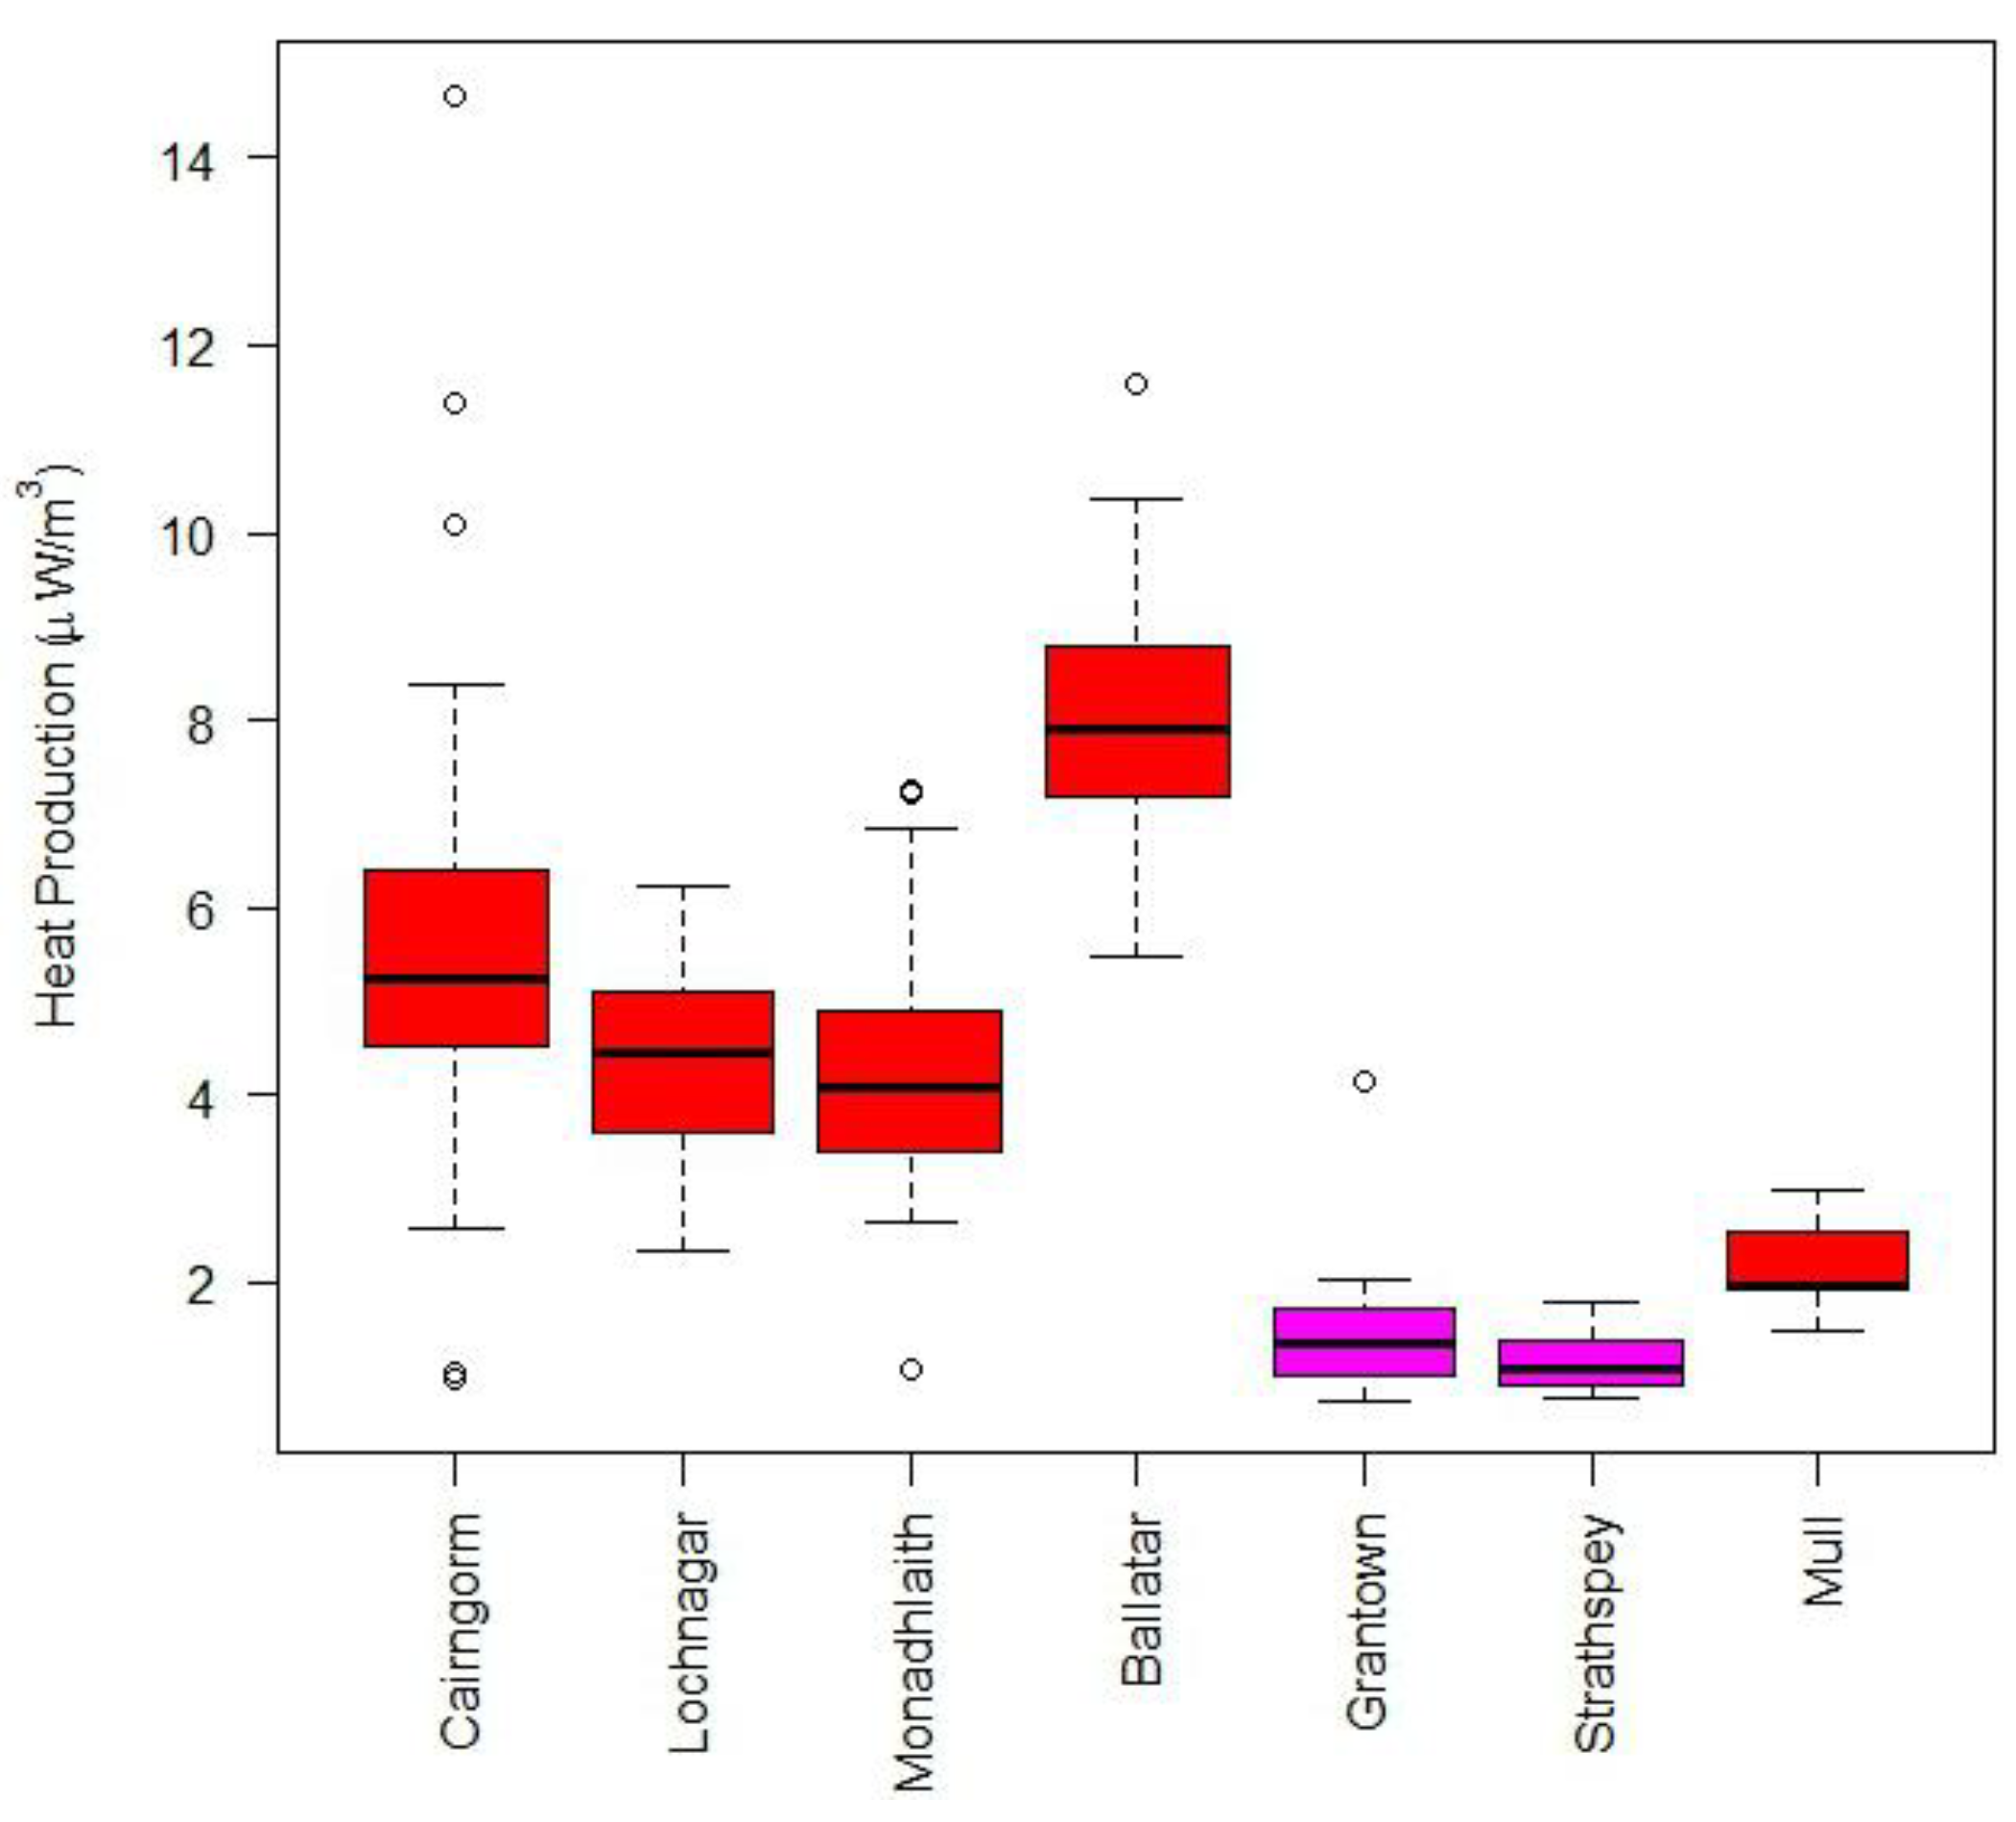
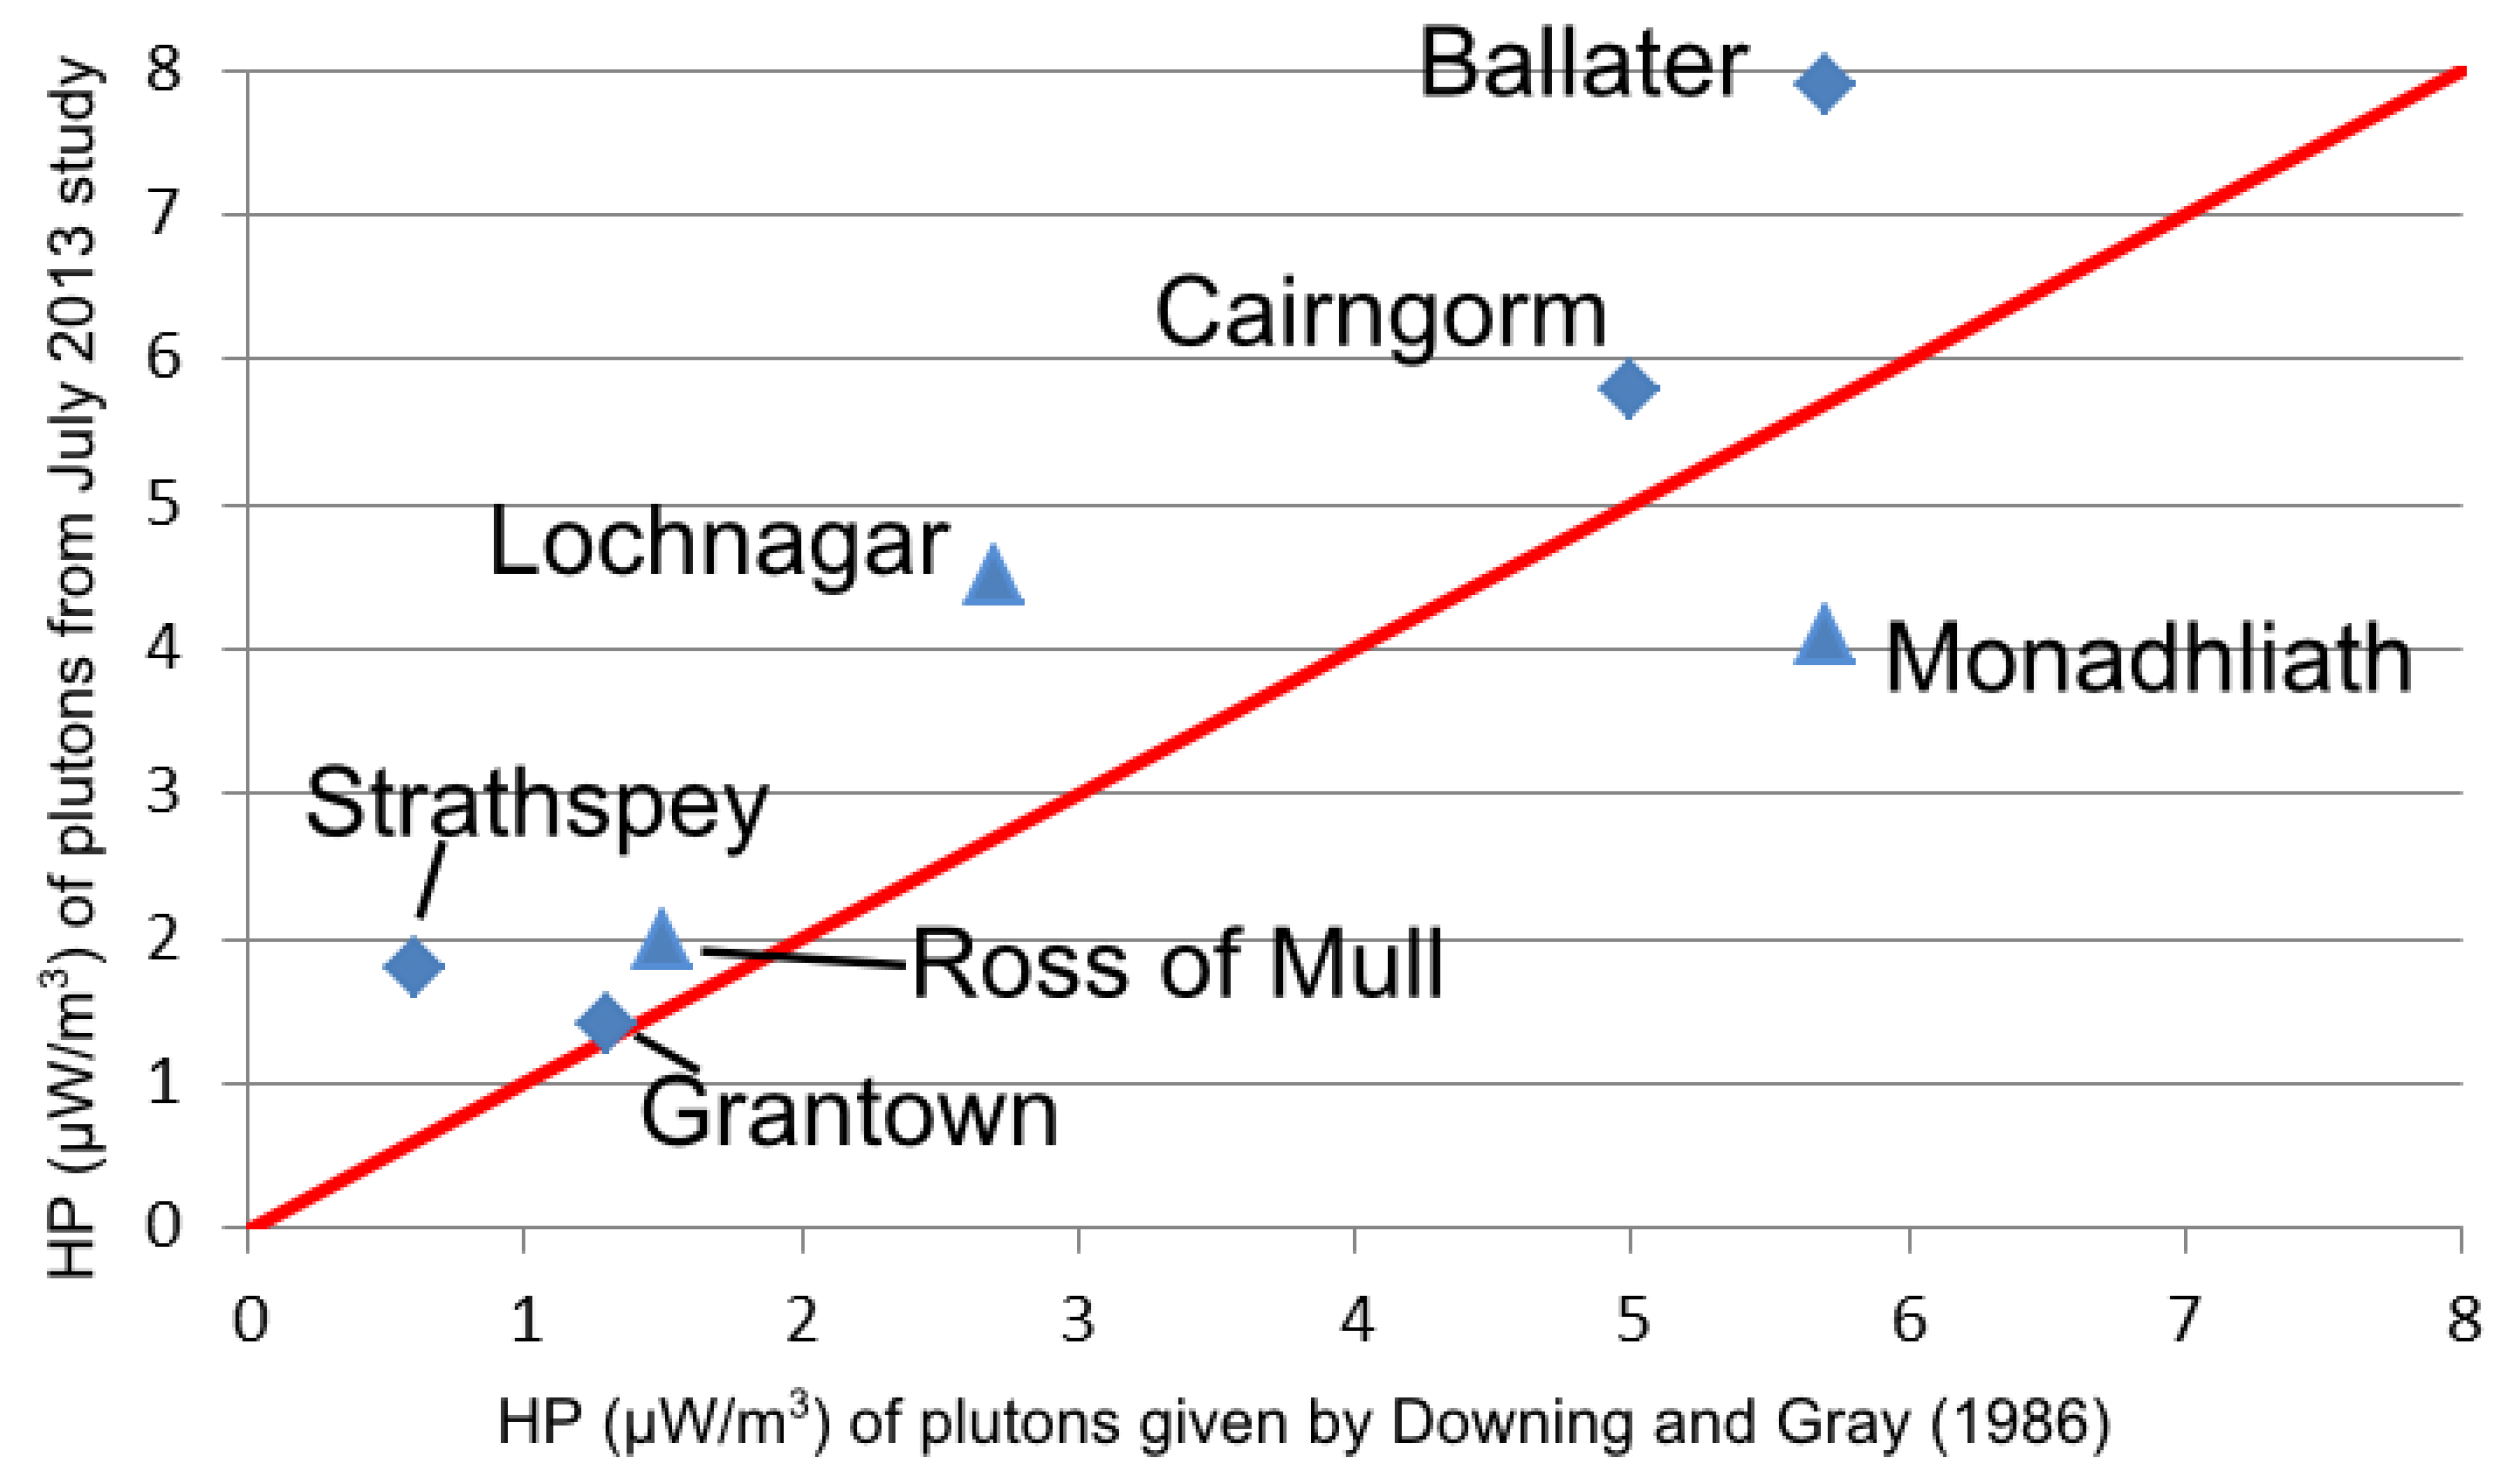
5. Case Study from Scotland

During July 2013, we conducted an in-situ survey over several Scottish granite plutons using a portable gamma-ray surveyor. The aims of the survey were: (i) to re-evaluate the radiogenic heat production of the granites; and (ii) to allow comparison between results from the portable gamma-ray surveyor and previous lab-based investigations.
A GAMMA SURVEYOR II (GSII) instrument (made by GF Instruments in Brno, Czech Republic) was used for the in-situ survey. The detector in the GSII is a Bismuth Germanate Oxide with a volume of 20 cm3. The analyser measures 1024 different channels between 0.03 and 3 MeV. The surveyor weighs 1.8 kg and is compact and lightweight enough for it to be readily carried in a small rucksack [50] which is important in the highly mountainous terrains which granite often gives rise to.
Seven plutons were visited in total, six of the plutons in the Grampian region of Scotland; Monadhliath, Cairngorm, Lochnagar, Ballater, Grantown, and Strathspey, and one pluton on the Isle of Mull (the Ross of Mull granite). These plutons were selected for their previously identified high heat production [3], close to areas of high heat demand and with clear areas of exposure visible from aerial photographs.
To minimise topography-related errors (e.g., Figure 3), sample locations were chosen for having several square metres of exposed granite which were relatively flat. The GSII was placed on the surface of the granite as far as possible away from large open fissures and other voids that could influence results. Figure 7 shows a typical fracture outcrop where the GSII is placed in the centre of an intact block of granite away from fissures. Notes were made during measurements of any identifiable features which might influence measurements. No average point density was aimed for during the surveys because survey points were dictated by suitably exposed intact granite and accessibility. Therefore, in some areas, a higher density of points (spaced at tens of metres) could be achieved and in other areas exposures were separated by several hundred metres of peat cover.
Figure 7. An example of where the largest section of intact granite was chosen to place the gamma surveyor II (GSII), away from the perpendicular fractures. For scale, the GSII is 28 cm long and 9 cm wide.
Energies 07 04757 g007
Three measurements were taken at each location to ensure the results were not affected by anomalies in the internal algorithms in the GSII. The vast majority of times this was not necessary, but the repeated measurements did provide extra confidence in the results particularly when readings were unusually low or high. Each measurement lasted 3 min, a period previously established as adequate for a reliable sample of rocks with similar counts per second as granite [46,63], albeit measurement times can be shorter in high activity areas or longer in lower activity areas such as metamorphic basement [26]. To ensure 3 min measurements were long enough to be reliable we checked against half hour measurements (Figure 8), obtaining reassuringly similar results. All 3 min measurements were within 10% of the 30 min measurement; except for one 3 min reading which was 11% lower than its equivalent 30 min reading. Such close correlation confirms that there would be no useful improvement in accuracy to taking significantly longer for such moderately radioactive material.
Figure 8. Graph showing excellent correlation between the 30 min and 3 min readings taken at the same location.
Energies 07 04757 g008
The survey identified the Cairngorm and the Ballater granites as particularly high in heat production (Figure 9) with values of 5.7 ± 2.6 μW/m3 and 8.2 ± 1.5 μW/m3, respectively. A general convention in geothermal exploration is that anything above 4 μW/m3 is considered as high heat production and thus a potentially economic heat resource. We believe this threshold is derived from old imperial units of radiogenic heat production (10−13 cal/cm3·s), as in those units 10 × 10−13 cal/cm3 is equivalent to 4.18 μW/m3 (i.e., ≈4 μW/m3). However, such a convention may not be useful in many circumstances as local geology can mean a viable heat resource exists even with lower values of radiogenic heat production, due to covering “duvet layers”. The Lochnagar and Monadhlaith granites both have median heat values of HP above 4 μW/m3 so could also host viable heat resources. The Grantown granite has a low heat production value because it is an “S-type” granite, i.e., one which formed primarily by the melting of sedimentary rocks. The Strathspey and Isle of Mull plutons both show low heat production, and thus are unlikely to be good targets for further geothermal resource investigation. Ultimately, it is the heat flow and geothermal gradient, in addition to permeability, which would determine the suitability of a rock for geothermal production. However, rocks of high heat production have been correlated with areas of high heat flow [3,64], for example in North West Scotland and South East England zones of high heat flow exist over high heat production granites, and so can be considered an important aspect of the exploration and appraisal process.
The spread of heat production values in Figure 10 demonstrates the importance of gathering numerous data from a pluton during surveys. More data means that any outliers (whether low or high) can be identified, so they do not unduly skew results, preventing a pluton from being wrongly categorized as having either high or low heat production. Such anomalous values of heat production could sometimes be attributed to observable features such as hydrothermal alteration which may have leached radioelements or dykes of other material intruded into the granite. However, granite plutons are not homogeneous but have varying composition due to magma mixing, assimilation of country rocks, fractional melting, fractional crystallization, water activity, and the pressure and temperature pathways of magma evolution [65,66,67,68,69]. Such differing composition results in variation of radiogenic properties across the pluton. This survey did not have sufficient sample density coverage to be able to determine zones in the plutons of higher or lower heat production related to past geological processes; such as crystallisation. An aim of future investigations targeting the granites of higher heat production could be to explore the heat production variation within the granite; if such information was considered favourable to characterising the geothermal resource.
Figure 9. Locations of the studied granite plutons: Monadhlaith (A), Cairngorm (B), Lochnagar (C), Ballater (D), Grantown (E), Strathspey (F), Ross of Mull (G).
Energies 07 04757 g009
Figure 10. Box plot showing measured heat production from Scottish granite plutons. The horizontal center line in each box shows the median heat production from each pluton, the edges of the boxes are the first and third quartiles, i.e., 50% of the data lies within the box. The whiskers extending beyond the boxes contain data which are within 1.5 times the interquartile range, and data out with this range are plotted as hoops. There are 37 readings from the Cairngorm Pluton, 34 from the Lochnagar Pluton, 22 from the Monadhliath Pluton, 19 from the Ballatar Pluton, seven from the Grantown Pluton, five from the Strathspey Pluton, and seven from the Ross of Mull Pluton.
Energies 07 04757 g010
The results of the July 2013 portable gamma-ray spectrometry survey show good correlation with collated results from previous lab-based surveys [3] (Figure 11). The data from these laboratory test were collected by taking rock samples from shallow (<300 m depth) boreholes and outcrops, which were then analysed using lab-based gamma-ray spectrometry techniques [36,70]. Although the two surveys show variation of the heat production for many of the plutons, both agree on which plutons have high heat production of >4 μW/m3 (Ballater, Cairngorm, Monadhliath, Lochnagar) and those with low heat production of <4 μW/m3 (Strathspey, Grantown, Ross of Mull). This establishes that although in-situ studies may lack the precision of lab based work, they can quickly and simply provide an accurate portrayal of the heat production in a geothermal exploration area.
Figure 11. Graph showing correlation between original study of Scottish granites (Downing and Gray: x-axis) and new data from July 2013 portable gamma spectrometer survey (y-axis). Blue triangles are plutons where Downing and Gray (1986) [3] cautioned that not enough data were collected for confidence in the calculated heat production value. Red line is x = y, for ease of comparison of results.
Energies 07 04757 g011
The July 2013 survey demonstrates how portable gamma-ray spectrometry can be used to gain quick results that give an initial indication of which plutons may have high radiogenic heat producing properties. The survey was conducted over one month by two people and would have been able to provide reliable first estimates of radiogenic heat productions of the granites in a previously unexplored area. This information could be used to target more comprehensive studies later on.

6. Discussion

6.1. The Geothermal Targets of Gamma-ray Surveying?

Section 6 showed an example of how portable gamma-ray spectrometry can be used to screen granite plutons for further evaluation of their geothermal potential. However, gamma-ray spectrometry can have more of a role to play; even just within analysis of the radiogenic heat production of a single granite pluton. For example, plutons commonly comprise concentric rings of different types of granite, e.g., the Criffel Pluton in Southeast Scotland [65,67]. These zones may have significantly different geochemistry due to fractionation processes during emplacement; such zones could therefore have higher or lower radiogenic heat production properties. This could result in a single radiogenic heat production value for a pluton being fairly meaningless. Even within a relatively homogeneous granite pluton there are likely to be small discrete zones of unusually high or low radiogenic heat production. This is shown in Figure 10, where the high outlier in the Cairngorm granite faded to a median value several meters away but there was no visual clue as to why this should be such a hot spot. By increasing the density of readings over a larger expanse of granite, such outliers can be better identified ensuring they do not inaccurately skew the calculated radiogenic heat production of the granite pluton upwards. Such hot spots could be of particular concern for determining the radiogenic heat production of concealed granite; where samples are confined to the borehole track through the granite. There remains opportunity for further research to be able to improve understanding of the link between heat production properties with chemistry and pluton genesis; with one aim being improved targeting of high heat production zones in concealed granite.
Sedimentary basins can be areas of elevated heat flow [3] which coupled with the favorable permeability of sandstone layers can make potential mid/low enthalpy geothermal targets. Such sedimentary basins will also typically have a significant argillaceous component; that is mudstone or shale layers. Mudstone and shale can contribute to the geothermal prospects of sedimentary basins in two ways: Firstly, they may act as a “duvet rock” allowing heat to build up in the sandstone below due to the low thermal conductivity of mudstone or shale [7]. Secondly, mudstone and shale can have higher radiogenic heat production than most other sedimentary rocks [71], possibly due to unusually high uranium concentrations [41]. Gamma-ray spectrometry would be able to identify heat producing mudstones from wire-line logging in boreholes or from surface surveys where outcrops are available. We found no reports in the literature of research into or development of the geothermal potential of such high heat producing sedimentary systems. There is further opportunity for basic research into high heat producing sedimentary systems to determine whether they may have potential as a viable geothermal resource.
These examples of survey targets show the adaptable and variable way gamma-ray spectrometry surveys can be used. It is also clear that there are further improvements and research to be made in geothermal resource evaluation using gamma-ray spectrometry. When heat production is likely to be important to the geothermal resource of an area, then a gamma-ray survey is likely to be able to provide useful data on the heat production properties.

6.2. General Guidelines for Gamma-ray Surveying in Geothermal Exploration

Gamma-ray spectrometry surveys can seem a daunting task with the myriad of options available for surveying and all the potential sources of bias. However, gamma-ray spectrometry has an established history, during which many changes and improvements have been made. Sensitivity improvements in the 1940s were made when scintillation detectors were developed [42]. Soon after this, the first airborne surveys were conducted for uranium exploration in the late 1940s and 1950s [72]. Lab and in-situ surveys were conducted for mineral exploration and environmental monitoring [59,73,74,75]. Further improvements in multi-channel analyzers, digitization, and data processing increased the ease of use of spectrometers as well as improved portability allowing detailed surveys to be made of complicated rocks [20,46] with real time data analysis [76]. For airborne surveys, improvements allowed rapid calibration of aerial data with calibration sites and improved spectral analysis [45]. Such an established history means that prior to conducting a survey using gamma-ray spectrometry techniques then previous experience can be called upon to ensure new surveys gain the most accurate data possible.
For ground-based portable gamma-ray spectrometry surveys, Table 1 shows specific tasks that should be taken into account when planning a survey. These are partly based on experience gained during the Scottish case study example in this paper.
For an airborne gamma-ray spectrometry study, general outlines have been previously described [42] with a wealth of literature [77]. Many considerations in Table 1 also relate to airborne surveys. In addition to these, Table 2 shows a sample of tasks more specific to airborne surveys.
Table 1. Tasks worth considering during a ground based portable gamma-ray spectrometry study with examples of where the decisions may have an impact.
TaskExample
Specify AimsIs this survey as a first estimate of radiogenic heat production or to gain more details of its distribution within a single pluton?
Extent of survey areaAerial surveys may be favourable if the survey area is particularly extensive.
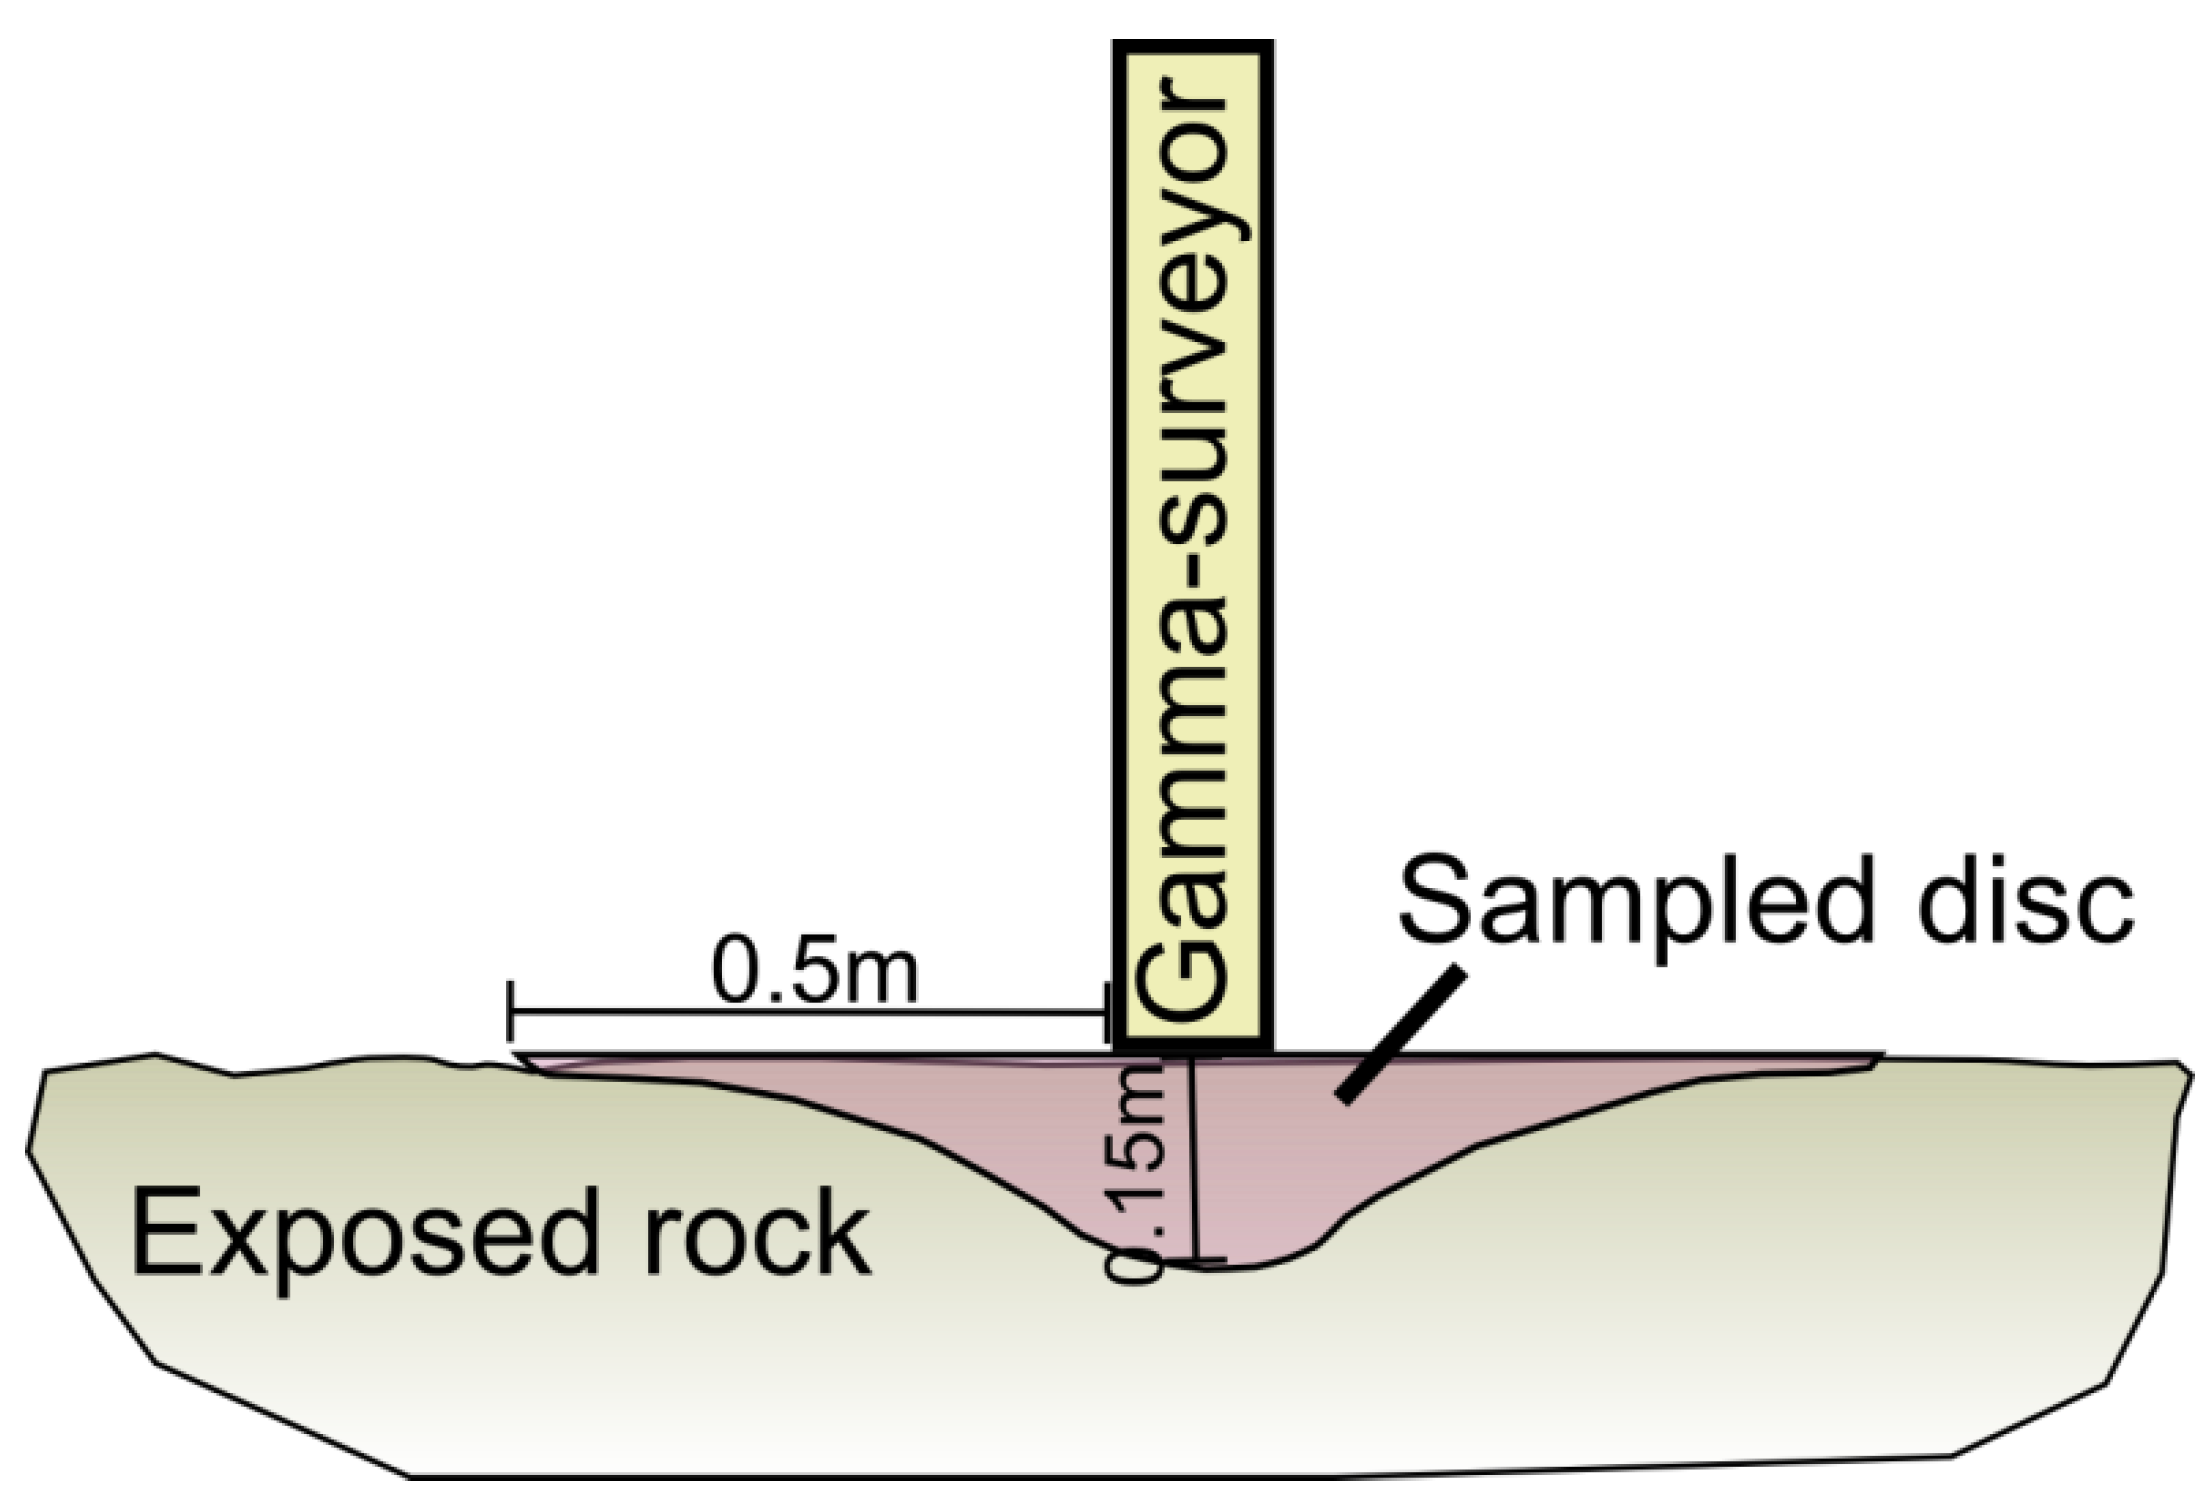
Sizes of individual sample areasFor portable surveys the surveyor can be placed on the ground gaining an effective circular sample area with a diameter of one metre. Holding the surveyor one metre above ground gains a sample area with a diameter of 10 metres [59].
Key lithologies to be targetedAre all the rock types that may have radiogenic heat production included in the survey plan?
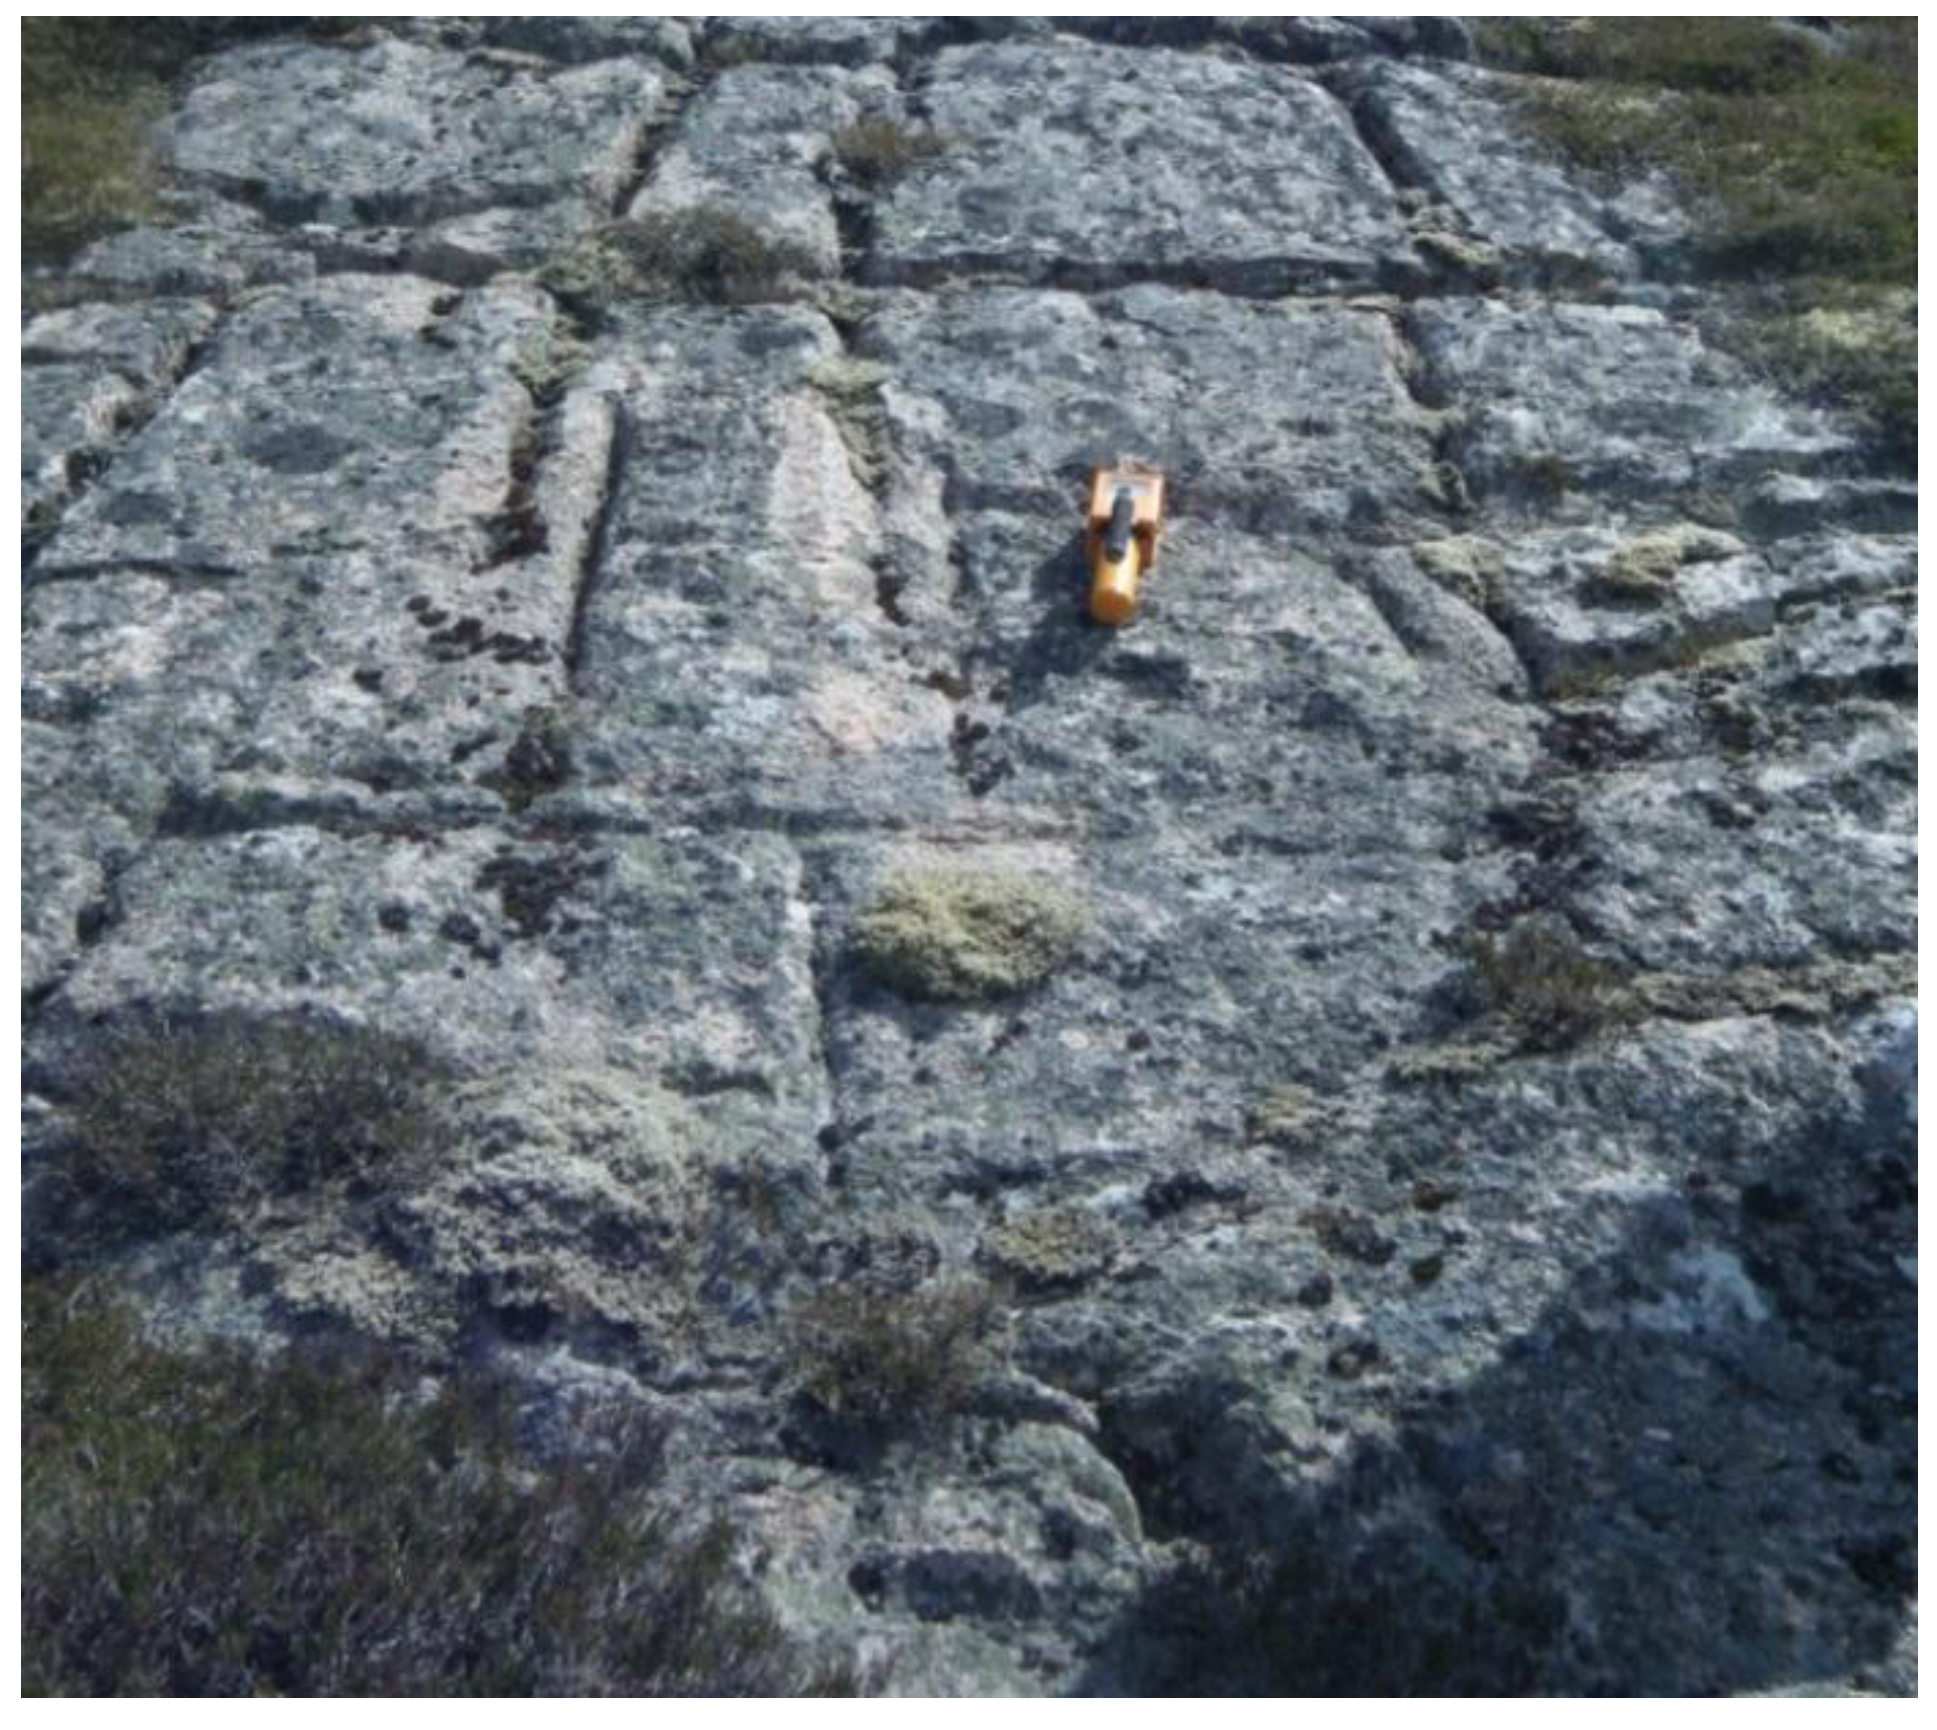
Availability of rock exposureIn the Scottish case study, higher altitude plutons generally had much more exposed area than lower plutons, which tended to be mantled with peat bog.
Easy access routes to exposureTracks due to other land use can be used to get to exposure, use of these can be incorporated into the survey design e.g., sample spoke lines coming from a driveable track.
Land accessGamma-ray spectrometry surveys may cover an area which has different land uses or owners; in Scotland it is not advisable to conduct a portable survey near deer hunting areas in the shooting season.
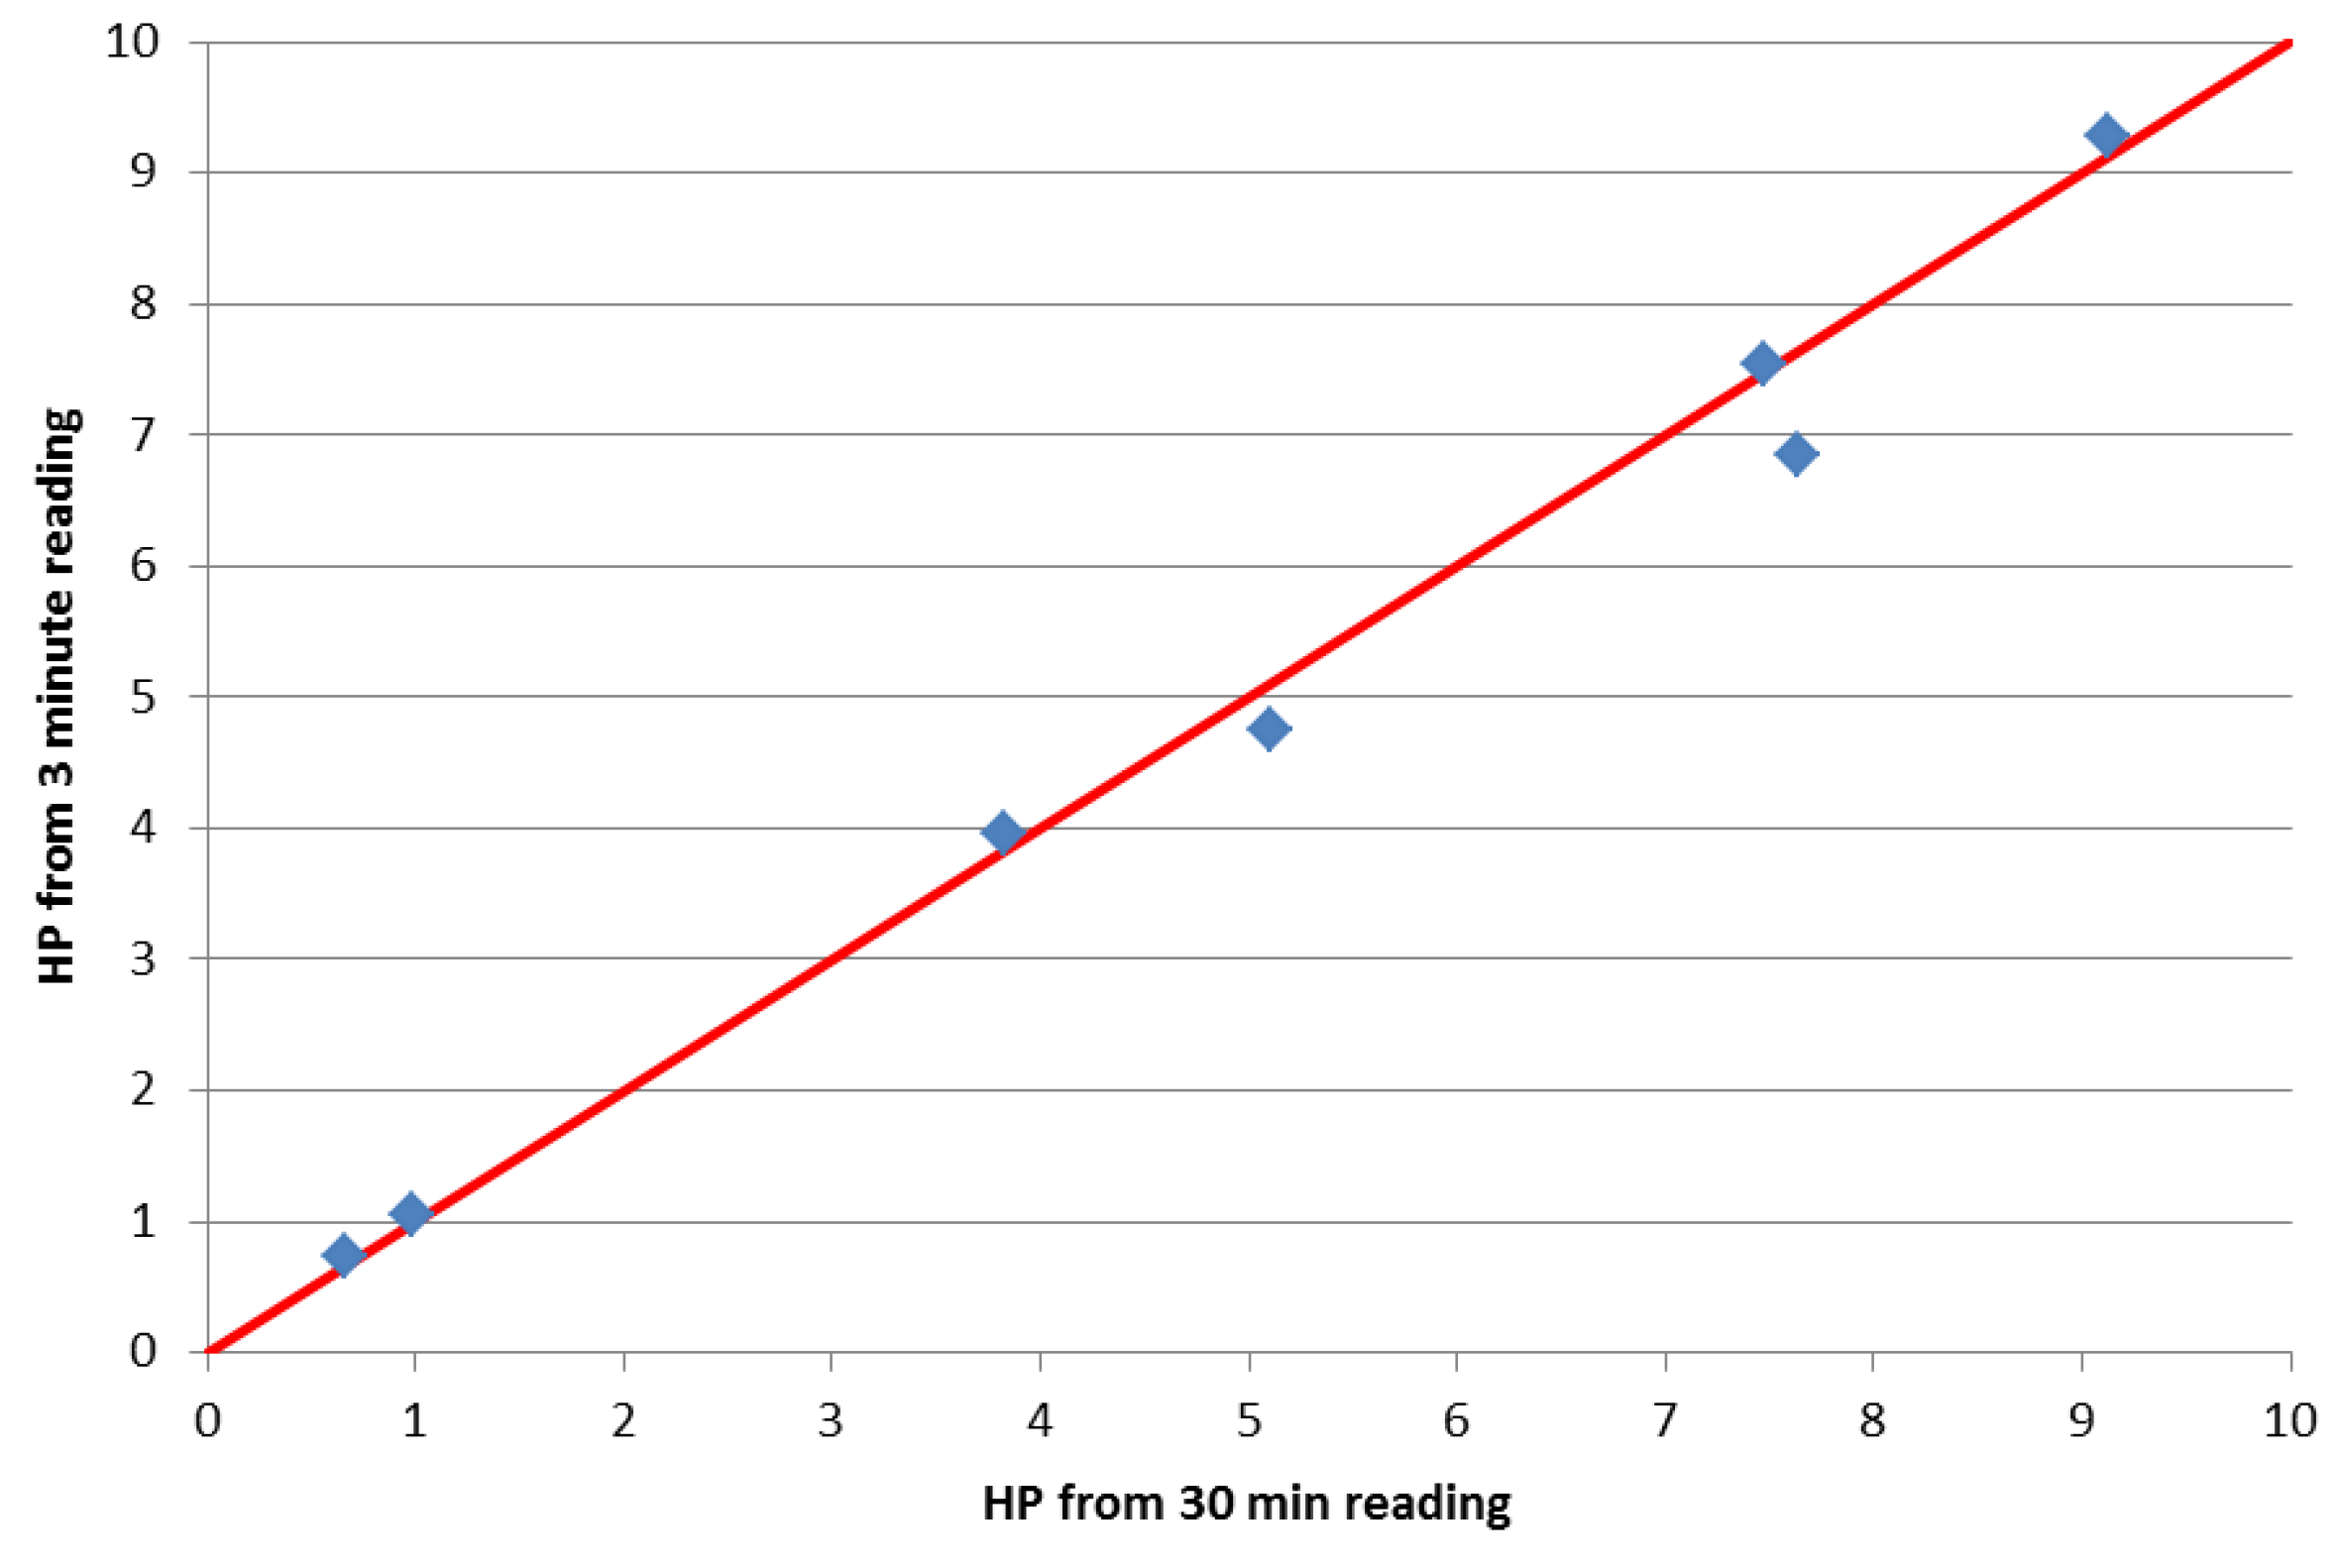
Repeated readings and length of readingsShould all readings be repeated or only a small sub-sample to check reliability of results? Depending on dose rate longer or shorter count times may be appropriate.
Features to survey near (e.g., faults)Some features may have an influence on the radiogenic heat production, e.g., hydrothermal alteration around faults. Depending on the aims of the survey these could specifically be targeted or avoided so these results do not interfere with gaining an overall representative value of a pluton’s radiogenic heat production.
Target areas for background readingsIdentify bodies of freshwater, if available, to get background readings.
Density of readings/resolution of surveyIf there is a limited time, to gain an overall value for radiogenic heat production of a pluton, readings should be sparser. If there is need to understand the varied distribution of radiogenic heat production across a pluton then a tighter survey grid may be more appropriate.
Table 2. Tasks worth considering during an airborne gamma-ray spectrometry study.
TaskExample
Determine distance between flight linesHigher concentrations of flight lines may cover the survey area more comprehensively but will decrease the area that can be covered in a limited time.
Ground SpeedAs for line spacing, survey speed is a compromise between data quality and available time.
Altitude of surveyReduced ground clearance results in more spectral information—you get less atmospheric scatter and higher count rates. Generally, higher surveys can be flown faster (less worries for the pilot re: ground obstacles such as power lines), there is usually less radon at height (though not always) and the data are less susceptible to topographic effects and small variations in altitude.
Refuel pointsIf refuel points near to the survey area can be arranged with local landowners, then more time can be spent conducting the survey rather than journeying back and forth to base.
Ground calibration sitesWhen conducting an airborne survey then local calibration areas allow checking of the instrument sensitivity to ensure it is not drifting during the survey [32,44,45].
Detector backgroundThis comprises internal activity in the detector and aircraft, cosmic radiation and radon. Flying over clean bodies of water allows this background to be recorded but there is still scope for radon background to vary with location. “Upward” facing detectors help with this by measuring radiation from the air above the aircraft due to radon.
TopographyHelicopters may be better choice in rough terrain than aircraft as they can more effectively follow the topographical changes.
As with many forms of surveying, the precise nature and scope of a gamma-ray survey depends upon the aims, objectives, and available outcrops in addition to budgetary constraints. Which is why “Specify Aims” is first in the list of checkpoints; the rest of the study design is dependent upon what these aims are. In this paper, we showed an example of a portable survey which aimed to generally categorize Scottish granite plutons of lower or higher radiogenic heat production. The results corroborated a previous lab based study; showing the reliability of a rapid surface study to categorize the radiogenic heat production of granite plutons. However, if the aim of the survey was to categorize in detail only, say, the Cairngorm Pluton, then choices for the reading density, lithology targets etc. would have been quite different. If the target lithology of a survey is a concealed granite (buried under several hundred metres of sediment [8,10]), then a borehole survey or collecting drill-core for lab analysis are the only available options, since any gamma-ray radiation given off the concealed granite will be shielded by only a few metres of sediment cover. Spectral gamma-ray logging is routinely performed by service companies. Airborne surveying gains data from a large area in a relatively short amount of time. The costs of chartering aircraft are not trivial and some surveyors stress the need for calibration of airborne in-situ tests with ground-based or lab tests [23,45,78,79]. Due to sediment cover, then airborne studies may estimate radiogenic heat production to be around half that of lab or ground-based surveys [78]. Nevertheless, airborne studies which had designated calibration sites showed self-consistency between airborne surveys and accompanying traditional ground surveys [32,33].
In this paper, we have discussed some of the issues surrounding accounting for inaccuracies created by topographical [31], distributional [44] and series disequilibrium [28] effects during gamma-ray surveying. Topographical corrections [31] rely on a homogenous medium assumption which suffers when the spatial distribution of gamma-ray production is investigated [44]. Further work could bring together these different influences as a useful improvement in the accuracy of in-situ gamma-ray spectrometry, particularly if it is possible to account for the varying gamma-ray half-lengths introduced by heterogeneous material. Additionally, disequilibrium appears to often be acknowledged during gamma-ray spectrometry but less often can be quantitatively accounted for during the scope of a study. There is additional scope for research to constrain which geological processes may make different series disequilibrium more likely and from this provide simplified estimation for accounting for disequilibrium during gamma-ray spectrometry surveys.

7. Conclusions

Gamma-rays are particularly useful, when surveying for radioelements contained within rock, due to their penetrating properties. This allows collection of a sample of the concentrations of potassium, uranium, and thorium from which the heat production (μW/m2) can be calculated.
Many different types of gamma-spectrometers may be used; use may depend on whether the survey is in-situ—either ground based or airborne—or samples collected and analysed in a laboratory.
Portable gamma-ray surveying has been deployed as a quick but effective technique for determining granite plutons of high heat production in Scotland. The survey allowed high heat production granite to be identified which may warrant further investigation.
Gamma-ray spectrometry will be vital for further research into the zonation of heat production in granite. In addition, the technique will be deployed when investigating sedimentary rocks which may have high heat production (e.g., some mudstones) enhancing the heat flow within basin settings.
Gamma-ray spectrometry has been shown to have played a useful role in past geothermal exploration. The technique is likely to stay relevant in the future as it remains a quick and cost effective way to assess the radiogenic heat production properties of any rock. When compared with the costs of a poorly placed drill-site, the surveys more than show their worth.

Author Contributions

Primary drafting of the paper was by Alistair T. McCay (60%), with contributions of material and editing by all other authors (10% each).

Conflicts of Interest

The authors declare no conflict of interest.

References

  1. Shevenell, L.A.; Garside, L.J.; Hess, R.H.; Chaney, R.L.; Tingley, S.L.; Snow, J.H.; Meeuwig, R.O. Nevada Geothermal Resources; Nevada Bureau of Mines and Geology: Reno, NV, USA, 2003. [Google Scholar]
  2. Mogi, T.; Okada, S. Gamma-ray spectra survey in geothermal area. J. Geotherm. Res. Soc. Jpn. 1990, 12, 295–309. [Google Scholar]
  3. Downing, R.A.; Gray, D. Geothermal Energy: The Potential in the United Kingdom; Her Majesty’s Stationery Office: London, UK, 1986. [Google Scholar]
  4. Kappelmeyer, O.; Gérard, A.; Schloemer, W.; Ferrandes, R.; Rummel, F.; Benderitter, Y. European HDR project at soultz-sous-forêts: General presentation. Geotherm. Sci. Technol. 1991, 2, 263–289. [Google Scholar]
  5. Häring, M.O.; Schanz, U.; Ladner, F.; Dyer, B.C. Characterisation of the basel 1 enhanced geothermal system. Geothermics 2008, 37, 469–495. [Google Scholar] [CrossRef]
  6. Wyborn, D. Update of development of the geothermal field in the granite at Innamincka, South Australia. In Proceedings of the World Geothermal Congress, Bali, Indonesia, 25–30 April 2010; pp. 25–29.
  7. Midttomme, K.; Roaldset, E.; Aagaard, P. Thermal conductivity of selected claystones and mudstones from england. Clay Miner. 1998, 33, 131–145. [Google Scholar] [CrossRef]
  8. Chopra, P.; Wyborn, D. Australia’s first hot dry rock geothermal energy extraction project is up and running in granite beneath the cooper basin, ne south australia. In Proceedings of the Ishihara Symposium: Granites and Associated Metallogenesis, Sydney, Australia, 22–24 July 2003; pp. 43–45.
  9. Baisch, S.; Weidler, R.; Vörös, R.; Wyborn, D.; de Graaf, L. Induced seismicity during the stimulation of a geothermal HFR reservoir in the Cooper Basin, Australia. Bull. Seismol. Soc. Am. 2006, 96, 2242–2256. [Google Scholar] [CrossRef]
  10. Manning, D.; Younger, P.; Smith, F.; Jones, J.; Dufton, D.; Diskin, S. A deep geothermal exploration well at Eastgate, Weardale, UK: A novel exploration concept for low-enthalpy resources. J. Geol. Soc. 2007, 164, 371–382. [Google Scholar] [CrossRef]
  11. Cohen, A.; O’Nions, R.; O’Hara, M. Chronology and mechanism of depletion in lewisian granulites. Contrib. Mineral. Petrol. 1991, 106, 142–153. [Google Scholar] [CrossRef]
  12. Kumar, P.S.; Reddy, G. Radioelements and heat production of an exposed Archaean crustal cross-section, Dharwar craton, south India. Earth Planet. Sci. Lett. 2004, 224, 309–324. [Google Scholar] [CrossRef]
  13. Heier, K.; Adams, J. Concentration of radioactive elements in deep crustal material. Geochim. Cosmochim. Acta 1965, 29, 53–61. [Google Scholar] [CrossRef]
  14. Sanyal, S.; Che, M.; Dunlap, R.E.; Twichell, M.K. Qualitative response patterns on geophysical well logs from the Geysers, California. Trans. Geotherm. Resour. Counc. 1982, 6, 313–316. [Google Scholar]
  15. Quinn, T.; Suzukilll, N.-I.M.; Takagim, S. Mineralogy evaluation in a geothermal well using statistical probabilistic log evaluation techniques. Geotherm. Resour. Counc. Trans. 1989, 13, 277–287. [Google Scholar]
  16. Younger, P.; Manning, D. Hyper-permeable granite: Lessons from test-pumping in the Eastgate Geothermal Borehole, Weardale, UK. Q. J. Eng. Geol. Hydrogeol. 2010, 43, 5–10. [Google Scholar] [CrossRef]
  17. Nelson, S.T.; Mayo, A.L.; Gilfillan, S.; Dutson, S.J.; Harris, R.A.; Shipton, Z.K.; Tingey, D.G. Enhanced fracture permeability and accompanying fluid flow in the footwall of a normal fault: The Hurricane fault at Pah Tempe hot springs, Washington County, Utah. Geol. Soc. Am. Bull. 2009, 121, 236–246. [Google Scholar]
  18. Killeen, P. Gamma ray spectrometric methods in uranium exploration—Application and interpretation. Geophys. Geochem. Search Met. Ores 1979, 31, 163–230. [Google Scholar]
  19. Grasty, R. Gamma ray spectrometric methods in uranium exploration—Theory and operational procedures. Geophys. Geochem. Search Met. Ores 1979, 31, 147–155. [Google Scholar]
  20. Myers, K.; Bristow, C. Detailed sedimentology and gamma-ray log characteristics of a namurian deltaic succession II: Gamma-ray logging. Geol. Soc. Lond. Spec. Publ. 1989, 41, 81–88. [Google Scholar] [CrossRef]
  21. Bristow, C.; Williamson, B. Spectral gamma ray logs: Core to log calibration, facies analysis and correlation problems in the Southern North Sea. Geol. Soc. Lond. Spec. Publ. 1998, 136, 1–7. [Google Scholar] [CrossRef]
  22. Davies, S.; McLean, D. Spectral gamma-ray and palynological characterization of Kinderscoutian marine bands in the Namurian of the Pennine Basin. Proc. Yorks. Geol. Polytech. Soc. 1996, 51, 103–114. [Google Scholar] [CrossRef]
  23. Rybach, L.; Schwarz, G.F. Ground gamma radiation maps: Processing of airborne, laboratory, and in situ spectrometry data. First Break 1995, 13, 97–104. [Google Scholar]
  24. Sanderson, D.; East, B.; Scott, E. Aerial radiometric survey of parts of North Wales in July 1989; Scottish Universities Research and Reactor Centre: Glasgow, UK, 1989. [Google Scholar]
  25. Mero, J.L. Uses of the gamma-ray spectrometer in mineral exploration. Geophysics 1960, 25, 1054–1076. [Google Scholar] [CrossRef]
  26. Ray, L.; Roy, S.; Srinivasan, R. High Radiogenic Heat Production in the Kerala Khondalite Block, Southern Granulite Province, India. Int. J. Earth Sci. 2008, 97, 257–267. [Google Scholar] [CrossRef]
  27. Weaver, B.L.; Tarney, J. Lewisian gneiss geochemistry and archaean crustal development models. Earth Planet. Sci. Lett. 1981, 55, 171–180. [Google Scholar] [CrossRef]
  28. Dickson, B.; Scott, K. Interpretation of aerial gamma-ray surveys-adding the geochemical factors. AGSO J. Aust. Geol. Geophys. 1997, 17, 187–200. [Google Scholar]
  29. Stefansson, V.; Gudlaugsson, S.T.; Gudmundsson, A. Silica Content and Gamma Ray Logs in Volcanic Rocks. In Proceedings of the World Geothermal Congress, Kyushu–Tohoku, Japan, 28 May–10 June 2000; pp. 2893–2897.
  30. Lovborg, L. The calibration of portable and airborne gamma-ray spectrometers—Theory, problems, and facilities. Rise Natl. Lab. 1984, 2456, 3–207. [Google Scholar]
  31. Schwarz, G.; Klingelé, E.; Rybach, L. How to handle rugged topography in airborne gamma-ray spectrometry surveys. First Break 1992, 10, 11–17. [Google Scholar]
  32. Sanderson, D.; Cresswell, A.; Lang, J.; Scott, E.; Lauritzen, B.; Karlsson, S.; Strobl, C.; Karlberg, O.; Winkelmann, I.; Thomas, M. An International Comparison of Airborne and Ground Based Gamma Ray Spectrometry. Results of the Eccomags 2002 Exercise Held 24th May to 4th June 2002, Dumfries and Galloway, Scotland; University of Glasgow: Glasgow, UK, 2004. [Google Scholar]
  33. Sanderson, D.; Cresswell, A.; Scott, E.; Lang, J. Demonstrating the European capability for airborne gamma spectrometry: Results from the ECCOMAGS exercise. Radiat. Prot. Dosim. 2004, 109, 119–125. [Google Scholar] [CrossRef]
  34. Hertz, H. Ueber einen einfluss des ultravioletten lichtes auf die electrische entladung. Ann. Phys. 1887, 267, 983–1000. (In German) [Google Scholar] [CrossRef]
  35. Einstein, A. Über einen die erzeugung und verwandlung des lichtes betreffenden heuristischen gesichtspunkt. Ann. Phys. 1905, 322, 132–148. (In German) [Google Scholar] [CrossRef]
  36. Ewan, G.; Tavendale, A. High-resolution studies of gamma-ray spectra using lithium-drift germanium gamma-ray spectrometers. Can. J. Phys. 1964, 42, 2286–2331. [Google Scholar] [CrossRef]
  37. Myers, K. The origin of the lower jurassic cleveland ironstone formation of North-East England: Evidence from Portable gamma-ray spectrometry. Geol. Soc. Lond. Spec. Publ. 1989, 46, 221–228. [Google Scholar] [CrossRef]
  38. Parkinson, D. Gamma-ray spectrometry as a tool for stratigraphical interpretation: Examples from the western European Lower Jurassic. Geol. Soc. Lond. Spec. Publ. 1996, 103, 231–255. [Google Scholar] [CrossRef]
  39. Einstein, A. Ist die trägheit eines körpers von seinem energieinhalt abhängig? Ann. Phys. 1905, 323, 639–641. (In German) [Google Scholar] [CrossRef]
  40. Rybach, L. Radioactive heat production: A physical property determined by the chemistry of rocks. In The Physics and Chemistry of Minerals and Rocks; Stems, R.G.J., Ed.; Wiley-Interscience: New York, USA, 1976; pp. 309–318. [Google Scholar]
  41. Birch, F. Heat from radioactivity. In Nuclear Geology; Wiley: New York, NY, USA, 1954; pp. 148–174. [Google Scholar]
  42. Erdi-Krausz, G.; Matolin, M.; Minty, B.; Nicolet, J.; Reford, W.; Schetselaar, E. Guidelines for Redioelement Mapping Using Gamma Ray Spectrometry Data; International Atomic Energy Agency: Vienna, Austria, 2003. [Google Scholar]
  43. Rybach, L.; Bucher, B.; Schwarz, G. Airborne surveys of swiss nuclear facility sites. J. Environ. Radioact. 2001, 53, 291–300. [Google Scholar] [CrossRef]
  44. Tyler, A.; Sanderson, D.C.; Scott, E.M.; Allyson, J. Accounting for spatial variability and fields of view in environmental gamma ray spectrometry. J. Environ. Radioact. 1996, 33, 213–235. [Google Scholar] [CrossRef]
  45. Sanderson, D.; Allyson, J.; Tyler, A. Rapid quantification and mapping of radiometric data for anthropogenic and technologically enhanced natural nuclides, application of uranium exploration data and techniques in environmental studies. In Proceedings of a Technical Committee Meeting, Vienna, Austria, 9–12 November 1993; pp. 197–216.
  46. Davies, S.; Elliott, T. Spectral gamma ray characterization of high resolution sequence stratigraphy: Examples from Upper Carboniferous fluvio-deltaic systems, County Clare, Ireland. Geol. Soc. Lond. Spec. Publ. 1996, 104, 25–35. [Google Scholar] [CrossRef]
  47. Kogan, R.; Nazarov, I.; Fridman, S.D. Gamma Spectrometry of Natural Environments and Formations; Israel Program for Scientific Translations: Jerusalem, Palestine, 1971. [Google Scholar]
  48. Evans, R.; Mory, A.; Tait, A. An outcrop gamma ray study of the Tumblagooda Sandstone, Western Australia. J. Pet. Sci. Eng. 2007, 57, 37–59. [Google Scholar] [CrossRef]
  49. Løvborg, L.; Bøtter-Jensen, L.; Kirkegaard, P.; Christiansen, E. Monitoring of natural soil radioactivity with portable gamma-ray spectrometers. Nucl. Instrum. Methods 1979, 167, 341–348. [Google Scholar] [CrossRef]
  50. Cresswell, A.; Sanderson, D.; Harrold, M.; Kirley, B.; Mitchell, C.; Weir, A. Demonstration of lightweight gamma spectrometry systems in urban environments. J. Environm. Radioact. 2013, 124, 22–28. [Google Scholar] [CrossRef]
  51. International Commission on Radiation Uits and Measurements. Gamma-Ray Spectrometry in the Environment; International Commission on Radiation Uits and Measurements: Oxford, UK, 1994. [Google Scholar]
  52. Sanderson, D.; Placido, F.; Tate, J. Scottish vitrified forts: Tl results from six study sites. Int. J. Radiat. Appl. Instrum. Part D. Nucl. Tracks Radiat. Meas. 1988, 14, 307–316. [Google Scholar] [CrossRef]
  53. GF-Instruments. Gamma Surveyor II User Manual; GF-Instruments: Brno, Czech Republic, 2013. [Google Scholar]
  54. Grasty, R.; Carson, J.; Charbonneau, B.; Holman, P. Natural Background Radiation in Canada; Geological Survey of Canada: Ottawa, ON, Canada, 1984; volume 360. [Google Scholar]
  55. Tyler, A. Broadening the scope and environmental applications of in situ gamm ray spectrometry. Recent Applications and Development Sin Mobile and Airborne Gamma Spectrometry. In Proceedings of the Radmags Symposium, University of Stirling, 15–18 June 2000; Sanderson, D.C., McLeod, J., Eds.; University of Glasgow: Glasgow, UK, 2000. [Google Scholar]
  56. Ahl, A.; Bieber, G. Correction of the attenuation effect of vegetation on airborne gamma-ray spectrometry data using laser altimeter data. Near Surf. Geophys. 2010, 8, 271–278. [Google Scholar]
  57. Sanderson, D.; Cresswell, A.; Hardeman, F.; Debauche, A. An airborne gamma-ray spectrometry survey of nuclear sites in Belgium. J. Environ. Radioact. 2004, 72, 213–224. [Google Scholar] [CrossRef]
  58. Killeen, P.; Carmichael, C. Gamma-ray spectrometer calibration for field analysis of thorium, uranium and potassium. Can. J. Earth Sci. 1970, 7, 1093–1098. [Google Scholar] [CrossRef]
  59. Beck, H.L.; Decampo, J.; Gogolak, C. In Situ Ge (Li) and Nai (Tl) Gamma-Ray Spectrometry; Health and Safety Lab.: New York, NY, USA, 1972. [Google Scholar]
  60. Allyson, J. Environmental Gamma-Ray Spectrometry: Simulation of Absolute Calibration of in-situ and Airborne Spectrometers for Natural and Anthropogenic Sources; University of Glasgow: Glasgow, UK, 1994. [Google Scholar]
  61. Lee, M.; Wheildon, J.; Webb, P.; Brown, G.; Rollin, K.; Crook, C.; Smith, I.; King, G.; Thomas-Betts, A. Hot dry rocks prospects in caledonian granites: Evaluation of results from the bgs-ic-ou research programme (1981–1984). In Investigation of the Goethermal Potential of the UK; British Geological Survey: Keyworth, UK, 1984. [Google Scholar]
  62. Sherman, H.M.; Gierke, J.S.; Anderson, C.P. Controls on spatial variability of uranium in sandstone aquifers. Ground Water Monit. Remediat. 2007, 27, 106–118. [Google Scholar] [CrossRef]
  63. Hampson, G.J.; Davies, W.; Davies, S.J.; Howell, J.A.; Adamson, K.R. Use of spectral gamma-ray data to refine subsurface fluvial stratigraphy: Late Cretaceous strata in the Book Cliffs, Utah, USA. J. Geol. Soc. 2005, 162, 603–621. [Google Scholar] [CrossRef]
  64. Roy, R.F.; Blackwell, D.D.; Birch, F. Heat generation of plutonic rocks and continental heat flow provinces. Earth Planet. Sci. Lett. 1968, 5, 1–12. [Google Scholar] [CrossRef]
  65. Miles, A.J.; Graham, C.M.; Hawkesworth, C.J.; Gillespie, M.R.; Hinton, R.W. Evidence for distinct stages of magma history recorded by the compositions of accessory apatite and zircon. Contrib. Mineral. Petrol. 2013, 166, 1–19. [Google Scholar]
  66. DePaolo, D.J. Trace element and isotopic effects of combined wallrock assimilation and fractional crystallization. Earth Planet. Sci. Lett. 1981, 53, 189–202. [Google Scholar] [CrossRef]
  67. Stephens, W.E.; Whitley, J.E.; Thirlwall, M.F.; Halliday, A.N. The criffell zoned pluton: Correlated behaviour of rare earth element abundances with isotopic systems. Contrib. Mineral. Petrol. 1985, 89, 226–238. [Google Scholar] [CrossRef]
  68. Gardner, J.E.; Carey, S.; Sigurdsson, H.; Rutherford, M.J. Influence of magma composition on the eruptive activity of Mount St. Helens, Washington. Geology 1995, 23, 523–526. [Google Scholar] [CrossRef]
  69. Kemp, A.; Hawkesworth, C.; Foster, G.; Paterson, B.; Woodhead, J.; Hergt, J.; Gray, C.; Whitehouse, M. Magmatic and crustal differentiation history of granitic rocks from Hf-O isotopes in zircon. Science 2007, 315, 980–983. [Google Scholar] [CrossRef]
  70. Freck, D.; Wakefield, J. Gamma-ray spectrum obtained with a lithium-drifted p-i-n junction in germanium. Nature 1962, 1983, 669. [Google Scholar] [CrossRef]
  71. Ehinola, O.; Joshua, E.; Opeloye, S.; Ademola, J. Radiogenic heat production in the cretaceous sediments of yola arm of Nigeria benue trough: Implications for thermal history and hydrocarbon generation. J. Appl. Sci. 2005, 5, 696–701. [Google Scholar] [CrossRef]
  72. Berbezier, J.; Blangy, B.; Guiton, J.; Lallemant, C. Methods of car-borne and air-borne prospecting: The technique of radiation prospecting by energy discrimination. In Proceedings of the 2nd UN International Conference Peaceful Use of Atomic Energy, Genova, Switzerland, 1–13 September 1958.
  73. Beck, H.L.; Condon, W.J.; Lowder, W.M. Spectrometric Techniques for Measuring Environmental Gamma Radiation; Health and Safety Lab., New York Operations Office (AEC): New York, NY, USA, 1964. [Google Scholar]
  74. Beck, H.; Lowder, W.; McLaughlin, J. In situ External Environmental Gamma-Ray Measurements Utilizing Ge (Li) and Nai (Tl) Spectrometry and Pressurized Ionization Chambers; Atomic Energy Commission: New York, NY, USA, 1971. [Google Scholar]
  75. Lowder, W.; Condon, W.; Beck, H.L. Field Spectrometric Investigations of Environmental Radiation in the USA; Atomic Energy Commission: New York, NY, USA, 1968. [Google Scholar]
  76. Sanderson, D.; Allyson, J.; Tyler, A.; Scott, E. Environmental applications of airborne gamma spectrometry. In Proceedings of the IAEA Technical Committee Meeting on the Use of Uranium Exploration Data and Techniques in Environmental Studies, Vienna, Austria, 9–12 November 1993; pp. 9–12.
  77. Sanderson, D.; McLeod, J.; Ferguson, J. A european bibliography on airborne gamma-ray spectrometry. J. Environ. Radioact. 2001, 53, 411–422. [Google Scholar] [CrossRef]
  78. Richardson, K.; Killeen, P. Regional Radiogenic Heat Production Mapping by Airborne Gamma-ray Spectrometry; Geological Survey of Canada: Ottawa, ON, Canada, 1980; pp. 227–232. [Google Scholar]
  79. Thompson, P.; Judge, A.; Charbonneau, B.; Carson, J.; Thomas, M. Thermal Regimes and Diamond Stability in the Archean Slave Province, Northwestern Canadian Shield, District of Mackenzie, Northwest Territories; Geological Survey of Canada: Ottawa, ON, Canada, 1996; pp. 135–146. [Google Scholar]

