A Layered Fault Tree Model for Reliability Evaluation of Smart Grids

School of Information System and Management, National University of Defense Technology, Changsha 410073, China
*
Author to whom correspondence should be addressed.
Energies 2014, 7(8), 4835-4857; https://doi.org/10.3390/en7084835
Submission received: 20 March 2014
/
Revised: 31 May 2014
/
Accepted: 15 July 2014
/
Published: 29 July 2014
Abstract
:The smart grid concept has emerged as a result of the requirement for renewable energy resources and application of new techniques. It is proposed as a practical future form of power distribution system. Evaluating the reliability of smart grids is of great importance and significance. Focusing on the perspective of the consumers, this paper proposes a layered fault tree model to distinguish and separate two different smart grid power supply modes. Revised importance measures for the components in the fault tree are presented considering load priority, aiming to find the weak parts of the system and to improve the design and using. A corresponding hierarchical Monte Carlo simulation procedure for reliability evaluation is proposed based on the layered fault tree model. The method proposed in this paper is tested on a case of reliability assessment for the Future Renewable Electric Energy Delivery and Management (FREEDM) system. The proposed technique can be applicable to other forms of smart grids.
1. Introduction
Smart grids, also called smart electrical/power grids or intelligent grids, are an enhancement of the traditional power grid. The concept of smart grid aims to create an automated and distributed advanced energy delivery network, with two-way flows of electricity and information playing highly important roles [1,2]. Specifically, smart grids can be regarded as an electric system that uses information technologies and computational intelligence in an integrated fashion across electricity generation, transmission, substations, distribution and consumption, in order to achieve a distribution system that is clean, safe, secure, reliable, resilient, efficient, and sustainable. Features of smart grids can cover the entire spectrum of the energy system from the generation to the load points of consumption of the electricity [3].
One of the major objectives for a smart grid, is to enhance power distribution reliability. Consequently, it is important and significant to evaluate the reliability of the system in order to make comparisons and improve the designs. Analytical techniques using mathematical models have long been used in evaluating reliability of distribution system [4]. With analytical approaches to calculate load point failure rates, average outage durations and average annual outage times, system indices can be evaluated considering the customer composition [4,5]. A reliability-network-equivalent approach is proposed for reliability evaluation of distribution system, which is practical for complex radial distribution systems [6]. The Monte Carlo Simulation (MCS) method has also been used to evaluate power distribution reliability indices [7,8,9]. MCS is based on analysis of a large number of sample cases, and can be less relevant to the complex system configuration and elaborate mathematics. In reference [9], the concept of enhanced samples, a bootstrap and compensation method are also introduced in order to enhance accuracy and reduce calculation time.
When the concepts of microgrid and smart grid arise, great changes must take place in the envisioned new distribution systems. Techniques of distributed generation (DG), energy storage, electronic controls, self-healing, and improved protection systems are incorporated in the next generation of distribution systems. Focusing on the new distribution systems, recently proposed reliability evaluation methods also have potential limitations. In the scientific literature, a combined generation to load ratio model is proposed to evaluate the local generation adequacy for an islanded microgrid with limited stochastic resources in [10]. In reference [11], a simulation methodology is presented for reliability and cost assessment of renewable energy sources in an independent microgrid system. An innovative generalized systematic approach and related analytical formulation are presented in [12] to evaluate distribution system reliability in smart grids, where islanded operation of microgrids helps improve local and overall reliability. Reference [13] presents a novel constrained grey predictor technique for wind speed profile estimation and a probabilistic technique to evaluate the distribution system reliability utilizing segmentation concept. Reference [14] uses an integrated Markov model with DG adequacy transition rate, DG mechanical failure, and starting and switching probability incorporated to assess the DG reliability.
Most of the current studies focus on modeling DGs’ operation and assessing reliability of islanded microgrids. Due to the high reliability and availability of smart grids, the operational flexibility of the system should be reflected. System perspective and systematic thought need to be concerned in the research. Moreover, power consumers in the system are the focus of attention when evaluating system reliability. Their demands and concerns should be underlined when assessing the reliability.
In this paper, a modified layered fault tree model is proposed, aiming to distinguish and separate the two different power supply modes of smart grids, namely grid-connected mode and islanded mode. The focus in this paper concentrates on the load points within a potential islanded local framework of a specific smart grid architecture.
In order to find the weak parts of the system and improve the design and using, revised importance measures for the components are presented with integration of load priority. Based on the layered fault tree model, a hierarchical Monte Carlo simulation procedure for reliability evaluation is also proposed, which integrates the state transition process of different power supply modes. With the standardized structure, advanced automation and communication infrastructures of smart grids, the procedures proposed can be accomplished.
Fault tree analysis is good at reflecting the logical relation among system failure, structure of the system and the failures of components. Compared with currently existing methods, the proposed model and reliability evaluation process integrate power adequacy assessment into system failure logic, providing a comprehensive insight into system and its failure. With the layering procedure and inadequacy judgment function introduced, the fault tree model can also be greatly simplified and unitized compared to the conventional fault tree model of great complexity. But it should also be pointed out that the evaluation of the fault tree may need huge amount of computation, considering the dynamic aspect of DGs and loads as well as the increasing scale of system.
The paper is organized as follows: Section 2.1 gives a brief introduction of fault tree analysis. In Section 2.2, the procedure of layered fault tree construction and inadequacy judgment function are presented. Section 2.3 introduces the revised importance measures for the components in a local framework of smart grids. The corresponding simulation procedure is revealed in Section 2.4. In Section 3, the proposed procedure is tested on a case of the FREEDM system. Finally, the conclusions are presented in Section 4.
2. Layered Fault Tree Model for Smart Grids
2.1. Fault Tree Analysis
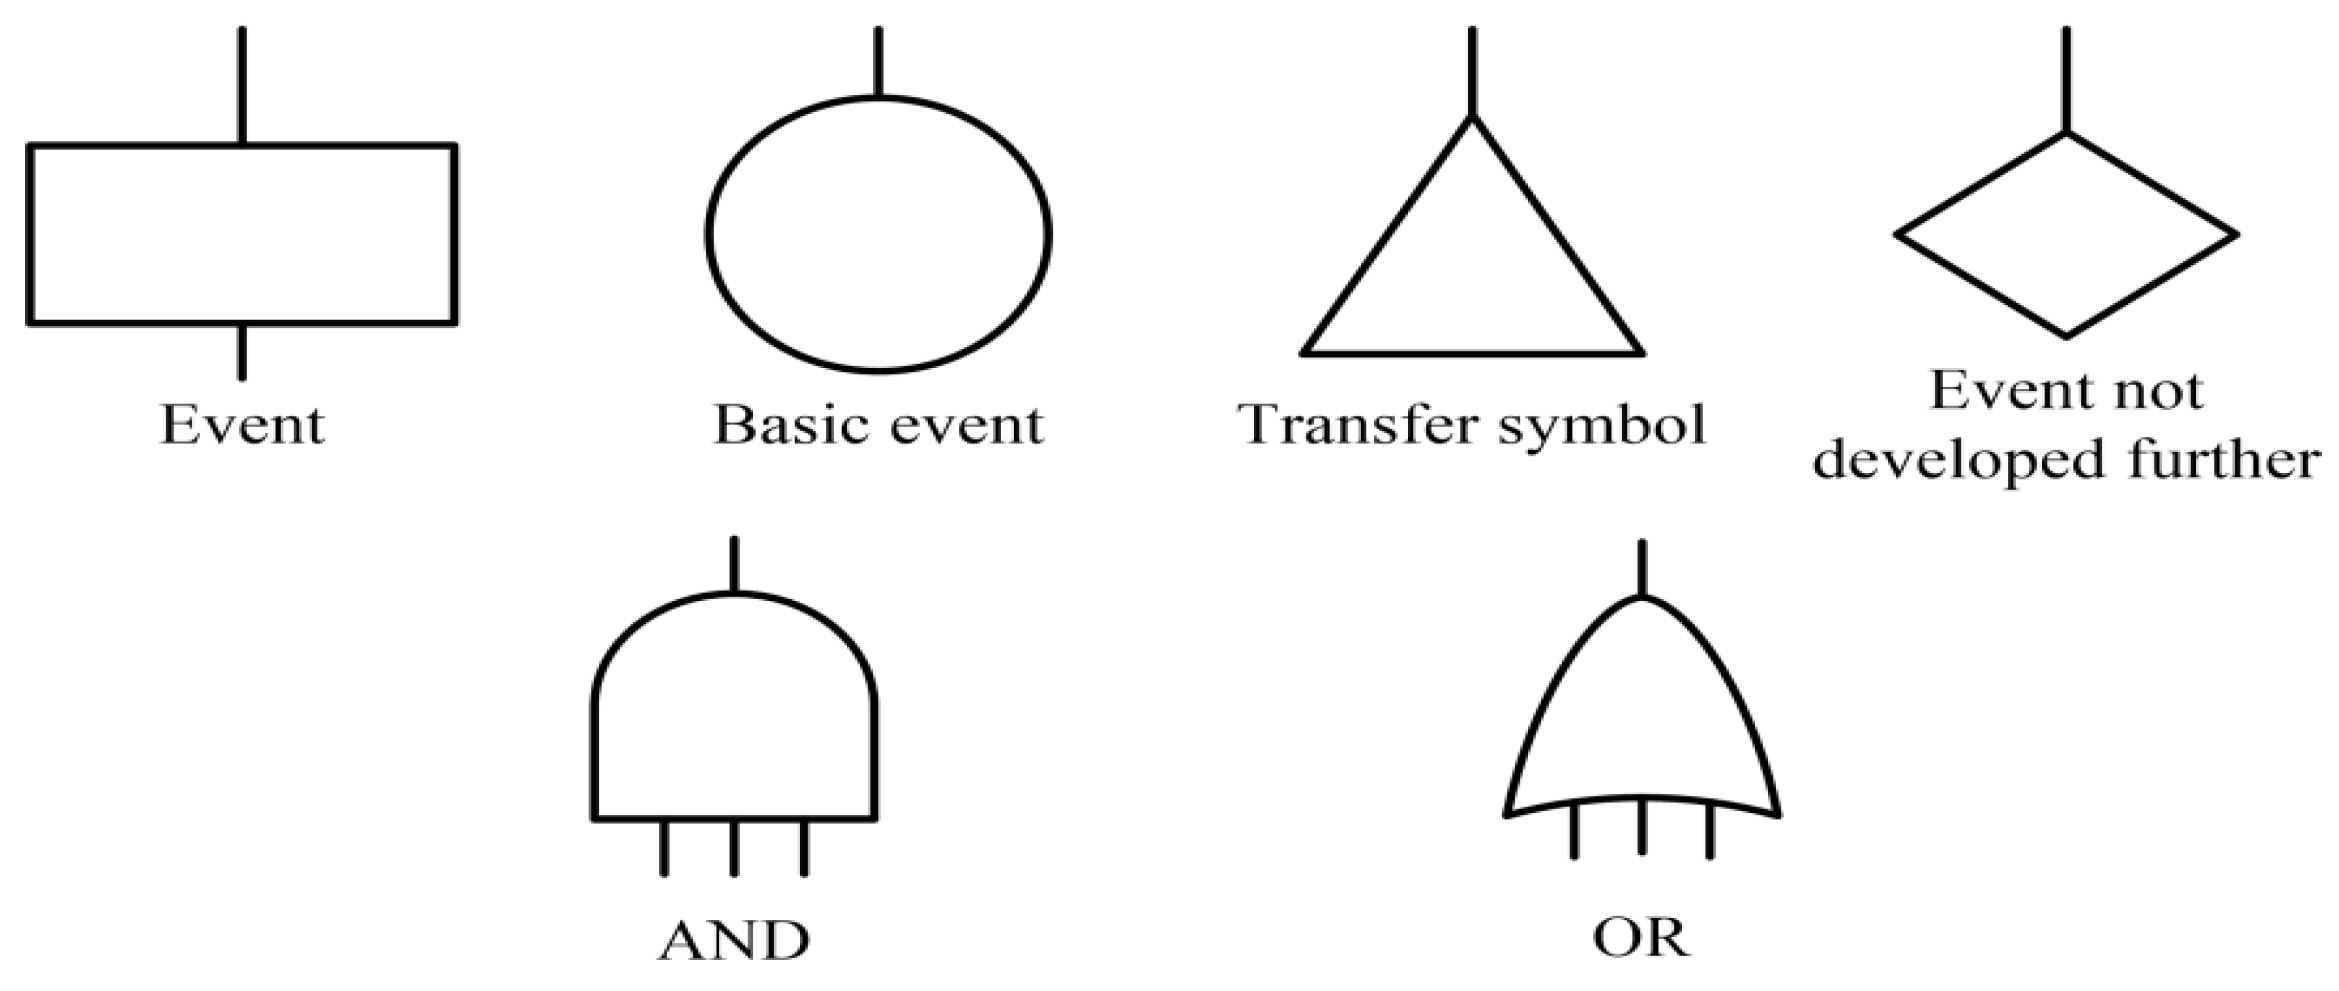
The fault tree is a model to identify and assess the combinations of the undesired events of system operation and its environment, which will lead to the undesired system state. It is a modeling method to reflect the relationship between the failures of the components and the system [15]. Using the fault tree analysis (FTA) method, the concerned failure mode of the system is taken as the top event, and deductive method is used to find out the sets of events which may make the top event happen. The FTA method can reflect the interactive logic relationship between the component failures and occurrences of the top event.
Figure 1 shows some common event representations and logic operations in the fault tree. In the basic fault tree model, with these elements, the fault tree is based on Boolean logic functions integrating the primary events to the top event. In order to do reliability evaluation, traditional method establishes the reliability model of fault tree for the system, then calculates the minimal cut sets and does disjoint operation. The minimal cut sets can be described as:
![Energies 07 04835 i001]() where MCSj is the jth minimal cut set; xi is the basic event in the jth minimal cut set. It describes the combination of the smallest number of basic events, which can lead to the top event if occur simultaneously. After figuring out all the minimal cut sets, the structural representation of fault tree can be expressed as:
where MCSj is the jth minimal cut set; xi is the basic event in the jth minimal cut set. It describes the combination of the smallest number of basic events, which can lead to the top event if occur simultaneously. After figuring out all the minimal cut sets, the structural representation of fault tree can be expressed as:
![Energies 07 04835 i002]() Where T denotes a top event; and NMCS denotes the number of the minimal cut sets of the fault tree.
Where T denotes a top event; and NMCS denotes the number of the minimal cut sets of the fault tree.


Figure 1.
Common event representations and logic operations of fault tree.

FTA has also been successfully used in power system reliability evaluation in a series of previous studies. Take recent studies for example, reference [16] develops a method for evaluating customer reliability in a distribution power system using the fault tree approach, considering customer weighted values of component failure frequencies and downtimes. A method is proposed in reference [17] based on fault trees generated for each load point of the power system, considering energy delivery. These papers apply fault tree to load point failure analysis, which can also been a starting point of fault tree modeling for smart grids.
2.2. The Layered Fault Tree
With all the new concepts proposed with smart grids, there are three main aspects of differences between the future distribution systems and the conventional:
- With the introduction of DGs, new distribution systems become multi-power resources served networks, instead of traditional radial construction served by a single source, so the structures of the new distribution systems will be improved, in order to gain a better architecture to have DGs access.
- The uncertainty of the operating state of the new distribution systems increases greatly. The output power of renewable primary energy sources has great randomness, and no longer depends on users’ loads. Moreover, new distribution systems may be operating in islanded mode or grid-connected mode, which can reconfigure the new distribution systems to be bidirectional networks, with many small-scale DGs integrated.
- Control techniques and methods for the envisioned distribution systems are undergoing significant changes. Different from conventional distribution systems, it is difficult for the smart grids to use a single control center to regulate the whole system rapidly and efficiently. Control of the new distribution systems should base on local information as much as possible [1,18,19]. Therefore, the theory of distributed control for new distribution systems can be far more complicated than traditional control theory.
Consequently, enhanced techniques and approaches for reliability evaluation of smart grids are of great necessity. The fault tree model can be both versatile and easy to use among the techniques available. Due to the differences between smart grids and the conventional distribution systems, the fault tree model needs to be revised in order to reflect the characteristics of smart grids. The running mechanisms should also be reflected in the modeling and evaluating process. Before the procedure is given, key assumptions were made about the research object in this paper:
- 1
- The islanding strategy of a smart grid is intentional. It gives the possibility to imply the state changing process in the structure of the fault tree model and in the simulation process. Based on a specific architecture of smart grid, the research object should also be an integral potential islanded local framework, with one or more intelligent substations in it.
- 2
- In the local smart grid framework, power can be dispatched freely, and loads of low priority can be cut off from the system in order to guarantee power supply for more important loads if needed. The lines or buses in the distributed smart grid infrastructure also have enough capacity and won’t be overloaded when transmitting electricity. This assumption conforms to the designing and operational feature of smart grids, which increases the power distribution reliability.
- 3
- The intelligent control and protection systems of smart grids are not further analyzed and decomposed in this paper. These functions are usually incorporated in the intelligent substations in a specific smart grids architecture and will be achieved not only by devices but also through the intelligent control software. The consideration of these systems can make the models improved, but will increase the complexity additionally of the overall procedure.
For a smart grid, there are two operation modes, each mode has its own proper conditions and the two modes can mutually transform. In fact, grid-connected running is the normal running state, and islanded mode can be regarded as its sub-procedure. It provides a condition for hierarchical description of the fault tree.
The fault tree can be layered by distinguishing and separating two different power supply modes, which are utility supply and local supply. When the main grid works properly, the power supply for the concerned load can be fully guaranteed. Nevertheless, when the utility supply has failed, the local framework of smart grid can turn to islanded mode and turn on the DGs to ensure the power supply for loads within. The procedure of building the layered fault tree for a specific architecture of smart grid is given as follows:
2.2.1. Construction of the Primary Fault Tree
The primary fault tree is the outage-event tree for a specific load point, which is currently concerned. The top event of the fault tree should be the outage event of the concerned load. For a specific form of smart grid architecture, events that should be included in the primary fault tree are listed as follows:
- Information subsystem failure.
- Communication subsystem failure.
- Intelligent substation failure.
- Protection subsystem failure.
- Power supply failure.
- Failures of other devices depending on the architecture.
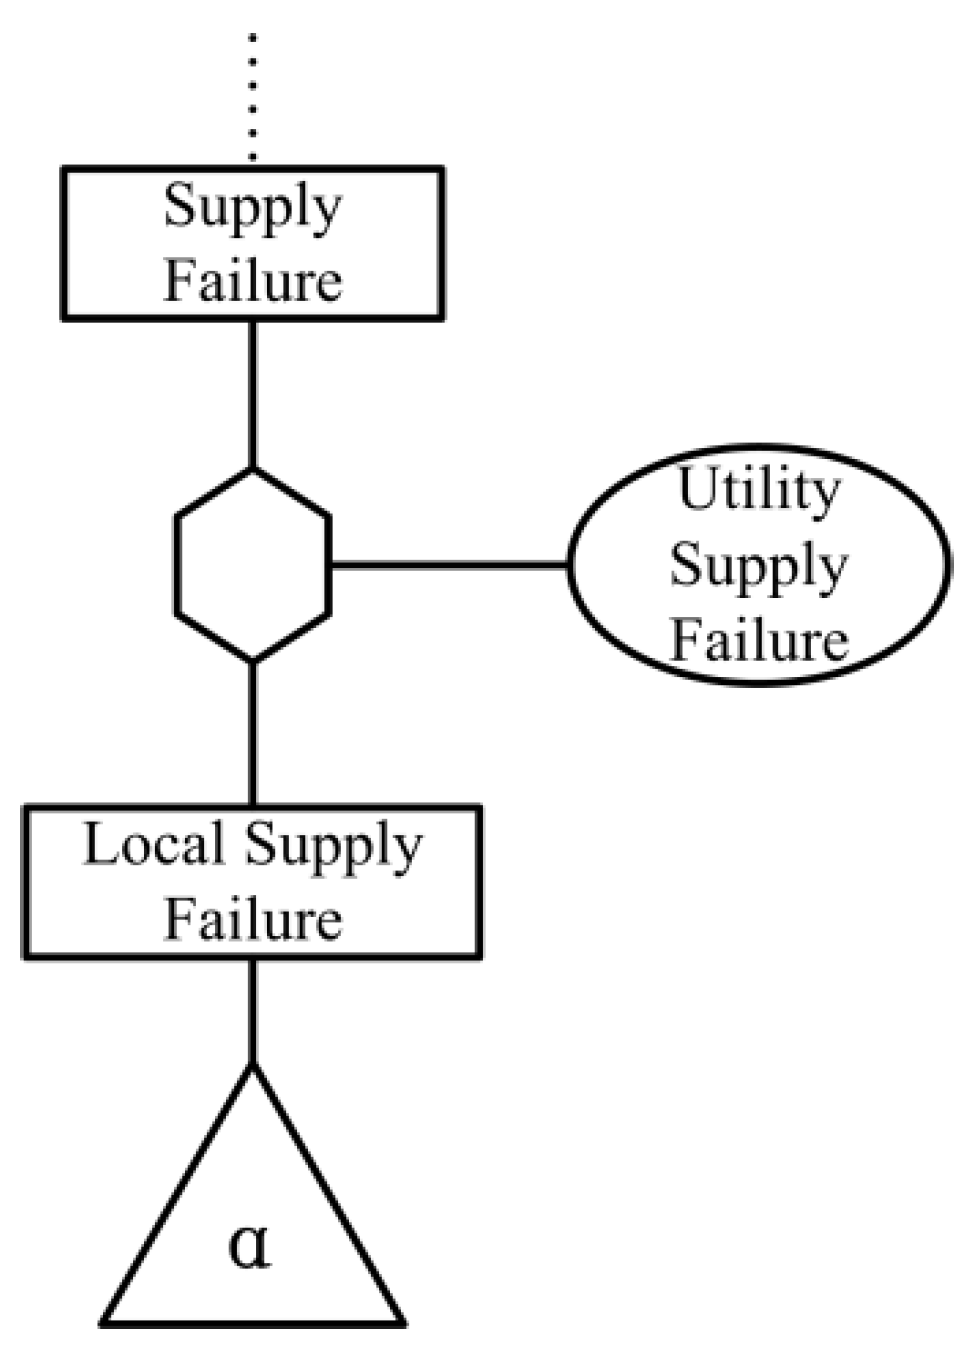
The structure connected to the secondary fault tree is shown in Figure 2. An inhibit gate symbolized by a hexagon is used as the logical operation connected to the event of Utility Supply Failure, which is a condition event in form of ellipse. The triangle α is used to draw forth the secondary layer of fault tree considering local supply in islanded mode.
Figure 2.
Logical operation connecting the two layers of fault tree.

From the perspective of time, the event of Utility Supply Failure can be seen as the trigger of secondary fault tree. Under the circumstance that utility supply is failed, the secondary fault tree is linked upward. Then only when the event of Local Supply Failure occurs, can the top event be led to. With the utility supply recovered, link between the two layers of fault tree is disconnected and the considered local framework will go on working with utility supply, so the inhibit gate used here cannot be simply transformed to an AND gate, which is a common method to handle inhibit gates in traditional fault trees.
2.2.2. Construction of the Secondary Fault Tree
The secondary fault tree can be regarded as the local supply adequacy assessment tree. This part of the fault tree is constructed to assess the local power supply adequacy considering the flow paths. In fact, input parts of the flow paths connected to the loads have been decomposed into the primary fault tree, in order to ensure the utility supply for the load. In this section of the fault tree, only the output parts of flow paths for the DGs are taken into consideration, so the events included in the secondary fault tree are the failure events for devices of the remaining parts of the flow paths and the modular failure events of DGs in the islanded smart grid system. The secondary fault tree is actually the logical combination of failures of flow paths as well as DGs.
Islanded operation mode of the local framework of a smart grid won’t last long, generally no longer than one week [20]. This is another important reason to construct the fault tree in a layered form. It can make the evaluation process more realistic, for the difference of working time for the devices in the two layers and the islanded/grid-connected mode mutually change being describable. This advantage makes it efficient for simulation process for reliability evaluation.
The thoughts of peer to peer and standardization of structure have been introduced to the design and use of smart grids for the consumers to access loads and power generating devices freely. This provides great convenience for the construction of the fault tree, in that all the loads are in the same appliance architecture according to a specific smart grid, and electricity from all the generators is accessible for all the loads in the local framework. Intelligent energy dispatching can be realized by the intelligent power management subsystem. However, the adequacy assessment is not a simple process especially in the islanded operation mode, which concerns the secondary fault tree chiefly. In the local framework of a smart grid, priorities of the loads are pre-defined by the users [21,22]. The power demand of an important load with a high priority should be guaranteed preferentially.
Before introducing the construction strategy of the secondary fault tree, it is necessary to model the DGs and loads. Generally, the output power of the renewable DGs depends highly on the time and their locations. The power requested by a user is also related to the day’s moment. Time-series models for renewable DGs [23,24] as well as the loads [25] have long been used to describe the power generated and requested, in order to assess the adequacy. With these methods, the power generated by renewable DGs and requested by the loads in a certain period of time can be calculated and used in adequacy assessment. Beyond models, real data can also be used directly into the process, without considering the difficulty of data collection.
In this paper, the number of a load is set consistent with its priority. With the priorities of loads coincided with the labels, inadequacy judgment function for the load of a certain priority can be represented as:
![Energies 07 04835 i003]() prio is the priority of the load point concerned currently, with prio = 1 representing the most important load. When ϕInade(t) = 1, the top event of the secondary fault tree is considered as occurred. In order to judge the inadequacy judgment function, standard strategy of fault tree modeling can be complex especially for the loads with low priorities. The fault tree will be built with the changing logical combinations of all the DGs’ failure events repeatedly. With conventional method, it is time-consuming and arduous to construct fault trees for all the loads of the local smart grid system.
prio is the priority of the load point concerned currently, with prio = 1 representing the most important load. When ϕInade(t) = 1, the top event of the secondary fault tree is considered as occurred. In order to judge the inadequacy judgment function, standard strategy of fault tree modeling can be complex especially for the loads with low priorities. The fault tree will be built with the changing logical combinations of all the DGs’ failure events repeatedly. With conventional method, it is time-consuming and arduous to construct fault trees for all the loads of the local smart grid system.

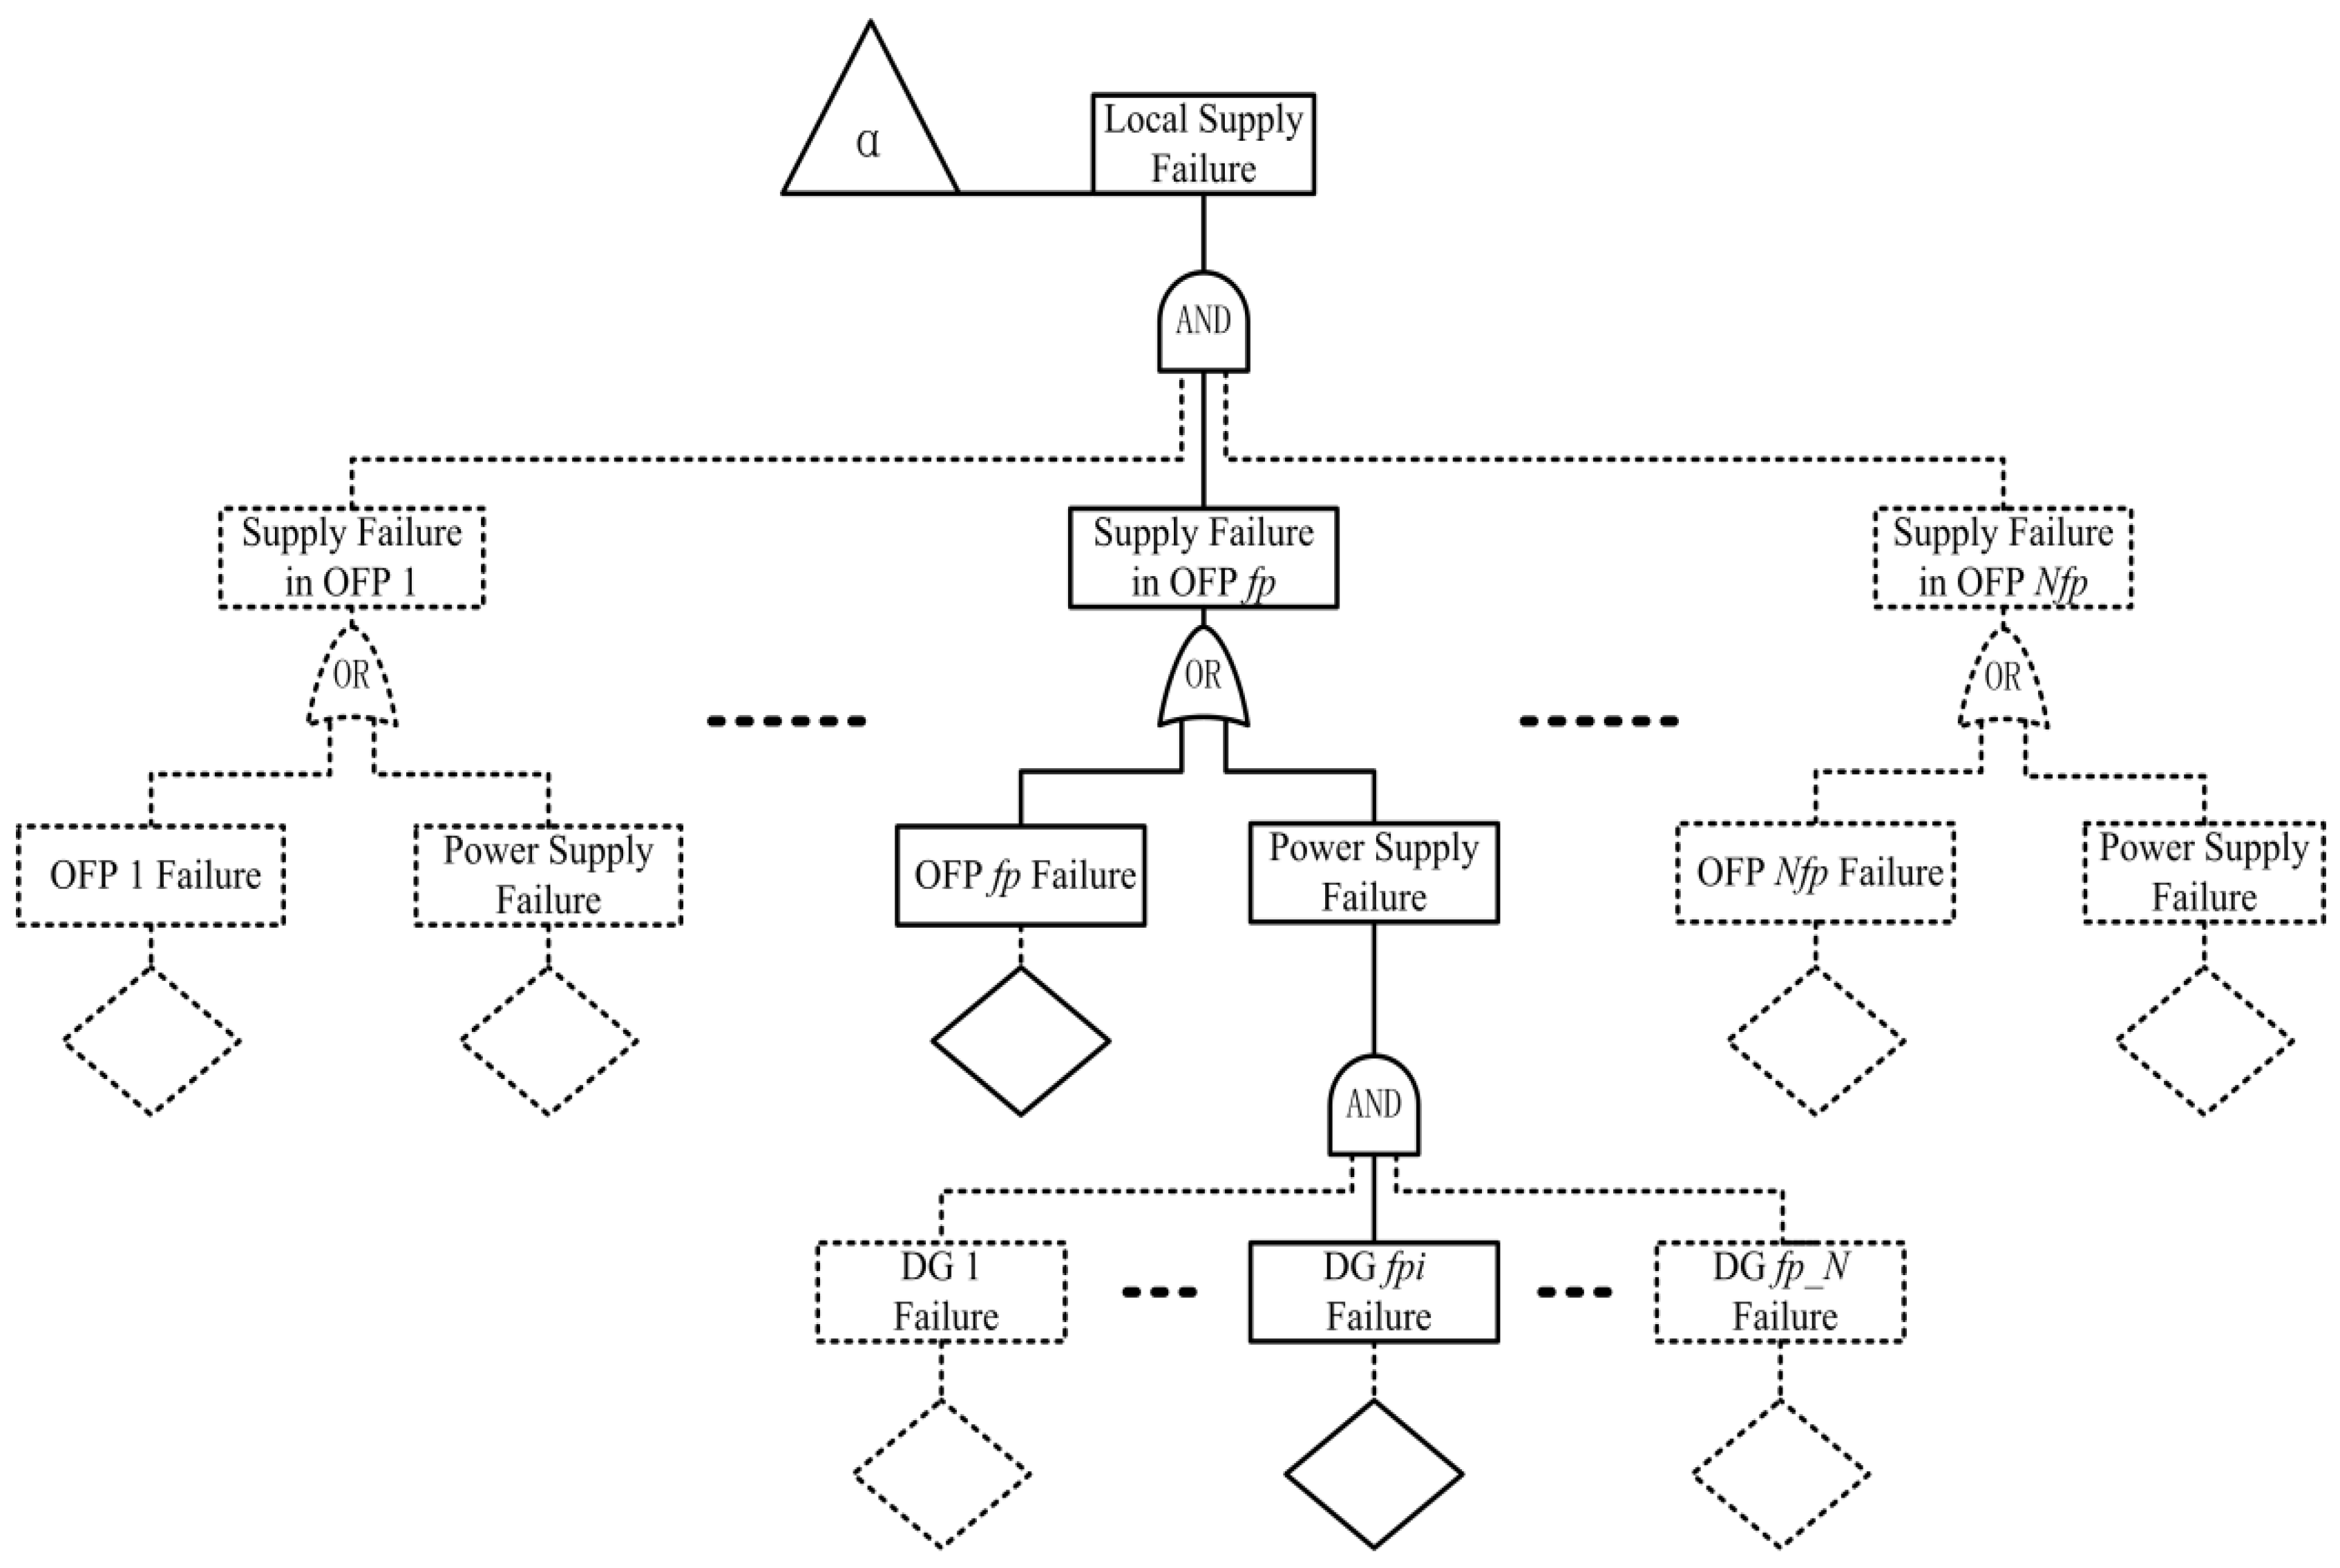
A construction strategy of the secondary fault tree is proposed in this paper, in order to simplify and unitize the form of the fault tree for different load points in the local framework. The normalized form of the secondary fault tree is shown in Figure 3. Failure event of each output flow path and distributed generator can be decomposed further. With this normalized form of fault tree, transform the AND operation to Add operation, and OR operation to Multiply operation, then POWtot(t) can be given as:
![Energies 07 04835 i004]()
![Energies 07 04835 i005]()
![Energies 07 04835 i006]() with POWtot(t) calculated by the proposed fault tree conversion strategy, the inadequacy judgment function can be assessed, estimating whether total power available is able to cover the power demand of the considering loads in the islanded period.
with POWtot(t) calculated by the proposed fault tree conversion strategy, the inadequacy judgment function can be assessed, estimating whether total power available is able to cover the power demand of the considering loads in the islanded period.


Figure 3.
Normalized form of the secondary fault tree for local smart grid framework: OFP = output flow path; DG = distributed generator.
Figure 3.
Normalized form of the secondary fault tree for local smart grid framework: OFP = output flow path; DG = distributed generator.

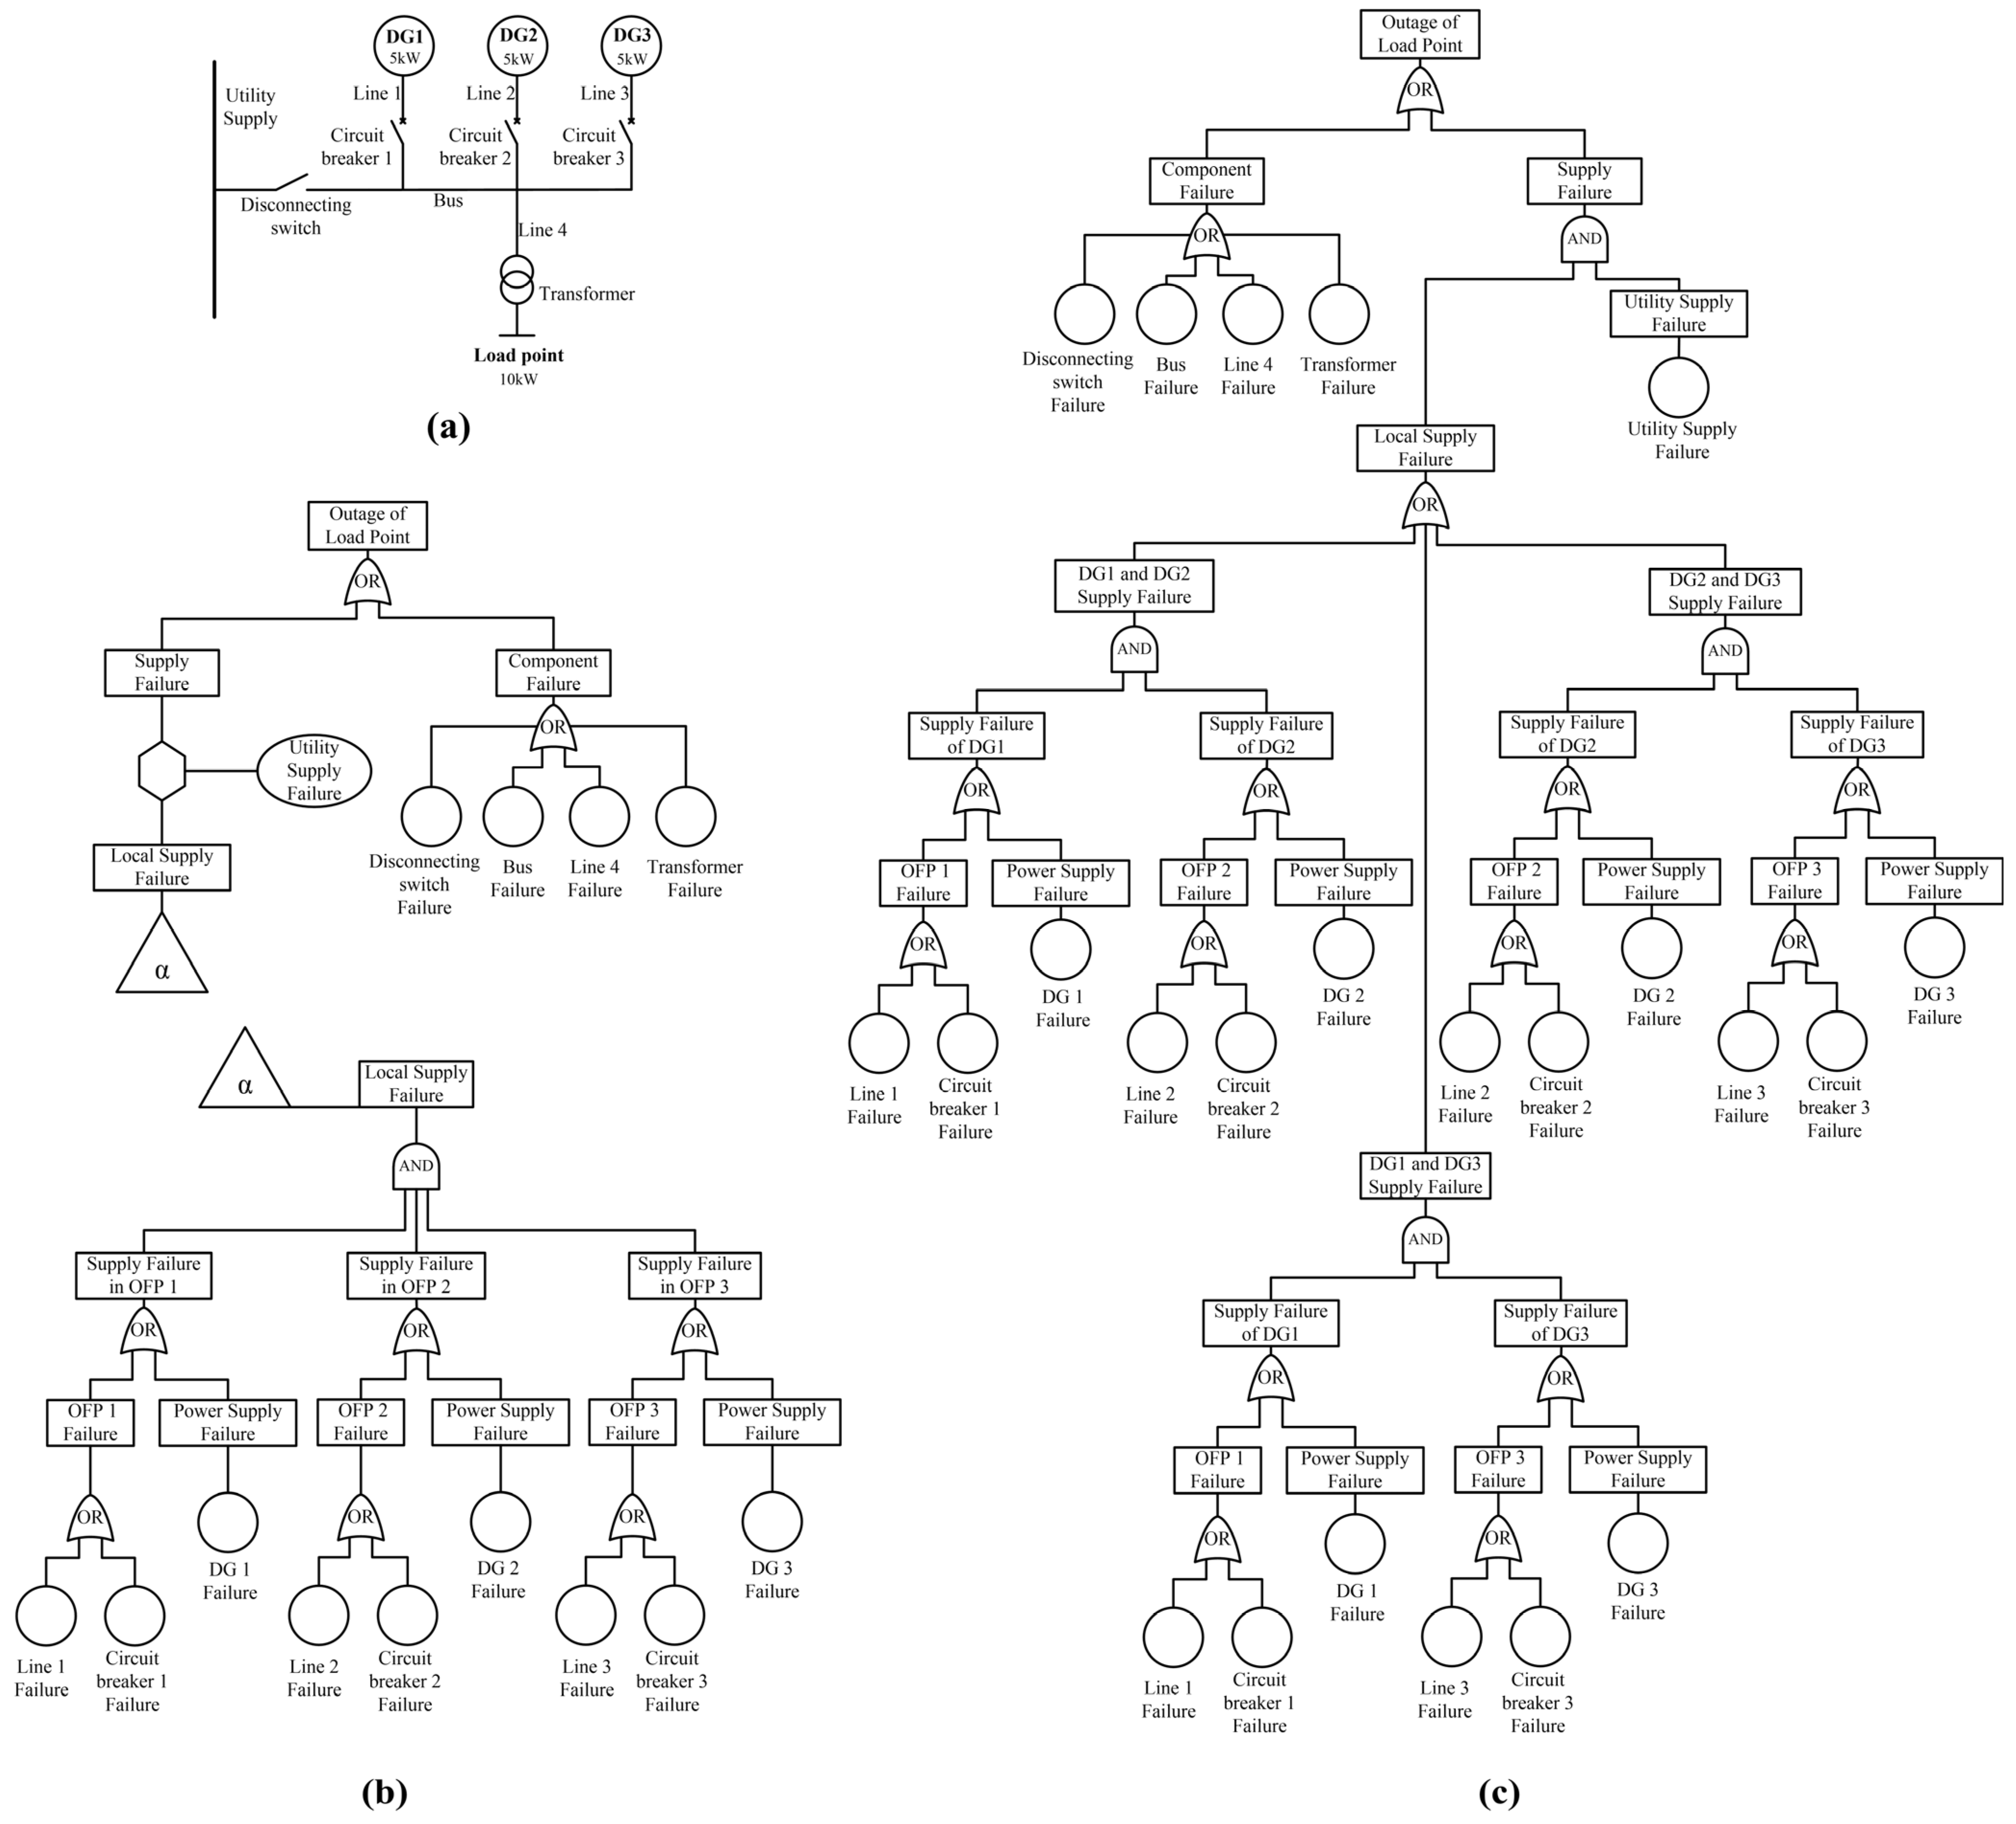
In Figure 4, comparison is made respectively using the proposed layered fault tree model and the traditional one, based on a specific circuit given in Figure 4a. In the circuit example, three DGs of 5 kW are connected to the bus as backup power of the utility supply, in order to meet the load point power demand of 10 kW. It can be seen that the layered fault tree model of Figure 4b is much more simplified than the traditional fault tree model of Figure 4c, with the process of inadequacy judgment integrated. When utility supply fails, supply failure of any two DGs in the circuit will lead to outage of the load point. Consequently, traditional fault tree model has to give exhaustion of combinations of failure events, which will lead to the outage of load point. With the complexity of the circuit increasing, the scale of a traditional fault tree model goes on growing rapidly. Besides the scale of the model, traditional fault tree won’t be able to describe the dynamic aspects of DGs and loads as well as the transition between islanded and grid-connected modes.
It has been proved the evaluation of network reliability is NP-hard [26]. With traditional fault tree analysis methods, the fault tree construction procedure and the evaluation process can be complicated and time demanding. The standardized structure and operating requirement like peer to peer in smart grids give the possibility to normalize the reliability evaluation process, using the revised fault tree model. The procedure proposed in this paper can unitize the fault tree modeling process for different loads in a local smart grid framework, providing a practical reliability evaluation method for the new power systems in the future.
Figure 4.
Comparison between layered fault tree model and traditional fault tree model: (a) a circuit example; (b) layered fault tree for the load point; (c) traditional fault tree for the load point.
Figure 4.
Comparison between layered fault tree model and traditional fault tree model: (a) a circuit example; (b) layered fault tree for the load point; (c) traditional fault tree for the load point.

2.3. Importance Measures
Importance measures are used to describe the contributions and effect of the components to the occurrence of the top event in a fault tree. They give a characterization of importance to the components, in order to find the weak parts of the system and to improve the system design. In this paper, networked importance measures are chosen and revised to adapt to the features of smart grids.
The weighted failure probabilities of power delivery to all the loads are considered to get the Loss of load probability(LOLP) measure of the power system [17]:
![Energies 07 04835 i007]()
![Energies 07 04835 i008]()


Risk achievement worth (RAW) and risk reduction worth (RRW) have been proposed as importance measures for fault tree model [27]. Risk achievement worth identifies components that should be maintained well, in order the reliability of the system is not significantly reduced. Risk reduction worth identifies those components probably redundant, for their reliability significantly increasing system reliability:
![Energies 07 04835 i009]()
![Energies 07 04835 i010]()


The network importance risk measures, namely network risk achievement worth (NRAW) and network risk reduction worth (NRRW), are defined using the definition of the importance measures from a single fault tree and can be applied to power systems [17]:
![Energies 07 04835 i011]()
![Energies 07 04835 i012]()


With the pre-defined priorities of loads set by the user, when assessing reliability and component importance, it is essential to take the priorities into consideration. In order to get more practical results for smart grids, in this paper, the priority factor is proposed to revise the previous procedure. Because the priority factor is developed only with the priority ranking of the loads, without detailed preference information about each load point, isometric measures may be the most objective. An isometric priority factor is given as:
![Energies 07 04835 i013]() where Pi is the priority factor; and Pi ∈ (0,1]. Pi describes the decreasing importance of loads with the order of priorities. The modified Loss of load probability measure of a local smart grid framework can be revised as:
where Pi is the priority factor; and Pi ∈ (0,1]. Pi describes the decreasing importance of loads with the order of priorities. The modified Loss of load probability measure of a local smart grid framework can be revised as:
![Energies 07 04835 i014]() Pi•Ki/K is the compound weighting factor corresponding to load i.
Pi•Ki/K is the compound weighting factor corresponding to load i.


With the priority factor considered for smart grid system, substitute modified Loss of load probability LOLP* for LOLP, and the revised network risk achievement worth (NRAW+) and network risk reduction worth (NRRW+) for smart grid system are as:
![Energies 07 04835 i015]()
![Energies 07 04835 i016]() System importance measures for components groups corresponding to specific combination are defined similarly as the above importance measures.
System importance measures for components groups corresponding to specific combination are defined similarly as the above importance measures.


2.4. Simulation Strategy
With the procedure proposed to construct the fault tree, quantitative evaluation of the fault tree is difficult to carry out with conventional method. Three main reasons are as:
- 1
- The fault tree constructed reflects the operational mechanism of smart grids. The change of two different power supply modes should be embodied in the reliability assessment process with the proposed fault tree.
- 2
- Start time of operation are different between devices in the two layers of fault tree, in that local supply is triggered by utility supply failure. Time requirement for islanded operation is not as high as for normal systems, so a short islanded operation time cycle should be integrated in the assessment.
- 3
- The proposed procedure for assessment of inadequacy judgment function for the secondary fault tree should be integrated in the reliability evaluation process.
Monte Carlo simulation is a kind of numerical simulation method based on the theory of probability and statistics. It is feasible through computer programming. Based on the layered fault tree model proposed for smart grids, this paper presents a hierarchical simulation strategy to assess fault tree model built for the load points, in order to evaluate the reliability of the overall system.
In a Monte Carlo run, the time to failure is generated for each component, then the components states are set to “failed”, one at a time in order of increasing time, until the top event is produced [28]. Typically, the lives of electronic devices obey exponential distribution. Random sampling can be done to the occurrence time of each basic event which obeys exponential distribution during the simulation as the following process:
![Energies 07 04835 i017]() where F(t) is the life distribution function of the basic events; λ, the fault rate of a basic event; ξ, random sampling result of the uniform distribution in the interval of [0,1]. With this method, the occurrence time for each basic event can be calculated.
where F(t) is the life distribution function of the basic events; λ, the fault rate of a basic event; ξ, random sampling result of the uniform distribution in the interval of [0,1]. With this method, the occurrence time for each basic event can be calculated.
F(t) = 1 − e−λt = ξ

Reliability system is a discrete event dynamic system (DEDS) and the basic simulation method for this kind system is simulation clock advancing method. Simulation procedure is advanced along with the event list in time order. Let ϕ[X(t)] express the structure function of the fault tree, X(t) as the state variable of the system. Let N denote the total times of simulation, and j = 1, 2, …, N. The state function of the system in the jth simulation at the moment t as:
![Energies 07 04835 i018]()
Xj(t) = [b1,j(t),b2,j(t),…,bk,j(t),…bn,j(t)]

So in the jth simulation, the state of the top event can be expressed as:
![Energies 07 04835 i019]()

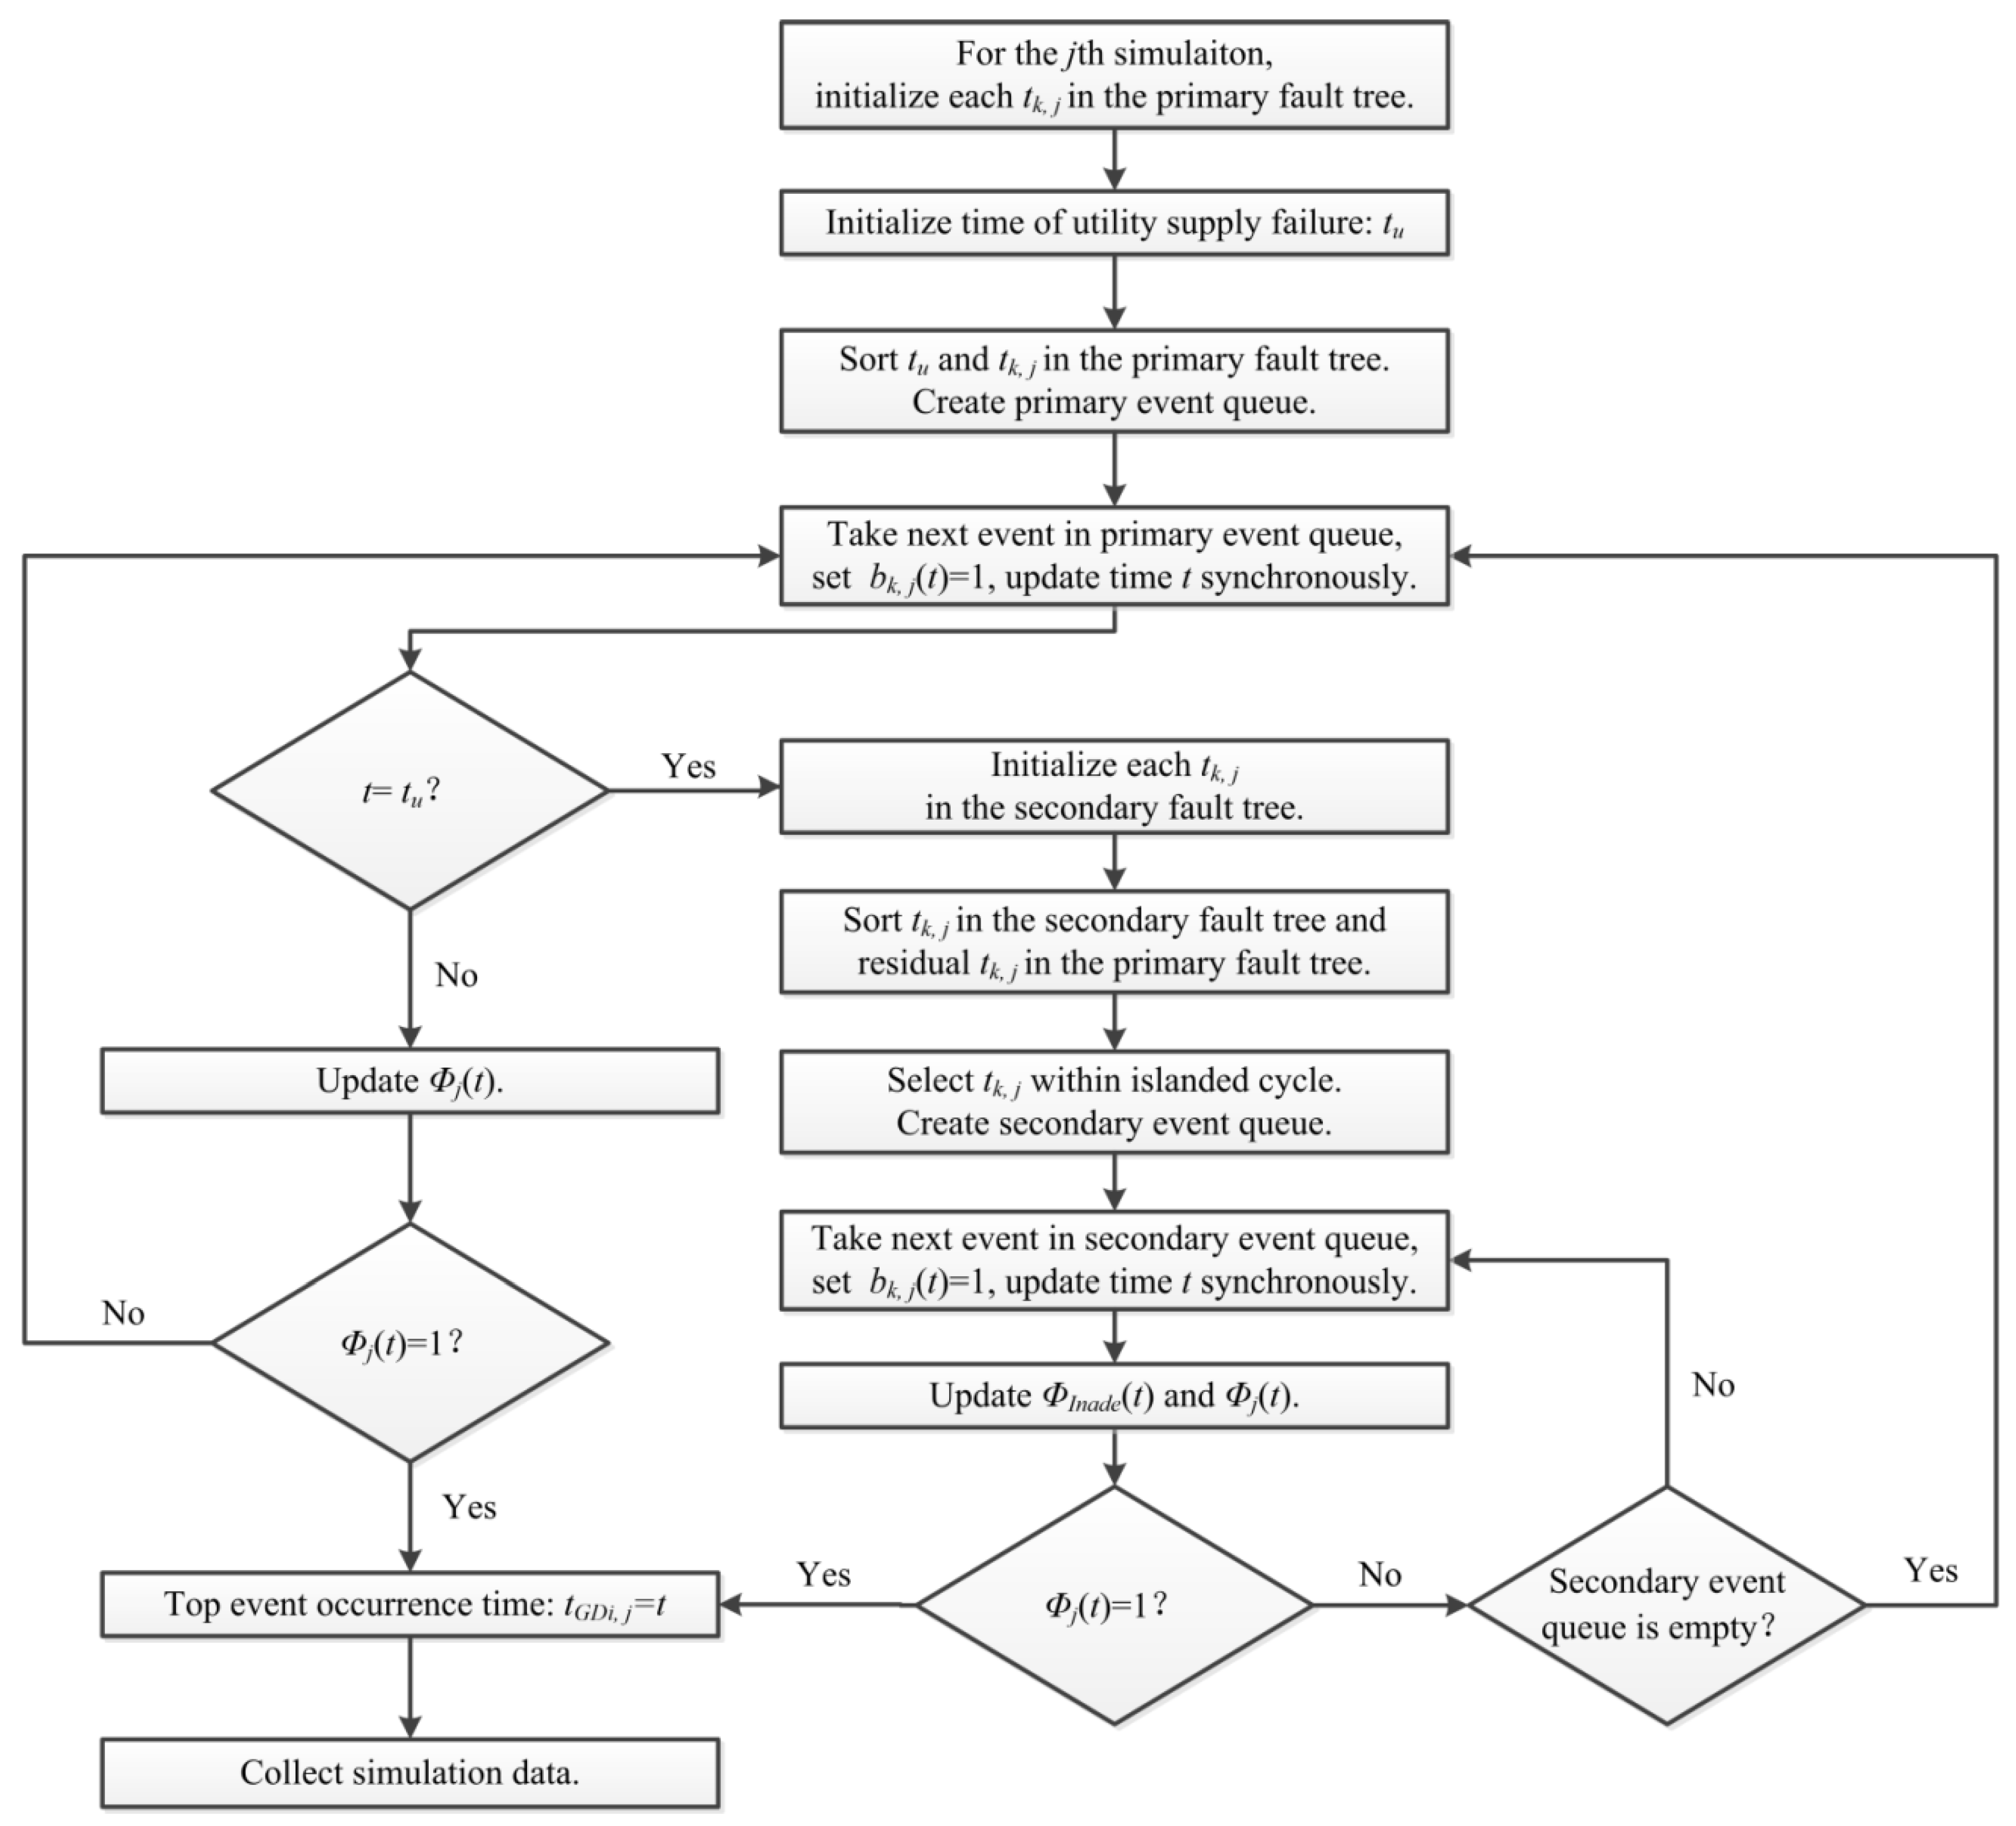
The main steps and processes of the simulation are given by the flow chart in Figure 5. A fixed time cycle is set for islanded operation of the local smart gird framework in this simulation procedure. The assessment for inadequacy judgment function of the secondary fault tree is integrated in the simulation process. In each single time of simulation, the repetition of utility supply failure is ignored due to its bare possibility. The simulation strategy can be seen as a hierarchical process, taking the simulation for the secondary fault tree as a conditioned sub-process of simulation. With this simulation strategy proposed, quantitative assessment of the layered fault tree for smart grid can be realized.
Figure 5.
Flow chart of procedure for a single time of simulation.

3. Case Study
3.1. A Case of FREEDM System
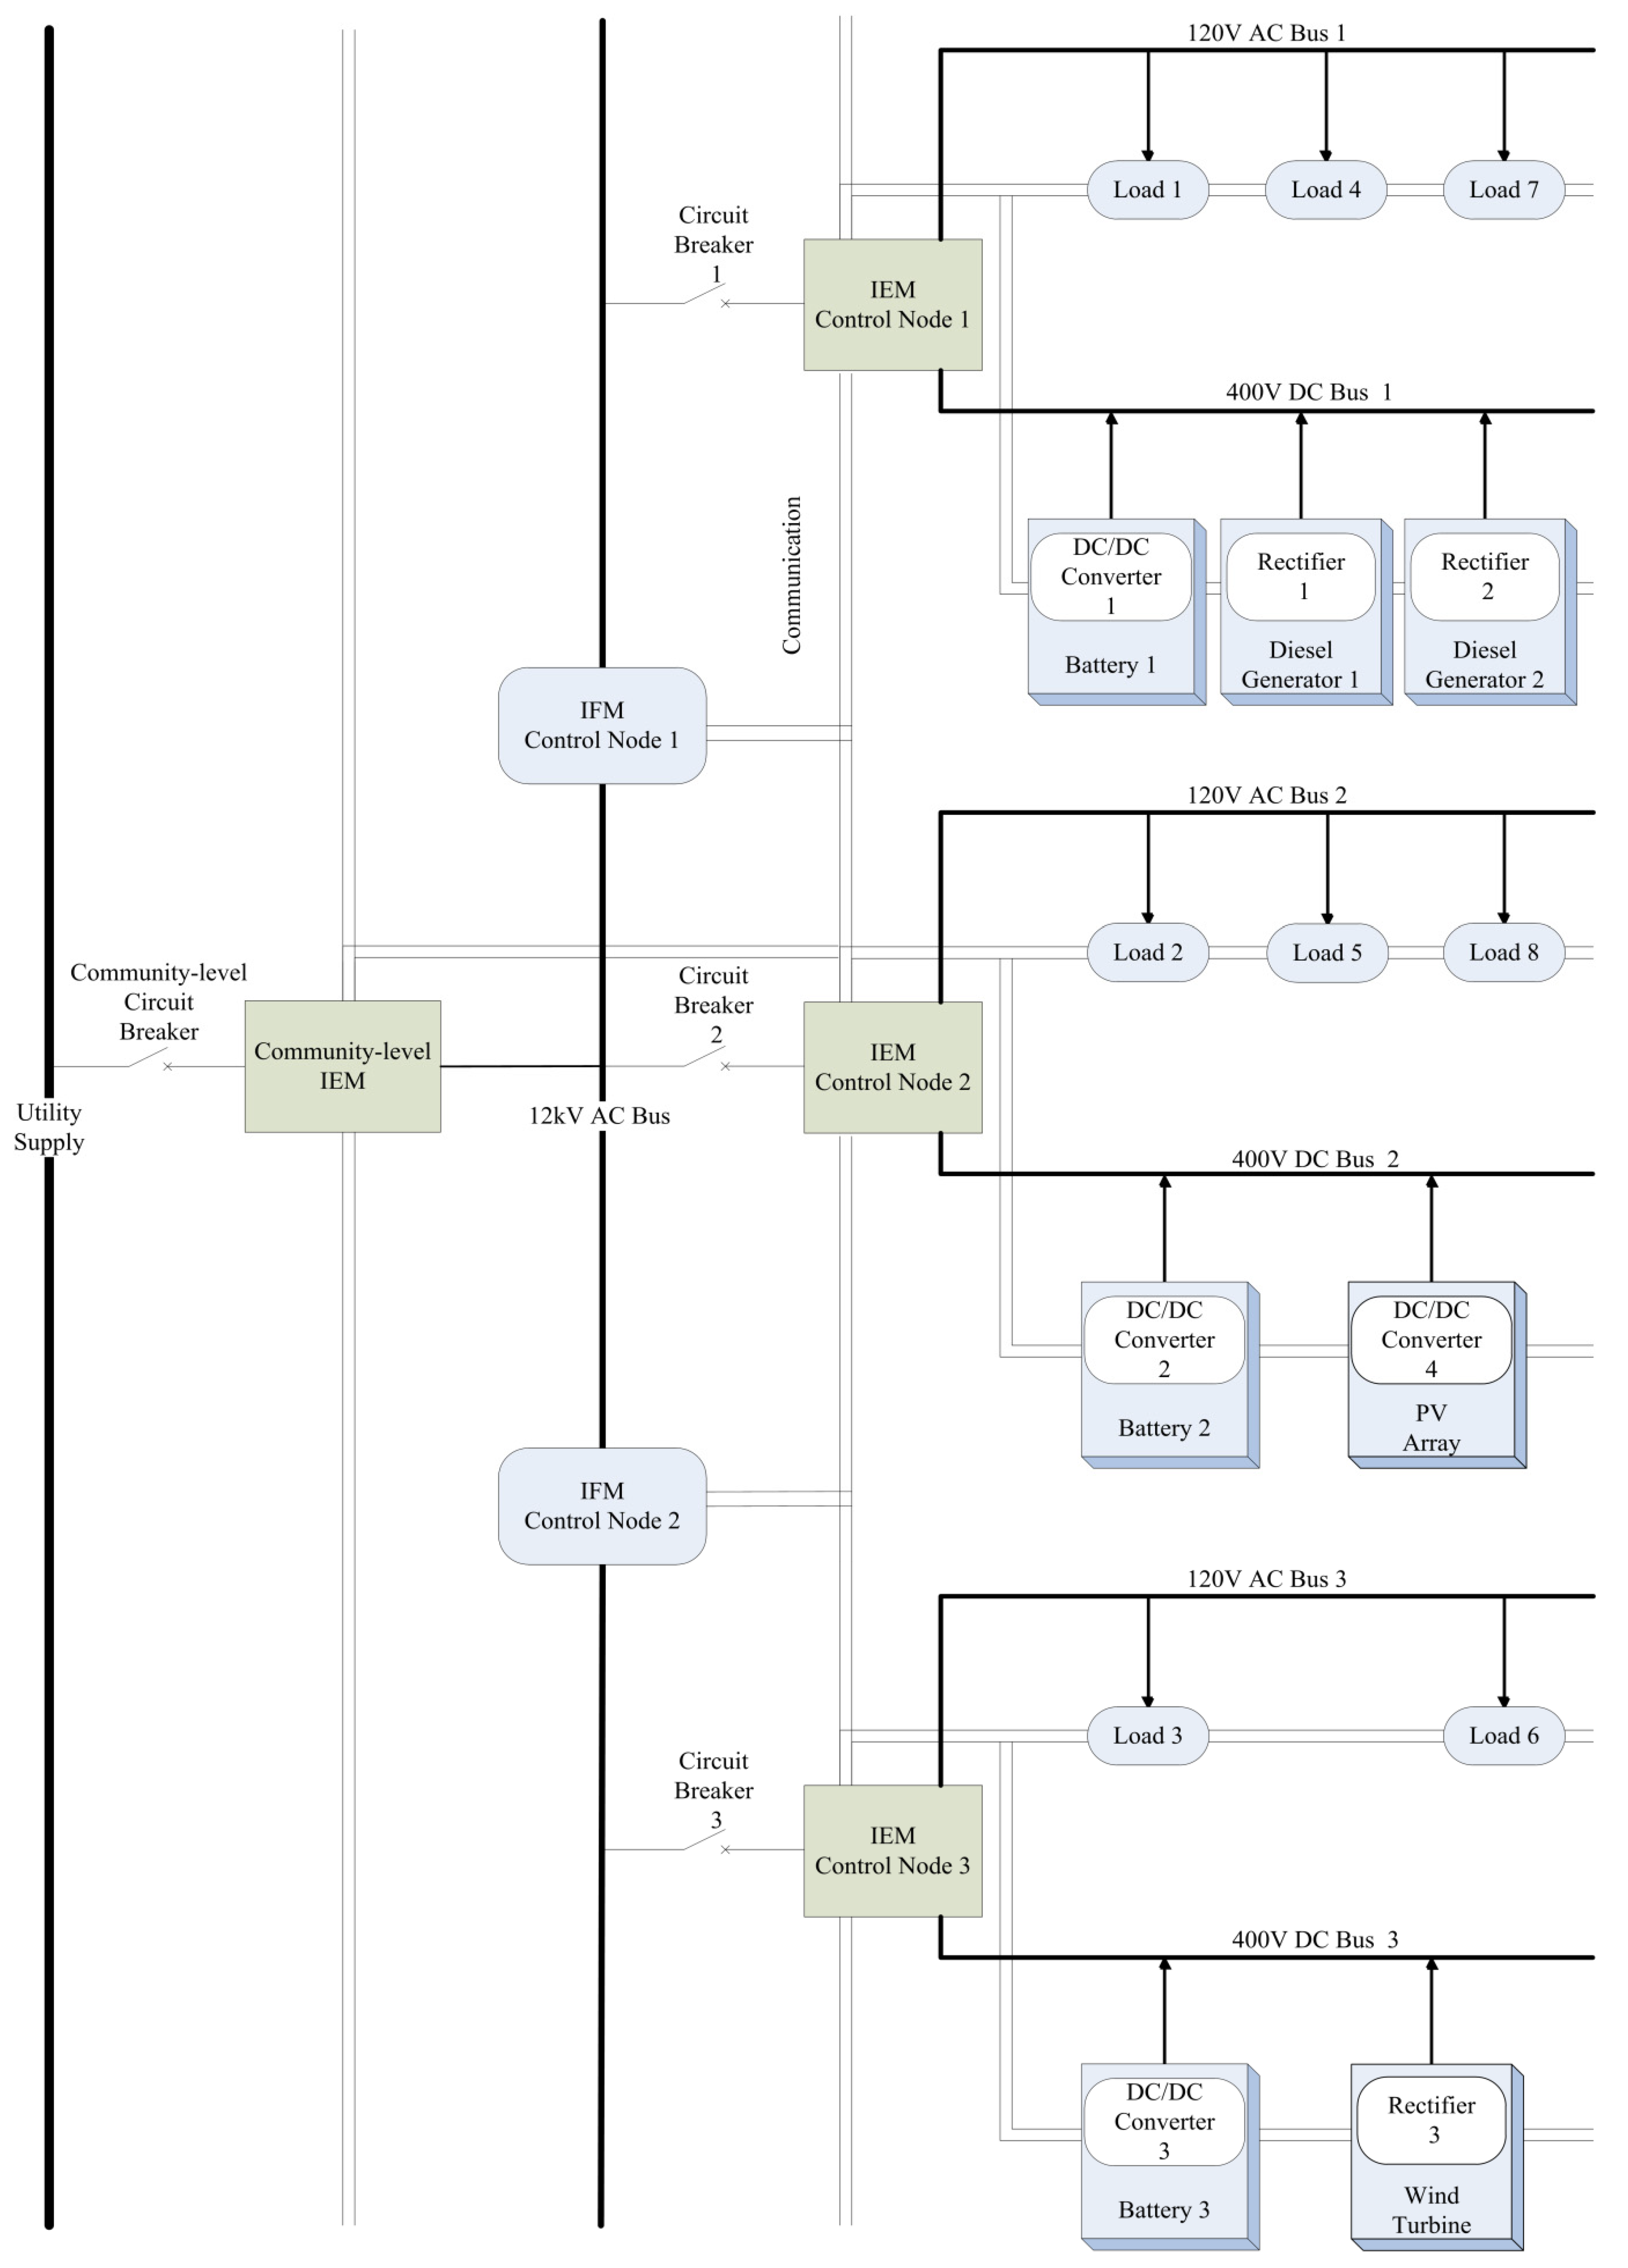
The new method is tested on the Future Renewable Electric Energy Delivery and Management (FREEDM) System, which is a practical form of the envisioned concept of smart grid. The FREEDM system is characterized by its ability of integrating highly distributed and scalable alternative generating sources and storage with existing power systems. Therefore, it has been seen as an efficient electric power grid to facilitate a green and sustainable energy-based society and mitigate the growing energy crisis [29]. According to the architecture of FREEDM system, this paper provides an example of grid-connected local framework of FREEDM system as in Figure 6.
Figure 6.
An local framework example of the FREEDM system.

The plug-and-play interface includes a 400 V direct current (DC) bus and a conventional 120 V alternating current (AC) bus, combined with an open-standard-based communication interface. Loads and modular DGs can be accessed and controlled through the standardized plug-and-play interface. Energy router, which is also regarded as an intelligent energy management (IEM) device, connects to the 12 kV AC distribution bus and supports the regulated 120 V AC and 400 V DC buses at the same time. IEMs are regarded as the intelligent substations in the FREEDM system. It recognizes and manages all devices connected to the low-voltage AC and DC buses, including distributed energy storage devices, distributed renewable energy resources and the loads. Intelligent fault management (IFM) devices are used to isolate potential faults in the 12 kV primary circuit, providing the reconfiguration capability and uninterrupted power quality to the user. Through a reliable and secure communication network, IEMs and IFMs can exchange information with each other.
The settings of priorities and capacity of the loads in the local framework of FREEDM system is given in Table 1. The DGs includes three storage batteries with the power of 5 kW, four diesel generators with the power of 10 kW, a set of PV array with maximum output power of 5 kW, a set of wind turbine also with a maximum 5 kW output power.

| Load point | Priority | Priority factor | Power demand (kW) |
|---|---|---|---|
| Load 1 | 1 | 1.000 | 5 |
| Load 2 | 2 | 0.875 | 3 |
| Load 3 | 3 | 0.750 | 5 |
| Load 4 | 4 | 0.625 | 5 |
| Load 5 | 5 | 0.500 | 2 |
| Load 6 | 6 | 0.375 | 2.5 |
| Load 7 | 7 | 0.250 | 5 |
| Load 8 | 8 | 0.125 | 2.5 |
3.2. Reliability Assessment
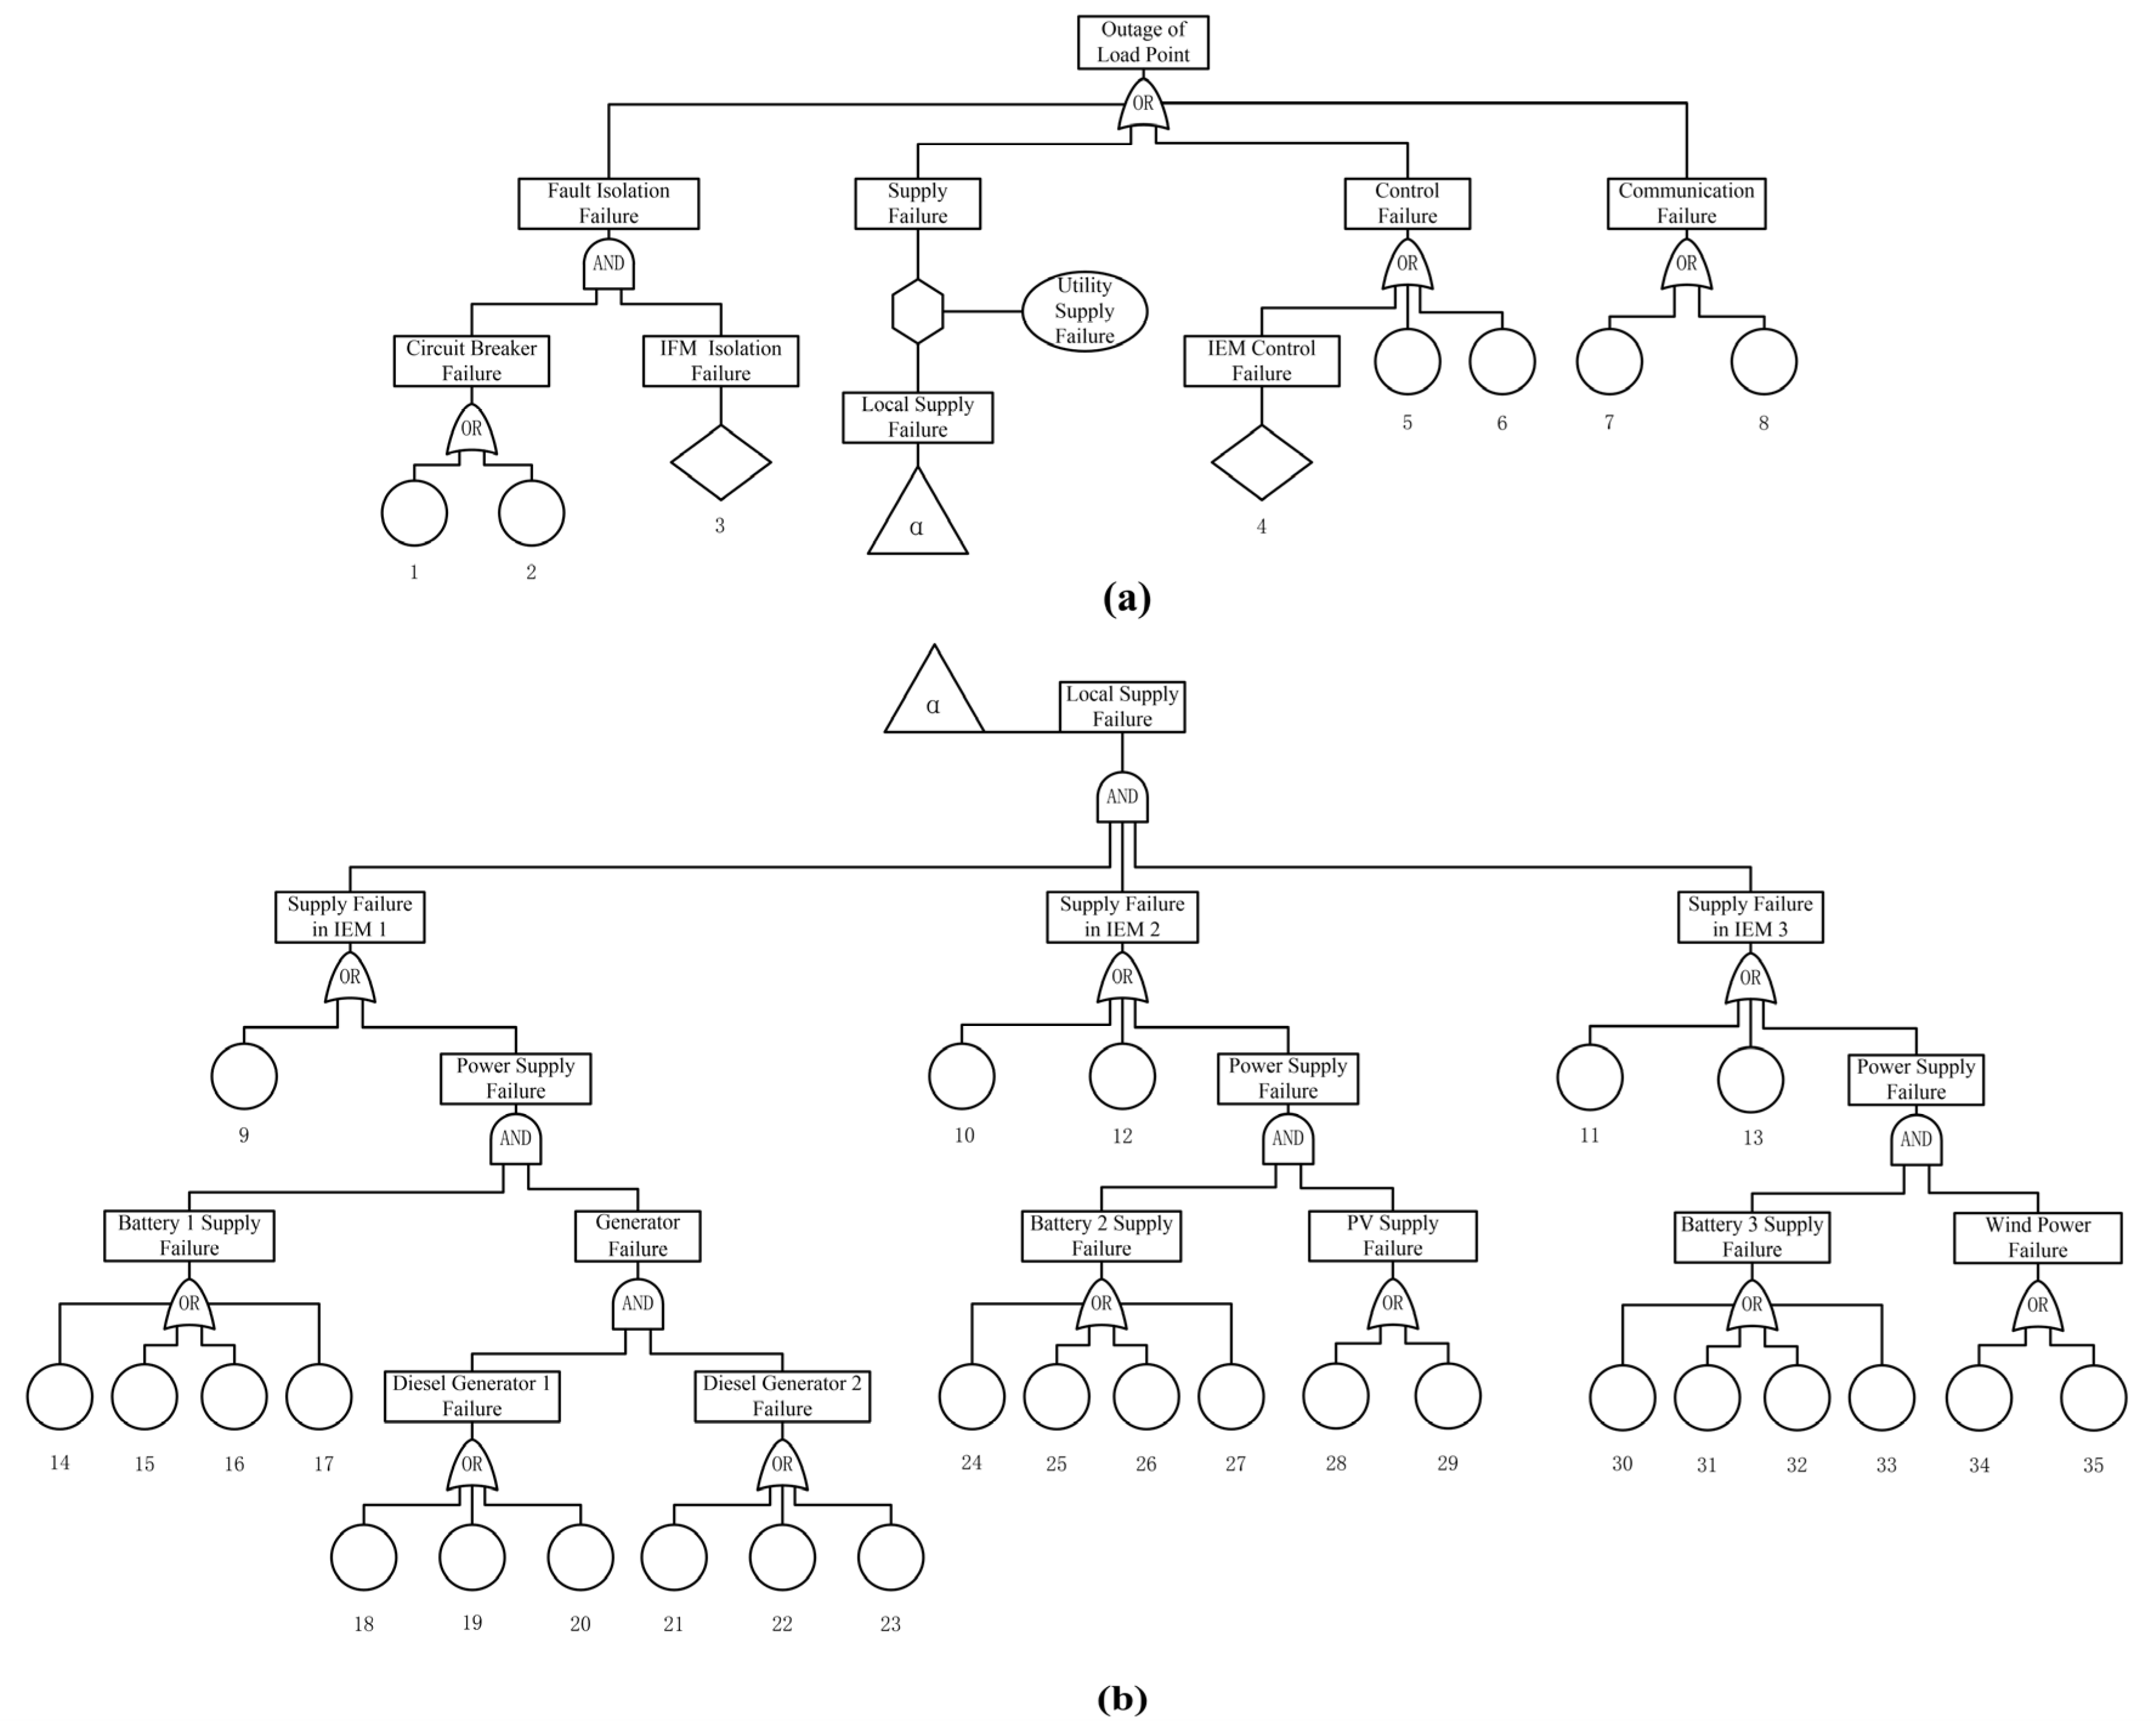
Figure 7 shows the fault tree taking outage for the load points in IEM 1 as the top event. Concerning this specific architecture of FREEDM system, the differences in the fault tree for different load points only lie in the component number of the primary fault tree, and the sections of output flow paths in the secondary fault tree. The IEMs and IFMs, corresponding to intelligent control and protection systems of the FREEDM system, are not further analyzed and decomposed. The basic events for the fault tree are listed in Table 2.
Generally, the life of the electric equipment is exponentially distributed. Fault rates of the key components refer to literature [30]. The fault rate of starting failure of diesel generator is a fixed value of 0.05 [31]. For communication failure, no data found can be directly transformed to fault rate. Considering the target bit error rate (BER) of the fiber optic transmission is as low as 1.00 × 10‒15, and the fault-tolerance mechanisms of error checking and retransmission is introduced during the process of sending and receiving, communication in the FREEDM system can get a high reliability. It is assumed that the order of magnitude for the fault rate of communication is 1.00 × 10‒8 failures/hour.
Figure 7.
Fault tree showing key events leading to outage of a load point in IEM 1: (a) Primary fault tree; (b) Secondary fault tree.
Figure 7.
Fault tree showing key events leading to outage of a load point in IEM 1: (a) Primary fault tree; (b) Secondary fault tree.

| No. | Basic Event | No. | Basic Event |
|---|---|---|---|
| 1 | Community-level circuit breaker failure | 19 | Operation failure of diesel generator 1 |
| 2 | Circuit breaker 1 failure | 20 | Starting failure of diesel generator 1 |
| 3 | IFM cooperative isolation failure | 21 | Rectifier 2 failure |
| 4 | IEM cooperative control failure | 22 | Operation failure of diesel generator 2 |
| 5 | 12 kV AC bus failure | 23 | Starting failure of diesel generator 2 |
| 6 | 120 V AC bus 1 failure | 24 | DC/DC Converter 2 failure |
| 7 | Local communication failure | 25 | Intermittent output of battery 2 |
| 8 | Cross-system communication failure | 26 | Degraded output of battery 2 |
| 9 | 400 V DC bus 1 failure | 27 | Short of battery 2 |
| 10 | 400 V DC bus 2 failure | 28 | DC/DC Converter 4 failure |
| 11 | 400 V DC bus 3 failure | 29 | PV array failure |
| 12 | Circuit breaker 2 failure | 30 | DC/DC Converter 3 failure |
| 13 | Circuit breaker 3 failure | 31 | Intermittent output of battery 3 |
| 14 | DC/DC Converter 1 failure | 32 | Degraded output of battery 3 |
| 15 | Intermittent output of battery 1 | 33 | Short of battery 3 |
| 16 | Degraded output of battery 1 | 34 | Rectifier 3 failure |
| 17 | Short of battery 1 | 35 | Wind turbine failure |
| 18 | Rectifier 1 failure |
The same dilemma of failure data is also with the IEM and IFM devices, an order of magnitude of 1.00 × 10‒8 failures/hour is given for these components, considering their paramount importance in the system. For the renewable DGs, the data of their output power refer to online database [32,33], taking the real data of generated wind power and solar power of year 2013 in the Belgium area and transforming the data to the power levels of given renewable DGs.
With layered fault tree model, we tend to analyze the reliability for different loads in the local framework of FREEDM system, using the simulation procedure for reliability assessment. The assessment is executed within a one-year cycle and the islanded cycle is set as one week (168 h).
Results of reliability for load points in the local framework are presented in Table 3. Reliability for different loads is decreased with priority, which accords with the original intention of the system design. The modified Loss of load probability (LOLP*) is evaluated as 8.34 × 10‒3, and unreliability contribution of each load is listed in Table 3. The effect of priority factor is reflected, avoiding overemphasis on the low-priority loads with higher unreliability. It contributes to a rational systematic outcome, which weighs more on the high-priority loads and reflects the concern of the users. The loads with the biggest unreliability contribution are still Load 7 and Load 8, both with a relatively higher unreliability measure.
| Load point | Reliability | Compound weight | Unreliability contribution |
|---|---|---|---|
| Load 1 | 99.9550% | 0.1667 | 7.50 × 10‒5 |
| Load 2 | 99.9518% | 0.0875 | 4.22 × 10‒5 |
| Load 3 | 99.9139% | 0.1250 | 1.08 × 10‒4 |
| Load 4 | 99.4451% | 0.1042 | 5.78 × 10‒4 |
| Load 5 | 99.3837% | 0.0333 | 2.05 × 10‒4 |
| Load 6 | 99.3311% | 0.0313 | 2.09 × 10‒4 |
| Load 7 | 86.4229% | 0.0417 | 5.66 × 10‒3 |
| Load 8 | 85.9354% | 0.0104 | 1.47 × 10‒3 |
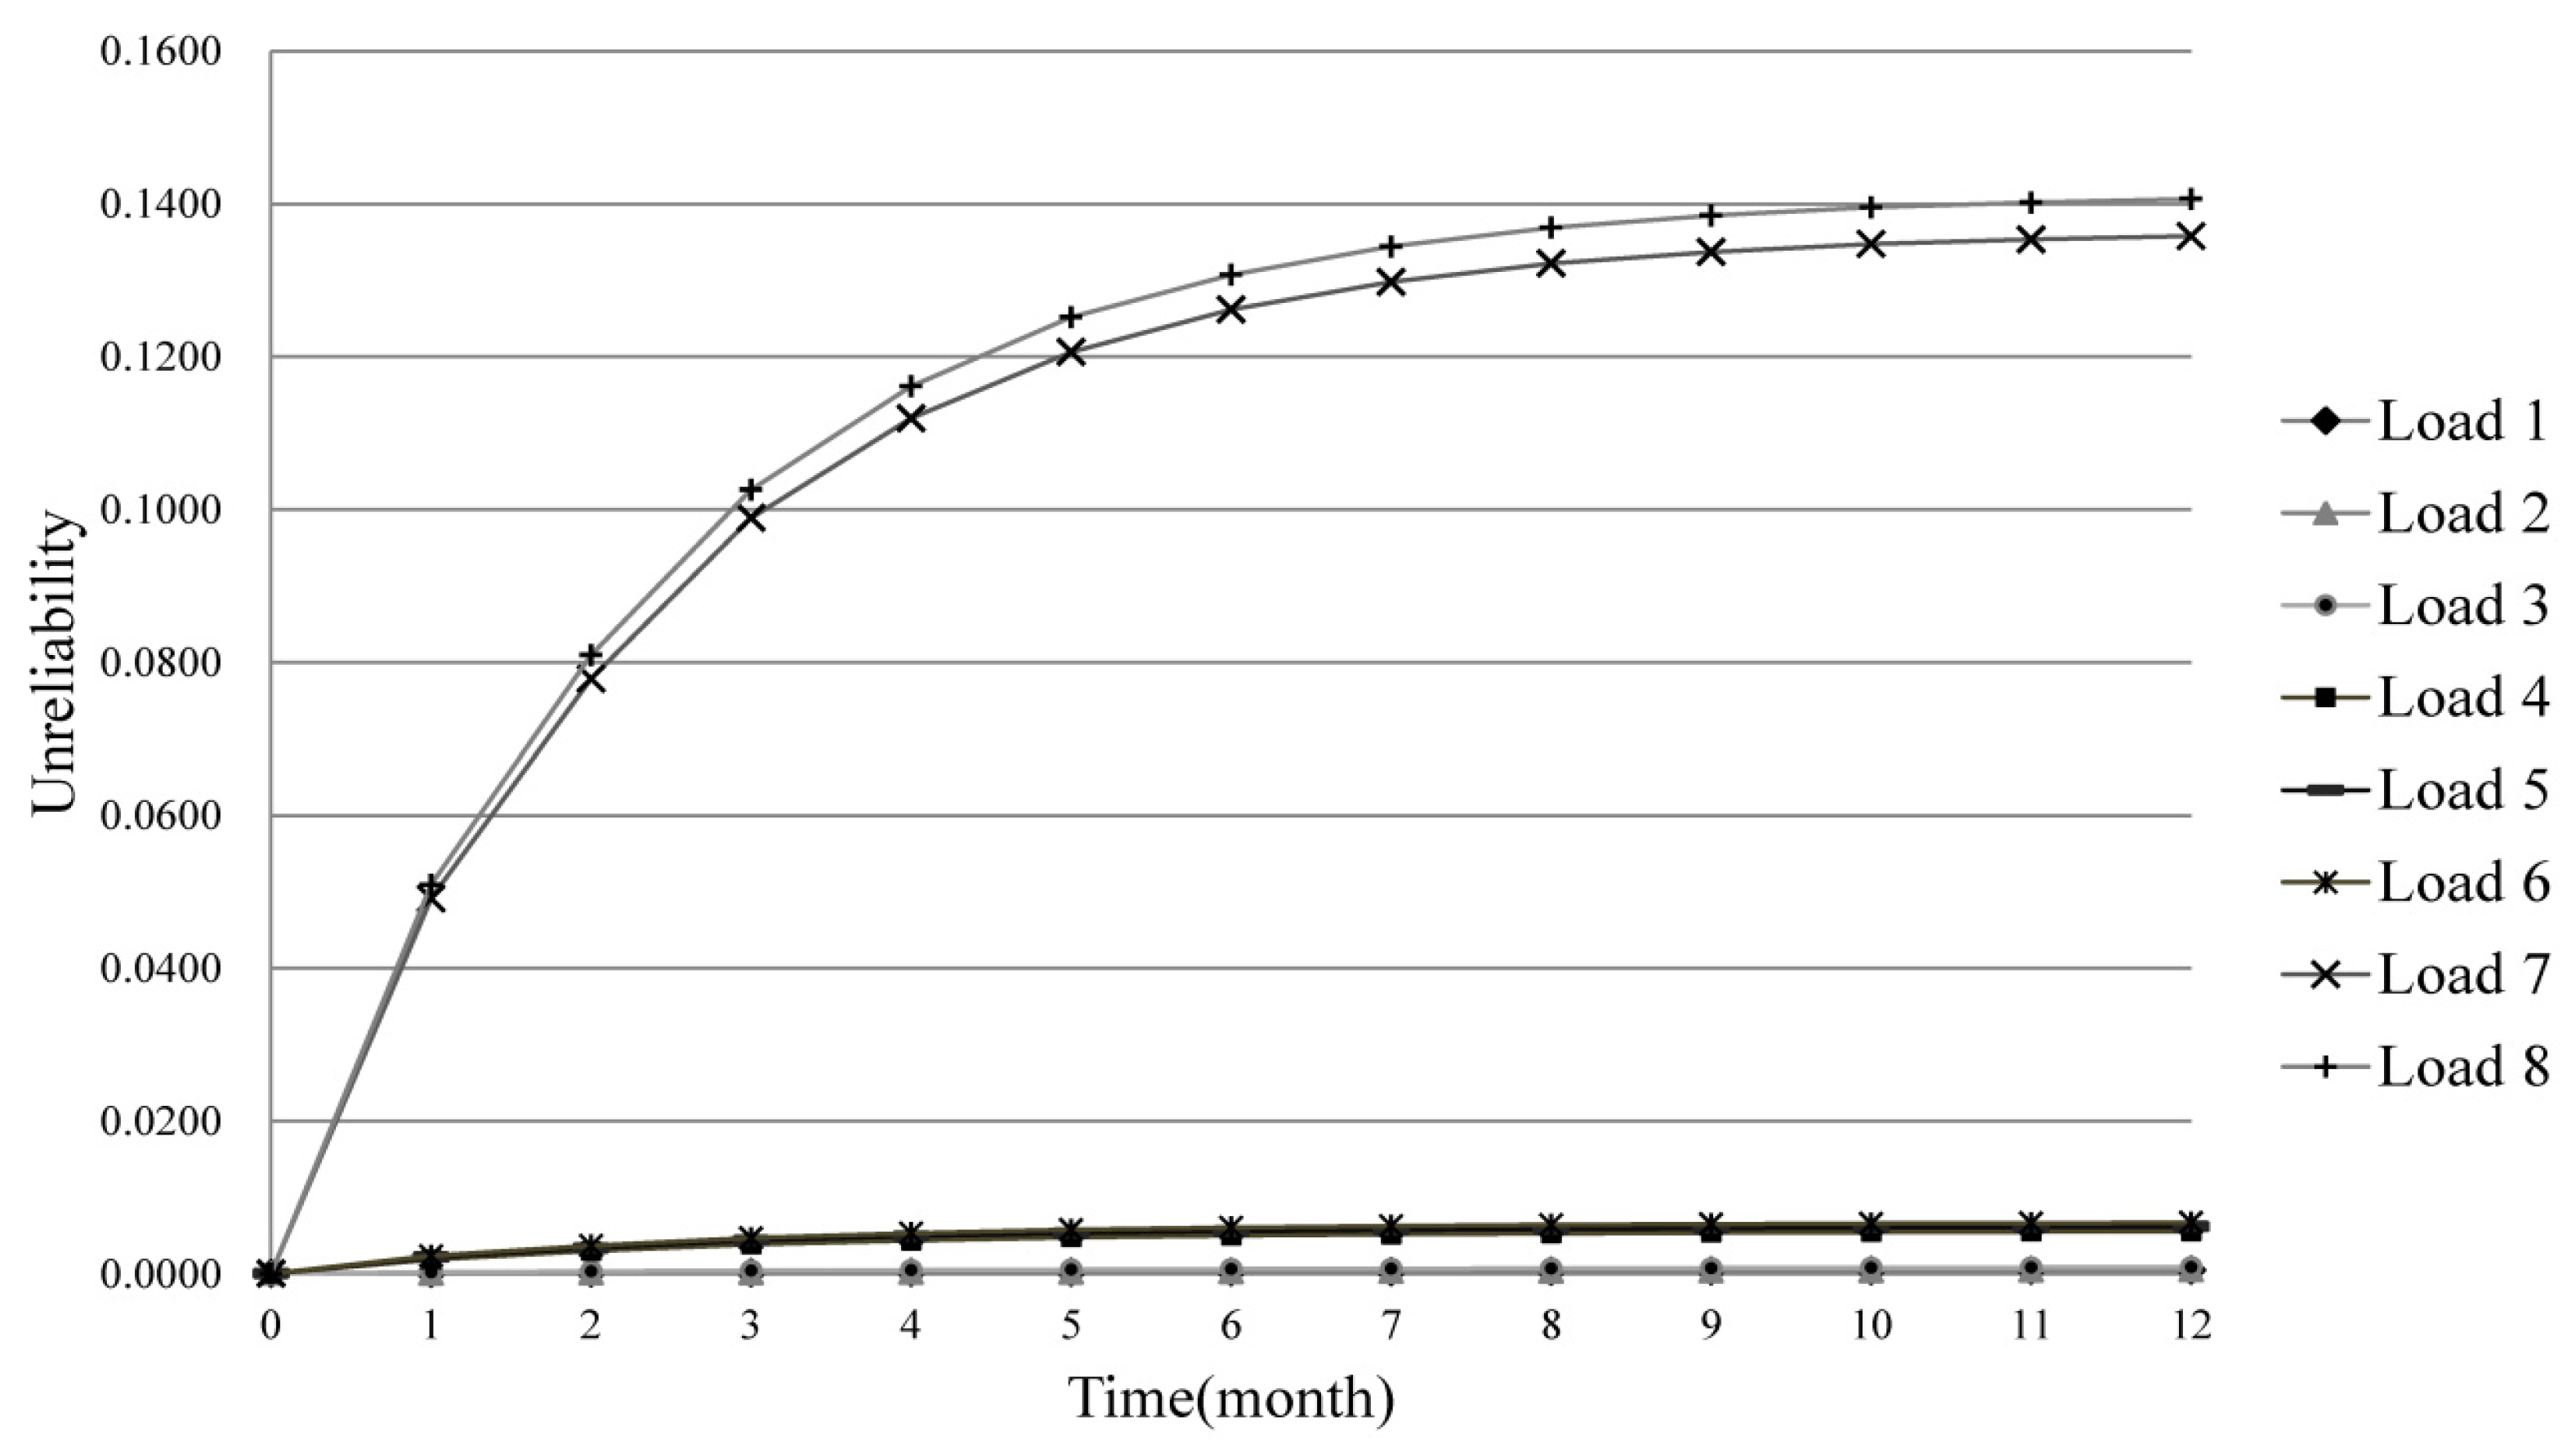
Processes of unreliability growth over time for the loads in the local framework are also recorded and shown in Figure 8. The curves are generally separated into three groups. For the loads with higher priorities from Load 1 to Load 3, their unreliability measures are very low and the unreliability curves take on an approximate linear growth trend. For Load from 4 to 6, the yearly unreliability measures are still lower than 1%. It reflects the robustness of the system architecture in a sense. As for Load 7 and Load 8, the values of unreliability are significantly greater and there is a rapid growth process in the early period. This difference mainly caused by the different reliability levels of different kinds of DGs, in that batteries have higher reliability and can only supply 20 kW power.
Importance measures for some selected components are given in Table 4. When revised importance measures are compared with the originals, some important changes with the integration of priority factor ocurr. It should be noted that the revised importance measures for the important components are increasing, and the different levels of increase cause a different ranking of the components. With larger weights given to the loads with higher priorities, the results lay more emphasis on the important loads in the local framework. The important components are highlighted, which in reality reflects the users’ concerns incarnated in load priorities.
Figure 8.
Unreliability curves in a year of different loads in the local framework.

| Component | NRAW+ | NRAW | Component | NRRW+ | NRRW |
|---|---|---|---|---|---|
| IEM | 71.9406 | 27.3848 | Diesel generator 1 | 1.2327 | 1.2198 |
| 12 kV AC bus | 71.9406 | 27.3848 | Diesel generator 2 | 1.2324 | 1.2196 |
| Local communication | 71.9406 | 27.3848 | Wind turbine | 1.0320 | 1.0275 |
| Cross-system communication | 71.9406 | 27.3848 | PV array | 1.0254 | 1.0225 |
| PV array | 71.6585 | 64.4566 | IEM | 1.0067 | 1.0024 |
| Wind turbine | 56.4163 | 49.7676 | Local communication | 1.0066 | 1.0024 |
| 120 V AC bus 1 | 37.7093 | 14.0423 | 12 kV AC bus | 1.0065 | 1.0024 |
| 400 V DC bus 1 | 33.9686 | 16.6568 | Cross-system communication | 1.0061 | 1.0022 |
| Circuit breaker 1 | 22.7390 | 10.7413 | 120 V AC bus 1 | 1.0031 | 1.0011 |
| Diesel generator 2 | 21.9213 | 21.2917 | 120 V AC bus 2 | 1.0014 | 1.0006 |
| Diesel generator 1 | 21.7725 | 21.2584 | 120 V AC bus 3 | 1.0013 | 1.0005 |
| 120 V AC bus 3 | 19.6982 | 7.8285 | IFM | 1.0003 | 1.0001 |
| 120 V AC bus 2 | 16.5330 | 7.5141 | 400 V DC bus 1 | 1.0001 | 1.0000 |
| IFM | 4.1946 | 1.8846 | Circuit breaker 1 | 1.0000 | 0.9962 |
| Battery 1 | 2.6618 | 1.8156 | 400 V DC bus 3 | 1.0000 | 1.0000 |
Components with the highest value of NRAW+ are the IEM devices, the 12 kV AC bus and communication components. These components should be maintained well, so the reliability of the system is not reduced significantly. In consequence, the maintenance priority for those components should be set high. The important components with the highest values of NRRW+ are the two diesel generators. It should also be noted that the values for the wind turbine and the PV array are notably large. It is worth increasing the reliability of these respective components, so the system reliability can be increased significantly.
The failure rates for the IEM devices, IFM devices and communication components are set manually. However, these components, especially IEM and communication components, are among the most important parts in the local framework of the FREEDM system according to their importance measures in Table 4. Sensitivity analysis should be carried out for these components, in order to analyze the influence of failure data for the reliability assessment result.
In Table 5, the failure rates for IEM devices, communication components and IFM devices are set respectively with increasing order of magnitude from 1.00 × 10‒8 to 1.00 × 10‒6. The unreliability of Load 1 and Load 8, which are the most and least important loads in the local framework of FREEDM system, are evaluated in each case.
Table 5.
Unreliability assessment of selected loads with different failure rate settings for selected components.
| IEM | Failure rate (failures/hour) | ||
|---|---|---|---|
| 1.00 × 10‒8 | 1.00 × 10‒7 | 1.00 × 10‒6 | |
| Unreliability of Load 1 | 4.50 × 10‒4 | 1.24 × 10‒3 | 9.13 × 10‒3 |
| Unreliability of Load 8 | 1.41 × 10‒1 | 1.42 × 10‒1 | 1.49 × 10‒1 |
| Communication | Failure rate (failures/hour) | ||
| 1.00 × 10‒8 | 1.00 × 10‒7 | 1.00 × 10‒6 | |
| Unreliability of Load 1 | 4.50 × 10‒4 | 2.06 × 10‒3 | 1.79 × 10‒2 |
| Unreliability of Load 8 | 1.41 × 10‒1 | 1.42 × 10‒1 | 1.55 × 10‒1 |
| IFM | Failure rate (failures/hour) | ||
| 1.00 × 10‒8 | 1.00 × 10‒7 | 1.00 × 10‒6 | |
| Unreliability of Load 1 | 4.50 × 10‒4 | 4.55 × 10‒4 | 8.42 × 10‒4 |
| Unreliability of Load 8 | 1.41 × 10‒1 | 1.41 × 10‒1 | 1.42 × 10‒1 |
For Load 1, the growth of failure rates of IEM and communication components significantly increase the unreliability. However, the effect is not obvious with the IFM devices. As for Load 8, its unreliability stays steady without obvious changes as the failure rate of any of the three devices increases. It is because the high unreliability of Load 8 is mainly caused by lack of power, which is highly related to DGs, especially the renewable DGs and the generators. It should be point out that techniques of communication and intelligent control are the basis of smart grid establishment and are of key importance during the actual operation. Reliability of these parts should be guaranteed for a global reliability. Reliability evaluating method and procedure for these components also deserve further research.
4. Conclusions
In this paper, a modified layered fault tree model is proposed in order to distinguish and separate the two different power supply modes of utility supply and local supply, focusing on a potential islanded local framework of a specific smart grid architecture. Fault tree analysis has been a favorable method in reliability and safety evaluation, providing insights into the structure of the complex systems. It is an effective visual tool for engineering and management. The proposed fault tree construction procedure makes the model greatly simplified and unitized compared to the conventional fault tree model, with the layering procedure and inadequacy judgment function integrated.
Revised importance measures for components considering load priority are presented and are applicable to find the weak parts of the system in order to improve the design and using. Corresponding hierarchical Monte Carlo simulation method for reliability assessment is proposed for the layered fault tree model, with integration of state transition process of different power supply modes.
The proposed layered fault tree model and reliability evaluation process combine power adequacy assessment with system failure logic, delivering a comprehensive insight into system failure. With the layering procedure and inadequacy judgment function integrated, the fault tree model will be greatly simplified and unitized compared to the conventional fault tree model. It also needs to be concerned that the evaluation process may require huge amount of computation, taking the dynamic aspect of DGs and loads as well as the increasing scale of system into consideration.
The lack of pertinent failure-rate data makes it difficult to evaluate the reliability of the system. Sensitivity analysis has to be applied to evaluate the influence of deficient data. The proposed procedure is successfully tested on a case study of the FREEDM system. Thanks to the advanced automation and communication infrastructures along with the standardized structure of smart grids, the procedures proposed can be accomplished and applicable to other forms of smart grids.
Future work may include integration of reliability assessment of intelligent control and protection systems of the smart grids, more realistic priority weighting method better reflecting users’ concerns, inclusion of realistic probability distribution for islanded time and a more efficient procedure and algorithm for reliability assessment of smart grids on a large scale.
Acknowledgments
The authors are grateful to Jianjun Qi and Tao Zhang from NUDT who gave some important suggestions and would sincerely thank the editor and referees for their valuable comments.
Author Contributions
For this paper, Guopeng Song is the principle investigator and in charge of modeling, design of experiments and paper writing. Hao Chen completes the writing work partially and participates in experiments. Bo Guo gives theoretical and methodological guidance in the research process.
Nomenclature
| i | Identifier and the priority of load in the local smart grid framework |
| NL | The number of all loads in the local smart grid framework |
| j | Identifier of current simulation |
| n | The number of basic events |
| N | Total number of times of simulation |
| k | Identifier of component in the local smart grid framework |
| fp | Identifier of output flow path |
| Nfp | The number of all output flow paths |
| fpi | Identifier of DG connected to output flow path fp |
| fp_N | The number of all DGs connected to output flow path fp |
| Ki | Capacity of load i |
| K | Total capacity of the local smart grid framework |
| Pi | Priority factor of load i |
| LOLP | Loss of load probability measure of the local smart grid framework |
| LOLP* | Modified Loss of load probability measure of the local smart grid framework |
 | Risk achievement worth for component k corresponding to load i |
 | Risk reduction worth for component k corresponding to load i |
| NRAWk | Power system risk achievement worth of component k |
| NRRWk | Power system risk reduction worth of component k |
 | Modified smart grid risk achievement worth of component k |
 | Modified smart grid reduction worth of component k |
| QGDi | Failure probability of power delivery to load i |
| QGDi(QK = 1) | Failure probability of power delivery to load i when unreliability of component k is set to 1 |
| QGDi(QK = 0) | Failure probability of power delivery to load i when unreliability of component k is set to 0 |
| tk,j | Fault time of component k in the jth simulation |
| tGDi,j | Occurrence time of the top event of load i in the jth simulation |
| OFPfp(t) | State function for output flow path fp |
| POWtot(t) | Total power generated by the DGs at time t |
| POWfpi(t) | Power function for DG fpi connected to output flow path fp |
| powDi(t) | Real-time power demand of load i |
| powerfpi(t) | Real-time power generated of DG fpi |
| X(t) | State variable of the system |
| bk,j(t) | State function for basic event of component k in the jth simulation |
| ϕ[X(t)] | Structure function of the fault tree |
Conflicts of Interest
The authors declare no conflict of interest.
References
- Fang, X.; Misra, S.; Xue, G.; Yang, D. Smart grid—The new and improved power grid: A Survey. IEEE Commun. Surv. Tutor. 2012, 14, 944–980. [Google Scholar] [CrossRef]
- Ardito, L.; Procaccianti, G.; Menga, G.; Morisio, M. Smart grid technologies in Europe: An overview. Energies 2013, 6, 251–281. [Google Scholar] [CrossRef]
- Gharavi, H.; Ghafurian, R. Smart grid: The electric energy system of the future. Proc. IEEE 2011, 99, 917–921. [Google Scholar] [CrossRef]
- Billinton, R.; Alan, R.N. Reliability Evaluation of Power Systems; Plenum Press: New York, NY, USA, 1995. [Google Scholar]
- Billinton, R.; Billinton, J.E. Distribution system reliability indices. IEEE Trans. Power Deliv. 1989, 4, 561–568. [Google Scholar] [CrossRef]
- Billinton, R.; Wang, P. Reliability-network-equivalent approach to distribution-system-reliability evaluation. IEE Proc. 1998, 145, 149–153. [Google Scholar]
- Billinton, R.; Wang, P. Teaching distribution system reliability evaluation using Monte Carlo simulation. IEEE Trans. Power Syst. 1999, 14, 397–403. [Google Scholar] [CrossRef]
- Balijepalli, N.; Venkata, S.S.; Christie, R.D. Modeling and analysis of distribution reliability indices. IEEE Trans. Power Deliv. 2004, 19, 1950–1955. [Google Scholar] [CrossRef]
- Heydt, G.T.; Graf, T.J. Distribution system reliability evaluation using enhanced samples in a Monte Carlo approach. IEEE Trans. Power Syst. 2010, 25, 2006–2008. [Google Scholar] [CrossRef]
- Kennedy, S. Reliability evaluation of islanded microgrids with stochastic distributed generation. In Proceedings of the 2009 PES ’09. IEEE Power & Energy Society General Meeting, Galgary, AB, Canada, 26–30 July 2009; pp. 1–8.
- Tanrioven, M. Reliability and cost-benefits of adding alternate power sources to an independent micro-grid community. J. Power Sour. 2005, 150, 136–149. [Google Scholar] [CrossRef]
- Conti, S.; Nicolosi, R.; Rizzo, S.A. Generalized systematic approach to assess distribution system reliability with renewable distributed generators and microgrids. IEEE Trans. Power Deliv. 2012, 27, 261–270. [Google Scholar] [CrossRef]
- Atwa, Y.M.; El-Saadany, E.F. Reliability evaluation for distribution system with renewable distributed generation during islanded mode of operation. IEEE Trans. Power Syst. 2009, 24, 572–581. [Google Scholar] [CrossRef]
- Al-Muhaini, M.; Heydt, G.T. Evaluating future power distribution system reliability including distributed generation. IEEE Trans. Power Deliv. 2013, 28, 2264–2272. [Google Scholar] [CrossRef]
- Lee, W.S.; Grosh, D.L.; Tillman, F.A.; Lie, C.H. Fault tree analysis, methods, and applications—A review. IEEE Trans. Reliab. 1985, R-34, 194–203. [Google Scholar]
- Abdul Rahman, F.; Varuttamaseni, A.; Kintner-Meyer, M.; Lee, J.C. Application of fault tree analysis for customer reliability assessment of a distribution power system. Reliab. Eng. Syst. Saf. 2013, 111, 76–85. [Google Scholar] [CrossRef]
- Volkanovski, A.; Čepin, M.; Mavko, B. Application of the fault tree analysis for assessment of power system reliability. Reliab. Eng. Syst. Saf. 2009, 94, 1116–1127. [Google Scholar]
- Chang, H.-H. Non-intrusive demand monitoring and load identification for energy management systems based on transient feature analyses. Energies 2012, 5, 4569–4589. [Google Scholar] [CrossRef]
- Sendin, A.; Berganza, I.; Arzuaga, A.; Osorio, X.; Urrutia, I.; Angueira, P. Enhanced operation of electricity distribution grids through smart metering PLC network monitoring, analysis and grid conditioning. Energies 2013, 6, 539–556. [Google Scholar] [CrossRef]
- Li, Z.; Yuan, Y.; Li, F. Evaluating the reliability of islanded microgrid in an emergency mode. In Proceedings of the 2010 International Universities Power Engineering Conference (UPEC), Cardiff, Wales, UK, 31 August–3 September 2010.
- Pipattanasomporn, M.; Feroze, H.; Rahman, S. Multi-agent systems in a distributed smart grid: Design and implementation. In Proceedings of the 2009. PSCE ’09. IEEE/PES Power Systems Conference and Exposition, Seattle, WA, USA, 15–18 March 2009; pp. 1–8.
- Chuang, A.; McGranaghan, M. Functions of a local controller to coordinate distributed resources in a smart grid. In Proceedings of the 2008 IEEE Power and Energy Society General Meeting—Conversion and Delivery of Electrical Energy in the 21st Century, Pittsburgh, PA, USA, 20–24 July 2008; pp. 1–6.
- Billinton, R.; Chen, H.; Ghajar, R. Time-series models for reliability evaluation of power systems including wind energy. Microelectron. Reliab. 1996, 36, 1253–1261. [Google Scholar] [CrossRef]
- Jeongje, P.; Wu, L.; Jaeseok, C.; El-Keib, A.A.; Shahidehpour, M.; Billinton, R. A probabilistic reliability evaluation of a power system including Solar/Photovoltaic cell generator. In Proceedings of the 2009. PES ’09. IEEE Power & Energy Society General Meeting, Galgary, AB, Canada, 26–30 July 2009; pp. 1–6.
- Peng, W.; Billinton, R. Time sequential distribution system reliability worth analysis considering time varying load and cost models. IEEE Trans. Power Deliv. 1999, 14, 1046–1051. [Google Scholar] [CrossRef]
- Yeh, W.-C. An improved sum-of-disjoint-products technique for the symbolic network reliability analysis with known minimal paths. Reliab. Eng. Syst. Saf. 2007, 92, 260–268. [Google Scholar] [CrossRef]
- Čepin, M. Analysis of truncation limit in probabilistic safety assessment. Reliab. Eng. Syst. Saf. 2005, 87, 395–403. [Google Scholar] [CrossRef]
- Salem, S.L.; Apostolakis, G.; Okrent, D. Computer-oriented approach to fault-tree construction. California University: Los Angeles, CA, USA, 1976. [Google Scholar]
- Huang, A.Q.; Crow, M.L.; Heydt, G.T.; Zheng, J.P.; Dale, S.J. The future renewable electric energy delivery and management (FREEDM) system: The energy internet. Proc. IEEE 2011, 99, 133–148. [Google Scholar] [CrossRef]
- Rahmat, M.K.; Jovanovic, S. Reliability modelling of uninterruptible power supply systems using fault tree analysis method. Eur. Trans. Electr. Power 2009, 19, 258–273. [Google Scholar] [CrossRef]
- Bae, I.; Kim, J. Reliability evaluation of customers in a microgrid. IEEE Trans. Power Syst. 2008, 23, 1416–1422. [Google Scholar]
- Wind-power generation data. Available online: http://www.elia.be/en/grid-data/power-generation/wind-power (accessed on 25 May 2014).
- Solar-PV power generation data. Available online: http://www.elia.be/en/grid-data/power-generation/Solar-power-generation-data (accessed on 25 May 2014).
© 2014 by the authors; licensee MDPI, Basel, Switzerland. This article is an open access article distributed under the terms and conditions of the Creative Commons Attribution license (http://creativecommons.org/licenses/by/3.0/).
Share and Cite
MDPI and ACS Style
Song, G.; Chen, H.; Guo, B. A Layered Fault Tree Model for Reliability Evaluation of Smart Grids. Energies 2014, 7, 4835-4857. https://doi.org/10.3390/en7084835
AMA Style
Song G, Chen H, Guo B. A Layered Fault Tree Model for Reliability Evaluation of Smart Grids. Energies. 2014; 7(8):4835-4857. https://doi.org/10.3390/en7084835
Chicago/Turabian StyleSong, Guopeng, Hao Chen, and Bo Guo. 2014. "A Layered Fault Tree Model for Reliability Evaluation of Smart Grids" Energies 7, no. 8: 4835-4857. https://doi.org/10.3390/en7084835