Article

Cycle Life of Commercial Lithium-Ion Batteries with Lithium Titanium Oxide Anodes in Electric Vehicles

State Key Laboratory of Automotive Safety and Energy, Department of Automotive Engineering, Tsinghua University, Beijing 100084, China
*
Author to whom correspondence should be addressed.
Energies 2014, 7(8), 4895-4909; https://doi.org/10.3390/en7084895
Submission received: 24 June 2014 / Revised: 20 July 2014 / Accepted: 22 July 2014 / Published: 30 July 2014
(This article belongs to the Special Issue Electrochemical Energy Storage—Battery and Capacitor)

Abstract

:
The lithium titanium oxide (LTO) anode is widely accepted as one of the best anodes for the future lithium ion batteries in electric vehicles (EVs), especially since its cycle life is very long. In this paper, three different commercial LTO cells from different manufacturers were studied in accelerated cycle life tests and their capacity fades were compared. The result indicates that under 55 °C, the LTO battery still shows a high capacity fade rate. The battery aging processes of all the commercial LTO cells clearly include two stages. Using the incremental capacity (IC) analysis, it could be judged that in the first stage, the battery capacity decreases mainly due to the loss of anode material and the degradation rate is lower. In the second stage, the battery capacity decreases much faster, mainly due to the degradation of the cathode material. The result is important for the state of health (SOH) estimation and remaining useful life (RUL) prediction of battery management system (BMS) for LTO batteries in EVs.

1. Introduction

Owing to the energy crisis and environmental problems, electric vehicles (EVs) and energy storage stations are developing very fast now. Lithium ion batteries are regarded as one of the most critical parts [1,2]. The battery management system (BMS) is of great importance to make better use of the batteries in EVs. Since the battery capacity fades as the battery cycle time increases, in BMS the battery state of health (SOH) estimation algorithm is of great significance. The capacity of new batteries can be derived easily, but the capacity of aged cells should be estimated according to the battery cycle life properties. Besides, the battery remaining useful life (RUL) could be analyzed based on the battery cycle life [3].
Currently, battery cycle life studies are all based on lithium ion batteries with graphite based anodes. However, the cycle life of lithium ion batteries with graphite anodes is limited due to the unavoidable solid electrolyte interface (SEI) film formation and thickening on the graphite anode, lithium plating while charging under low temperature, and other side reactions. Nowadays, the lithium titanium oxide (LTO, usually Li4Ti5O12) anode is considered as a better choice than the conventional graphite anode [4], because of its zero-strain property, nanosized particle, no SEI film formation, no lithium plating while fast charging and charging under low temperature, and thermal stability under high temperature, etc. [5]. Thus the lithium ion battery with LTO anode shows a very long cycle life. This result is also verified in many literatures [1,4,6,7]. The battery capacity loss is usually very small under ordinary cycle conditions, especially under room temperature [7]. However, there are scant literature reports on the cycle life and aging mechanism of commercial LTO cells and the corresponding management algorithm in EVs.
The capacity fade of graphite-based anode lithium ion batteries has been reported by numerous authors and it usually follows a power law relation with time [8,9]. This result could be explained by the loss of lithium ions due to the continuous SEI film thickening. However, the battery aging mechanism of LTO-based anode lithium ion batteries is totally different from that of graphite anode batteries, thus the capacity fade of LTO cells is totally different. Consequently, the cycle life of commercial LTO cells must be investigated and the aging mechanism should be analyzed for the battery management algorithm. The battery aging mechanism could be studied by methods including X-ray diffraction (XRD), scanning electron microscopy (SEM), etc. However, from the EV engineer’s perspective, these methods would cause irreversible battery damage and complicated equipment is needed, thus these methods cannot be applied to the BMS in a real vehicle. Hence, in situ voltage measurement methods are necessary and used in this paper. The incremental capacity (IC) curve, i.e., dQ/dV = f(V) [10,11], and the differential voltage (DV) curve, i.e., dV/dQ = f(Q) [12,13], could provide huge information about the reactions inside the battery. Thus, based on the analysis of the IC and DV curves, the battery aging mechanism could be identified without battery destruction. Dubarry et al. [10,11,14] introduced and validated methods of IC analysis. Methods involving DV have been introduced by Bloom et al. [15], Honkura et al. [16], and Dahn et al. [17], and these methods have the potential to be utilized in the BMS to do the on-line diagnosis and battery SOH estimation.
In this paper, the experiment design is described in Section 2. In Section 3, the cycle life results of three different commercial lithium ion batteries with LTO anodes are shown and the internal aging mechanism is analyzed by the IC curve and DV curve. Some key issues about the battery management of lithium ion batteries with LTO anodes in EVs are discussed. The conclusions are presented in Section 4.

2. Experiment Design

In this paper, three commercial lithium ion cells with LTO anodes from different manufacturers are tested and compared to show the cycle life of LTO batteries. All the batteries are candidates for EV application. The basic parameters of the three cells are shown in Table 1. For convenience, these batteries are labeled as Cells A, B and C. The cathode material of all the three batteries is LiNixCoyMn1−xyO2 (NCM) according to the manufacturers’ announcement.
Table 1. Basic parameters of the three cells.
ItemRate capacityWeight1/3C discharge energy
Cell A20 A∙h0.510 kg46.22 W∙h
Cell B15 A∙h0.4618 kg37.15 W∙h
Cell C10 A∙h0.295 kg25.33 W∙h
Due to the excellent cycle life of LTO cells, the cycling temperature is selected as 55 °C to accelerate the battery degradation. It is possible that in a real vehicle the battery temperature can rise above 55 °C, especially when driving under hot summer conditions. Considering that the LTO battery is usually utilized for fast charging, in the cycle life test the charge rate is set as 3C and the discharge rate is set as 2C. The cells are charged to 2.7 V, rested for 20 min and discharged to 1.5 V. After every 90 cycles, the temperature of the cells is regulated to 25 °C and a reference performance test including a capacity test and a hybrid pulse power characterization (HPPC) test is conducted.
The experiments are performed in an eight-channels, UBT 100-020-8 type battery test bench made by Digatron (Aachen, Germany) which has a current range of −100 A to +100 A and a voltage range of 0–20 V. The voltage accuracy is 1 mV and the current accuracy is ±0.1% full scale. All the tested cells are put into one temperature chamber to maintain the ambient temperature at a similar specific and constant value.

3. Results and Discussion

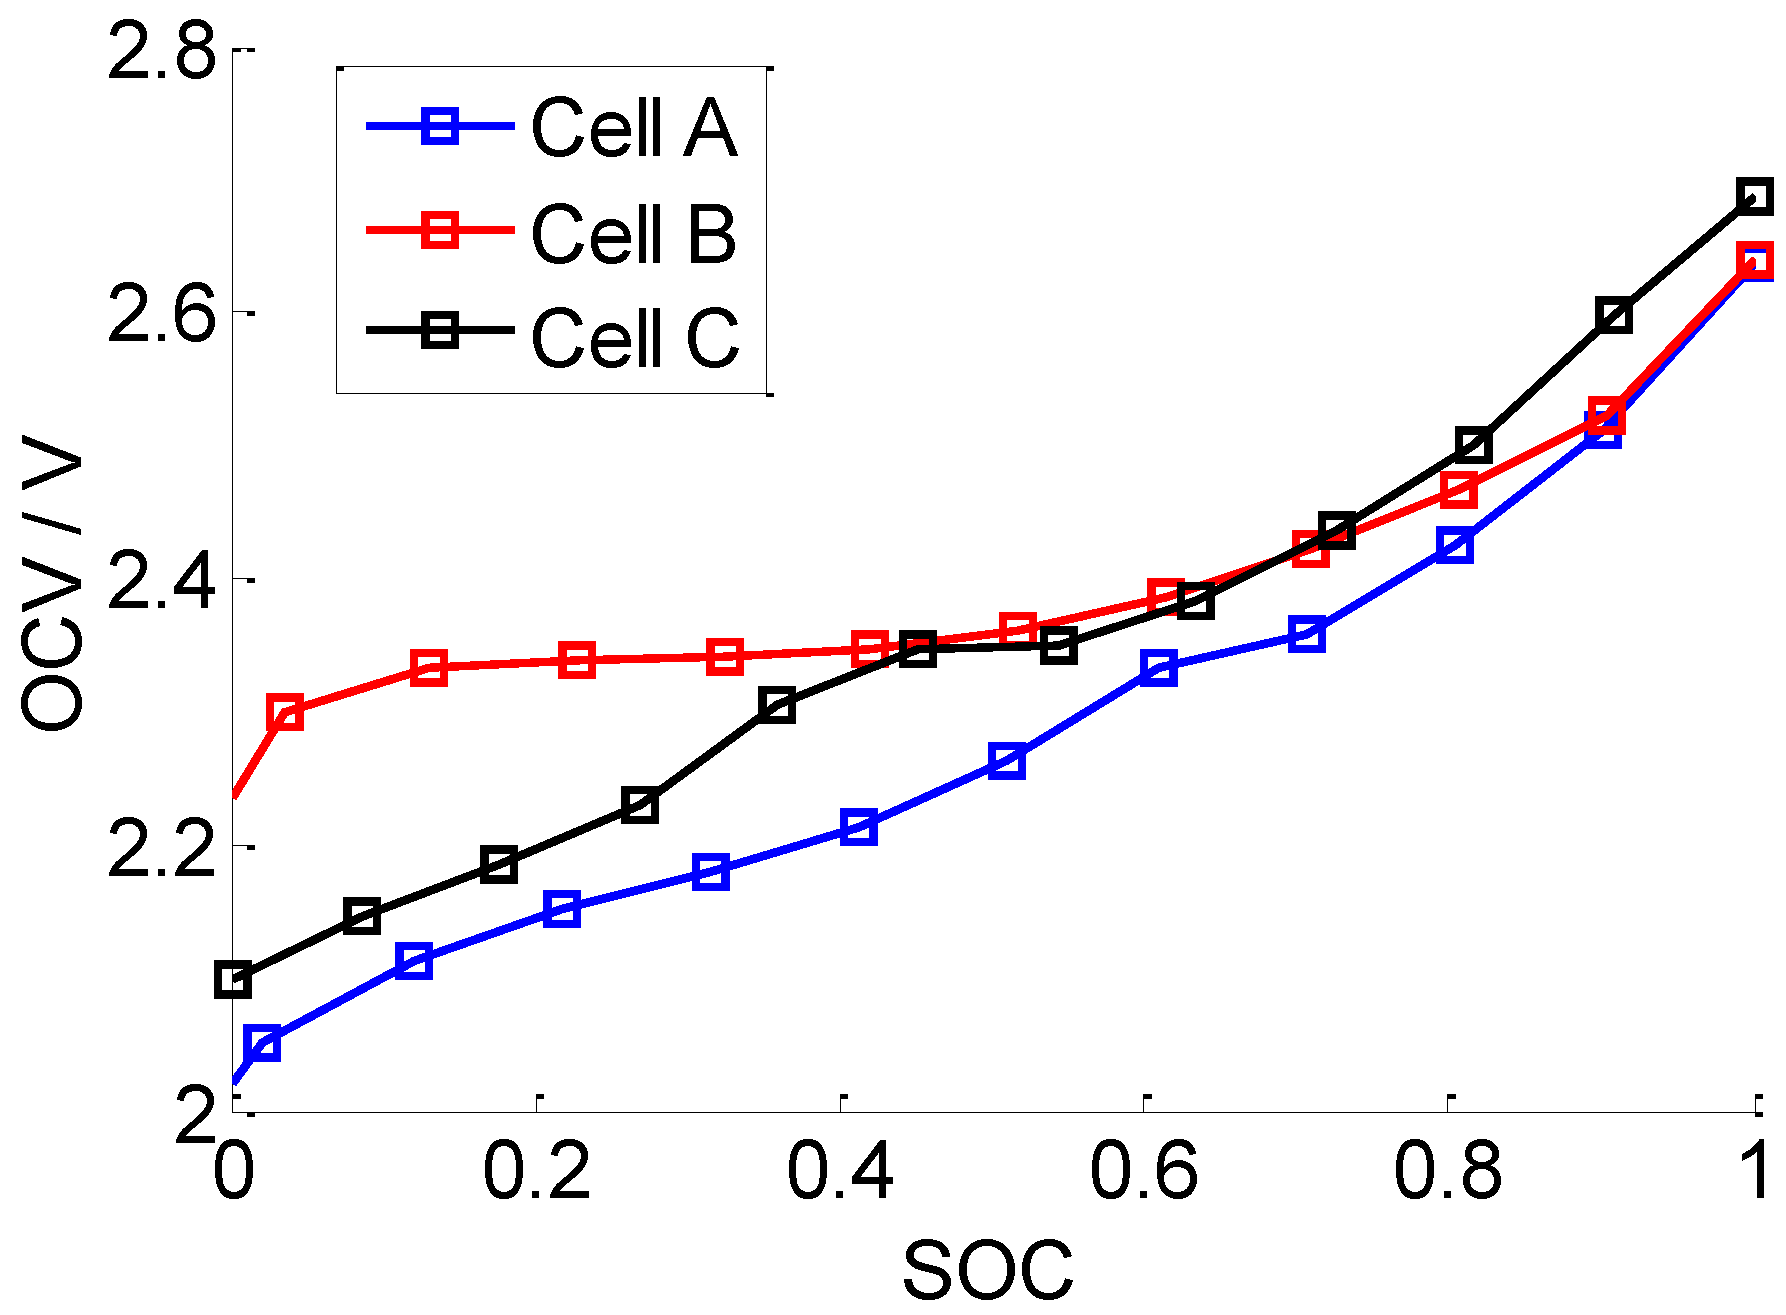
3.1. Open Circuit Voltage (OCV)

Although for all the three cells, the anode materials are LTO and the cathode materials are NCM, the battery OCVs are quite different. The OCV is compared in Figure 1. It could be seen that all the cell OCV values are located between 2 V and 2.7 V, and the shape of the OCV curves are not the same. That indicates that while maybe the cathode material of all the three cells are NCM, the raw material, manufacturing process, etc., may be different. The manufacturers refused to allow us to dismantle the cells for reasons of technical confidentiality, etc. Therefore, the cathode material properties are not precisely known, and thus the analysis below is mostly semi- quantitative.
Figure 1. The open circuit voltage (OCV) comparison. SOC: state of charge.
Energies 07 04895 g001

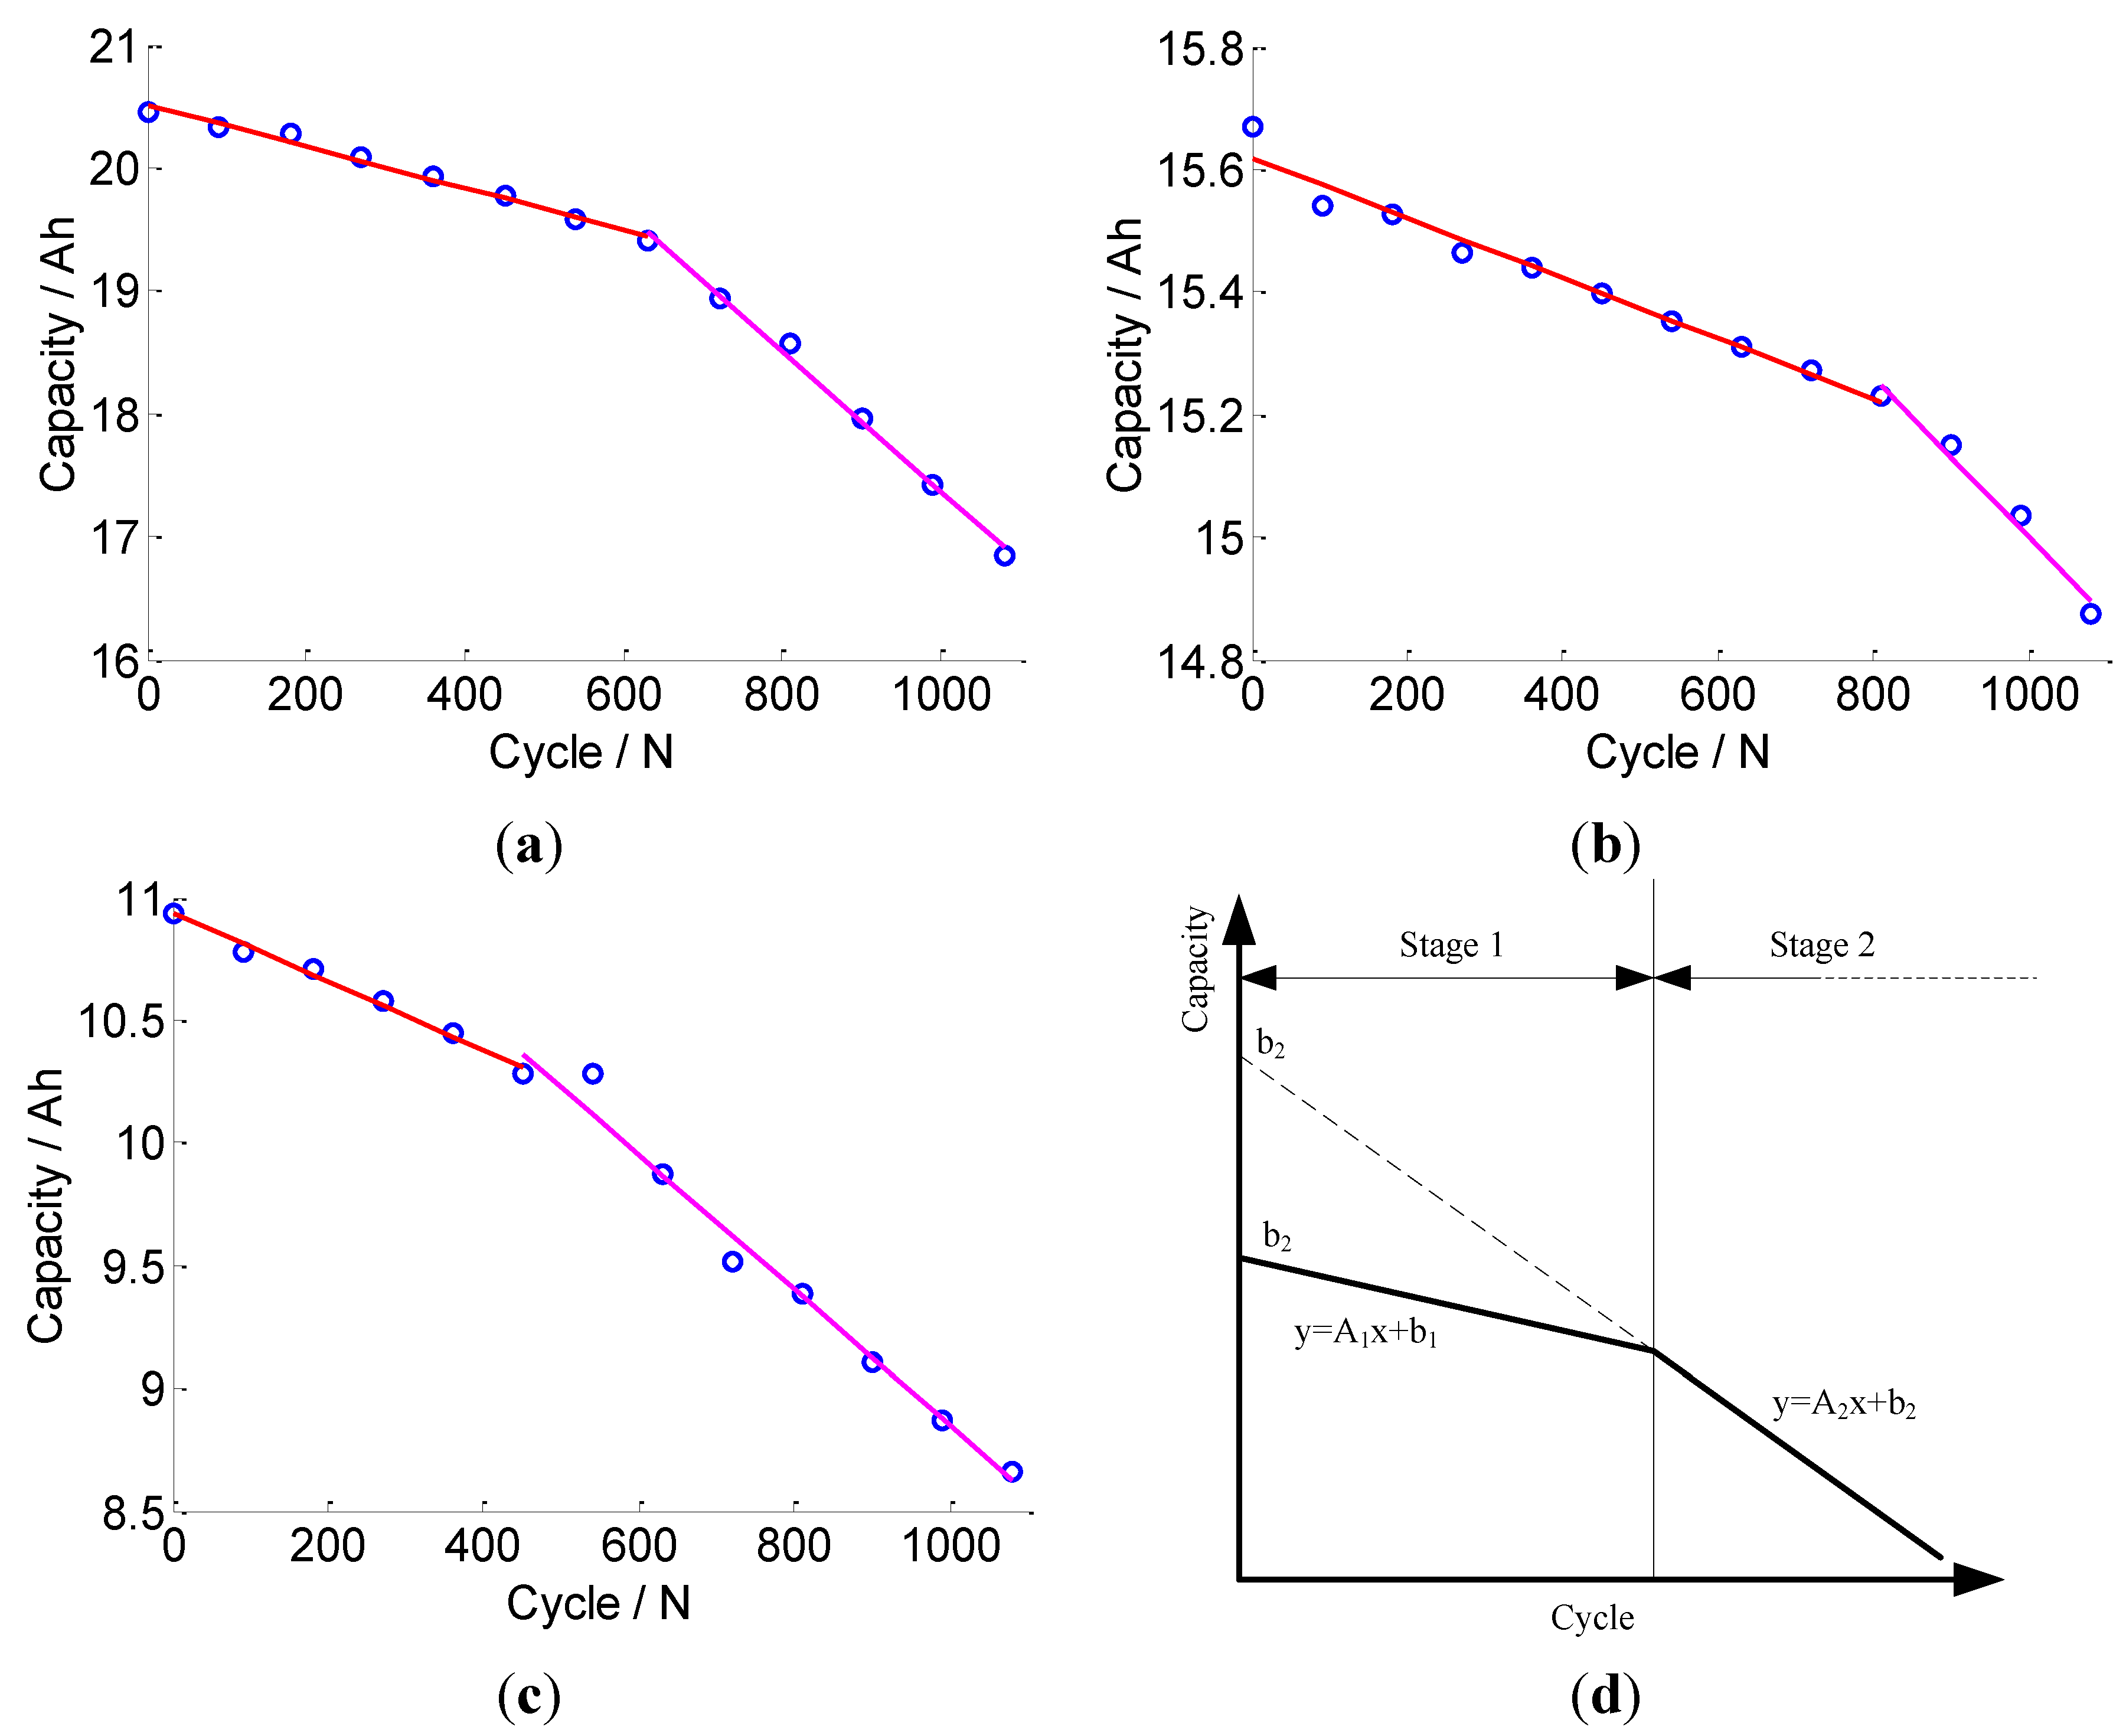
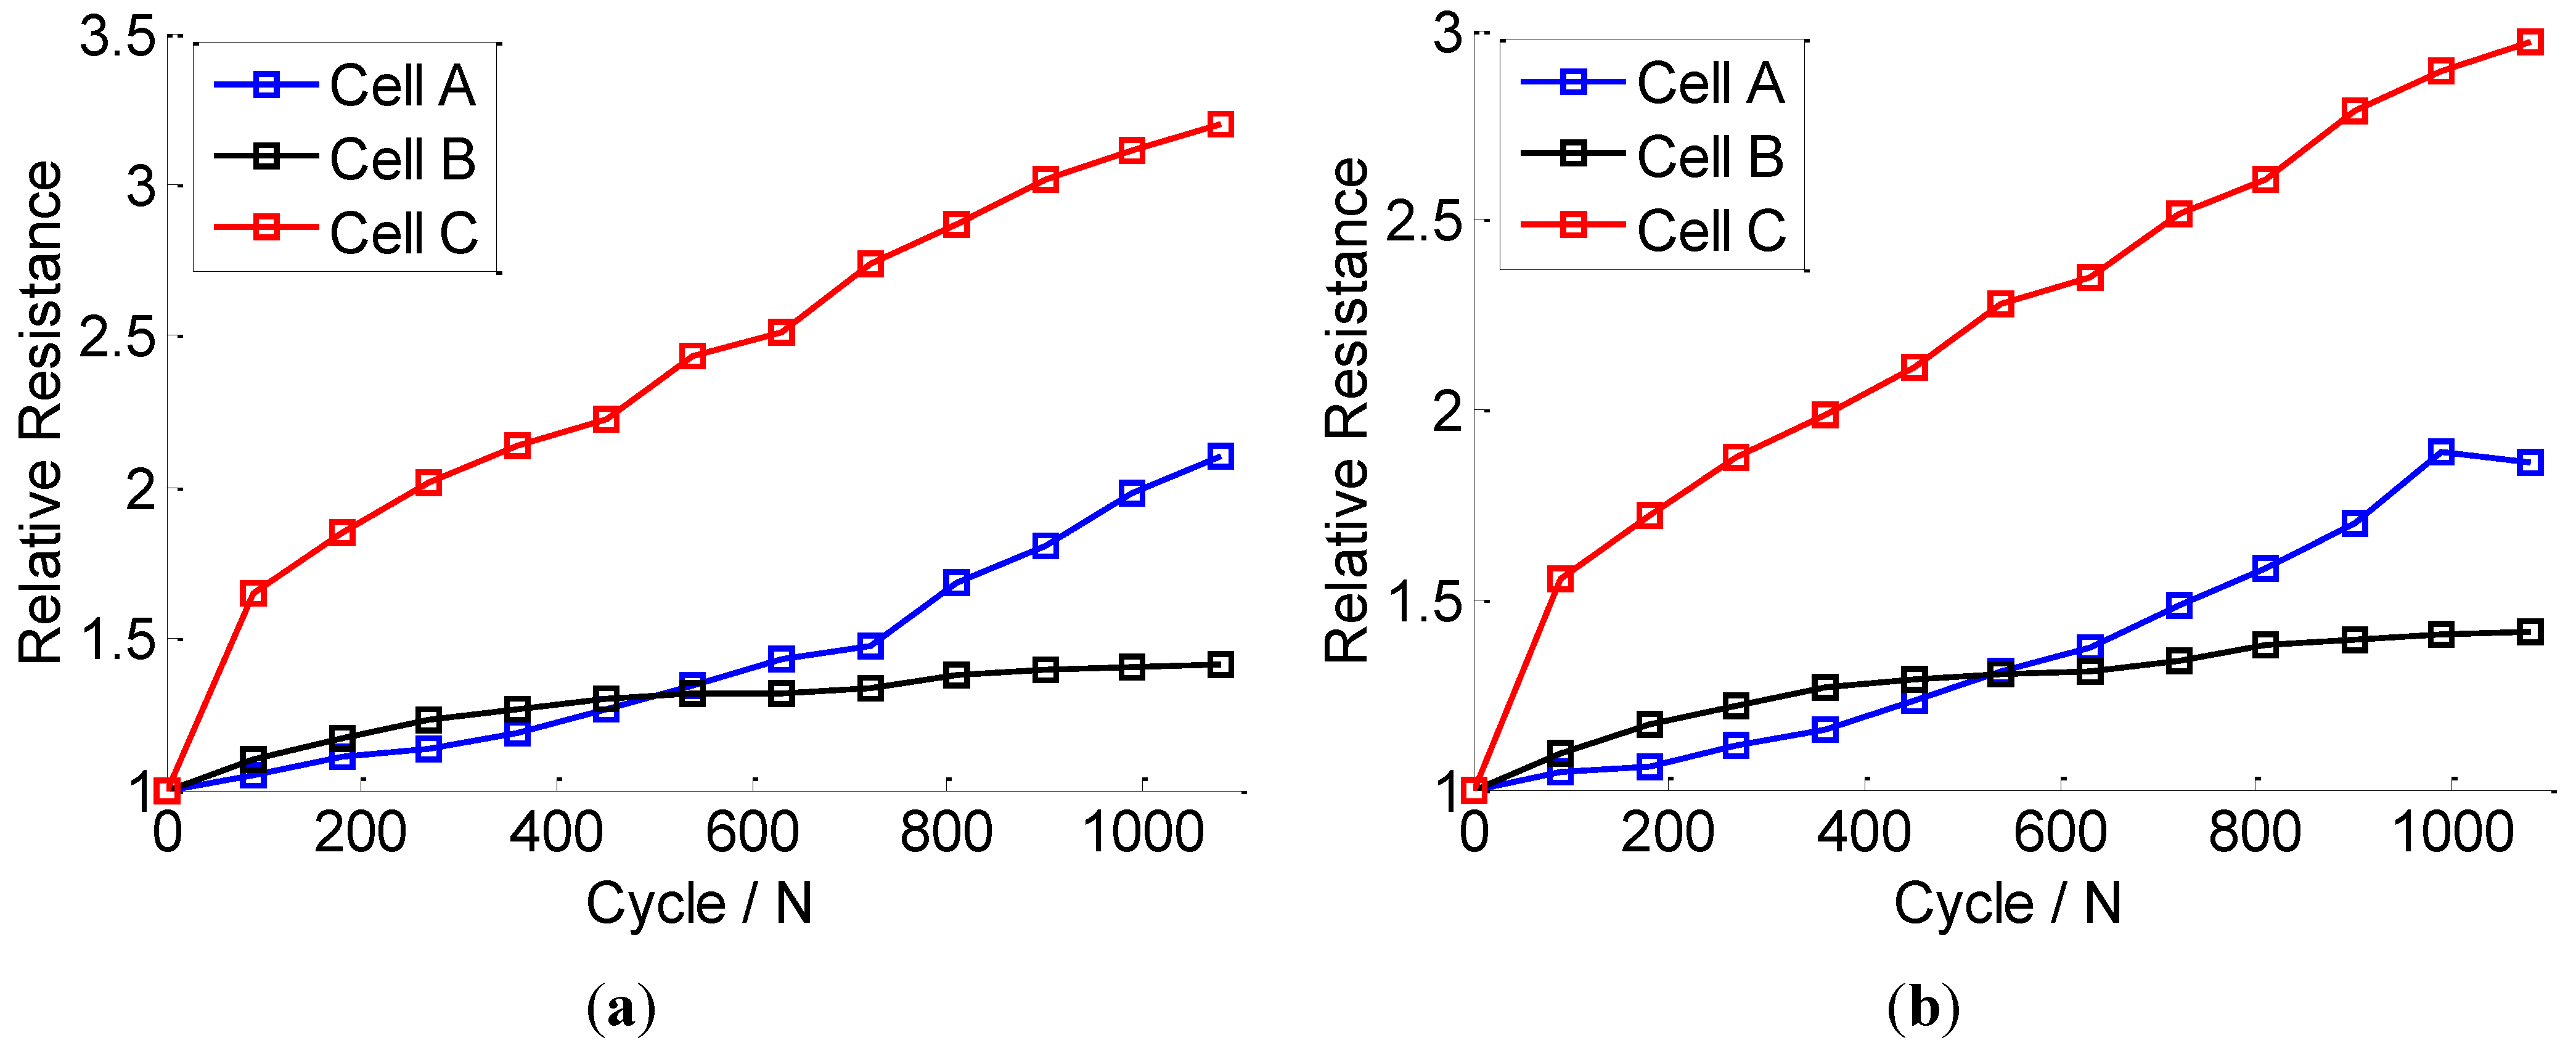
3.2. Capacity Fade and Resistance Increase Results

The cell capacity fade results of three cells are shown in Figure 2a–c. After about 1000 cycles, all the three cells show obvious capacity fade. The capacity fades follow a two-stage piecewise linear model. A schematic of this two-stage capacity fade profile with cycle numbers is shown in Figure 2d.
Figure 2. The capacity fade results of the three cells: (a) capacity retention of Cell A; (b) capacity retention of Cell B; (c) capacity retention of Cell C; and (d) schematic of the two-stage capacity fade profile with cycle numbers.
Energies 07 04895 g002
The slope and intercept of the two-stage capacity fade of the three cells are given in Table 2. It could be seen that in the Stage 1, the battery capacity fade rate, i.e., A1, is relatively low, and in the Stage 2, the battery capacity fade rate, i.e., A2, is considerably higher. For Cell A, the capacity fade rate in the Stage 2 is 3.35 times higher than that in the Stage 1. For Cell B, the capacity fade rate in the Stage 2 is 2.65 times higher than that in the Stage 1. And for Cell C, the capacity fade rate in the Stage 2 is twice as high as in the Stage 1. The inflection points of the different cells are different. Basically, for Cell A, this inflection point is at about 630 cycles; for Cell B, it is about 810 cycles; and for Cell C, it is about 450 cycles.
Table 2. The slope and intercept of the two-stage capacity fade.
ItemStage 1Stage 2
A1b1A2b2
Cell A−0.001720.5121−0.005723.0555
Cell B−0.0004915.6186−0.001316.3054
Cell C−0.001410.9349−0.002811.6008
After 1080 cycles, the capacity of Cell A decreases to 82.37% of its initial value, the capacity of Cell B decreases to 94.94% of its initial value, and the capacity of Cell C decreases to 79.17% of its initial value. Usually, the battery reaches its end of life when its capacity falls to 80% of its initial value. The results indicate that under temperature as high as 55 °C, the cycle life of commercial LTO batteries would be only around 1000 cycles. Therefore, when designing the battery pack and BMS for LTO batteries, the battery temperature should be carefully controlled.
With the cell capacity fades, the cell resistance increases. The charge and discharge resistance evolution is shown in Figure 3. For better comparison, the relative resistance to the initial value is used. The resistances of all the three cells increase significantly, especially that of Cell C.
Figure 3. The resistance evolution of the three cells: (a) 10s discharge resistance at 50% SOC; and (b) 10 s charge resistance at 50% SOC.
Energies 07 04895 g003

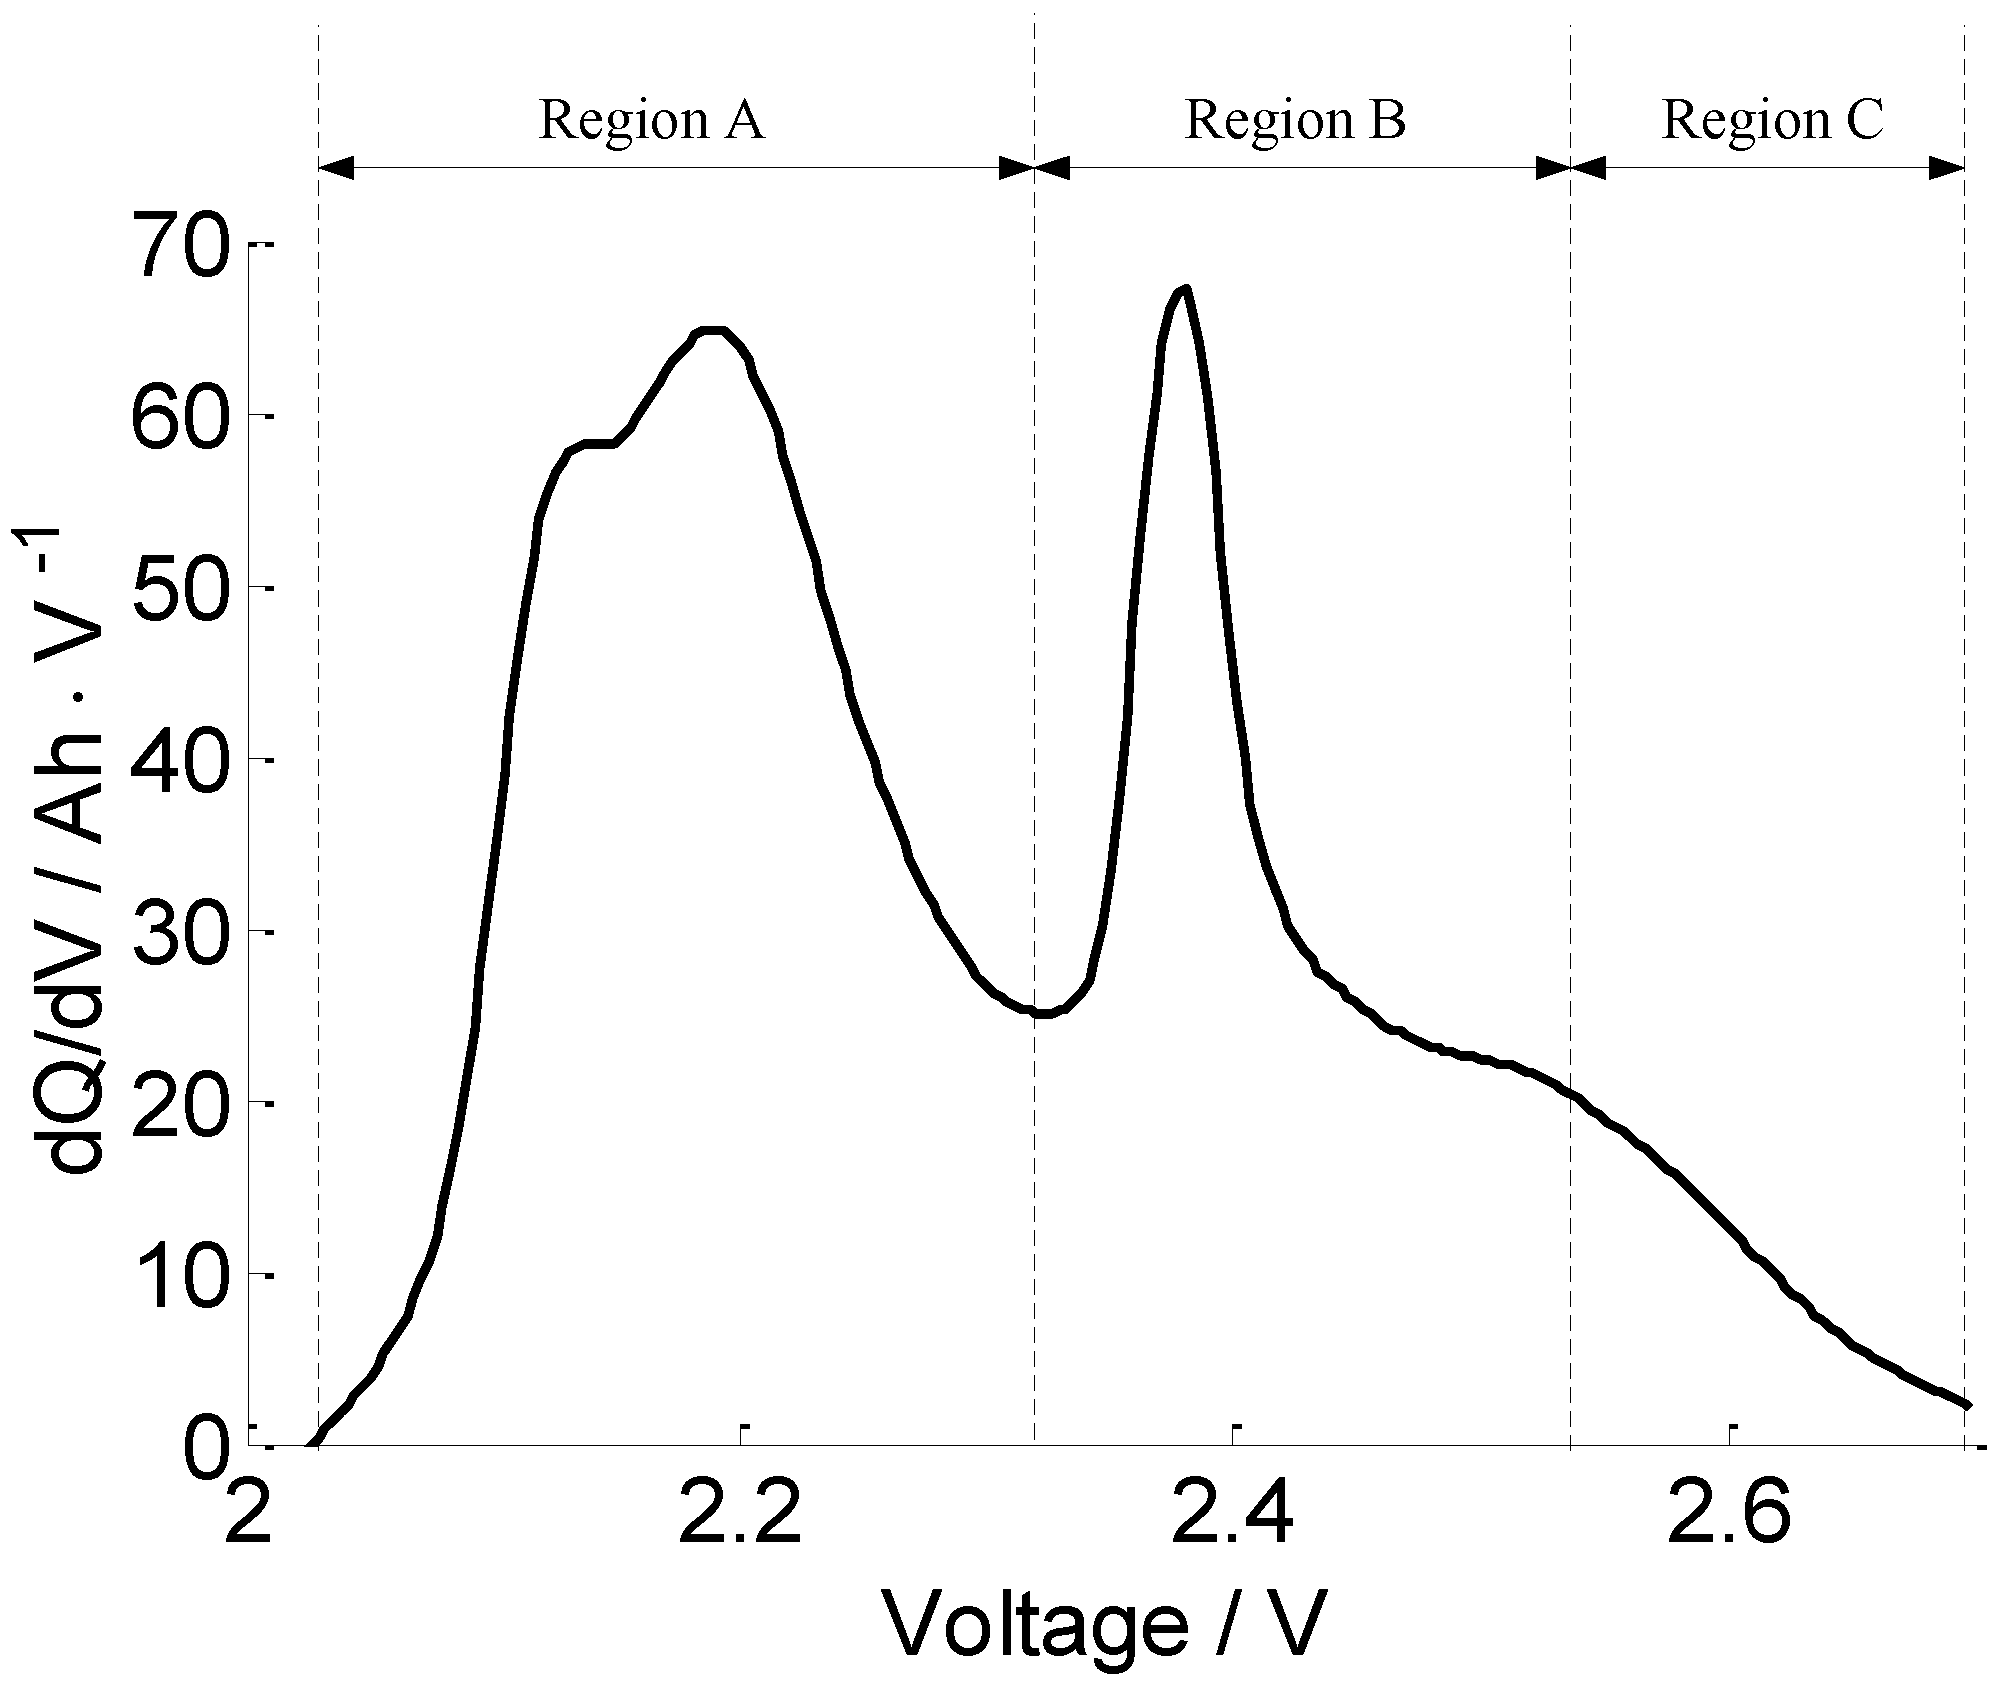
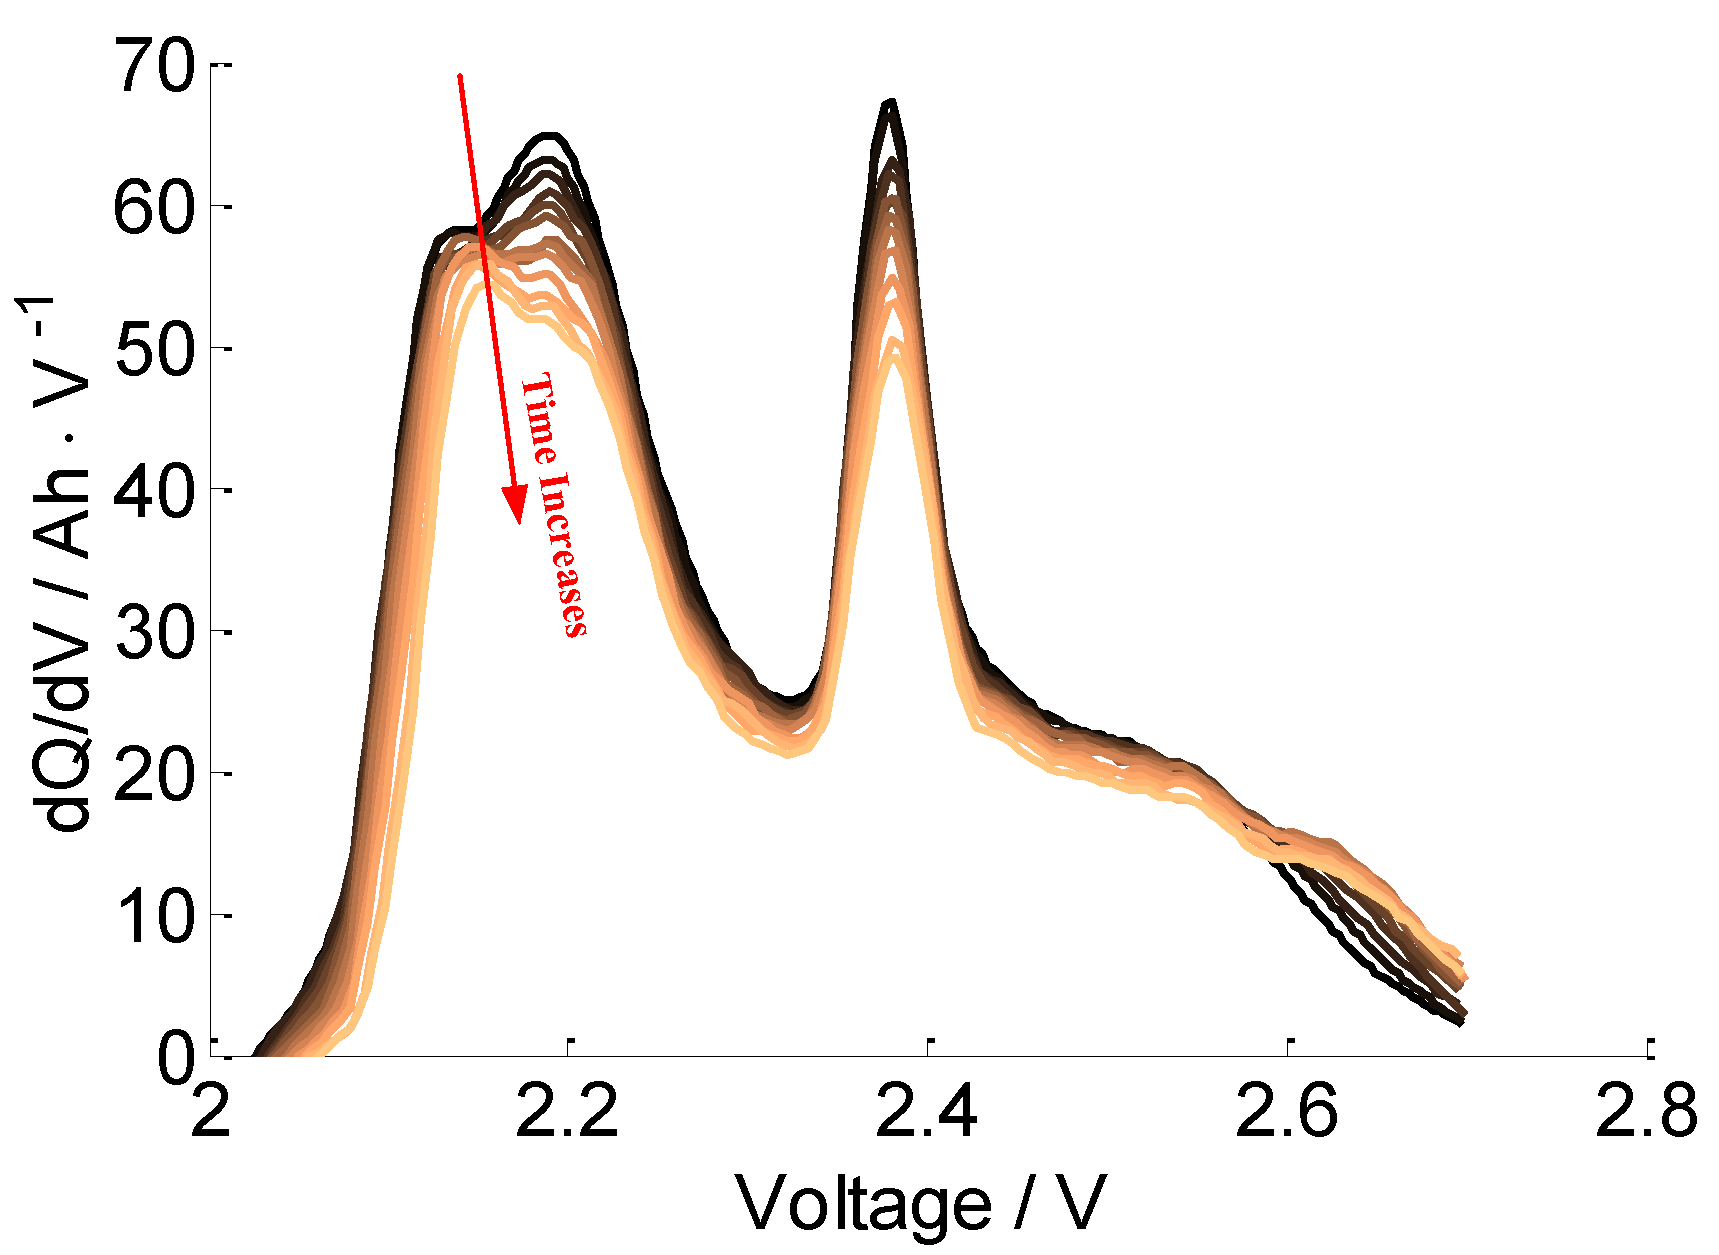
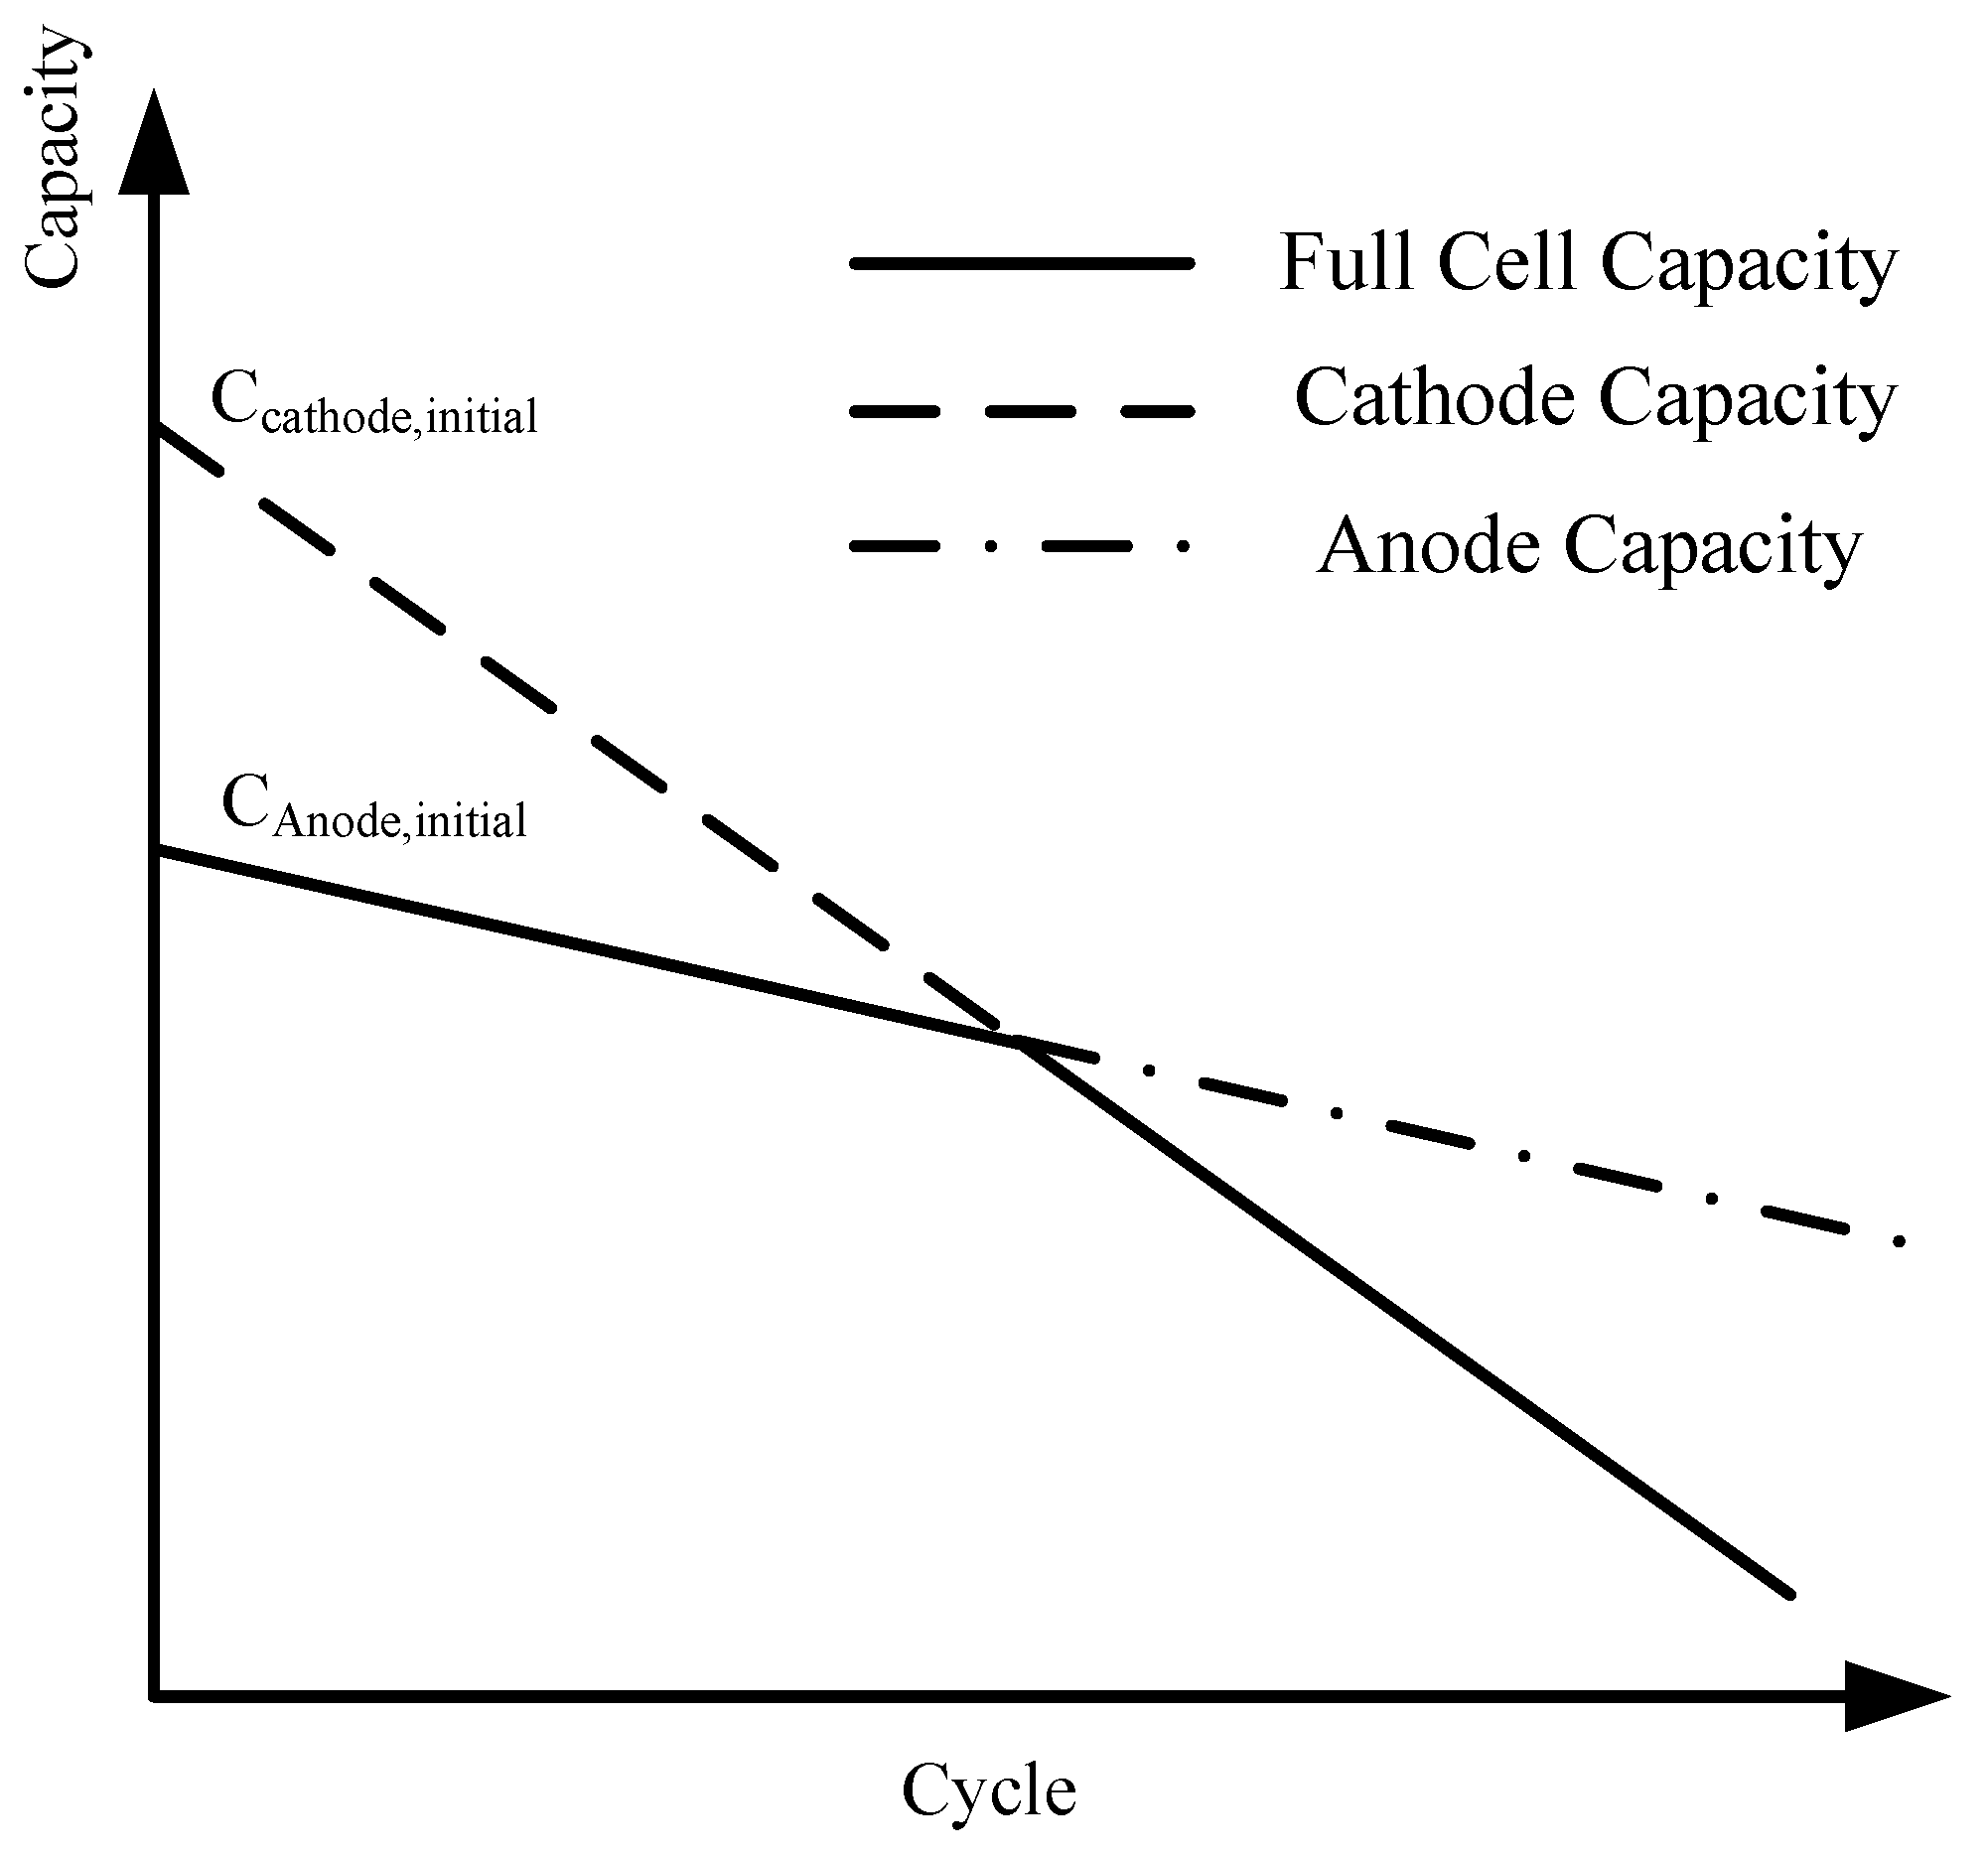
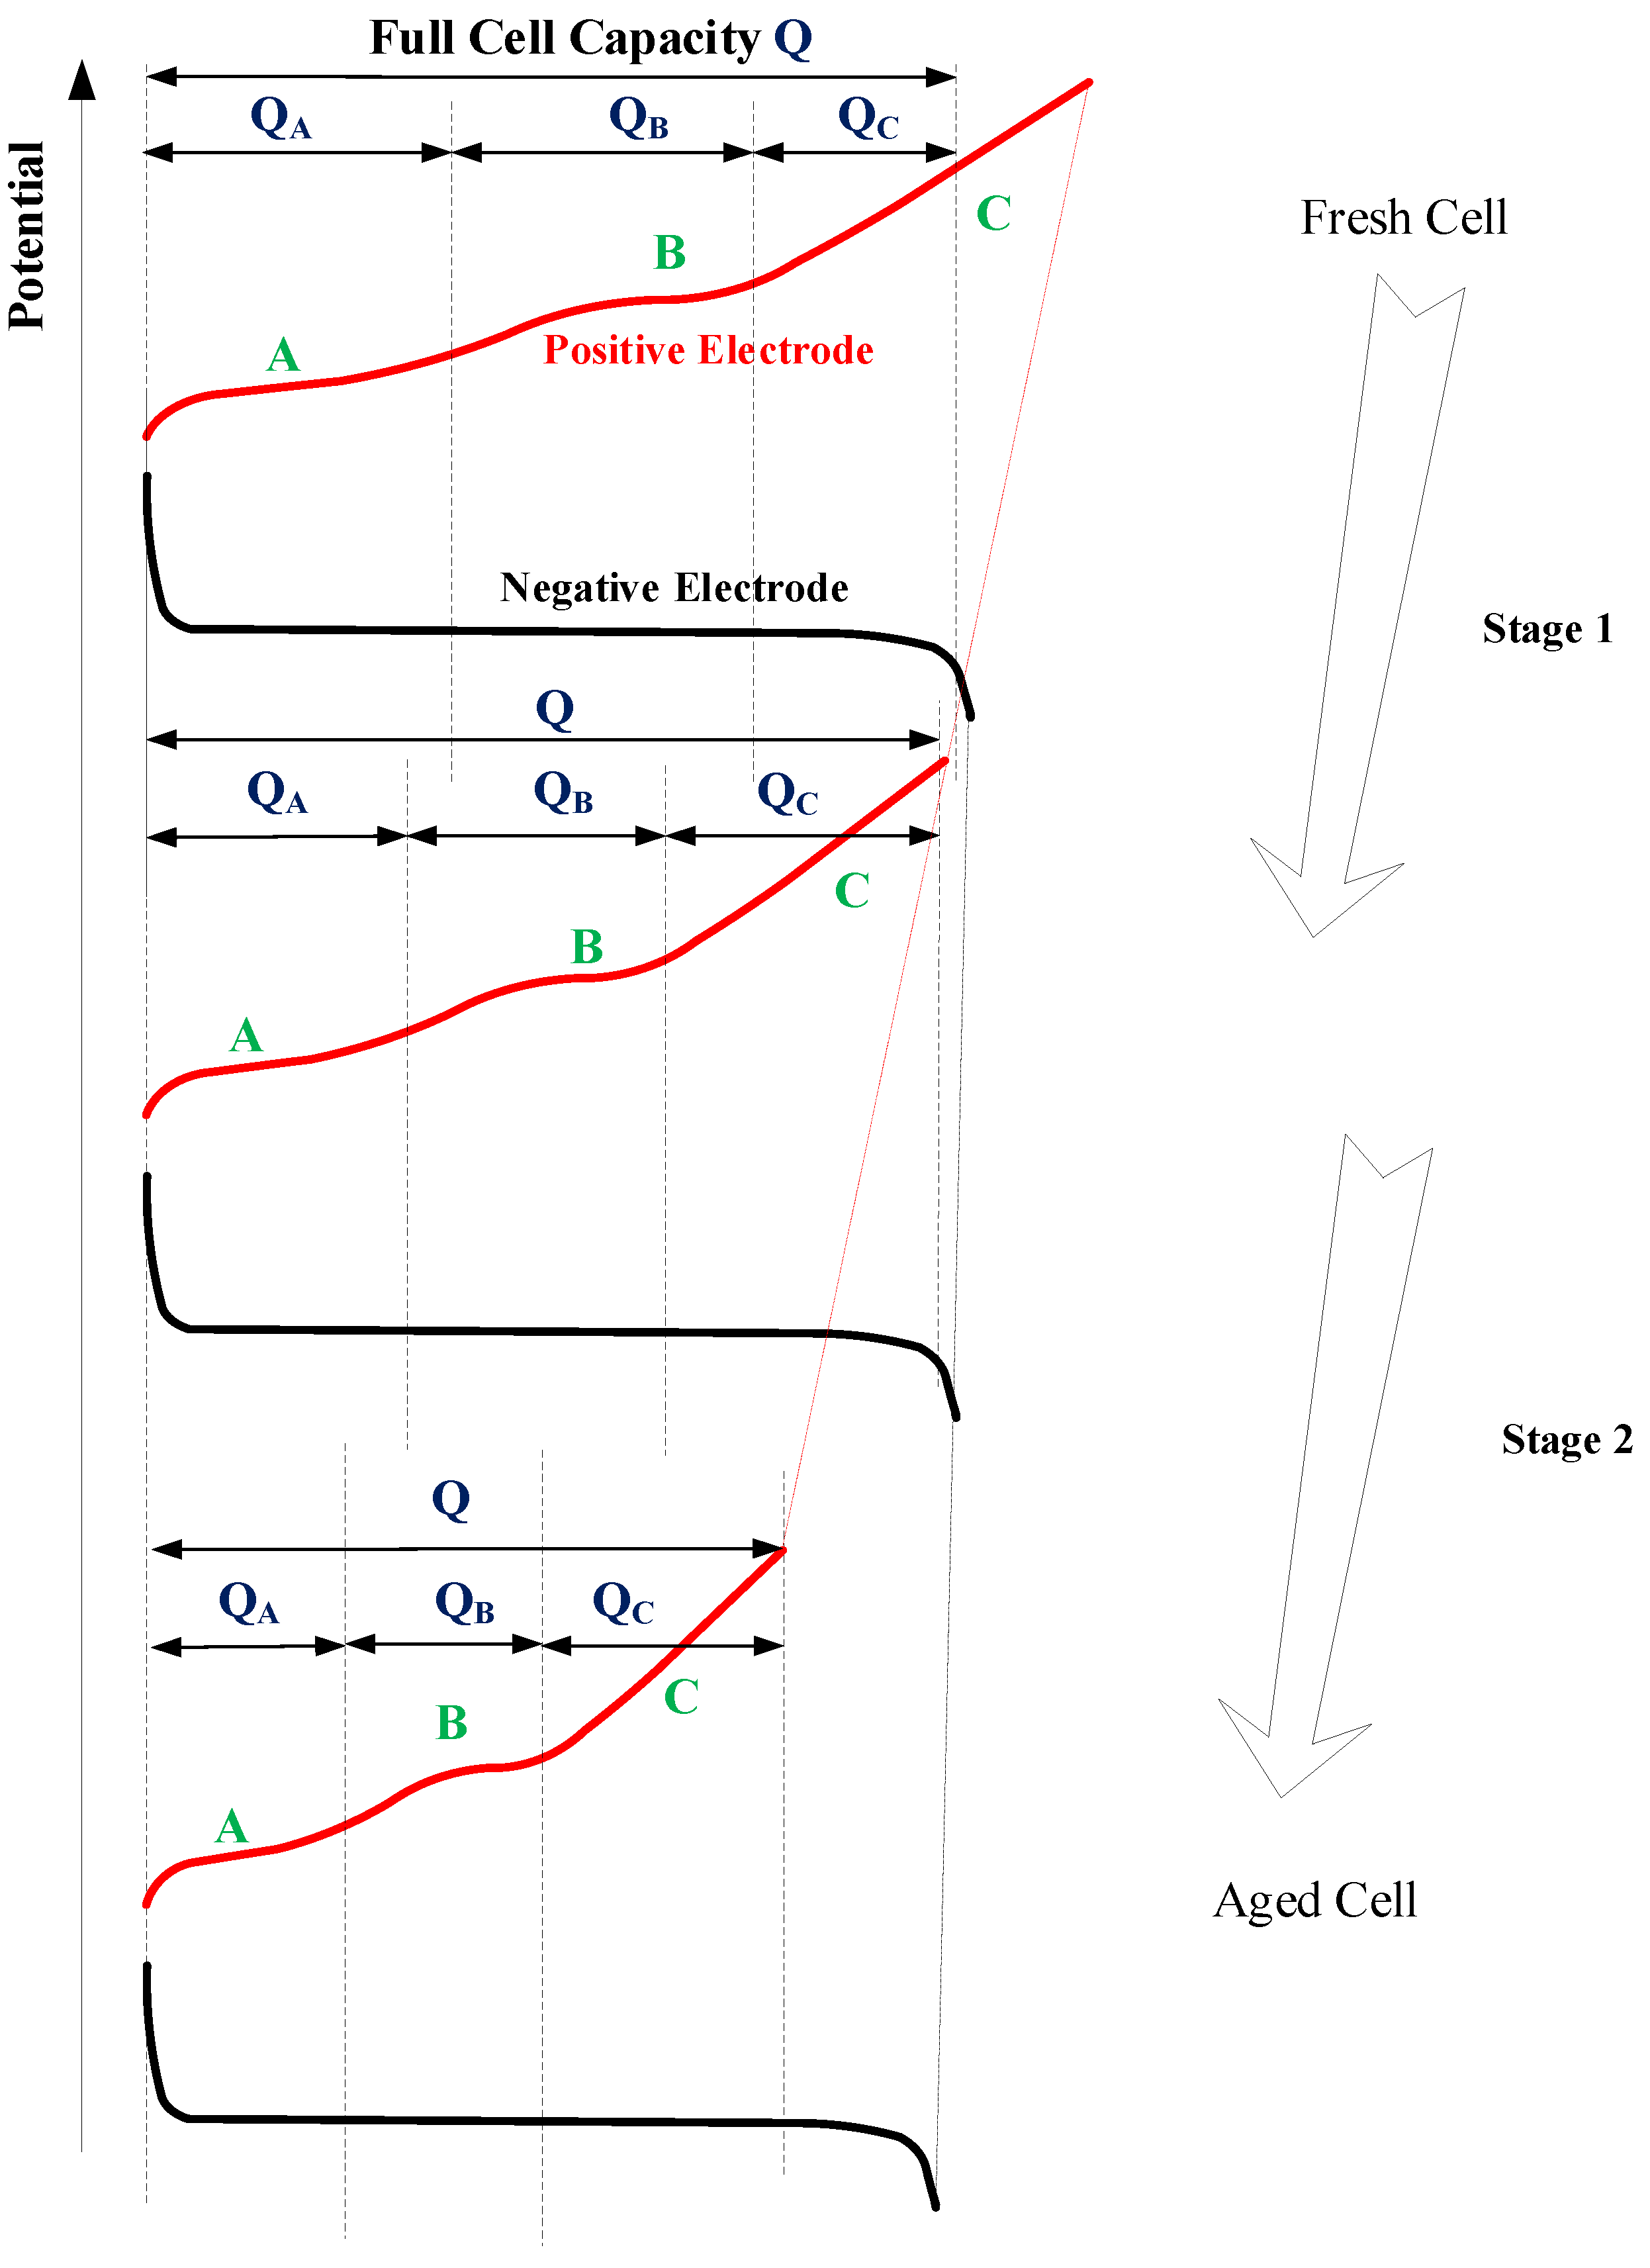
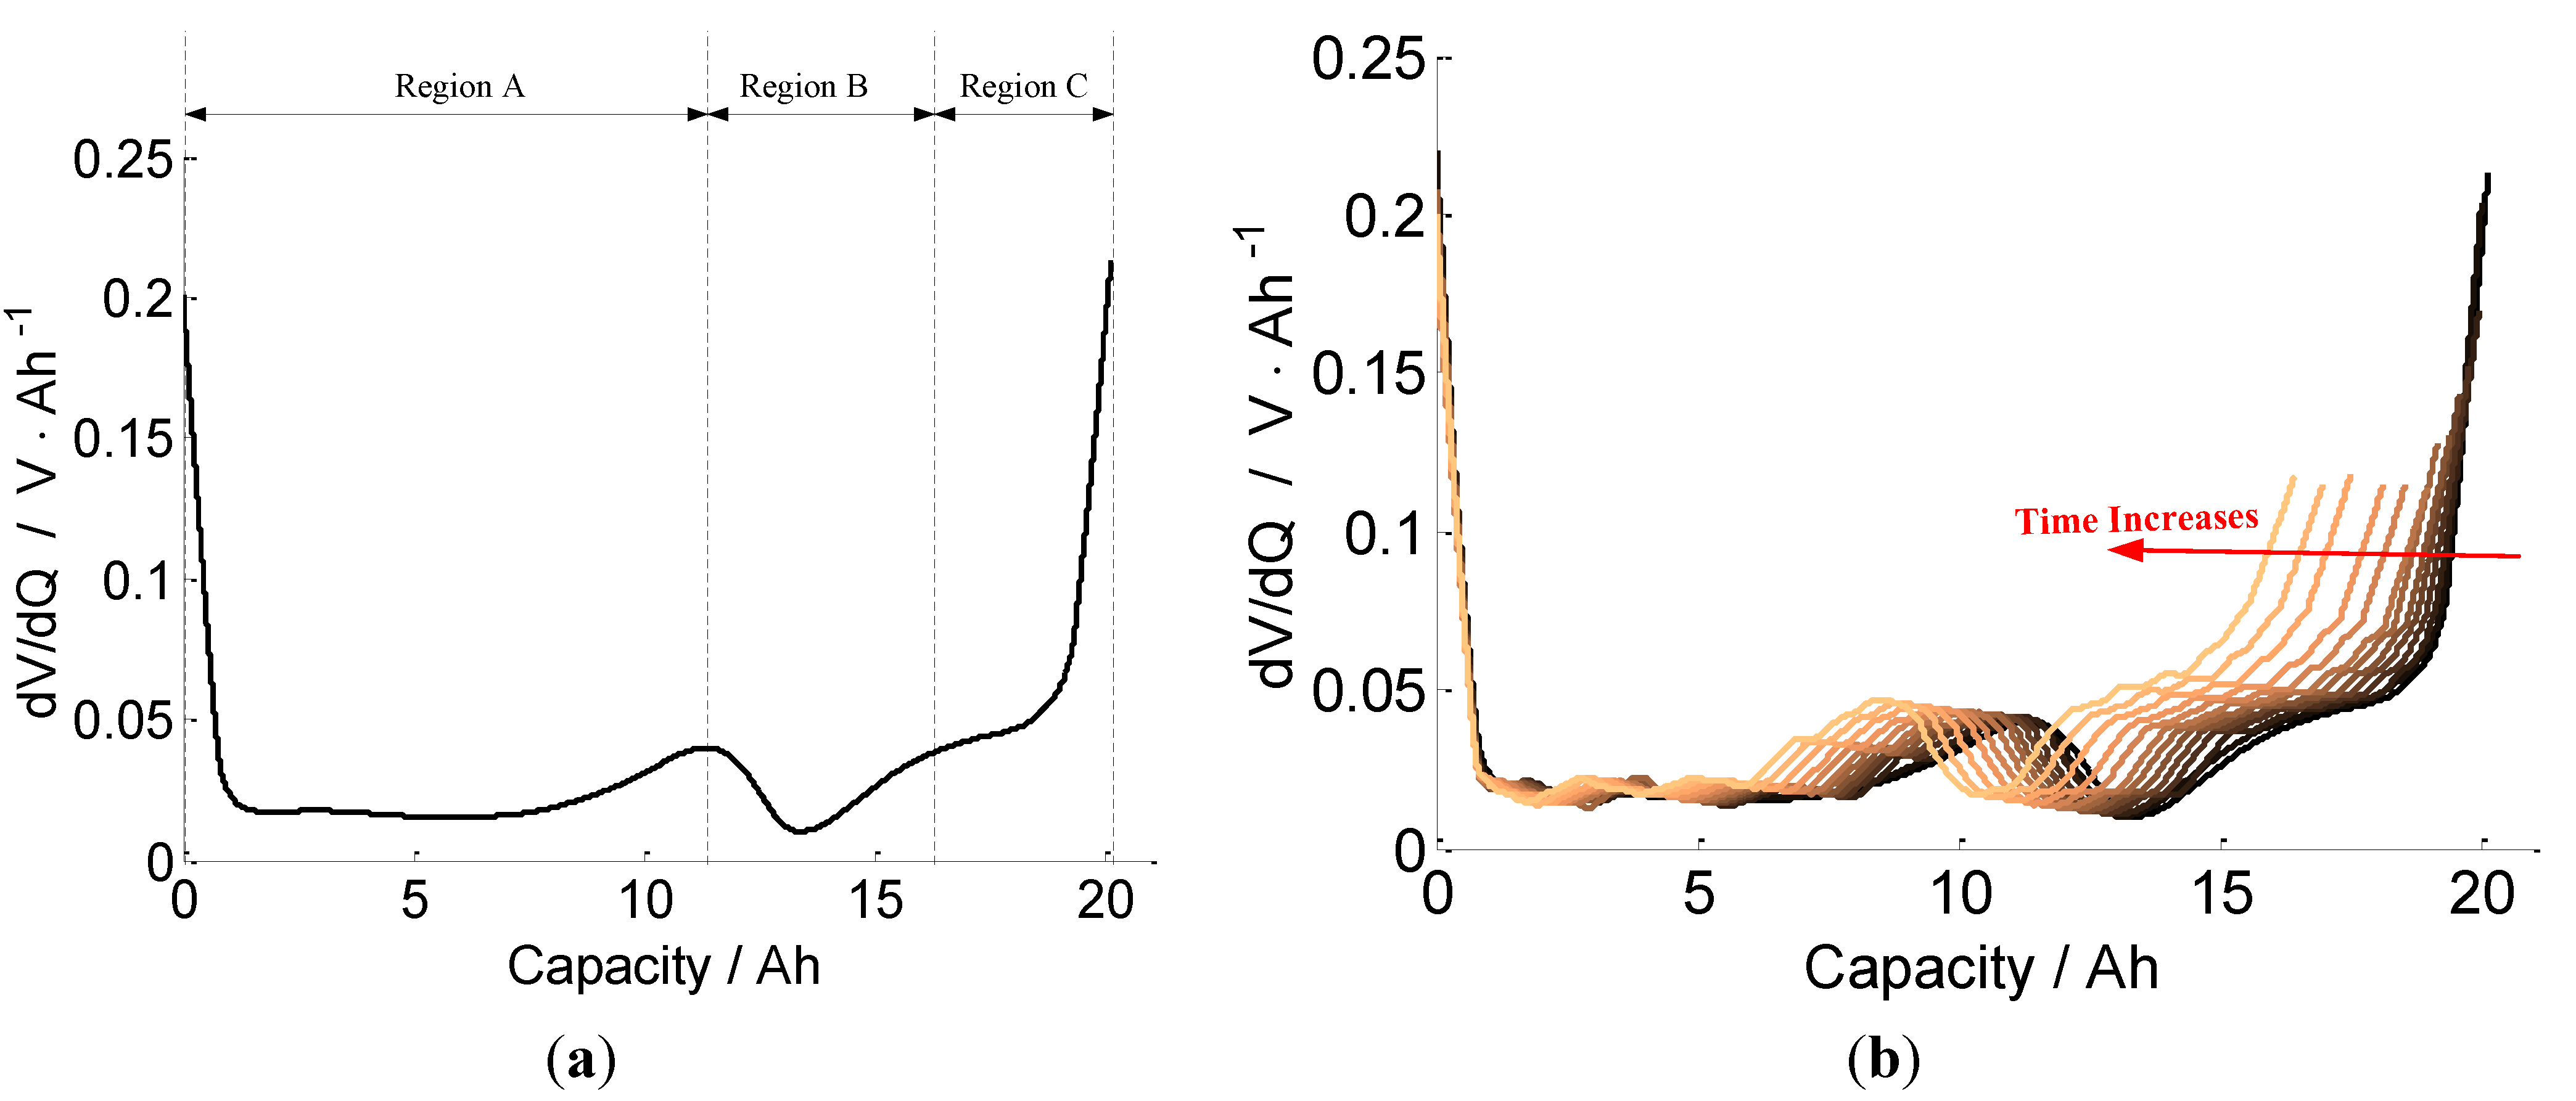
3.3. Battery Aging Mechanism Analysis

3.3.1. Aging Mechanism Analysis of Cell A

The battery aging mechanism identification based on the IC or DV analysis, is an in situ method, and could be used in the real vehicle BMS to find the battery SOH. Usually the IC/DV curves are derived from the OCV curves or constant current charge/discharge curves of very low charge/discharge rates. However, in a real vehicle, the battery working conditions are very complicated, especially for the discharge curves, as the discharge current depends on the vehicle requirements, and low constant current discharge is generally impossible. While charging, especially for pure electrical vehicles and plug-in hybrid electrical vehicles, it is possible to charge the battery using constant current charging methods and the charge current may be as low as 1/3C. Thus in this paper, the IC curves are derived from the 1/3C constant current charge curves under 25 °C.
In our previous work [18], a simple method to get the IC curves based on the probability density function has been introduced. Therefore, the theoretical inference is not repeated here and only an equivalent point counting method will be briefly introduced.
Divide the battery voltage range into several small intervals. During the charging process, measure the battery voltage and simply count the number of voltage points within each interval. Generally the battery is charged at a constant current in a real vehicle, and the voltage sampling frequency of BMS is constant, usually 1 Hz. Thus the battery charged capacity is proportional to the number of sampling points in the charging process. When the voltage rises faster, there are fewer points in the corresponding voltage interval and when the voltage rises slower, that means, a voltage plateau occurs, there are more points counted in the corresponding voltage interval. Then the IC dQ/dV could be calculated using Equation (1):
Energies 07 04895 i001
where n is the number of points counted in the corresponding interval; I is the charging current in A; f is the sampling frequency in Hz; and ∆V means width of each voltage interval in V. The voltage interval width is selected as 5 mV in this report. Curve filtering is necessary to remove the noise. The DV curves dV/dQ could be derived by means of numerical derivative and curve smoothing.
Using such a point counting method, the IC curves of Cell A could be derived and is shown in Figure 4. Generally the anode is basically in a two phase transformation during the charging process and the anode potential is at about 1.55 V versus Li/Li+ [6]. Thus, the anode potential is almost constant, thereby providing a reference potential for the positive electrode reaction. Thus, the peaks of the IC curves are considered to be caused by phase transformation [10,11] of the positive electrode, i.e., NCM cathode. It could be noted that there are generally two peaks and each peak represents a cathode phase transformation. The IC curve of Cell A could be divided into three regions, labeled as A, B and C. The area of each region represents the charged capacity corresponding to each voltage region. The detailed introduction of the IC curve of Cell A can be found in a previous work [7].
For Cell A, with the cycle number increases, the IC curves are given in Figure 5, and the line color changes from black to tan. It could be easily found that in the Regions A and B, the peaks decrease with the cycle number increases, i.e., the capacities corresponding to the Regions A and B decrease, which indicates the loss of the cathode material. The IC curves in the Region C are more complex.
Figure 4. The incremental capacity (IC) curves of new Cell A.
Energies 07 04895 g004
Figure 5. The IC curves of Cell A after every 90 cycles up to 1080 cycles; with cycle number increase, line color changes from black to tan.
Energies 07 04895 g005
As shown in Figure 6, before 630 cycles, with increased cycle number, the IC curves in the Region C increase, and after 630 cycles, the IC curve decreases. There is no clear resistance increase since the position of all the peaks hardly changes.
This phenomenon denotes that the battery aging is not caused by a single mechanism. In different aging stages, the aging mechanism is different. For Cell A, a possible capacity fade mechanism is shown in Figure 7. The battery capacity depends on the minimum of the anode capacity and cathode capacity. Usually, while manufacturing cells, the cathode material would be a little bit excessive. With the battery cycling, the capacity of both cathode and anode would fade, and the capacity loss rate is different. The cathode capacity decreases faster than the anode. Therefore, at the beginning, the battery capacity mainly depends on the anode and the battery capacity fade rate is nearly the capacity fade rate of the anode, and this fade rate is lower. After some cycles, because the cathode capacity decreases faster than the anode, the capacity of the cathode drops lower than the anode, then the battery capacity mainly depends on the cathode and the capacity fade rate become higher.
Figure 6. The Region C of IC curves of Cell A after every 90 cycles: (a) after 0 cycles up to 630 cycles; and (b) after 630 cycles up to 1080 cycles.
Energies 07 04895 g006
Figure 7. Schematics of the two-stage capacity fade mechanism.
Energies 07 04895 g007
The capacity fade mechanism is schematically shown in Figure 8. The Regions A and B relate to the two voltage plateaus of the cell voltage charging curves, or more clearly, the two voltage plateaus of the positive electrode. These voltage plateaus result in the two peaks in the IC curves, and indicate the phase transformation of the electrode material [19]. At a voltage above about 2.5 V, with the battery charges, the battery voltage (NCM positive electrode potential) presents a steady voltage increases and indicates that the electrode material is not going through a phase transformation but is in a solid solution region. In the first stage, the anode (i.e., negative electrode) capacity is less than the cathode (i.e., positive electrode) one. The battery capacity mainly depends on the anode capacity. Since the cathode capacity shows an obvious decrease, the capacity related to the Regions A and B, i.e., QA and QB shown in Figure 8, fades obviously, and in the IC curve plot, the curve corresponding to the Regions A and B decreases as shown in Figure 5. The battery capacity loss depends on the anode capacity and is smaller than the capacity loss of the cathode, so there must be increase of the capacity corresponding to the Region C as shown in Figure 6. Thus, the IC curve of the Region C increases in the Stage 1. However, it should be noted that the capacity loss of the cathode would also influence the battery capacity. The battery capacity loss rate would be a little higher than the anode capacity fade. In any case, this influence is relatively slight.
Figure 8. Schematic of the two stage capacity fade mechanism.
Energies 07 04895 g008
The capacity fade mechanism in the Stage 2 is schematically shown in Figure 8. The battery capacity mainly depends on the cathode. Since the anode capacity is higher than the cathode capacity and the potential of the LTO anode is almost constant in a wide range, the capacity loss of the anode has almost no influence on the battery capacity. The capacities corresponding to the Regions A, B and C decrease together. Thus the IC curve decreases, especially in the Region C, which is quite different from the situation in the Stage 1 as shown in Figure 6 and Figure 8.
The DV curve could also be utilized to analyze the results. As shown in Figure 9a, the DV curve of the Cell A could also be divided into three regions, designated as Regions A, B and C. The width of each region denotes the corresponding capacity.
The DV curves of Cell A after different numbers of cycle numbers are shown in Figure 9b. During the first several hundreds of cycles, the width of the Regions A and B decreases and the width of the Region C increases as cycle number increases. Then, the widths of the Regions A, B, and C decrease at almost the same speed. The results and mechanism are just the same as the aging mechanism analyzed and shown in Figure 8.
Figure 9. (a) The differential voltage (DV) curve of new Cell A; and (b) the DV curves of Cell A after every 90 cycles up to 1080 cycles; with cycle number increase, color changes from black to tan.
Energies 07 04895 g009

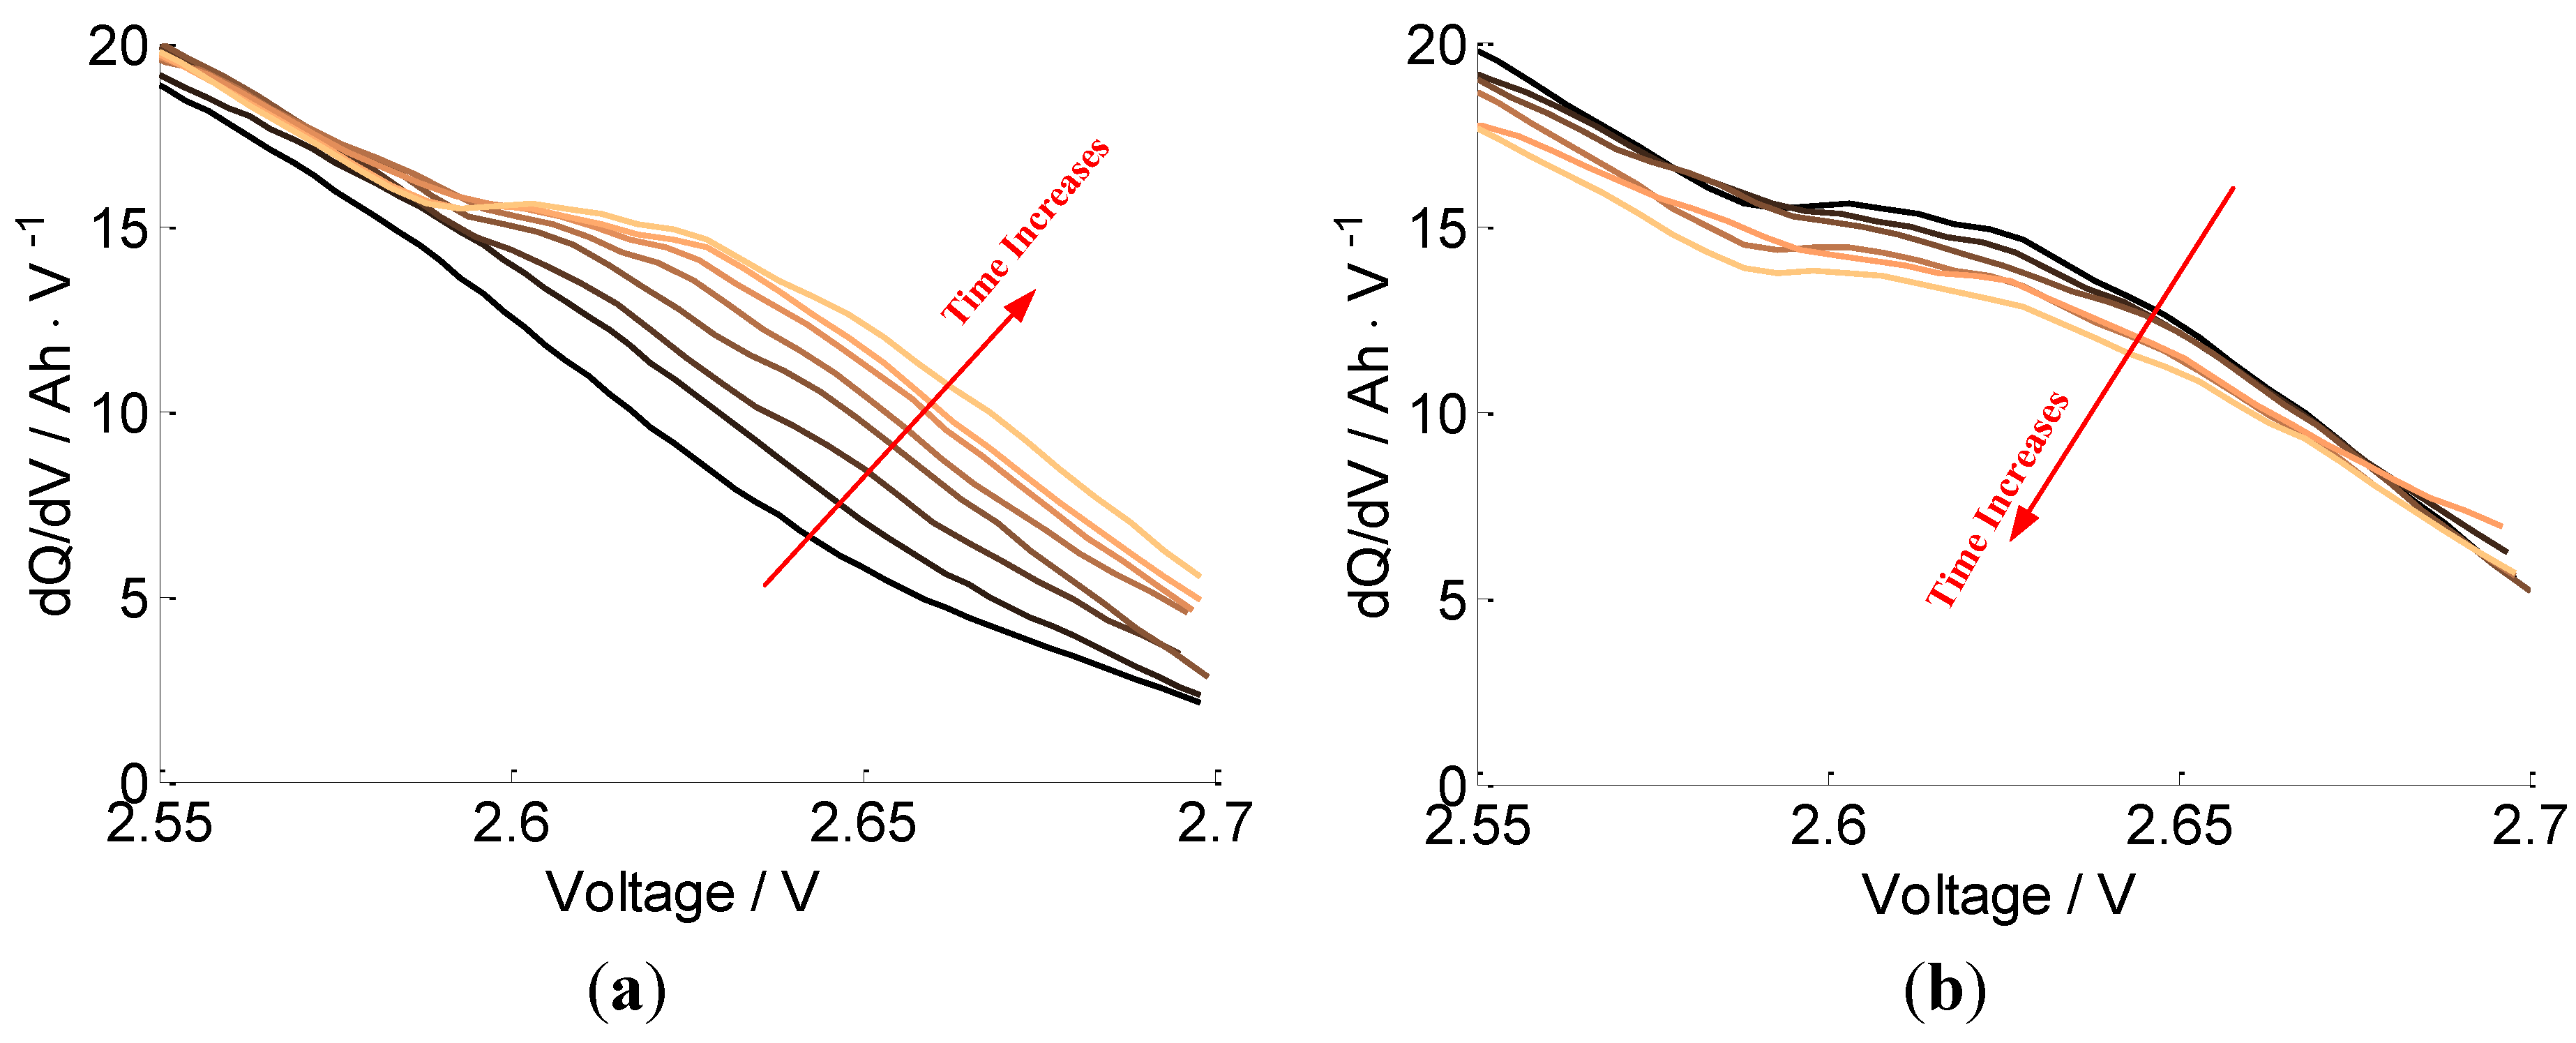
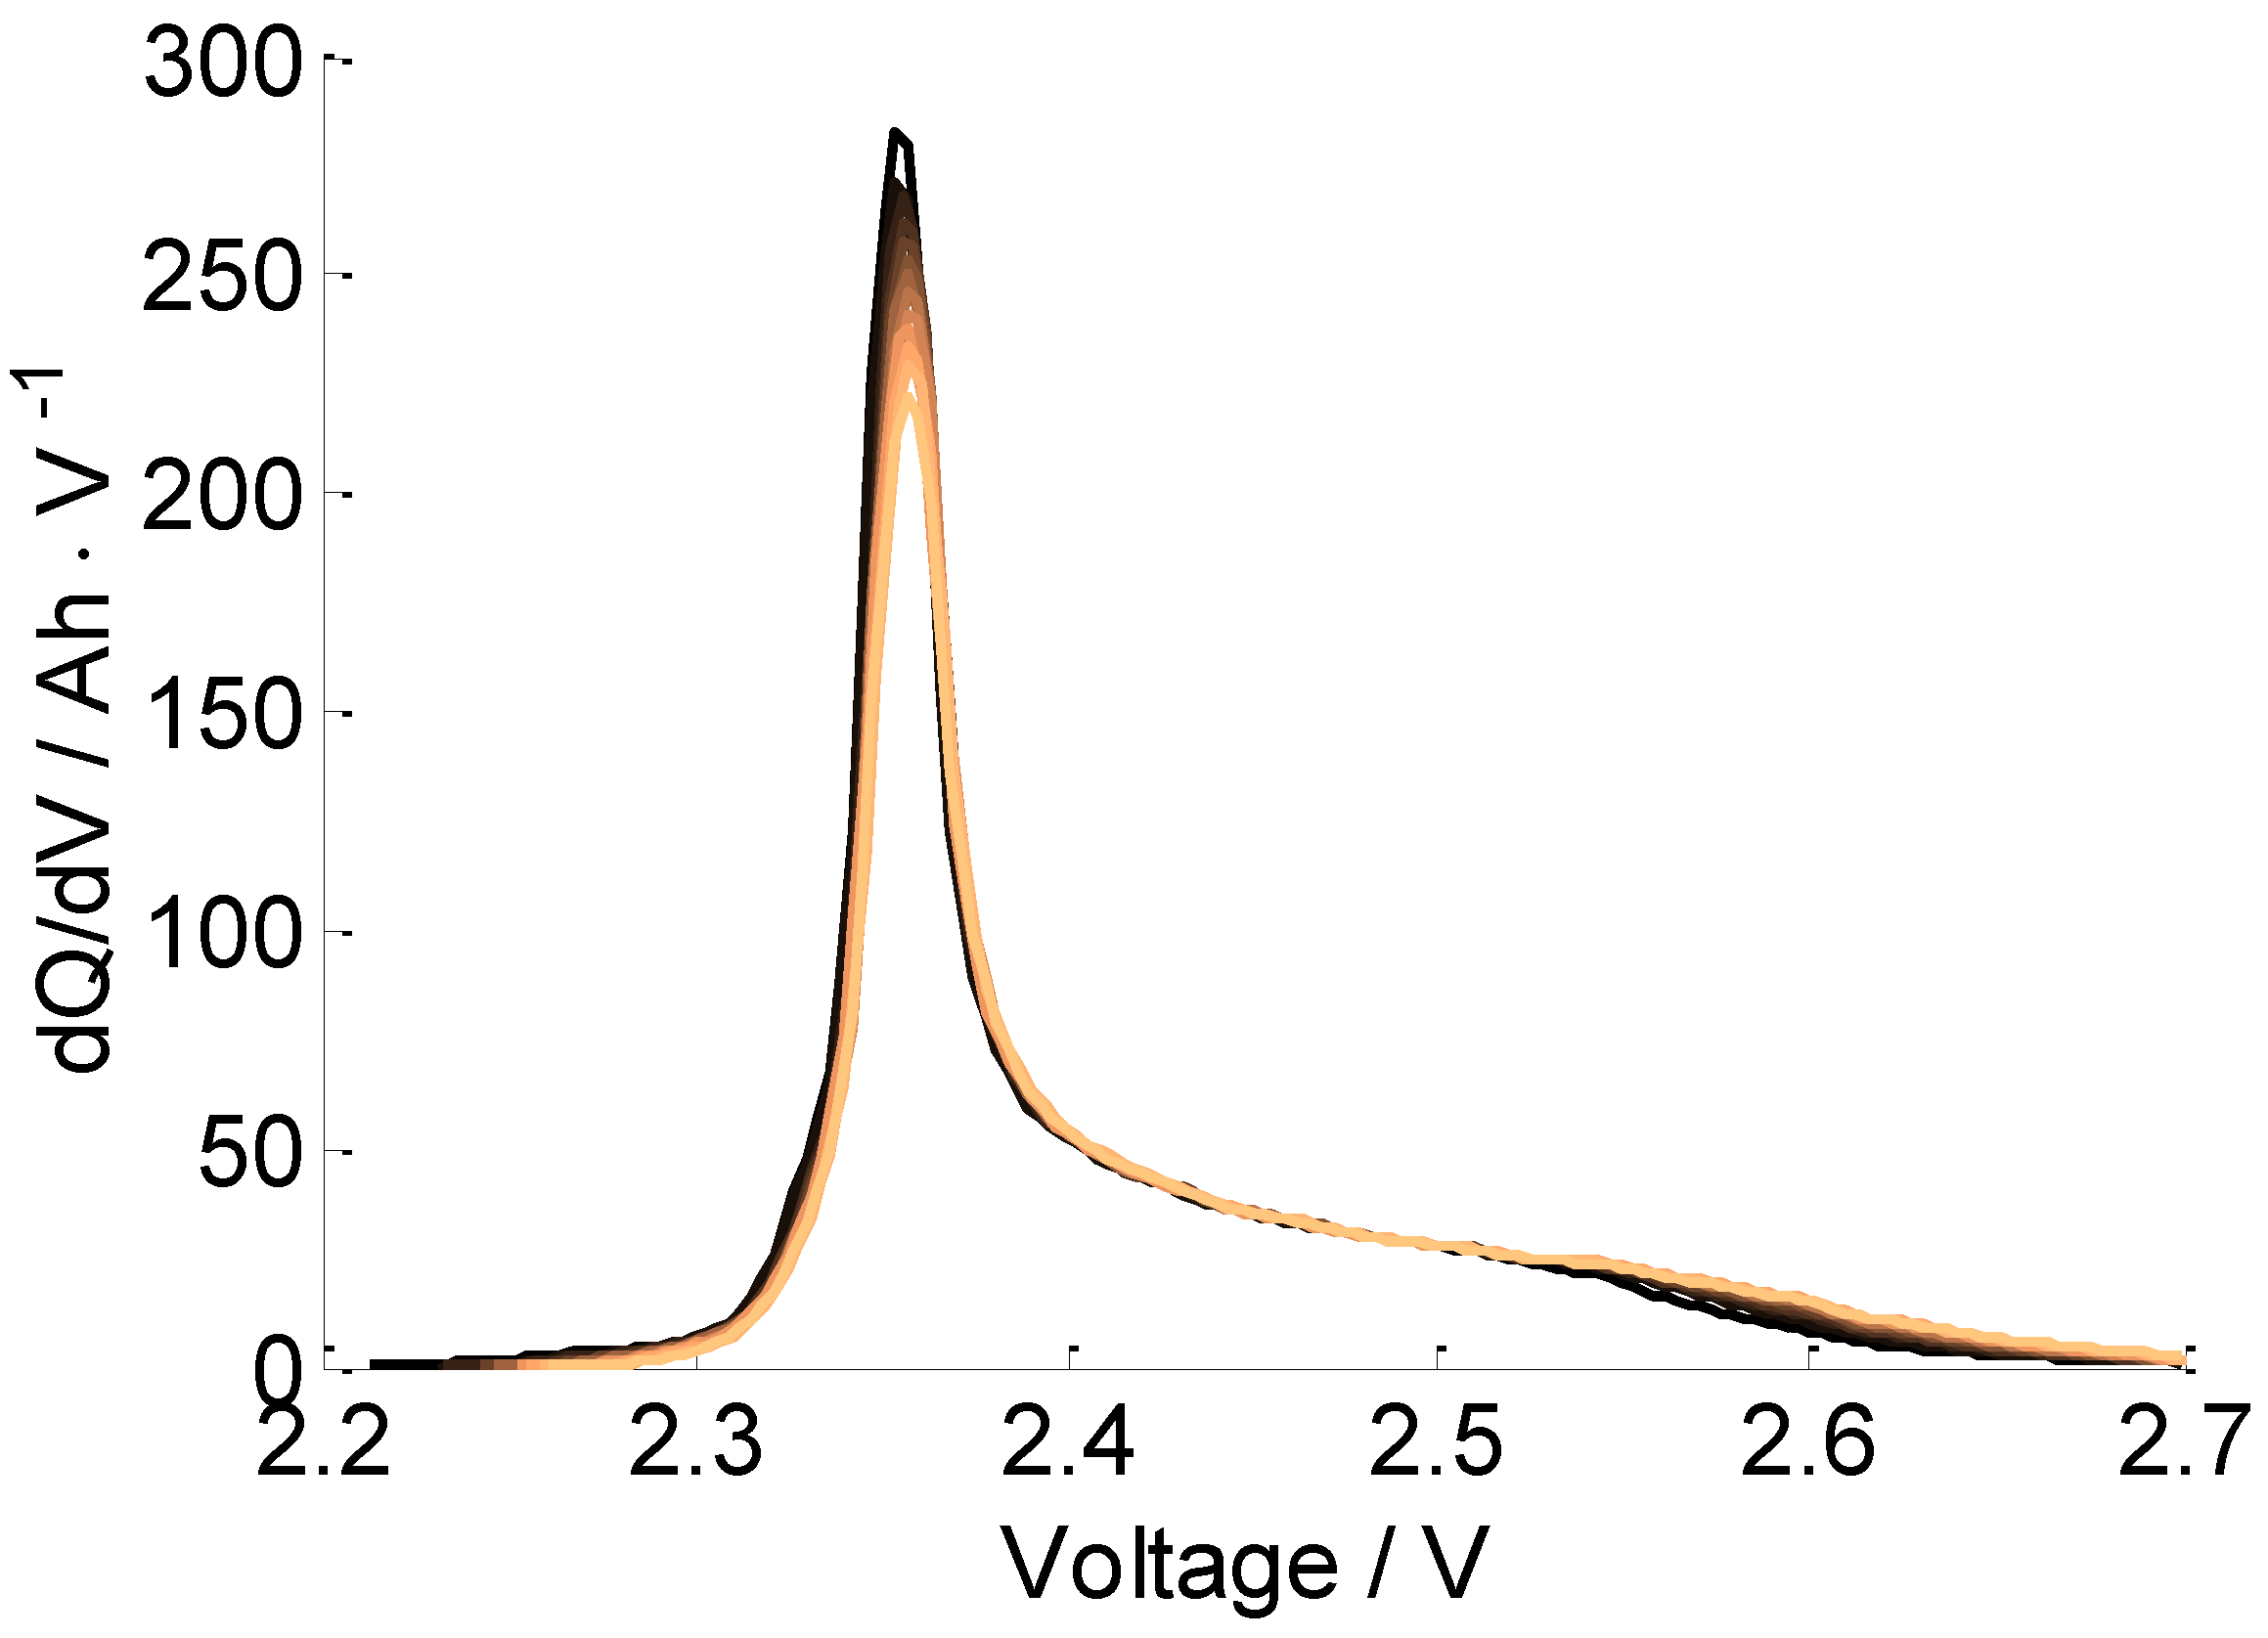
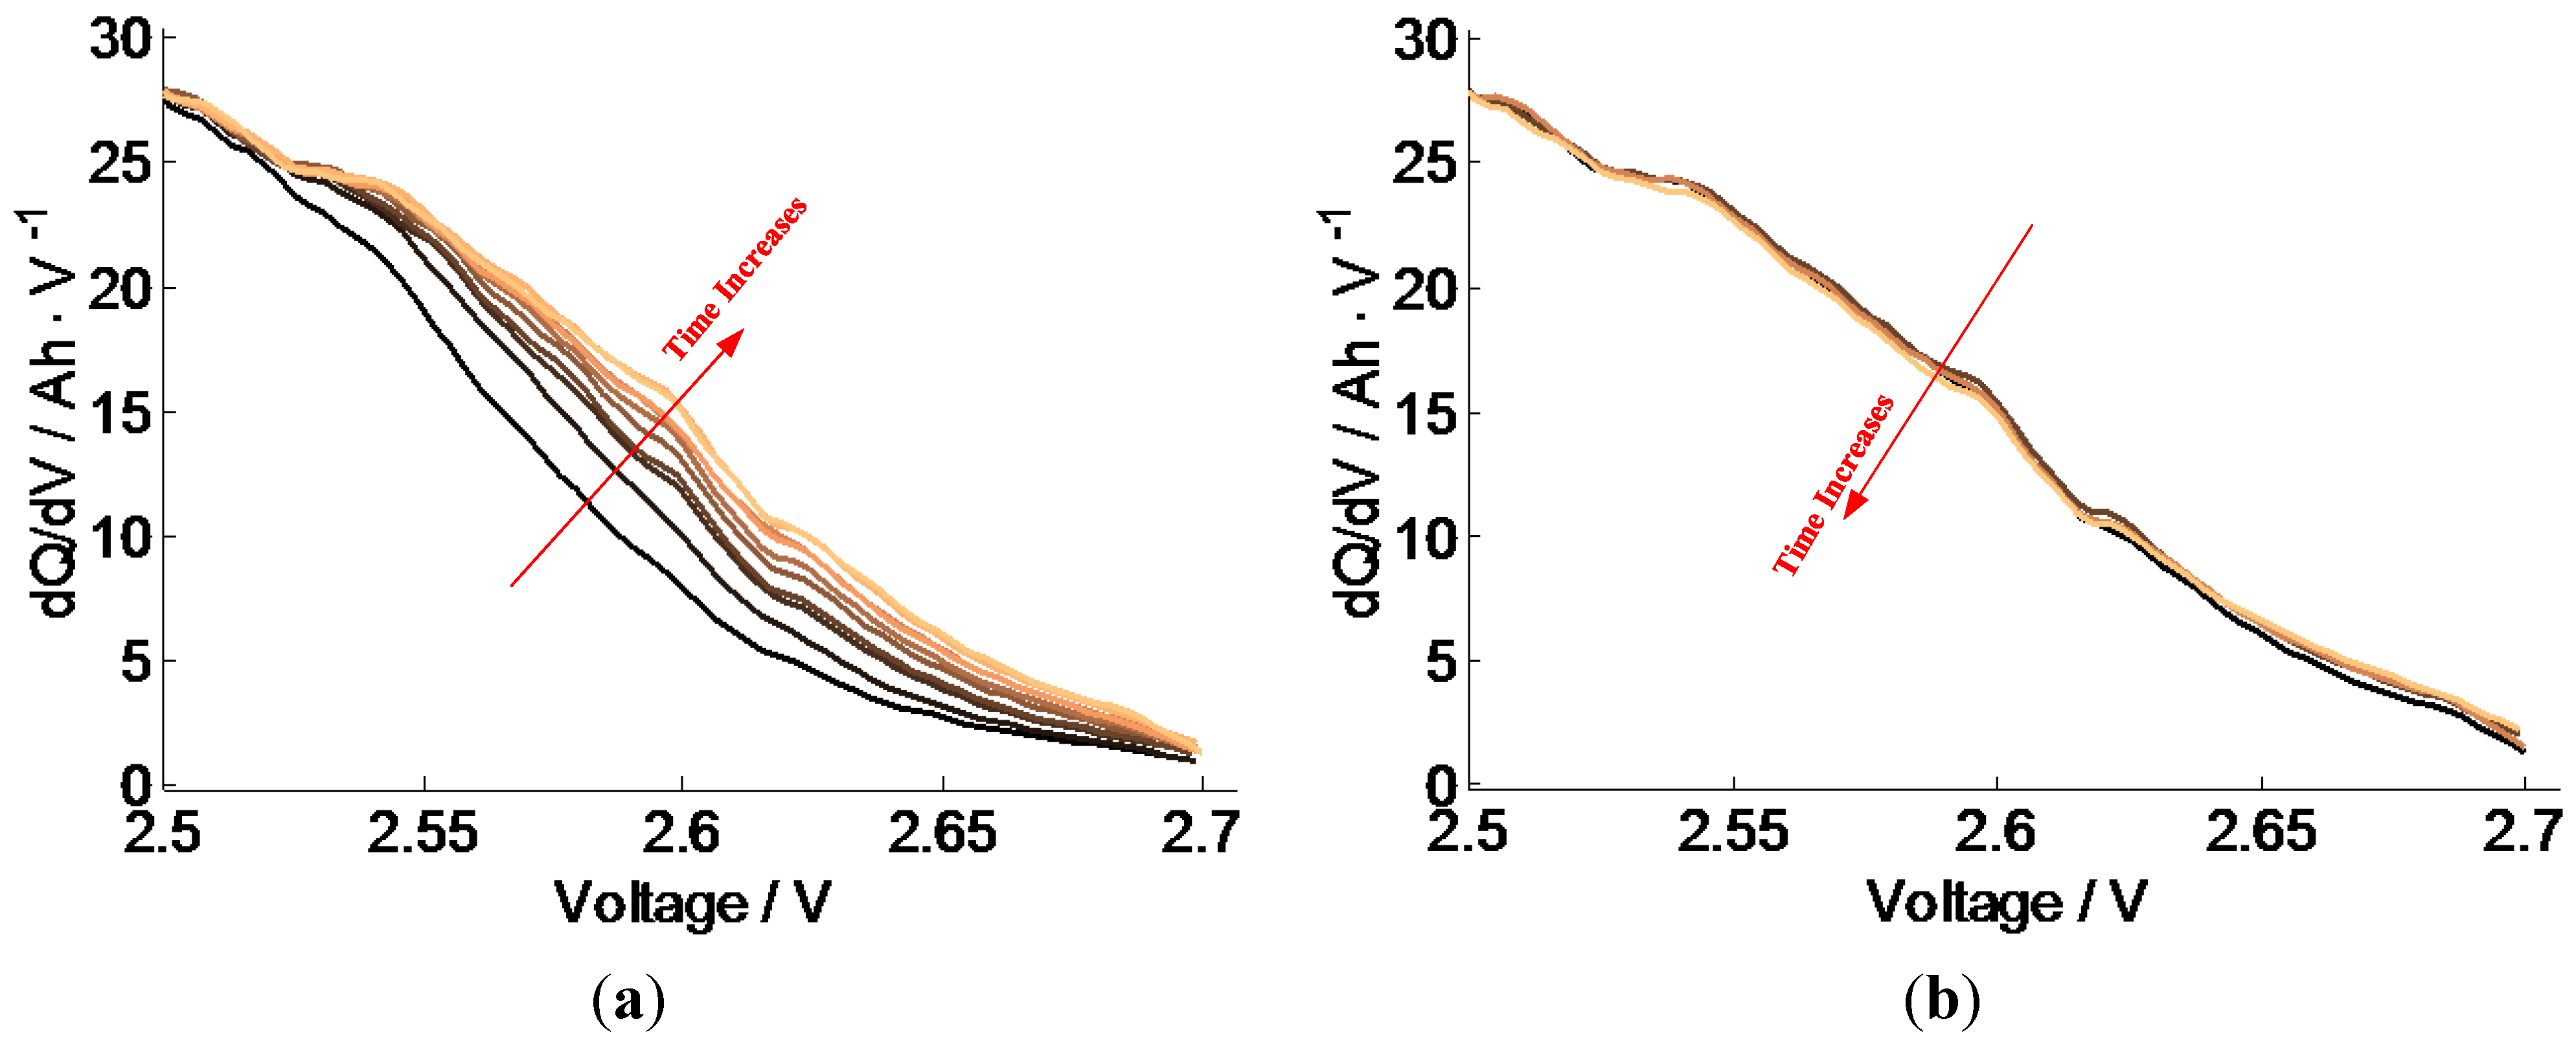
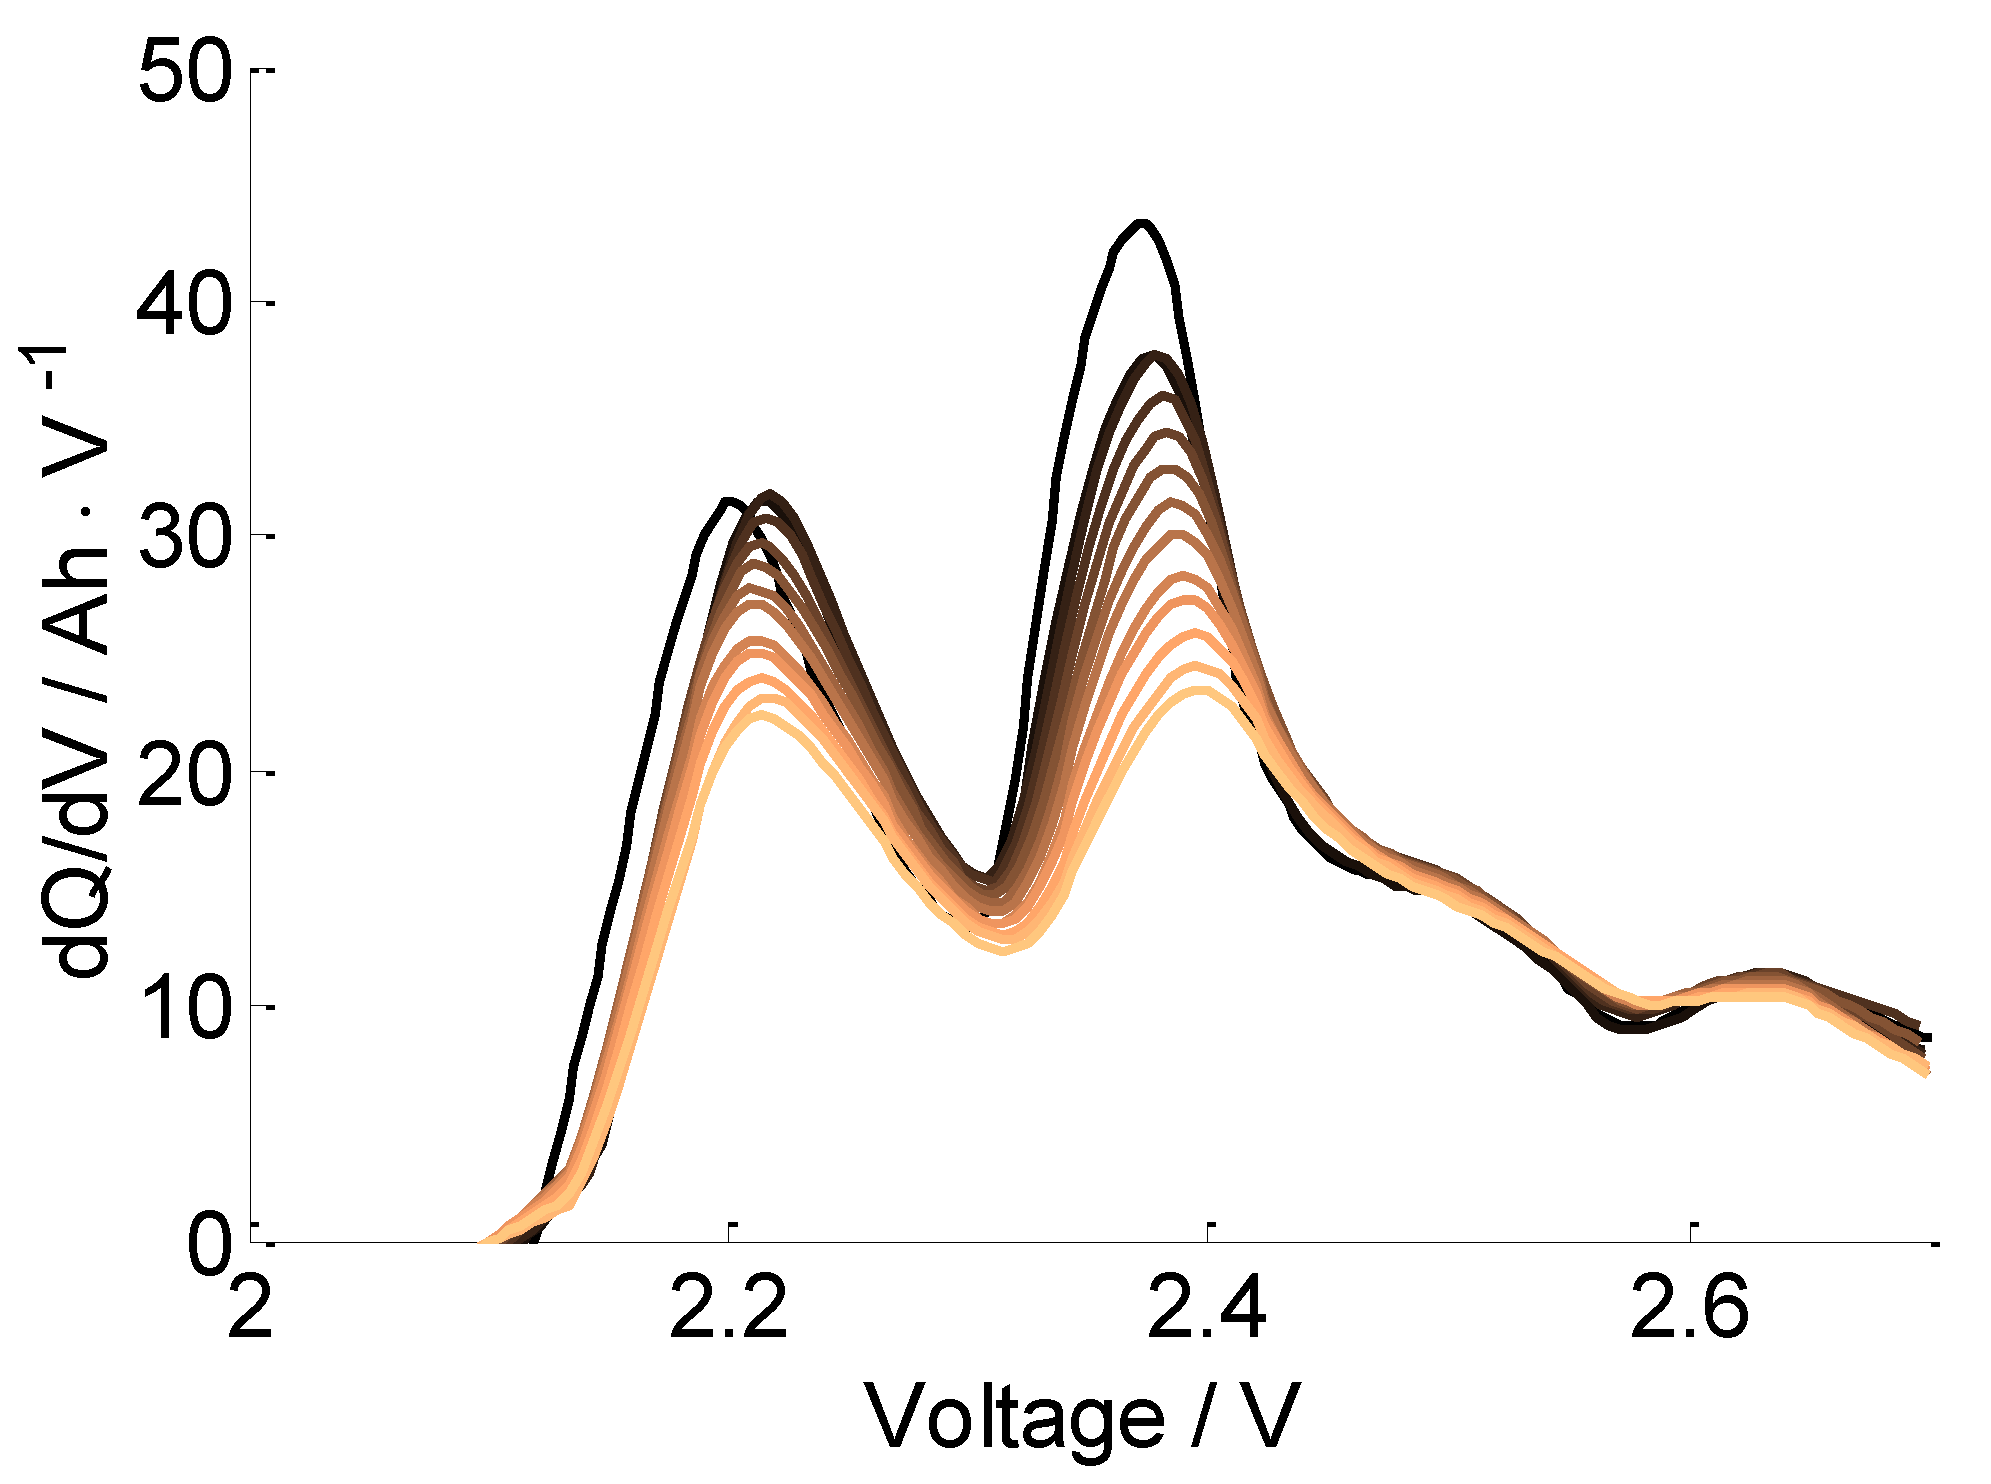
3.3.2. Aging Mechanism Analysis of Cells B and C

The same phenomena as seen in Cell A could be found for Cells B and C in the IC and DV curves as shown in Figure 10, Figure 11, Figure 12 and Figure 13. For the IC curve, the main peak(s) would continuously decrease as the cycle number increases, as shown in Figure 10 and Figure 11. In the high voltage region, the IC curve would increase first, and then decrease, as shown in Figure 12 and Figure 13. The same phenomena show that the aging mechanism of Cells B and C are just the same as that of Cell A, even though the cathode materials of these three cells may be different.
Figure 10. The IC curves of Cell B after every 90 cycles up to 1080 cycles; with cycle number increase, line color changes from black to tan.
Energies 07 04895 g010
Figure 11. The high voltage region of IC curves of Cell B after every 90 cycles: (a) after 0 cycles up to 810 cycles; and (b) after 810 cycles up to 1080 cycles.
Energies 07 04895 g011
Figure 12. The IC curves of Cell C after every 90 cycles up to 1080 cycles; with cycle number increase, line color changes from black to tan.
Energies 07 04895 g012
Figure 13. The high voltage region of IC curves of Cell C after every 90 cycles: (a) after 0 cycles up to 810 cycles; and (b) after 810 cycles up to 1080 cycles.
Energies 07 04895 g013

3.4. Discussion

For the lithium ion battery with carbon anode, the lithium is consumed due to the formation and continuous thickening of the SEI film on the surface of the anode particles, and this lithium loss is the main aging mechanism of capacity fade for this kind of batteries [20,21]. Since the thickness of the SEI film depends on time and is proportional to the square root of time, Equation (2) is widely used in the capacity loss modeling for the lithium ion batteries with carbon anodes:
Energies 07 04895 i002
where Qloss is the percentage of battery capacity loss; Ea is the activation energy in J∙mol−1; R is the gas constant; T is the absolute temperature in K; t is the cycling time; z is the power law factor; and B is the pre-exponential factor. This model is in good agreement with the experiment results [1,8,21]. There are also some capacity fade models in other forms reported by Belt [22] and Ecker [23], etc.
For automotive applications, it is generally accepted that the battery reaches the end of life when the battery capacity reaches 80% of its initial capacity [1]. For most cells reported in the available literatures, before the batteries reach their end of life, the capacity loss usually follows the same model, which indicates that the battery aging is mainly caused by the same aging mechanism within its lifetime. It is possible that if the battery is continuously cycled after it reaches its end of life, other aging mechanisms may influence the battery capacity and the battery may also enter another capacity fade stage which is similar to the results shows in this study. However, within the battery lifetime, the influence of additional aging mechanism could be ignored. Thus for the BMS in the vehicle, the battery capacity estimation and prediction are relatively simple for these types of batteries.
There are also some experimental results supporting the fact that the lithium ion battery with carbon anode may also show two-stage capacity loss. Baumhöfer [24] tested the lithium ion battery with carbon anode and NCM cathode and found that after the battery capacity slowly fades to about 85% of its initial capacity, the battery capacity loss enters the second stage with a much higher degradation rate. The aging mechanism of the first stage is considered as the lithium loss, and for the second stage, it is considered as the loss of active material. Dubarry [25] tested a lithium ion battery with carbon anode and composite cathode comprising (LiMn1/3Ni1/3Co1/3O2 + LiMn2O4) and found a similar result and similar aging mechanism. However, since the battery has almost reached its end of life when the second battery aging mechanism begins to dominate the battery capacity fade, the BMS could ignore the influence of the second aging mechanism and the error would be acceptable.
As shown in Section 3, various kinds of LTO battery show a two-stage capacity fade profile. Similar results are also reported by Hang [26] for the testing of a lithium ion battery with LTO anode and LiCoO2 cathode. Specifically, after the battery capacity fades to around 95% of its initial capacity, the battery degradation enters the second stage with twice to triple the degradation rate. For the LTO batteries, the BMS must consider the two-stage capacity fade profile to precisely estimate the battery remaining capacity, remaining life, and the battery SOH and state of charge (SOC).
If battery manufacturers would provide the capacity of the battery anode and cathode and other key parameters, the capacity of anode and cathode could be estimated, respectively, then the BMS could precisely perform the battery on-line capacity estimation and prediction during the battery cycling. However, for the commercial cells, owing to confidentiality the battery manufactures usually refuse to provide the battery internal parameters. Then the batteries must be tested by a specific cycle life test according to the real working conditions. Especially, the inflection point of the two stage capacity fade profile should be identified. It is unacceptable to use the battery capacity fade rate after a number of cycles to find the battery remaining life by methods like extrapolation.
For automotive applications, the battery could use the constant current charging curve to find the battery IC curve. From the change of the IC curves, the battery capacity fade mechanism could be effectively analyzed [7]. Then, the battery SOH could be better estimated.
It could also be found from Figure 7 that the LTO battery cycle life is greatly influenced by the ratio of the initial cathode capacity and initial anode capacity. To prolong the battery life, the cathode capacity could be increased, i.e., more cathode material could be contained in the battery. However, since the battery capacity of new cell mainly depends on the anode, increasing the cathode material amount may have little influence on the battery capacity but the cost of the battery would be increased.

4. Conclusions

In this paper, the cycle life of three commercial LTO cells was tested under 55 °C. The result shows that under high temperature conditions, the LTO cells show obvious capacity fade; therefore, in a real vehicle, the BMS of LTO batteries should also control the battery temperature within a proper range. All the three cells show a two-stage piecewise linear capacity loss which is quite different from traditional graphite anode lithium ion cells. Based on the IC analysis and different voltage analysis, it could be found that the battery degradation is mainly caused by the loss of anode and cathode material. The capacity loss rate of the cathode is higher than that of the anode. Usually, there is more cathode material than anode one. Then, in the first stage, the battery capacity loss is mainly caused by the loss of anode, and the capacity loss rate is lower. In the second stage, the battery capacity loss is mainly caused by the loss of cathode, and the capacity loss rate is higher. The results provide important information for the design of BMS for the LTO cells, including the SOC and SOH estimation algorithm and RUL prediction algorithm.

Acknowledgments

This research is funded by the Ministry of Science and Technology (MOST) of China under the contract of Nos. 2010DFA72760 and 2011AA11A227, the Ministry of Education (MOE) of China under the contract of No. 2012DFA81190, the Beijing Science and Technology Plan No. Z121100007912001, the National Support Plan 2013BAG16B01, and the Tsinghua University Initiative Scientific Research Program (Grand No. 2011Z01004).

Conflicts of Interest

The authors declare no conflict of interest.

References

  1. Lu, L.; Han, X.; Li, J.; Hua, J.; Ouyang, M. A review on the key issues for lithium-ion battery management in electric vehicles. J. Power Sources 2013, 226, 272–288. [Google Scholar]
  2. Hu, X.; Sun, F.; Zou, Y. Estimation of state of charge of a lithium-ion battery pack for electric vehicles using an adaptive Luenberger observer. Energies 2010, 3, 1586–1603. [Google Scholar] [CrossRef]
  3. Chen, Y.; Miao, Q.; Zheng, B.; Wu, S.; Pecht, M. Quantitative analysis of lithium-ion battery capacity prediction via adaptive bathtub-shaped function. Energies 2013, 6, 3082–3096. [Google Scholar] [CrossRef]
  4. Scrosati, B.; Garche, J. Lithium batteries: Status, prospects and future. J. Power Sources 2010, 195, 2419–2430. [Google Scholar] [CrossRef]
  5. Belharouak, I.; Koenig, G.M.; Amine, K. Electrochemistry and safety of Li4Ti5O12 and graphite anodes paired with LiMn2O4 for hybrid electric vehicle Li-ion battery applications. J. Power Sources 2011, 196, 10344–10350. [Google Scholar] [CrossRef]
  6. Zaghib, K.; Dontigny, M. Safe and fast-charging Li-ion battery with long shelf life for power applications. J. Power Sources 2011, 196, 3949–3954. [Google Scholar] [CrossRef]
  7. Han, X.; Ouyang, M.; Lu, L.; Li, J.; Zheng, Y.; Li, Z. A comparative study of commercial lithium ion battery cycle life in electrical vehicle: Aging mechanism identification. J. Power Sources 2013, 251, 38–54. [Google Scholar]
  8. Bloom, I.; Cole, B.W.; Sohn, J.J.; Jones, S.A.; Polzin, E.G.; Battaglia, V.S.; Henriksen, G.L.; Motloch, C.; Richardson, R.; Unkelhaeuser, T.; et al. An accelerated calendar and cycle life study of Li-ion cells. J. Power Sources 2001, 101, 238–247. [Google Scholar] [CrossRef]
  9. Wang, J.; Liu, P.; Hicks-Garner, J.; Sherman, E.; Soukiazian, S.; Verbrugge, M.; Tataria, H.; Musser, J.; Finamore, P. Cycle-life model for graphite-LiFePO4 cells. J. Power Sources 2011, 196, 3942–3948. [Google Scholar] [CrossRef]
  10. Dubarry, M.; Liaw, B.Y. Identifying battery aging mechanisms in large format Li ion cells. J. Power Sources 2011, 196, 3420–3425. [Google Scholar] [CrossRef]
  11. Dubarry, M.; Liaw, B.Y. Identify capacity fading mechanism in a commercial LiFePO4 cell. J. Power Sources 2009, 194, 541–549. [Google Scholar] [CrossRef]
  12. Kassem, M.; Bernard, J.; Revel, R.; Pélissier, S.; Duclaud, F.; Delacourt, C. Calendar aging of a graphite/LiFePO4 cell. J. Power Sources 2012, 208, 296–305. [Google Scholar] [CrossRef]
  13. Safari, M.; Delacourt, C. Aging of a commercial graphite/LiFePO4 cell. J. Electrochem. Soc. 2011, 158, A1123–A1135. [Google Scholar] [CrossRef]
  14. Dubarry, M.; Truchot, C.; Liaw, B.Y. Synthesize battery degradation modes via a diagnostic and prognostic model. J. Power Sources 2012, 219, 204–216. [Google Scholar] [CrossRef]
  15. Bloom, I.; Christophersen, J.P.; Abraham, D.P.; Gering, K.L. Differential voltage analyses of high-power, lithium-ion cells 1. Technique and application. J. Power Sources 2005, 139, 295–303. [Google Scholar] [CrossRef]
  16. Honkura, K.; Takahashi, K.; Horiba, T. Capacity-fading prediction of lithium-ion batteries based on discharge curves analysis. J. Power Sources 2011, 196, 10141–10147. [Google Scholar] [CrossRef]
  17. Dahn, H.M.; Smith, A.J.; Burns, J.C.; Stevens, D.A.; Dahn, J.R. User-friendly differential voltage analysis freeware for the analysis of degradation mechanisms in Li-ion batteries. J. Electrochem. Soc. 2012, 159, A1405–A1409. [Google Scholar] [CrossRef]
  18. Feng, X.; Li, J.; Ouyang, M.; Lu, L.; Li, J.; He, X. Using probability density function to evaluate the state of health of lithium-ion batteries. J. Power Sources 2013, 232, 209–218. [Google Scholar] [CrossRef]
  19. Dubarry, M.; Truchot, C.; Cugnet, M.; Liawa, B.Y.; Geringb, K.; Sazhinb, S.; Jamisonb, D.; Michelbacherb, C. Evaluation of commercial lithium-ion cells based on composite positive electrode for plug-in hybrid electric vehicle applications. Part I: Initial characterizations. J. Power Sources 2011, 196, 10328–10335. [Google Scholar] [CrossRef]
  20. Spotnitz, R. Simulation of capacity fade in lithium-ion batteries. J. Power Sources 2003, 113, 72–80. [Google Scholar] [CrossRef]
  21. Deshpande, R.; Verbrugge, M.; Cheng, Y.; Wang, J.; Liu, P. Battery cycle life prediction with coupled chemical degradation and fatigue mechanics. J. Electrochem. Soc. 2012, 159, A1730–A1738. [Google Scholar] [CrossRef]
  22. Belt, J.; Utgikar, V.; Bloom, I. Calendar and PHEV cycle life aging of high-energy, lithium-ion cells containing blended spinel and layered-oxide cathodes. J. Power Sources 2011, 196, 10213–10221. [Google Scholar] [CrossRef]
  23. Ecker, M.; Gerschler, J.B.; Vogel, J.; Käbitz, S.; Hust, F.; Dechent, P.; Sauer, D.U. Development of a lifetime prediction model for lithium-ion batteries based on extended accelerated aging test data. J. Power Sources 2012, 215, 248–257. [Google Scholar] [CrossRef]
  24. Baumhöfer, T.; Brühl, M.; Rothgang, S.; Sauer, D.U. Production caused variation in capacity aging trend and correlation to initial cell performance. J. Power Sources 2014, 247, 332–338. [Google Scholar] [CrossRef]
  25. Dubarry, M.; Truchot, C.; Liaw, B.Y.; Gering, K.; Sazhin, S.; Jamison, D.; Michelbacher, C. Evaluation of commercial lithium-ion cells based on composite positive electrode for plug-in hybrid electric vehicle applications. Part II. Degradation mechanism under 2C cycle aging. J. Power Sources 2011, 196, 10336–10343. [Google Scholar] [CrossRef]
  26. Hang, T.; Mukoyama, D.; Nara, H.; Takami, N.; Momma, T.; Osaka, T. Electrochemical impedance spectroscopy analysis for lithium-ion battery using Li4Ti5O12 anode. J. Power Sources 2013, 222, 442–447. [Google Scholar] [CrossRef]

