An Acausal Li-Ion Battery Pack Model for Automotive Applications

Abstract
:1. Introduction
2. Cell Model Development
2.1. Cell Model Structure
2.1.1. Cell Electrical Model


2.1.2. Cell Thermal Model

 is given by [41]:


 (which will be of the order 10−1) in Equation (9) is comparable with the term V − Voc and should therefore not be neglected at small SOC values.
2.2. Cell Model Parameterization
2.2.1. Cell Electrical Model


 which represents a typical operating envelope for EVs. It is important to include in the HPPC tests physical conditions that are close to the boundary of operation where batteries display non-linear behavior. For example, in lithium batteries possessing a graphite negative electrode there is highly non-linear Voc dependency on SOC around very large and very small SOC values due changes in intercalation and de-intercalation phases [42,43] so it is important to include 5% and 95% SOC points in the characterization tests.
2.2.2. Cell Thermal Model
2.3. Cell Model Implementation


3. Pack Model Development
3.1. Pack Model Structure
3.1.1. Pack Electrical Model
3.1.2. Pack Thermal Model

3.2. Pack Model Parameterization
3.2.1. Pack Electrical Model

| Cell | LFP (P) | LMO (P) | LTO (P) | NMC1 (P) | NMC2 (P) | NMC3 (P) | MO (P) | NMC4 (P) | NCA (C) | NMC5 (P) | NMC6 (P) | |
|---|---|---|---|---|---|---|---|---|---|---|---|---|
| Voc | Std% of mean | 0.00% | 0.04% | 1.11% | 7.35% | 0.39% | 0.06% | 5.19% | 0.20% | 0.13% | 0.45% | 2.70% |
| Range% of mean | 0.00% | 0.13% | 4.17% | 23.70% | 1.79% | 0.27% | 17.76% | 0.56% | 0.83% | 1.93% | 8.52% | |
| Std error% | 0.00% | 0.01% | 0.21% | 2.25% | 0.07% | 0.01% | 0.92% | 0.05% | 0.01% | 0.10% | 0.85% | |
| Impedance 1 kHz | Std% of mean | 27.84% | 2.05% | 3.68% | 37.02% | 2.93% | 2.05% | 25.52% | 0.00% | 1.28% | 3.73% | 2.13% |
| Range% of mean | 71.51% | 6.58% | 15.56% | 116.75% | 9.69% | 9.78% | 76.55% | 0.00% | 7.17% | 14.75% | 6.24% | |
| Std error% | 5.68% | 0.58% | 0.68% | 10.70% | 0.78% | 0.32% | 4.51% | 0.00% | 0.06% | 0.83% | 0.67% | |
| Initial battery capacity | Std% of mean | 0.50% | 0.05% | 1.69% | 18.00% | 0.51% | 0.16% | 0.18% | 0.00% | 0.00% | 9.09% | 1.63% |
| Range% of mean | 1.19% | 0.09% | 3.67% | 41.67% | 1.34% | 0.30% | 0.41% | 0.00% | 0.00% | 18.18% | 3.16% | |
| Std error% | 0.25% | 0.03% | 0.84% | 9.00% | 0.23% | 0.09% | 0.09% | 0.00% | 0.00% | 5.25% | 0.94% | |
| Bus bar resistance | Std% of mean | 0.50% | 0.50% | 0.50% | 0.50% | 0.50% | 0.50% | 0.50% | 0.50% | 0.50% | 0.50% | 0.50% |
| Range% of mean | 2.50% | 2.50% | 2.50% | 2.50% | 2.50% | 2.50% | 2.50% | 2.50% | 2.50% | 2.50% | 2.50% | |
| Std error% | 0.12% | 0.12% | 0.12% | 0.12% | 0.12% | 0.12% | 0.12% | 0.12% | 0.12% | 0.12% | 0.12% | |

3.2.2. Pack Thermal Model
 is taken to be << 1.
3.3. Model Implementation


4. Discussion


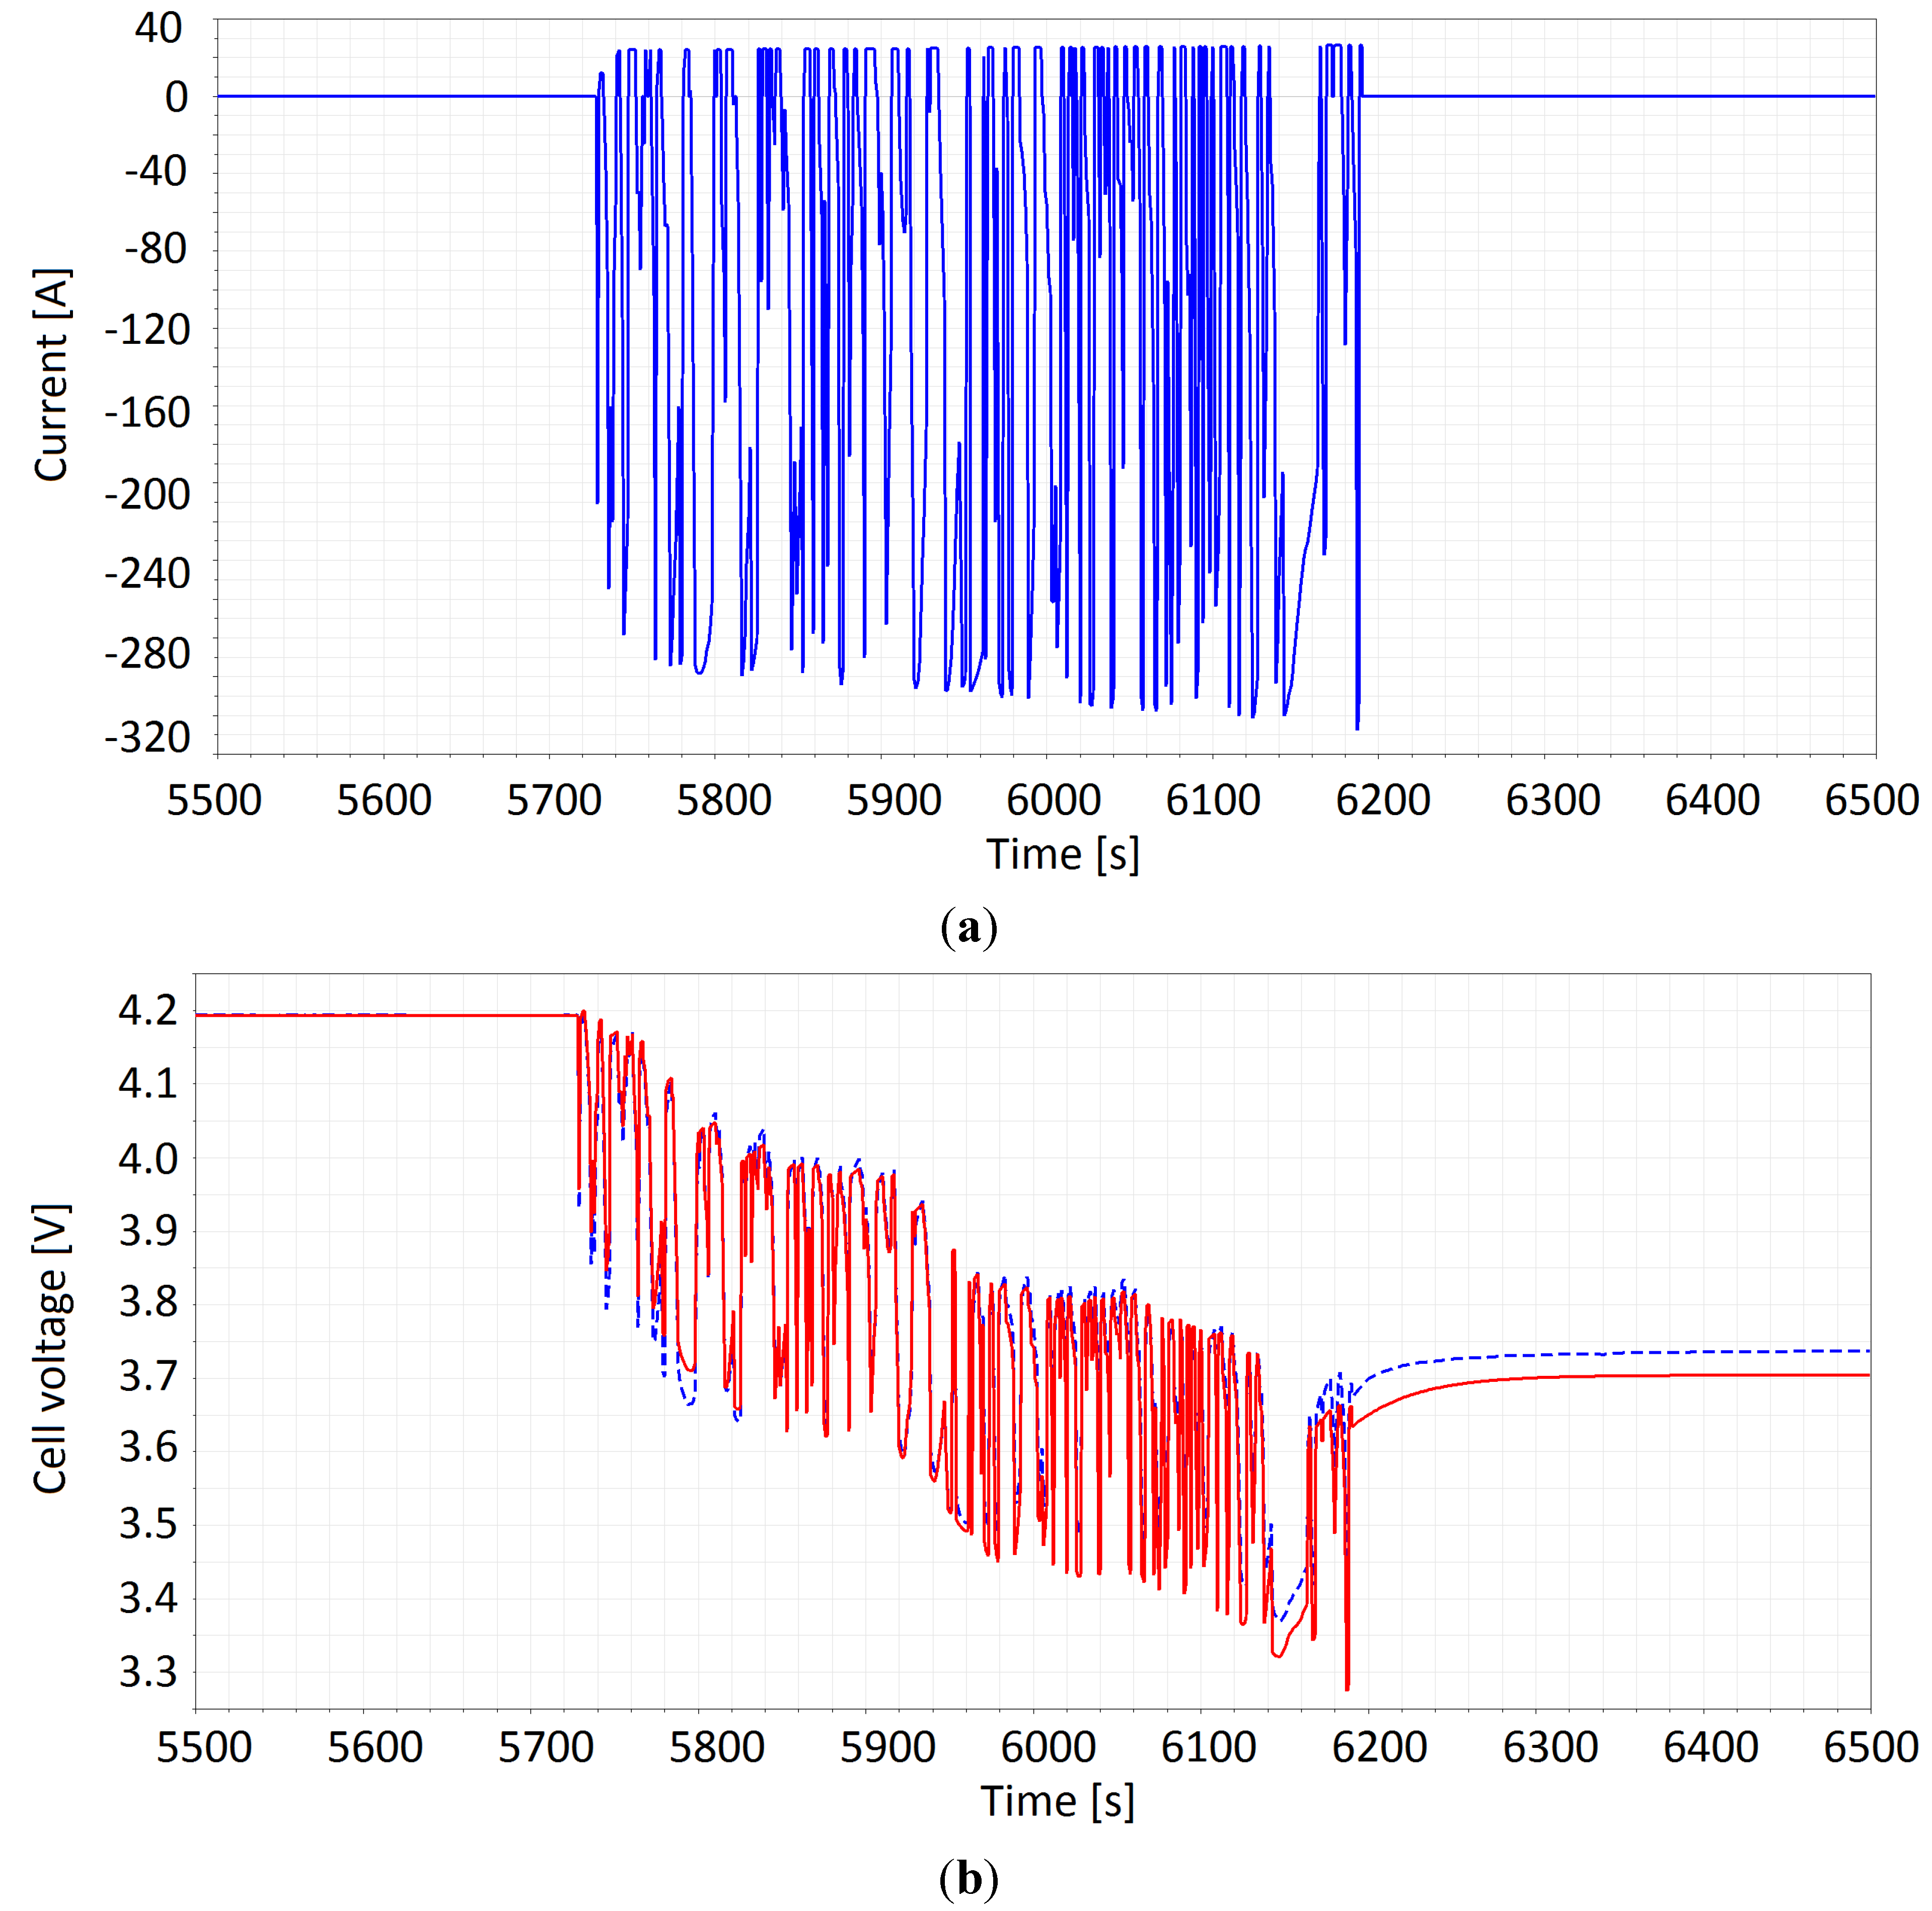
 . Figure 13 shows that cells with higher SOC are required to meet pack demands while simultaneously working to re-balance cells with lower SOC. It can be seen that, cells with an initial SOC of 56% lost capacity during cycling because it’s equilibrium voltage was higher than the modules nominal voltage; when the power demand was switched off the modules nominal voltage immediately rose above the cells Voc resulting in a change of polarity, i.e., causing the cell to then charge towards a module equilibrium. The capacity throughput after 100 s of cells: starting at 70% is 180 A·s, starting at 56% is 17.5 A·s, starting at 50% is 24 A·s. The ability to emulate within a single model structure, the interconnection of cells using both Kirchhoff’s voltage law and the current law, is an inherent property of the proposed acausual modeling approach and one that would be prohibitively difficult when using a traditional declaration-based simulation tool.
5. Conclusions
Nomenclature
| A | Cooling plate surface area (m2) |
| Cd | Polarization capacitance (F) |
| Cp | Cell bulk heat capacity (J/(kg·K)) |
| CTh | Transient current load capacitance (F) |
| D | Diameter of the orifice (m) |
| G | Cell bulk thermal conductance (W/K) |
| i (subscript) | ith time-step |
| Id | Effective current across the capacitor Cd (A) |
| IL | Load current at battery terminals (A) |
| Imax | Maximum manufacturer suggested discharge/charge current of cell (A) |
| k | Thermal conductivity (W/(m·K)) |
| L | Cell thickness (m) |
| m | Cell mass (kg) |
| mflow | Coolant flow rate in pack cooling circuit (L/min) |
| ∆p | Pressure drop between the pump and cooling circuit (psi) |
| Q | Endothermic heat generated in the cell (J) |
| Qrated | Battery rated capacity (A·h) |
| QTh | Charge accumulated on capacitor CTh (A·h) |
| R0 | Ohmic resistance (Ω) |
| Rd | Polarization resistance (Ω) |
| SOC | State of charge (%) |
| T | Cell effective temperature (°C) |
| tpulse | Current pulse length |
| Ud | Voltage across Cd (V) |
| Uoc | Mean Vocfrom galvanostatic intermittent titration technique (GITT) experiments (V) |
| UTh | Voltage across CTh (V) |
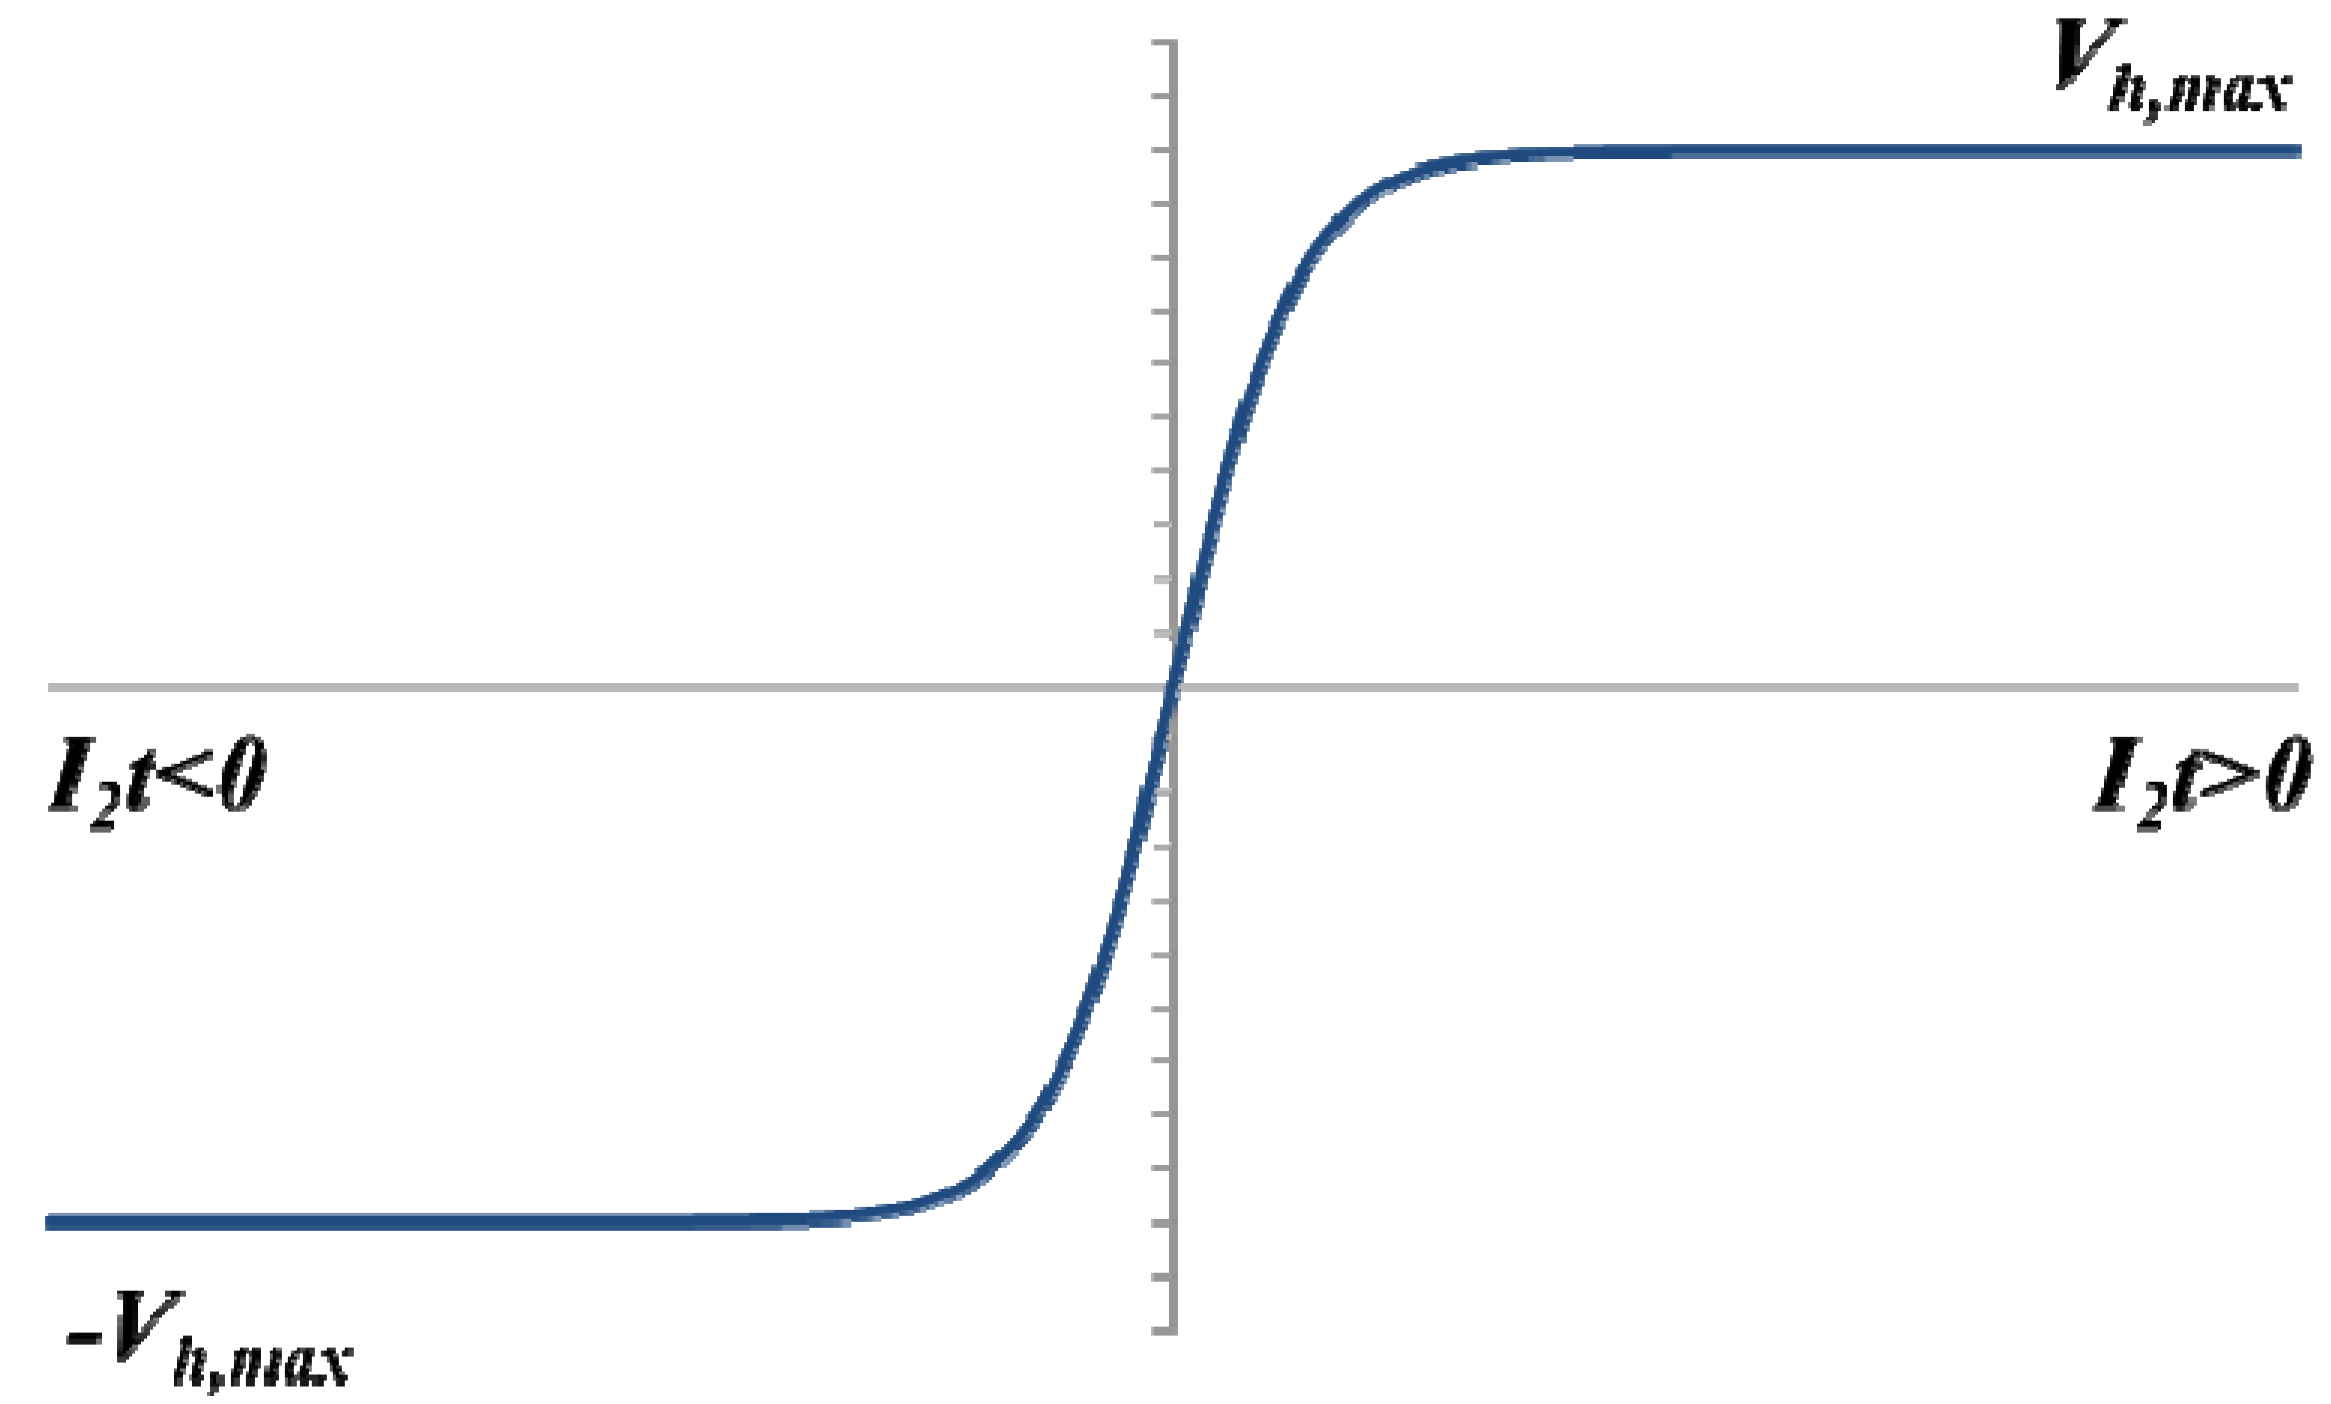
| Vh | Hysteresis voltage (V) |
| Vh,max | Maximum hysteresis voltage (V) |
| VL | Load voltage at battery terminals (V) |
| | Nominal voltage of battery module (V) |
| Voc | Open circuit voltage (V) |
| β | Hysteresis voltage capacity (A·h) |
| ζ | Pressure drop loss factor |
| τ | Resistor-capacitor (RC) time constant |
Acknowledgments
Author Contributions
Conflicts of Interest
References
- Cluzel, C.; Douglas, C. Cost and Performance of EV Batteries; Final Report for the Committee on Climate Change; Element Energy Limited: Cambridge, UK, 2012. [Google Scholar]
- Tate, E.; Harpster, M.O.; Savagian, P.J. The electrification of the automobile: From conventional hybrid, to plug-in hybrids, to extended-range electric vehicles. In Proceedings of the SAE World Congress & Exhibition,, Detroit, MI, USA, 14–17 April 2008. [CrossRef]
- Franke, T.; Neumann, I.; Bühler, F.; Cocron, P.; Krems, J.F. Experiencing range in an electric vehicle: Understanding psychological barriers. Appl. Psychol. 2012, 61, 368–391. [Google Scholar]
- Nilsson, M. Electric Vehicles: The Phenomenon of Range Anxiety; ELVIRE Report; ELVIRE: Babenhausen, Germany, 2011. [Google Scholar]
- Meissner, E.; Richter, G. The challenge to the automotive battery industry: The battery has to become an increasingly integrated component within the vehicle electric power system. J. Power Sources 2005, 144, 438–460. [Google Scholar] [CrossRef]
- Lu, L.; Han, X.; Li, J.; Hua, J.; Ouyang, M. A review on the key issues for lithium-ion battery management in electric vehicles. J. Power Sources 2013, 226, 272–288. [Google Scholar] [CrossRef]
- Fuller, T.F.; Doyle, M.; Newman, J. Relaxation phenomena in lithium-ion-insertion cells. J. Electrochem. Soc. 1994, 141, 982–990. [Google Scholar] [CrossRef]
- Srinivasan, V.; Newman, J. Discharge model for the lithium iron-phosphate electrode. J. Electrochem. Soc. 2004, 151, A1517–A1529. [Google Scholar] [CrossRef]
- Thorat, I.V.; Joshi, T.; Zaghib, K.; Harb, J.N.; Wheeler, D.R. Understanding rate-limiting mechanisms in LiFePO4 cathodes for Li-ion batteries. J. Electrochem. Soc. 2011, 158, A1185–A1193. [Google Scholar] [CrossRef]
- Bazant, M.Z. Theory of chemical kinetics and charge transfer based on nonequilibrium thermodynamics. Acc. Chem. Res. 2013, 46, 1144–1160. [Google Scholar] [CrossRef] [PubMed]
- Cogswell, D.A.; Bazant, M.Z. Theory of coherent nucleation in phase-separating nanoparticles. Nano Lett. 2013, 13, 3036–3041. [Google Scholar] [CrossRef] [PubMed]
- Bai, P.; Bazant, M.Z. Charge transfer kinetics at the solid-solid interface in porous electrodes. Nat. Commun. 2014, 5. [Google Scholar] [CrossRef]
- Feinauer, J.; Spettl, A.; Manke, I.; Strege, S.; Kwade, A.; Pott, A.; Schmidt, V. Structural Characterization of Particle Systems using Spherical Harmonics. 2014. Available online: http://www.mathematik.uni-ulm.de/stochastik/personal/schmidt/publications/SphericalHarmonics.pdf (accessed on 15 July 2014).
- Subramanian, V.R.; Diwakar, V.D.; Tapriyal, D. Efficient macro-micro scale coupled modeling of batteries. J. Electrochem. Soc. 2005, 152, A2002–A2008. [Google Scholar] [CrossRef]
- Subramanian, V.R.; Boovaragavan, V.; Diwakar, V.D. Toward real-time simulation of physics based lithium-ion battery models. Electrochem. Solid-State Lett. 2007, 10, A255–A260. [Google Scholar]
- Bhikkaji, B.; Söderström, T. Reduced order models for diffusion systems. Int. J. Control 2001, 74, 1543–1557. [Google Scholar] [CrossRef]
- Dao, T.-S.; Vyasarayani, C.P.; McPhee, J. Simplification and order reduction of lithium-ion battery model based on porous-electrode theory. J. Power Sources 2012, 198, 329–337. [Google Scholar] [CrossRef]
- Smith, K.A.; Rahn, C.D.; Wang, C.-Y. Model order reduction of 1D diffusion systems via residue grouping. J. Dyn. Syst. Meas. Control 2008, 130. [Google Scholar] [CrossRef]
- Cai, L.; White, R.E. Reduction of model order based on proper orthogonal decomposition for lithium-ion battery simulations. J. Electrochem. Soc. 2009, 156, A154–A161. [Google Scholar] [CrossRef]
- He, H.; Xiong, R.; Fan, J. Evaluation of lithium-ion battery equivalent circuit models for state of charge estimation by an experimental approach. Energies 2011, 4, 582–598. [Google Scholar] [CrossRef]
- Dubarry, M.; Vuillaume, N.; Liaw, B.Y. Origins and accommodation of cell variations in Li-ion battery pack modeling. Int. J. Energy Res. 2010, 34, 216–231. [Google Scholar] [CrossRef]
- Dubarry, M.; Vuillaume, N.; Liaw, B.Y. From single cell model to battery pack simulation for Li-ion batteries. J. Power Sources 2009, 186, 500–507. [Google Scholar] [CrossRef]
- Wetter, M. Modelica-based modelling and simulation to support research and development in building energy and control systems. J. Build. Perform. Simul. 2009, 2, 143–161. [Google Scholar] [CrossRef]
- Surewaard, E.; Tiller, M.; Linzen, D. A comparison of different methods for battery and supercapacitor modeling. In Proceedings of the Future Transportation Technology Conference & Exposition, Costa Mesa, CA, USA, 23–25 June 2003. [CrossRef]
- Hu, X.; Li, S.; Peng, H. A comparative study of equivalent circuit models for Li-ion batteries. J. Power Sources 2012, 198, 359–367. [Google Scholar] [CrossRef]
- Belt, J.R. Battery Test Manual for Plug-In Hybrid Electric Vehicles; Idaho National Laboratory: Idaho Falls, ID, USA, 2010. [Google Scholar]
- Hu, Y.; Yurkovich, S.; Guezennec, Y.; Yurkovich, B. Electro-thermal battery model identification for automotive applications. J. Power Sources 2011, 196, 449–457. [Google Scholar] [CrossRef]
- Fritzson, P. Principles of Object-Oriented Modeling and Simulation with Modelica 2.1; John Wiley & Sons: Hoboken, NJ, USA, 2010. [Google Scholar]
- Tiller, M. Introduction to Physical Modeling with Modelica; Springer: Berlin, Germany, 2001. [Google Scholar]
- Hartmann, R.L. An Aging Model for Lithium-Ion Cells. Ph.D. Thesis, The University of Akron, Akron, OH, USA, 2009. [Google Scholar]
- Forman, J.C.; Moura, S.J.; Stein, J.L.; Fathy, H.K. Genetic identification and fisher identifiability analysis of the Doyle-Fuller-Newman model from experimental cycling of a LiFePO4 cell. J. Power Sources 2012, 210, 263–275. [Google Scholar] [CrossRef]
- Chen, M.; Rincon-Mora, G.A. Accurate electrical battery model capable of predicting runtime and IV performance. IEEE Trans. Energy Convers. 2006, 21, 504–511. [Google Scholar] [CrossRef]
- Benini, L.; Castelli, G.; Macii, A.; Macii, E.; Poncino, M.; Scarsi, R. A discrete-time battery model for high-level power estimation. In Proceedings of the Design, Automation and Test in Europe Conference and Exhibition, Paris, France, 27–30 March 2000; pp. 35–39.
- Lotfi, N.; Fajri, P.; Novosad, S.; Savage, J.; Landers, R.G.; Ferdowsi, M. Development of an experimental testbed for research in lithium-ion battery management systems. Energies 2013, 6, 5231–5258. [Google Scholar] [CrossRef]
- Roscher, M.A.; Sauer, D.U. Dynamic electric behavior and open-circuit-voltage modeling of LiFePO4-based lithium ion secondary batteries. J. Power Sources 2011, 196, 331–336. [Google Scholar] [CrossRef]
- Newman, J.; Thomas-Alyea, K.E. Electrochemical Systems; John Wiley & Sons: Hoboken, NJ, USA, 2012. [Google Scholar]
- Smith, K.; Wang, C.-Y. Solid-state diffusion limitations on pulse operation of a lithium ion cell for hybrid electric vehicles. J. Power Sources 2006, 161, 628–639. [Google Scholar] [CrossRef]
- Song, L.; Evans, J.W. Electrochemical-thermal model of lithium polymer batteries. J. Electrochem. Soc. 2000, 147, 2086–2095. [Google Scholar] [CrossRef]
- Pesaran, A.A. Battery thermal models for hybrid vehicle simulations. J. Power Sources 2002, 110, 377–382. [Google Scholar] [CrossRef]
- Troxler, Y.; Wu, B.; Marinescu, M.; Yufit, V.; Patel, Y.; Marquis, A.J.; Brandon, N.P.; Offer, G.J. The effect of thermal gradients on the performance of lithium-ion batteries. J. Power Sources 2014, 247, 1018–1025. [Google Scholar] [CrossRef]
- Onda, K.; Kameyama, H.; Hanamoto, T.; Ito, K. Experimental study on heat generation behavior of small lithium-ion secondary batteries. J. Electrochem. Soc. 2003, 150, A285–A291. [Google Scholar] [CrossRef]
- Muratori, M. Thermal Characterization of Lithium-Ion Battery Cell. Ph.D. Thesis, Polytechnic University of Milan, Milan, Italy, 2010. [Google Scholar]
- Yazami, R.; Reynier, Y. Thermodynamics and crystal structure anomalies in lithium-intercalated graphite. J. Power Sources 2006, 153, 312–318. [Google Scholar] [CrossRef]
- Chacko, S.; Chung, Y.M. Thermal modelling of Li-ion polymer battery for electric vehicle drive cycles. J. Power Sources 2012, 213, 296–303. [Google Scholar] [CrossRef]
- Bellman, R. Methods on Nonlinear Analysis; Elsevier: Amsterdam, The Netherlands, 1970. [Google Scholar]
- Horn, Q.C.; White, K. Understanding Lithium-Ion Degradation and Failure Mechanisms by Cross-Section Analysis. In Proceedings of the 211th ECS Meeting, Chicago, IL, USA, 6–10 May 2007. Abstract #318.
- Broman, D. Meta-Languages and Semantics for Equation-Based Modeling and Simulation. Ph.D. Thesis, Department of Computer and Information Science, Linköping University, Linköpings, Sweden, 2010. [Google Scholar]
- Fishwick, P.A. Handbook of Dynamic System Modeling; CRC Press: Boca Raton, FL, USA, 2007. [Google Scholar]
© 2014 by the authors; licensee MDPI, Basel, Switzerland. This article is an open access article distributed under the terms and conditions of the Creative Commons Attribution license (http://creativecommons.org/licenses/by/3.0/).
Share and Cite
Uddin, K.; Picarelli, A.; Lyness, C.; Taylor, N.; Marco, J. An Acausal Li-Ion Battery Pack Model for Automotive Applications. Energies 2014, 7, 5675-5700. https://doi.org/10.3390/en7095675
Uddin K, Picarelli A, Lyness C, Taylor N, Marco J. An Acausal Li-Ion Battery Pack Model for Automotive Applications. Energies. 2014; 7(9):5675-5700. https://doi.org/10.3390/en7095675
Chicago/Turabian StyleUddin, Kotub, Alessandro Picarelli, Christopher Lyness, Nigel Taylor, and James Marco. 2014. "An Acausal Li-Ion Battery Pack Model for Automotive Applications" Energies 7, no. 9: 5675-5700. https://doi.org/10.3390/en7095675