Article

Energy Management of a Hybrid-Power Gas Engine-Driven Heat Pump

Air Conditioning and Refrigeration Laboratory, School of Energy and Environment, Southeast University, 2 Sipailou Street, Xuanwu District, Nanjing 210096, China
*
Author to whom correspondence should be addressed.
Energies 2015, 8(10), 11254-11275; https://doi.org/10.3390/en81011254
Submission received: 22 June 2015 / Revised: 5 September 2015 / Accepted: 6 October 2015 / Published: 12 October 2015

Abstract

:
The hybrid-power gas engine-driven heat pump (HPGHP) combines hybrid power technology with a gas engine heat pump. The engine in the power system is capable of operating constantly with high thermal efficiency and low emissions during different operating modes. In this paper, the mathematical models of various components is established, including the engine thermal efficiency map and the motor efficiency map. The comprehensive charging/discharging efficiency model and energy management optimization strategy model which is proposed to maximize the efficiency of instantaneous HPGHP system are established. Then, different charging/discharging torque limits are obtained. Finally, a novel gas engine economical zone control strategy which combined with the SOC of battery in real time is put forward. The main operating parameters of HPGHP system under energy management are simulated by Matlab/Simulink and validated by experimental data, such as engine and motor operating torque, fuel consumption rate and comprehensive efficiency, etc. The results show that during 3600 s’ run-time, the SOC value of battery packs varies between 0.58 and 0.705, the fuel consumption rate reaches minimum values of approximately 291.3 g/(kW h) when the compressor speed is nearly 1550 rpm in mode D, the engine thermal efficiency and comprehensive efficiency reach maximum values of approximately 0.2727 and 0.2648 when the compressor speed is 1575 rpm and 1475 rpm, respectively, in mode D. In general, the motor efficiency can be maintained above 0.85 in either mode.

1. Introduction

Since the beginning of the 21st century, hybrid technology has played an important role in the development of automobile technology [1,2,3,4,5]. Energy and the environment are the main factors driving the world to develop hybrid technology. With the development of society, hybrid technology is not only being applied in the automotive industry, but also applied in the air conditioning equipment industry. Meanwhile, natural gas, which is considered as a clean energy source, will occupy an important part in the energy structure. The development of distributed energy systems based on natural gas will be a major trend in the future, so natural gas as a new energy driving air conditioning equipment will be particularly important. The GHP system is a kind of system which can meet different heating and cooling load demands by changing the operating conditions of the engine [6], however, the engine will depart from the economic zone in the low-load operation region, which leads to a decline in the thermal efficiency. In this paper, the Air Conditioning and Refrigeration Laboratory of Southeast University proposes a kind of hybrid-power gas engine-driven heat pump system, which combines hybrid power technology with a gas engine heat pump [7]. The engine in the power system is capable of operating constantly with high thermal efficiency and low emissions during different operating modes. The engine can remain in the economical zone by rationally allocating the torque, speed and power of both the engine and the motor. Li built a HPGHP experimental bench and proved that the thermal efficiency of the HPGHP system is 27%–37% higher than that of a conventional gas heat pump system [8]. Y. Wang put forward an energy control strategy based on the minimum gas consumption rate [9]. J. Wang carried out a simulation and optimization of a HPGHP system [10].
The HPGHP system, compared with the conventional gas heat pump system, has a high thermal efficiency. However, the determination of economic zone is too fuzzy to describe, in order to substantially improve the thermal efficiency, to operate in the economical zone all the time and to minimize the gas consumption rate and emission levels, a comprehensive charging/discharging efficiency model and an energy management optimization strategy model of HPGHP system is established in this paper. Then, a novel gas engine economical zone control strategy which is combined with the SOC value of battery packs in real time is put forward. Finally, various important energy operating parameters of the HPGHP system, such as engine or motor operating torque, fuel consumption rate and comprehensive efficiency, are investigated and analyzed in the proposed model. The models are simulated by Matlab/Simulink and experimental data are compared with previous papers. The significance of this model will be discussed at the conclusion of this paper.

2. Description of Energy Management on the Coaxial Parallel-Type HPGHP System

Figure 1 shows a diagram of a coaxial parallel-type HPGHP system, which has two power sources: the engine and the motor. Both the engine and motor can run separately or together to drive the heat pump system. The motor, used as a generator or an electric motor, can work together with the engine under different apertures of the throttle, which can adjust the engine real-time speed and torque to maintain the engine running in the economical zone. The MT in Figure 1 is the manual transmission and the transmission ratios in different modes are 2, 1.6, and 3, respectively.
Figure 1. The coaxial parallel-type HPGHP system.
Energies 08 11254 g001
The operating modes of the HPGHP system are divided into five forms: in mode S, the engine drives the motor to charge the battery packs. In mode D, the engine runs in the economical zone that can meet the full load demands of the HPGHP systems and the motor stops running. In mode C, the engine drives the compressor and the generator to generate electricity at the same time. In mode M, the motor drives alone. In mode L, the engine and motor drive together and the engine is running in the economical zone.

3. Model of the HPGHP System

3.1. Model of the Engine

This paper mainly discusses the steady-state performance of the HPGHP system under different compressor loads and focuses on establishing a steady state engine model. According to the multiple linear regression theory [11] and by means of experimental modeling methods, the mathematical models of the engine thermal efficiency is established and shown in Equation (1):
[ η f 1 η f 2 η f N ] = [ 1 ω f 1 T f 1 ω f 1 2 ω f 1 T f 1 T f 1 2 ω f 1 1 ω f 1 l 1 T f 1 T f 1 l 1 ω f 2 T f 2 ω f 2 2 ω f 2 T f 2 T f 2 2 ω f 2 l ω f 2 l 1 T f 2 T f 2 l 1 ω f N T f N ω f N 2 ω f N T f N T f N 2 ω f N l ω f N l 1 T f N T f N l ] × [ a 0 a 1 a k 1 ] + [ e 0 e 1 e N ]
A m = [ 2.244 1.838 × 10 4 0.1524 4.169 × 10 8 2.362 × 10 6 2.709 × 10 3 ]
η f = [ 1 ω f T f ω f 2 ω f T f T f 2 ] A m T
where ai is model coefficient, ei is stochastic error, N is number of test points, Am is the coefficients of the regress equation.
The maximum output power of the engine is 12.5 KW, the maximum torque is 31.9 Nm, the highest thermal efficiency is 0.279 and the rated speed is 2900–3100 rpm. The thermal efficiency map of the engine is shown in Figure 2.
Figure 2. Thermal efficiency map of the engine.
Energies 08 11254 g002

3.2. Model of the Motor [12]

In the HPGHP system, the motor can be used as a generator in charging mode or as an electric motor in discharging mode. The motor modeling is similar to the engine modeling, By means of experimental modeling methods, the motor efficiency curve model is established, as shown in Equations (2) and (3):
η d c = 0.8339 + 5.4802 × 10 5 ω d + 0.0017 T d 7.5051 × 10 9 ω d 2 + 1.2899 × 10 7 ω d T d 2.2202 × 10 5 T d 2
η d f = 0.8351 + 4.1138 × 10 5 ω d 8.8309 × 10 4 T d 5.3335 × 10 9 ω d 2 + 1.922 × 10 7 ω d T d 1.7986 × 10 5 T d 2
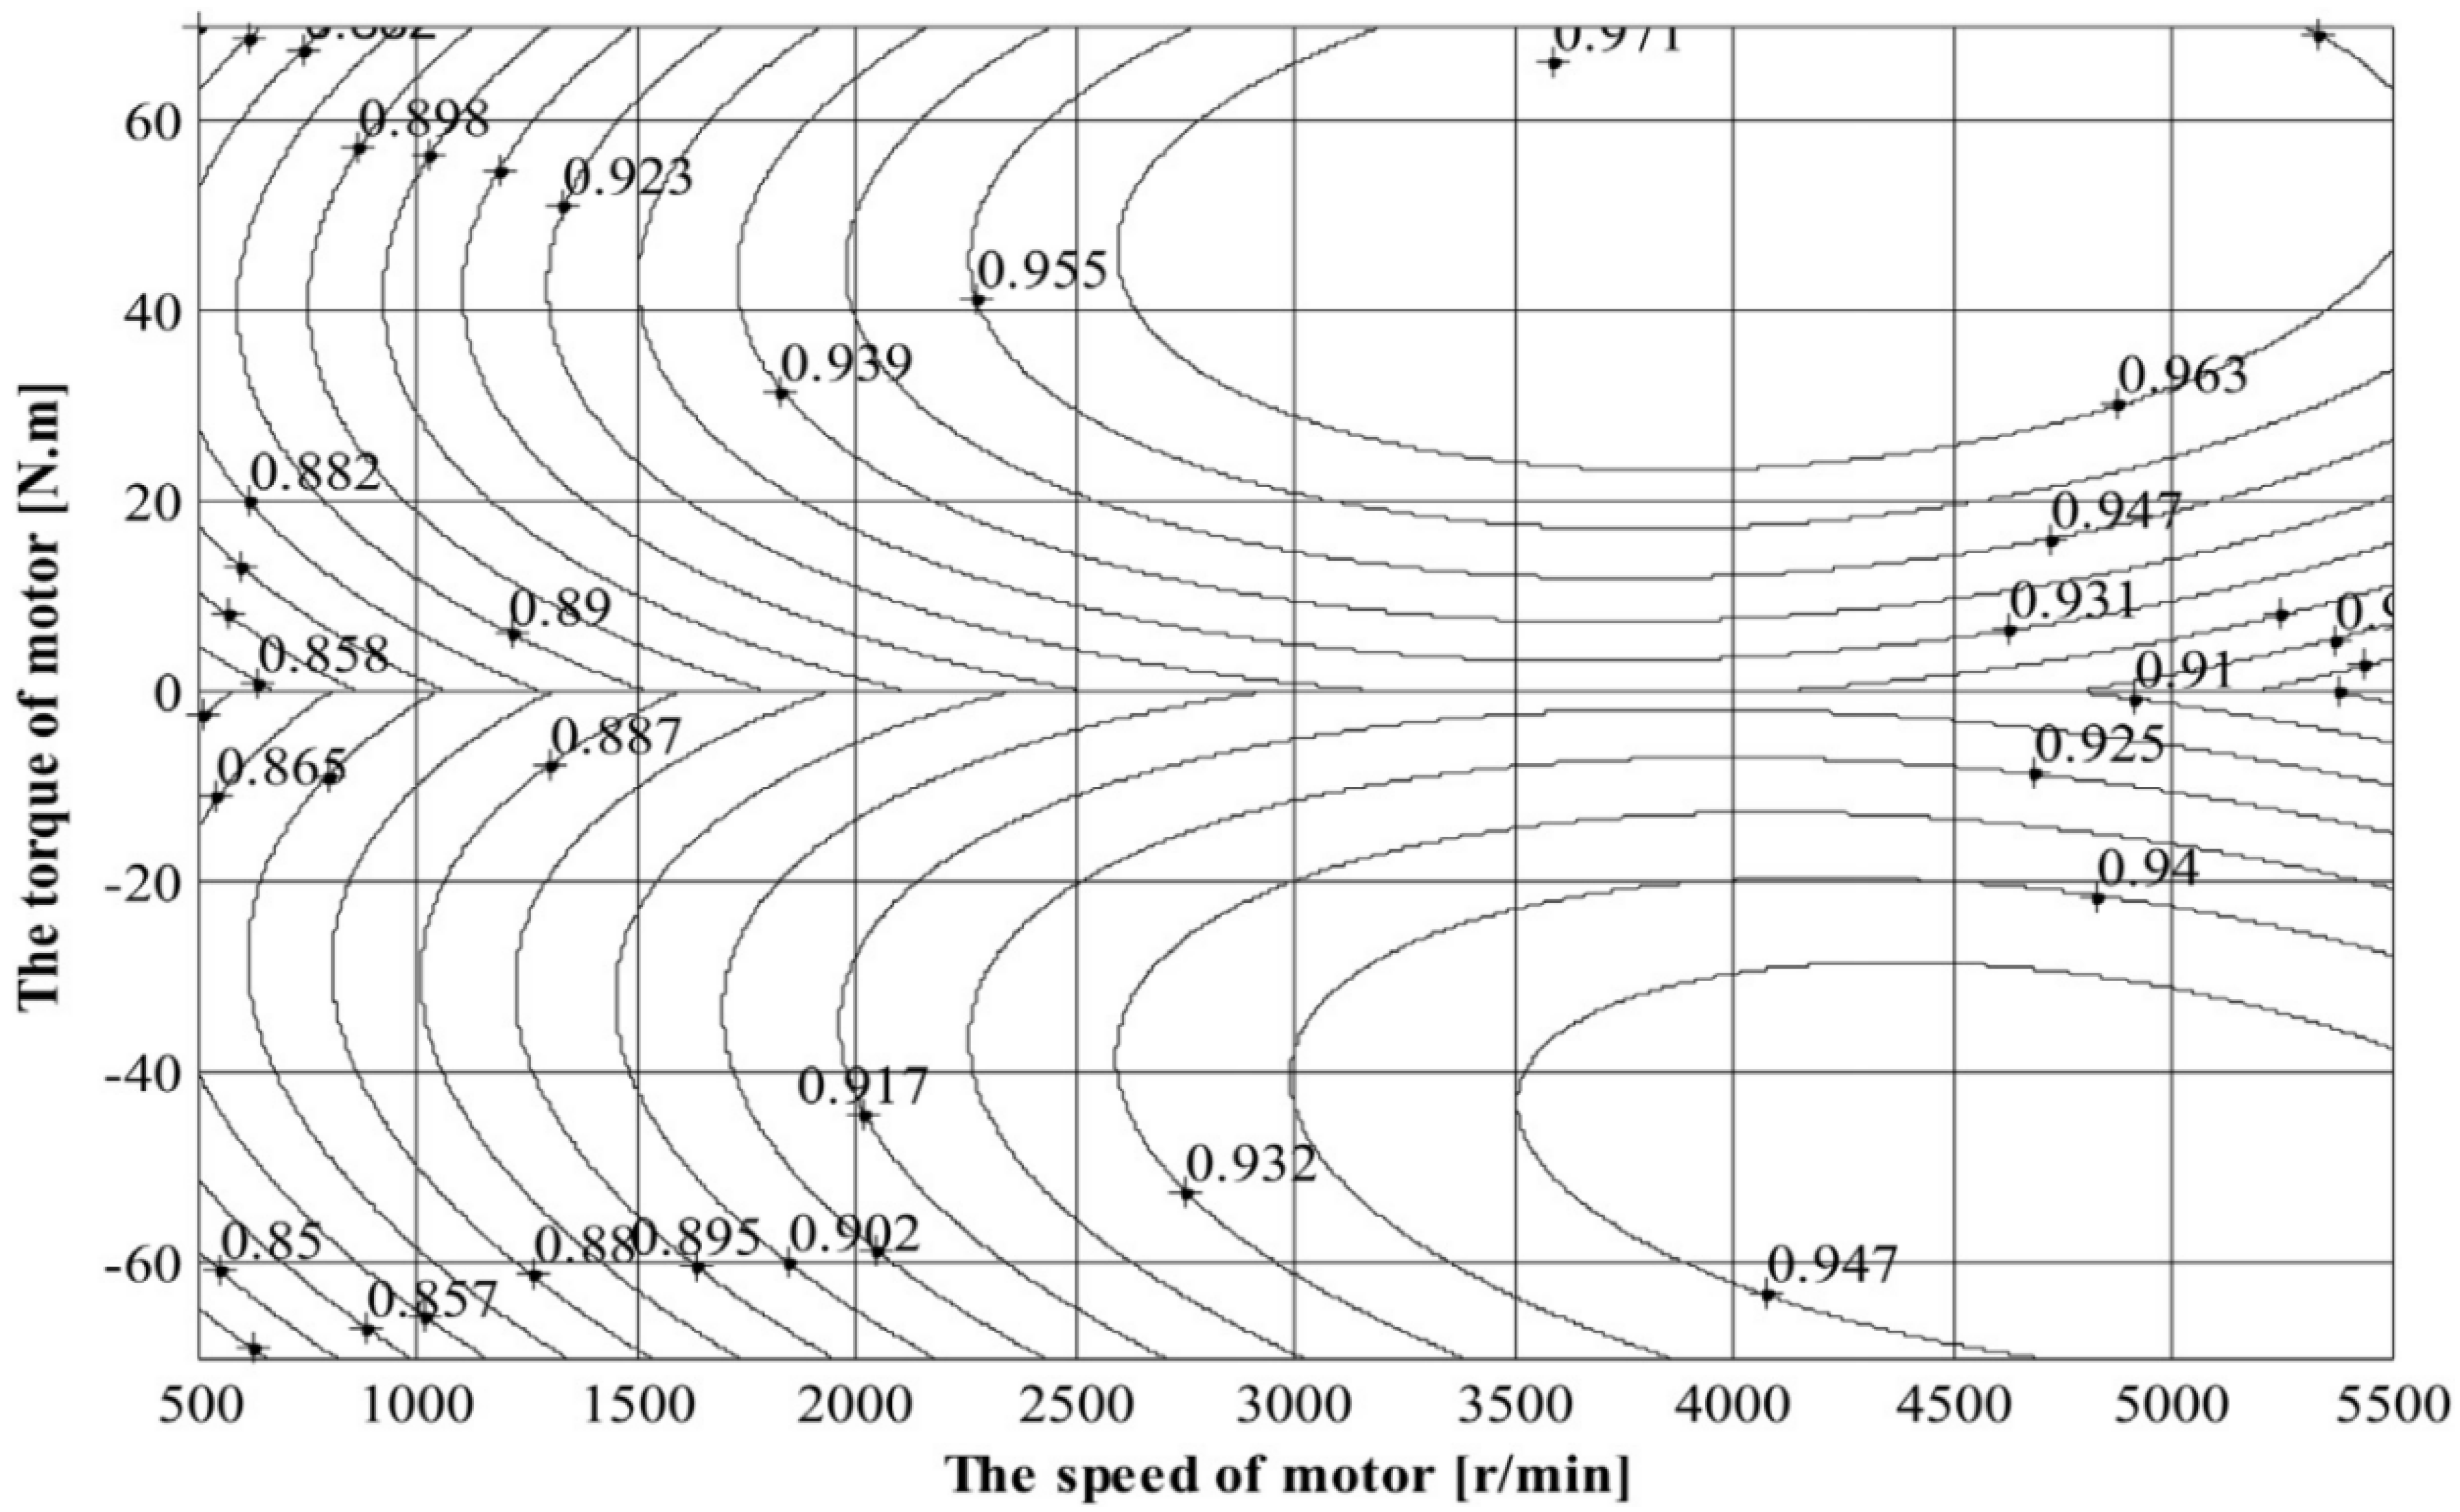
Figure 3 is the efficiency map of the motor. The engine and the motor share a shaft connection and have the same speed when running at the same time. Due to the adoption of multistage transmission ratio, the engine speed can remain in the 2100–3800 rpm range, so the motor efficiency can almost remain above 0.85.
Figure 3. Motor efficiency map.
Energies 08 11254 g003

4. The Energy Management Optimization Strategy of the HPGHP System

4.1. The Comprehensive Efficiency of the HPGHP System

4.1.1. The Comprehensive Efficiency of the HPGHP System under Charging Conditions

When the power load demand of the HPGHP system is lower than the engine operating power in the economical zone or the SOC value of battery packs is less than the set limit, the system enters the charging mode. The engine drives the compressor directly by the gearbox and charges the battery packs using the generator at the same time. Because the power of battery packs comes from the engine bottle, battery packs can be simplified as an equivalent gas bottle [13,14] as shown in Figure 4.
Figure 4. The equivalent model of the HPGHP system in the charging conditions.
Energies 08 11254 g004
The gas output power is shown as Equation (4):
P q = P f η f
The relation between the charging power of battery packs and the input power of the motor is shown in Equation (5). The equivalent input power of battery packs is shown in Equation (6):
P d c = P d η d c η n η d
P q d = P d c η f = P d η d c η n η d η f
The actual output power from the natural gas bottle is equal to the value of the difference between the output power of the natural gas bottle and the power stored in the equivalent gas bottle, as shown in Equation (7):
P = P q P q d = P f η f P d η d c η n η d η f
The comprehensive efficiency of the HPGHP system in the charging conditions is defined as the ratio of the compressor input power and the actual output power which flows from the natural gas bottle to the HPGHP system, as shown in Equation (8):
η z c = P y P = P y P f / η f P d η d c η n η d / η f
The relation between the engine output power, the motor input power and the compressor input power is shown in Equation (9). In addition, the relation between the torque, rotational speed and the power of both the engine and the motor are shown in Equations (10)–(11):
P f P d = P y η b
P f = T f ω f 9550
P d = T d ω d 9550
Then:
η z c = ( T f ω f T d ω d ) η f η b ( T f ω f T d ω d η d c η n η d )
Equation (12) shows that the comprehensive efficiency of the HPGHP system under charging conditions relates to the engine and motor operating points and efficiency, respectively.

4.1.2. The Comprehensive Efficiency of the HPGHP System under Discharging Conditions

As the chemical energy stored in the battery packs comes from the natural gas bottle under discharging conditions, the battery packs can be simplified as an equivalent fuel bottle and the motor can be simplified as an equivalent engine [13,14], as shown in Figure 5.
Figure 5. The equivalent model of the HPGHP system in the discharging conditions.
Energies 08 11254 g005
The discharging power of battery packs is shown in Equation (13):
P d f = P d η d f η d η n
The output power of equivalent gas bottle is shown in Equation (14):
P q d = P d f η d c η d η n η f = P d η d f η d c η d 2 η n 2 η f
The actual output power of gas bottle to the HPGHP system is the sum of the discharging power of battery packs and the output power of equivalent gas bottle, as shown in Equation (15):
P = P q d + P q = P d η d f η d c η d 2 η n 2 η f + P f η f
The comprehensive efficiency of the HPGHP system in the discharging conditions is defined as the ratio of the compressor input power and the actual output power, which flows from the natural gas bottle to the HPGHP system, as shown in Equation (16). In addition, the relation between the engine output power, the motor output power and the compressor input power is shown in Equation (17):
η z f = P y P = P y P d / η d f η d c η d 2 η n 2 η f + P f / η f
P f + P d = P y η b
Then:
η z f = ( T f ω f + T d ω d ) η b η f T d ω d / η d f η d c η d 2 η n 2 + T f ω f
Equation (18) shows that the comprehensive efficiency of the HPGHP system under discharging conditions is related to the engine and the motor operating points and efficiency, respectively.

4.2. The Energy Management Optimization Strategy Model of the HPGHP System [15]

4.2.1. The Energy Management Optimization Strategy Model of the HPGHP System under Charging Conditions

The battery packs should be charged when the SOC value is lower than the set value. The switching conditions and the optimal allocation of the power and torque between engine and motor are respectively determined when the HPGHP system enters charging conditions with the energy management strategy. Because the compressor demand loads and efficiency of battery packs in the charging conditions are different under different SOC values, different strategies should be drawn up under charging conditions.
Based on the above considerations, the energy management optimization model of the HPGHP system under charging conditions is established for different SOC different values. According to the performance characteristics of the experimental Ni-MH-battery, the reasonable range of the SOC value is from 45% to 80%, which can not only ensures battery packs get enough power and satisfies the compressor demand loads, but also prolongs the service life of battery packs.
When the SOC value of battery packs is lower than 0.3, at this moment, the battery packs should be charged to reach a normal level as soon as possible. As the efficiency of battery packs under charging conditions is high and the power-absorbing ability reaches a high level, the maximization of the charging power which the battery packs can absorb, is used as the optimization goal. The optimization objective function is shown by Equation (19):
f ( x ) = min ( 1 | P d | η d c η d η n )
When the SOC value of battery packs ranges from 0.3 to 0.45, the strategy under charging conditions is applied to let the SOC value return to the normal level at this moment. The maximization of the charging power and the efficiency of the whole system under charging conditions are used as a double optimization goal. The optimization objective function is defined as the minimum value of the reciprocal of the product of the charging power and the comprehensive efficiency of the HPGHP system in the charging conditions, as shown in Equation (20):
f ( x ) = min ( 1 | P d | η d c η d η n η z c )
When the SOC value of battery packs ranges from 0.45 to 0.8, the battery packs have an average charging efficiency and power-absorbing ability at that moment. The maximization of the comprehensive efficiency is considered to be the optimization goal. The minimization of the reciprocal of the comprehensive efficiency is considered to be the optimization objective function, as shown in Equation (21):
f ( x ) = min ( 1 η z c )
When the SOC value is higher than 0.8, the efficiency and the power-absorbing ability of battery packs under charging conditions are lower at this moment, so the battery packs are not allowed to charge.

4.2.2. The Energy Management Optimization Strategy Model of the HPGHP System under Discharging Conditions

The goal of energy management strategy under discharging conditions is that the operation zones of the engine, the motor and the battery packs can match well to minimize the instantaneous power loss, so the maximization of comprehensive efficiency can be used as the optimization goal, as shown in Equation (22):
f ( x ) = min ( 1 η z f )
when the SOC value is lower than 0.3, the battery packs are not allowed to discharge at this moment.

4.3. The Results of Energy Management Strategy

When the HPGHP system is operating under stable manual transmission, the engine speed corresponds to the compressor speed. The issue of energy management strategy can be simplified as the optimization of both the engine and the motor target torque under different SOC values, different required power values and different engine speeds, respectively.

4.3.1. The Energy Management Optimization Strategy of the HPGHP System under Charging Conditions

The engine torque is used as the variable (X = Tf), and can be obtained from Equation (9), as shown in Equation (23):
T d = X P y ω η b
The reciprocal of charging power which the battery packs can absorb is used as the objective function, which is obtained from Equations (12) and (19), as shown in Equation (24):
when   SOC 0.3 ,   f ( x ) = min ( 1 | P d | η d c η d η n ) = min ( 9550 | T d | ω η d c η d η n )
The reciprocal of the product of the charging power and comprehensive efficiency under charging conditions is used as the objective function, which is obtained from Equations (12) and (20), as shown in Equation (25):
when   0.3 < SOC 0.45 ,   f ( x ) = min ( 1 | P d | η d c η d η n η z c ) = min ( x ω T d ω η d c η d η n | T d | ω P y η d c η d η n η f )
The reciprocal of comprehensive efficiency in the charging conditions is used as the objective function, which is obtained from Equations (12) and (21), as shown in Equation (26):
when   0.45 < SOC 0.8 ,   f ( x ) = min ( 1 η z c ) = min ( x ω 9550 P y η f T d ω η d c η n η d 9550 P y η f )
The ranges of engine torque, motor torque, engine power and motor power are constrained as follows [15]:
G1(x) = −x ≤ 0
G2(x) = x/Tfmax − 1 ≤ 0
G3(x) = |Td|/|Tdmin| − 1 ≥ 0
when:
ω < ωdbase, G4(x) = |Td|/|Tdmax| − 1 ≤ 0
when:
ω ≥ ωdbase, G4(x) = |Td|ω/(9550|Pda|) − 1 ≤ 0
where Tfmax is the maximum engine torque when the engine speed is ω, N.m. Tdmin is the minimum allowed motor torque, N.m. Tdmax is the maximum motor torque when the motor is operating continuously, N.m. Pda is the actual maximum motor power when the SOC value is specific value. ωdbase is the basic motor speed when the SOC value is specific value, rad/s. This is expressed as follows:
Pda = Pbmaxdηn
ωdbase = 9550Pda/Tdmax
where Pbmax, which is measured by the performance tests of battery packs, is the continuous maximum charging power of battery packs and is the function of the SOC value.
The above nonlinear constraint optimization issues are solved by current sequential quadratic programming. which can use Newton’s method to solve unconstrained optimization problems and constrained optimization problems, In each iteration, convergence can be guaranteed by using the quasi-Newton method of the Hessian matrix, which is composed with the Langrange function. Finally, the unconstrained optimization issue is converted into a quadratic programming sub-problem. The issue is solved by MATLAB programming in this paper. The detailed parameters involved in the energy conversion process are shown in Table 1.
Table 1. The detail parameters of energy conversion process.
Parameter η b η n η dc η df
Value range0.8–0.950.9–0.980.8–0.90.75–0.92
Selected value0.90.920.850.9
The distribution of the engine torque and motor torque are optimized, respectively, under different values of SOC, different engine speeds and different required powers. When the SOC value is at 45% with different engine speed, comparing the comprehensive efficiency with the normal efficiency, which is only driven by the engine in the charging conditions, the optimized comprehensive efficiency of the HPGHP system in the charging conditions is higher under low and medium demand loads, but becomes lower when the required power increases to a certain value. Hence, in order to improve the comprehensive efficiency of the HPGHP system, the charging conditions limits should be established. Meanwhile, the battery packs should be charged only when the required power is less than the charging power limit. As shown in Figure 6, the curve C0 represents the normal efficiency with the engine speed of 3200 rpm and the value is the product of the engine thermal efficiency and the engine transmission efficiency.
Figure 6. The relation between engine speed and discharging/charging torque.
Energies 08 11254 g006
The curves C1 and C2 respectively represent the optimized comprehensive efficiency of the system under 60% of SOC value and 45% of SOC value when engine speed is 3200 rpm. The intersection of curve C0 and curve C2 represents the charging power limit with 45% of SOC and the value is 6.457 kW. When the required power is higher than 6.457 kW, the comprehensive efficiency is less than the normal efficiency, so when the SOC value is 45%, the required power should be less than 6.457 KW at the engine speed of 3200 rpm. After the energy management optimization strategy is applied under charging conditions, the charging power under different engine speeds will transform into the engine torque, which is also called charging torque limits.
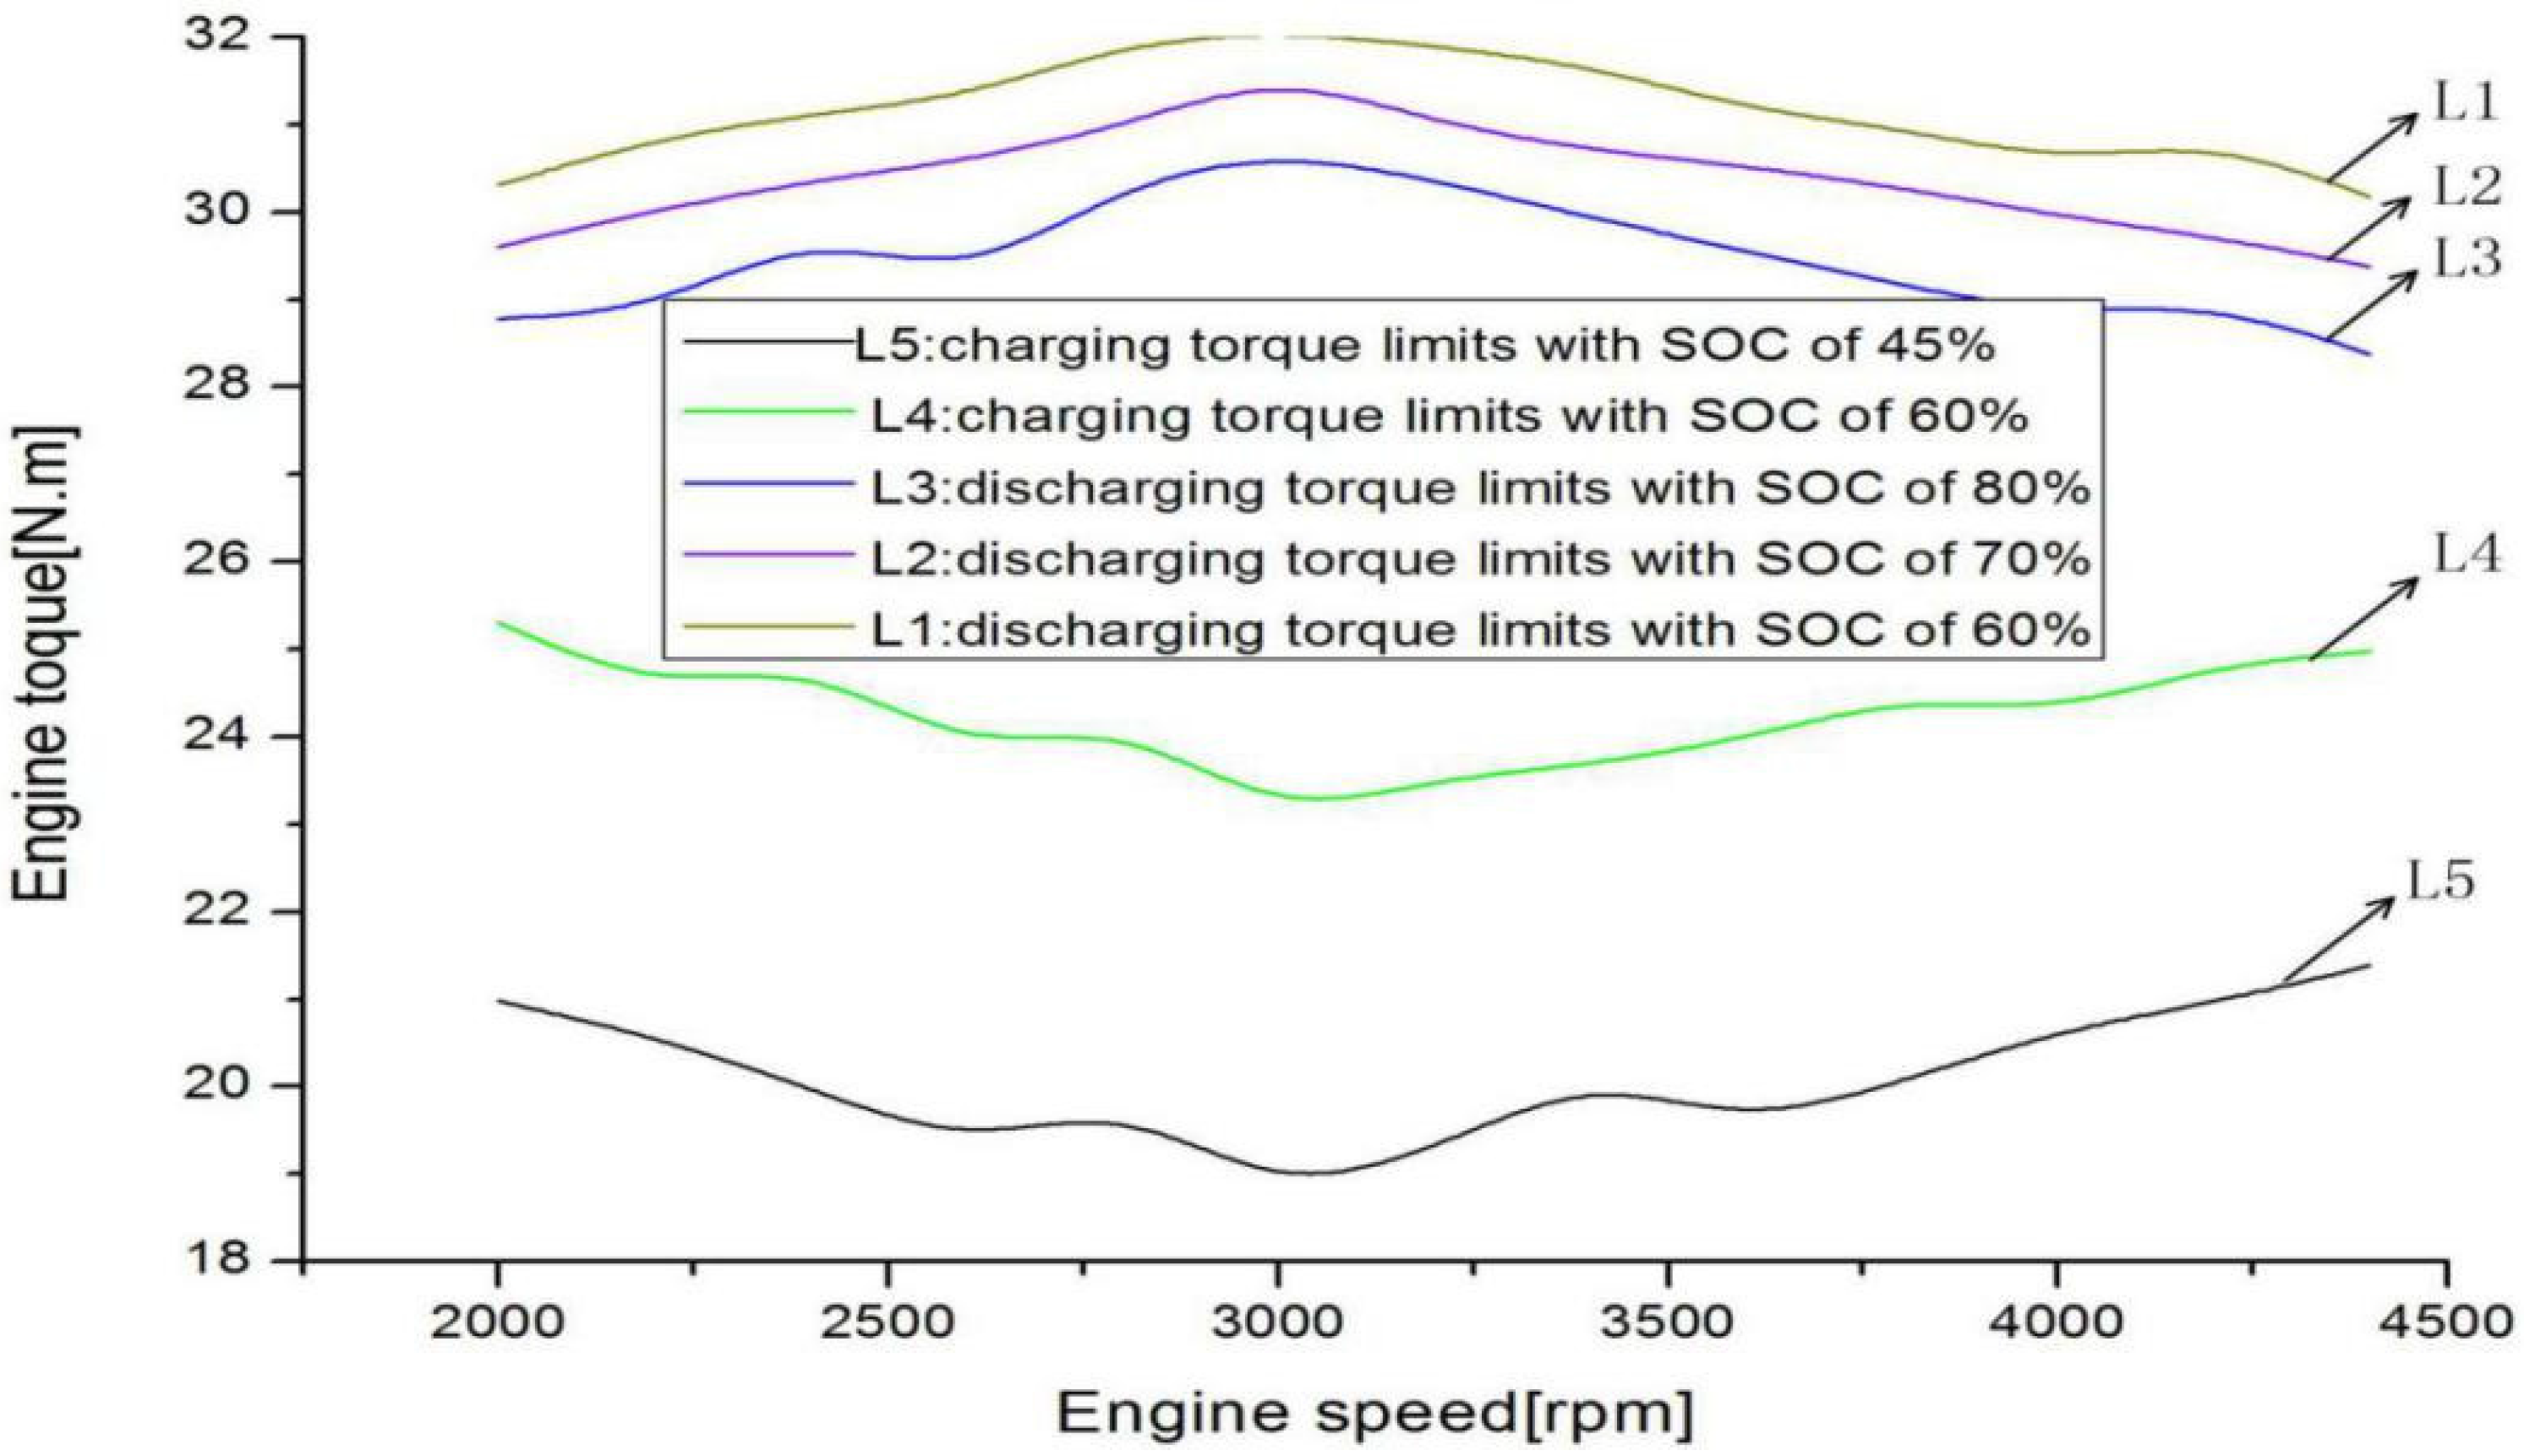
In Figure 7, L4 and L5 respectively represent the charging torque limits under 60% of SOC value and 50% of SOC value. Because the optimization objective functions are different under different SOC values, the value of L5 is lower than the value of L4. In order to ensure that SOC recovers from low levels to a normal level quickly, the charging torque limits are not allowed to increase when the SOC value is less than 45%.
Figure 7. The relation between required power and comprehensive efficiency.
Energies 08 11254 g007

4.3.2. The Energy Management Optimization Strategy of the HPGHP System under Discharging Conditions

The engine torque is used as the variable, which is expressed as follows: x = T f ; when x > 0, the motor torque can be obtained from Equation (9) and is expressed as follows: T d = 9550 P y / η b w x ; when x = 0, the motor torque can be obtained from Equation (9) and is expressed as follows: T d = 9550 P y / η b w + T y .
Using Equation (22), the optimization objective function is the reciprocal of the comprehensive efficiency under discharging conditions, which is expressed as follows:
min f ( x ) = min ( 1 η z f ) = min { x ω 9550 P y η f + T d ω 9550 P y η d f η n 2 η d 2 η d c η f }
The range of engine torque, motor torque, engine power and motor power are constrained as follows [15]:
G1(x) = −x ≤ 0
G2(x) = x/Tfmax − 1 ≤ 0
when:
x ≤ 0, G3(x) = TyTd≤0
when:
x ≥ 0, G3(x) = −Td ≤ 0
when:
ω < ωmbase, G4(x) = Td/Tdmax − 1 ≤ 0
when:
ω ≥ ωmbase, G4(x) = Tdω/(9550Pma) − 1 ≤ 0
where Tfmax is the maximum engine torque when the engine speed is ω, N.m. Pma is the actual maximum motor power when the SOC value is specific value and Pma is obtained from the maximum power which the battery can discharge continuously, KW. ωmbase is the basic motor speed when the value of SOC is a specific value, rad/s. and is obtained from Pda and the maximum motor torque, which is also the function of SOC expressed as follows:
P m a ( ω ) = P b max η d
where Pbmax, which is measured by the performance tests of battery packs, is the continuous maximum discharging power of battery packs and is the function of SOC, expressed as follows:
ω m b a s e = 9550 P m a / T m max
The beginning of the motor assistance torque differs other under different engine speeds. Based on the optimization results, the values of the beginning of motor assistance are obtained when SOC is at 60%, 70% and 80%, respectively. As shown in Figure 7, the lower the SOC value is, the higher the discharging torque limit is. The motor assists only when the required torque or required power get higher.

5. Control Strategy

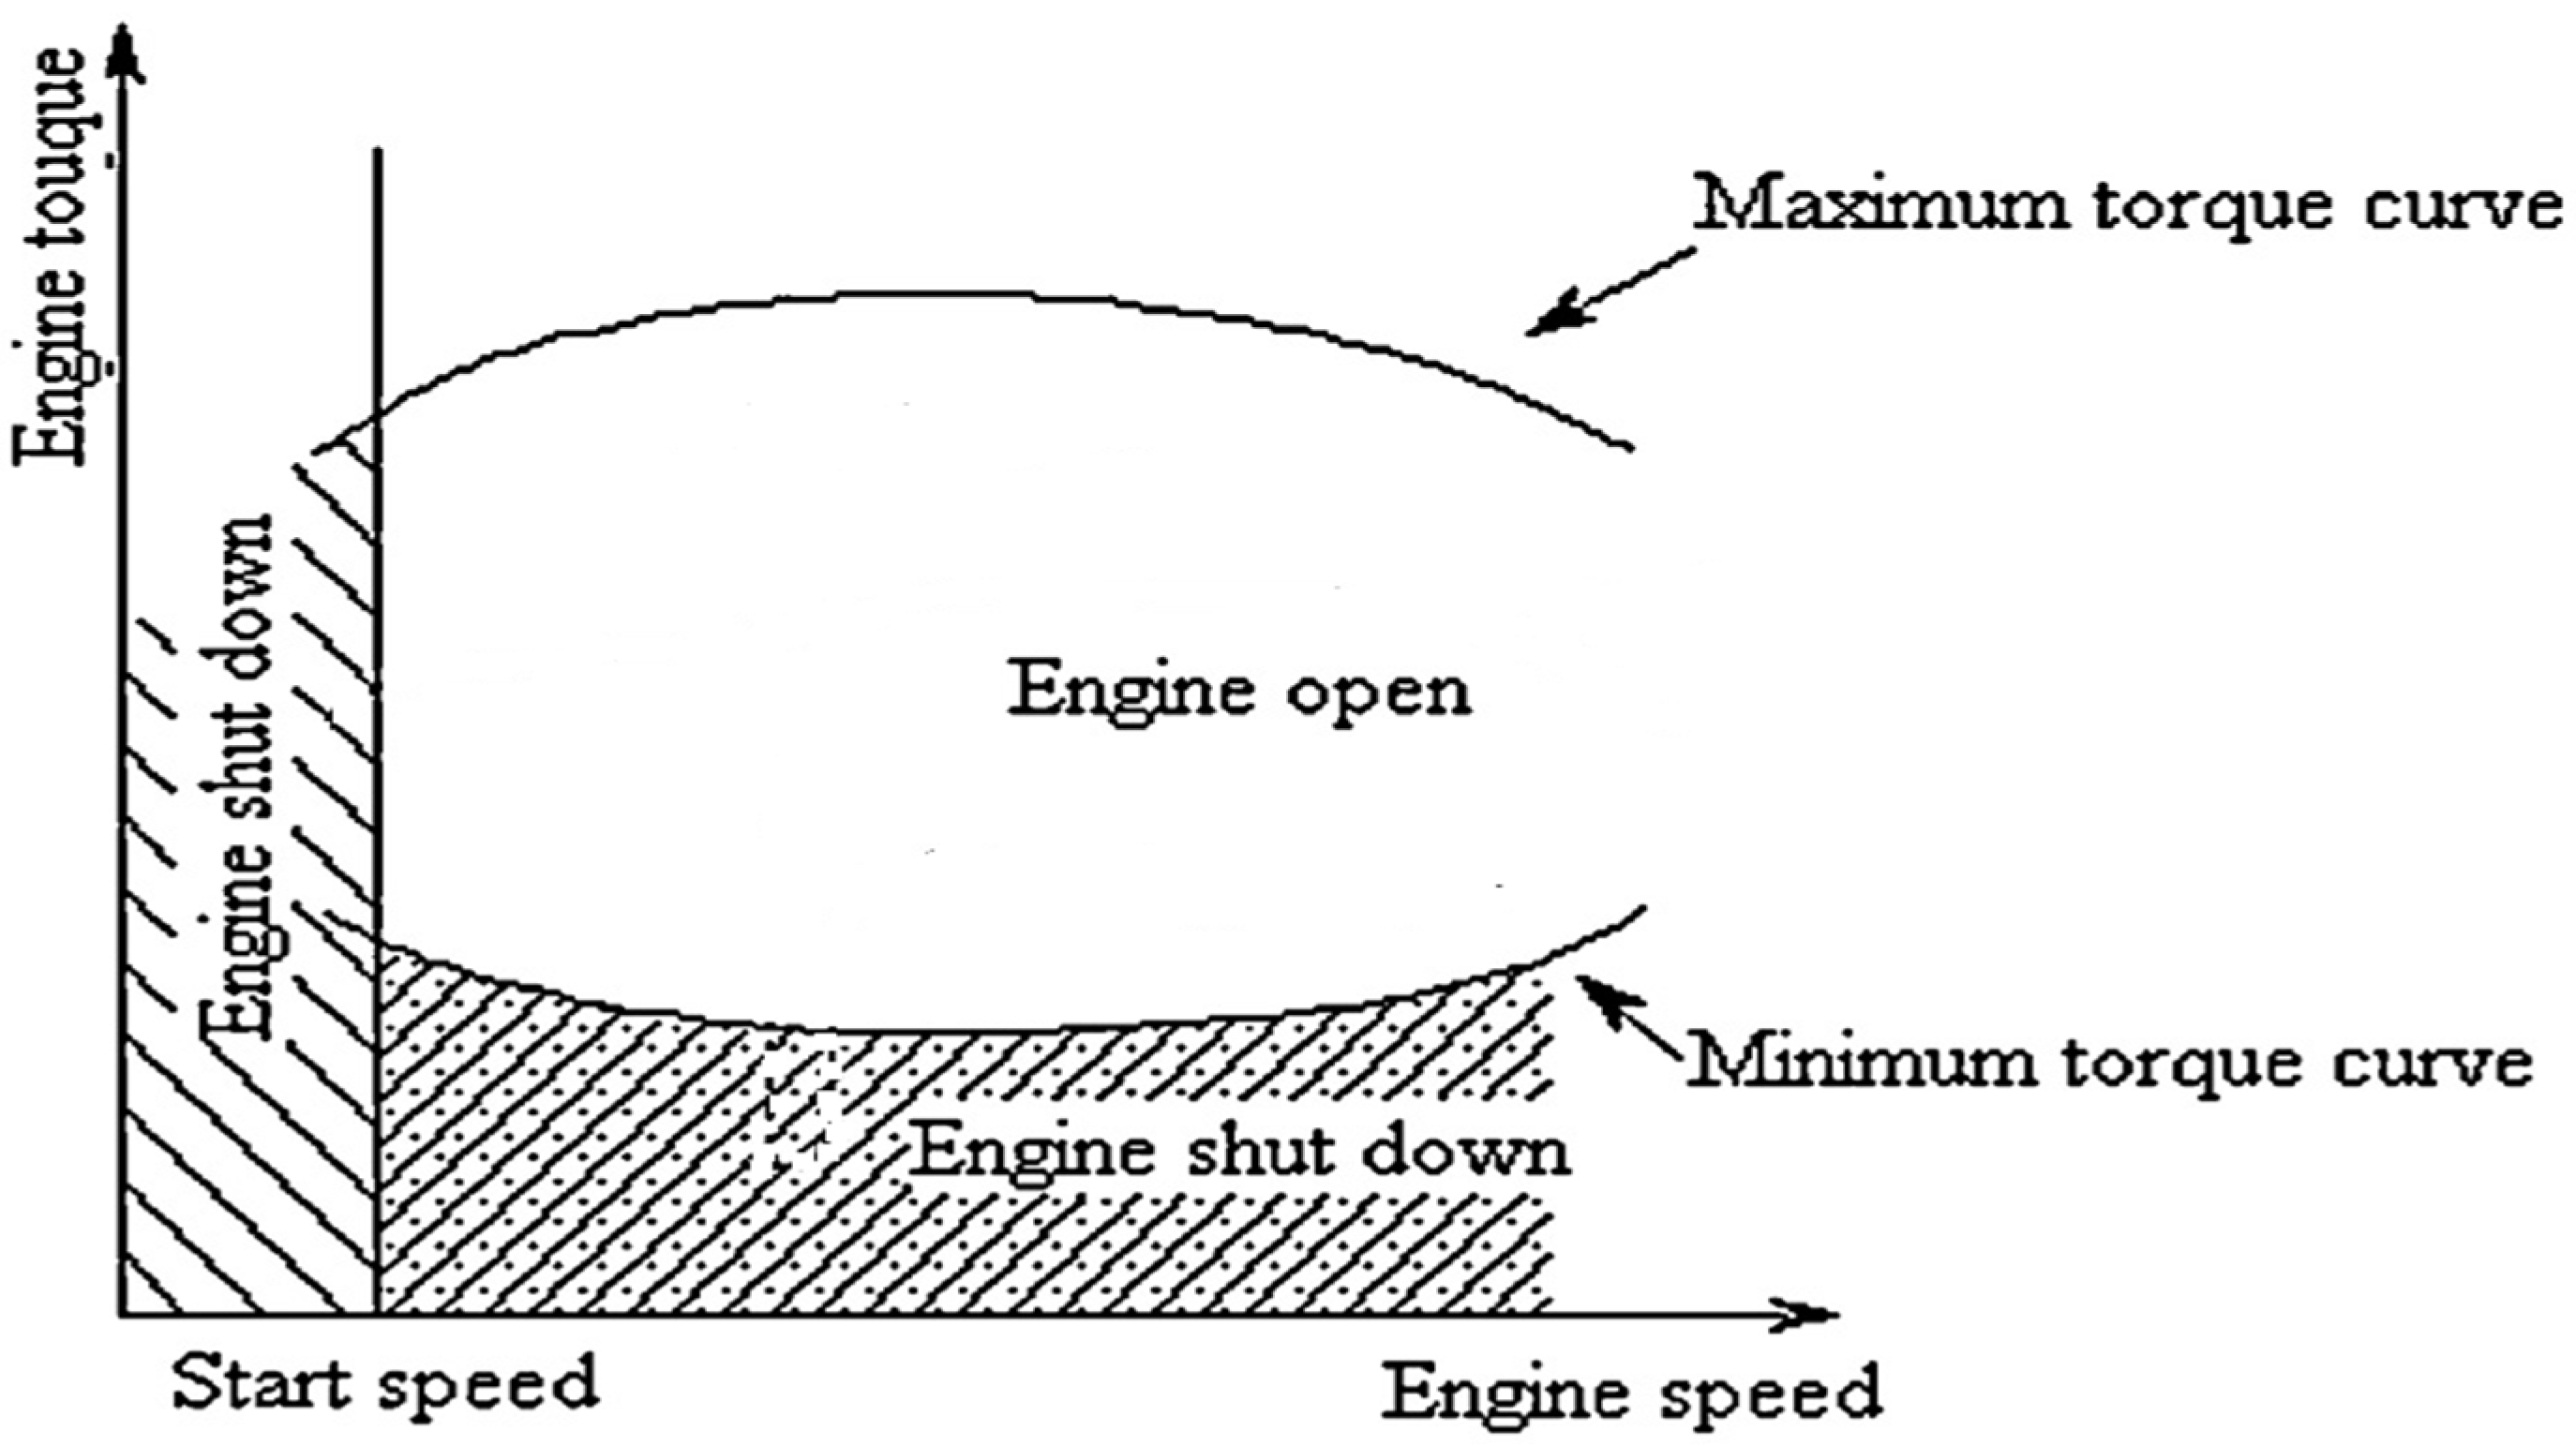
Aiming at achieving the maximum comprehensive efficiency, a novel gas engine economical zone control strategy which is combined with the SOC value of battery packs in real time is put forward. The multi-stage gear transmission ratios are set up under different compressor speed ranges. The transmission ratios is respectively 3.0, 2.0 and 1.6 when the compressor speed is in 750–1150 rpm, 1150–1900 rpm and 1900–2400 rpm. Compared with the control strategy described in Wang et al. [9], which keeps the engine running in the economical zone by two simple charging and discharging torque limit curves, as shown in Figure 8, the engine economical zone control strategy can make sure the engine operates in the best economic zone.
Figure 8. Optimal control strategy of the gas engine.
Energies 08 11254 g008
The principle of the novel gas engine economic zone control strategy is shown in Figure 6 and Figure 9 and Table 2. The input parameter is the compressor demanded torque, T. When the SOC is less than the minimum discharge value SOCmin, HPGHP operates in mode S and the engine drives the motor to charge the battery packs. When the SOC is more than the maximum discharge value SOCmax, or the engine speed is not in the economical zone, HPGHP operates in mode M and the compressor is driven by the motor alone. When the SOC is within the specified interval (SOCmin, SOCmax) and the engine speed is in the economical zone, the operating modes of HPGHP are determined by the demanded torque, T. If the demanded torque is higher than the discharging torque limit, the HPGHP operates in mode L, then the engine and motor drive together and the engine operates in the economical zone. If the demanded torque is lower than the charging torque limit, the HPGHP operates in mode C, the engine drives the compressor and the generator to generate electricity. If the demand torque is between the charging torque limit and the discharging torque limit, the HPGHP operates in mode D, the engine operates in the economical zone that can meet full load of the HPGHP system and the motor stops operating.
Table 2. The principle of the novel gas engine economic zone control strategy.
Operation ModeBoundary Conditions
mode Dωlow < ω < ωhigh and Tlow < T < Thigh
mode Cωlow < ω < ωhigh and T < Tlow and SOC < SOChigh
mode Lωlow < ω < ωhigh and Thigh < T and SOC > SOClow
mode Mω > ωhigh or ω < ωlow and SOC > SOClow
mode SSOC < SOClow
Figure 9. The novel engine economical zone control strategy.
Energies 08 11254 g009

6. Simulation and Experimental Comparison

To evaluate the effectiveness of the proposed models, a steady-state model of the HPGHP system is established by Matlab/Simulink, and as shown in Figure 10, the gas engine economical zone control strategy, which is combined with the SOC value in real time, is implemented. Different components are coupled to each other by operating parameters. The input parameters are compressor speed and power, which correspond to the heating load. The heat pump module can generate the compressor power and the compressor torque. Based on the compressor required torque and the SOC value, the energy management strategy coordinates the distribution of power between the engine and battery packs. Then the motor power and efficiency are obtained by the motor module, the change of SOC value can be simulated and the engine thermal efficiency is obtained by the engine module, and finally the fuel consumption and comprehensive efficiency of the HPGHP system can be obtained.
In the simulation process, the input compressor speed corresponds to the engine speed, as shown in Figure 11 and Figure 12. During 3600 s of run-time, the compressor speed increases linearly from 700 to 2500 rpm and the engine speed ranges from 2000 rpm to 4000 rpm. The experimental parameters of the system are as follows: the outdoor dry bulb temperature is 7 °C, the condensation temperature is 46 °C and the evaporating temperature is −5 °C. The initial SOC value is set to 0.65 in this paper, for the convenience of calculation, the charging/discharging torque are a function of both the engine speed and SOC value. which is shown as T = f(SOC, ωf). As the SOC value is around 0.6, the charging torque and discharging torque are fitted by the value of simulation, as is shown as Equations (27) and (28). The selection of the motor charging or discharging torque can meet the engine economic zone and take as big a value as possible in this paper.
T = 21.51 + 1.26 SOC + 0.00778 ω f 6.333 SOC 2 0.000264 × SOC × ω f 0.000001228 ω f 2
T = 2.535 × 10 13 0.006432 ω f + 9.857 × 10 13 SOC + 1.19 × 10 6 ω f 2 0.002007 × SOC × ω f 9.388 × 10 13 SOC 2
Figure 10. The model of the HPGHP system based on Matlab/Simulink.
Energies 08 11254 g010
Figure 11. The relation between the compressor speed and time.
Energies 08 11254 g011
This paper discusses the relation between the compressor speed and main energy management operating parameters under the novel control strategy, such as operating engine and motor torque, fuel consumption, engine thermal efficiency, etc. Applying the novel gas engine economical zone control strategy, the distribution of power between gas engine and battery packs is analyzed under the given compressor power. Finally, the comprehensive efficiency of the HPGHP system is researched.
Figure 12. The relation between the engine speed and time.
Energies 08 11254 g012
Figure 13 is the simulation curve of the SOC value and Figure 14 is the simulation curve of both the engine and the motor torque under different modes. When the compressor speed ranges in 750–1150 rpm, because the compressor power demand is low and the HPGHP systems operates in mode C, the engine torque remains around 31 Nm, the motor charging torque ranges from −12.5 to −10 Nm and the SOC value gradually increases to 0.705 from the initial value of 0.65. When the compressor speed range is 1150–1900 rpm, because the compressor demand power is medium and the motor stops operating at this moment, the engine torque remains around 31 Nm, the discharging motor torque remains around 0 Nm and the SOC value decreases by about 0.07, the HPGHP systems can be considered to operate approximately in mode D. When the compressor speed is between 1900 and 2400 rpm, because the compressor demand power is high and the HPGHP systems operates in mode L, the motor discharging torque and the engine torque remain around 11 Nm and 31 Nm, respectively, and the SOC value is reduced from 0.7 to 0.58.
Figure 13. The relation between the SOC of battery packs and time.
Energies 08 11254 g013
Figure 14. The relation between the torque and time.
Energies 08 11254 g014
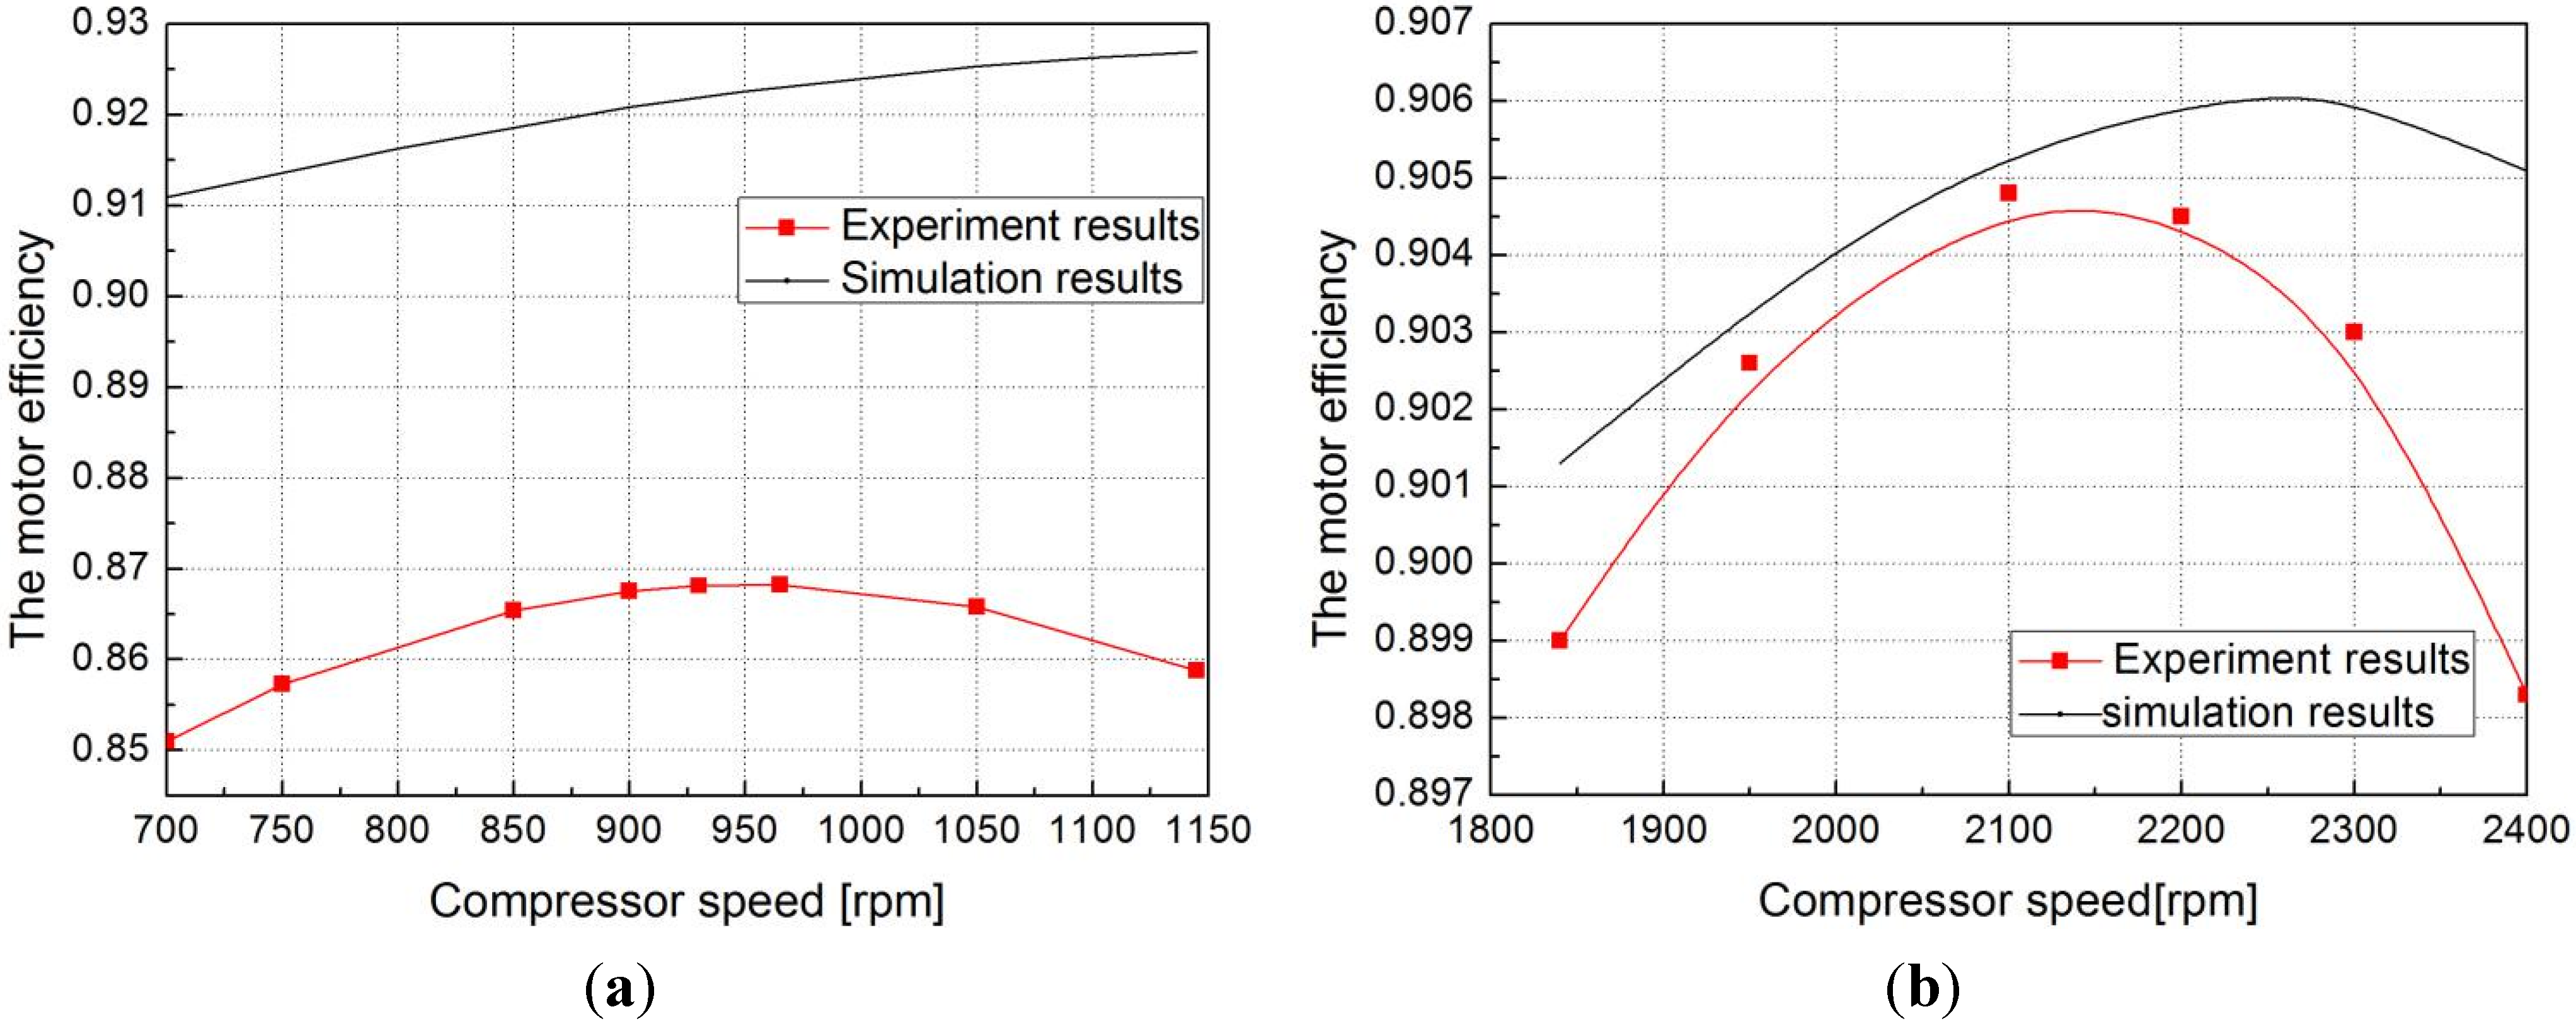
Figure 15 presents the simulation curves of motor efficiency for different modes. The motor efficiency of simulation and experiment results reaches a maximum value of approximately 0.930 and 0.868 when the compressor speed is 1150 rpm and 950 rpm in mode C, respectively. The maximum difference between the simulation and experimental data is 6.2%. In addition, the motor efficiency of the simulation and experimental results reaches a maximum value of approximately 0.906 and 0.9048 when the compressor speed is 2100 rpm and 2280 rpm in mode L, respectively. The maximum difference between the simulation and experimental data is 0.7%. The motor stops operating in mode D.
Figure 15. The relation between the motor efficiency and compressor speed in different modes. (a) In mode C; (b) In mode L.
Energies 08 11254 g015
Figure 16 and Figure 17 present the simulation curves of engine thermal efficiency and comprehensive efficiency for different modes. The engine thermal efficiency and comprehensive efficiency firstly increase to a maximum value and then decrease with compressor speed, respectively, in different modes. According to the simulation results, the engine thermal efficiency and comprehensive efficiency reach a maximum value of approximately 0.2723/0.2581 when the compressor speed is 1025 rpm/1075 rpm, respectively, in mode C. The engine thermal efficiency and comprehensive efficiency reach a maximum value of approximately 0.2727/0.2648 when the compressor speed is 1575 rpm/1475 rpm, respectively in mode D. The engine thermal efficiency and comprehensive efficiency reach a maximum value of approximately 0.2708/0.2600 when the compressor speed is 2000 rpm/1950 rpm, respectively, in mode L. Overall, the engine thermal efficiency and comprehensive efficiency of the HPGHP system ranges respectively from 0.2400–0.2750, 0.2300–0.2700. Because the instantaneous change of SOC values corresponds to the charging/discharging torque in the simulation, and the SOC ranges of the interval (every 10% ranges) corresponds to the charging/discharging torque in the experiment, the experimental data and simulation value are different. In addition, the engine runs in the economic zone that can meet the full load demands of the HPGHP systems and the motor and battery packs stop running in mode D, so the simulation and experimental data of the comprehensive efficiency is close. Overall, the maximum difference between simulation and experiment data of the engine thermal efficiency and comprehensive efficiency is 0.9% and 1.2%.
Figure 16. The relation between the engine thermal efficiency and compressor speed.
Energies 08 11254 g016
Figure 17. The relation between the comprehensive efficiency and time.
Energies 08 11254 g017
Figure 18 shows the simulation and experimental fuel consumption rate curves. With the increase of compressor speed, the HPGHP systems operates in different modes, and the fuel consumption rate firstly decreases to a minimum value and then increases with compressor speed in different modes. According to the simulation results, the fuel consumption rate reaches a minimum value of approximately 292.5 g/(kW·h), 291.3 g/(kW·h), 294.7 g/(kW·h) when the compressor speed is 1075 rpm in mode C, 1550 rpm in mode D, 1950 rpm in mode L, respectively. In general, the fuel consumption rate range is 291–330 g/(kW·h). Because the fuel consumption rate is associated with the engine thermal efficiency, the maximum difference between the simulation and experimental fuel consumption rate data is 3.3%. Due to the novel gas engine economical zone control strategy, the experimental fuel consumption rate data is lower than analyzed in Wang et al. [9] in mode C and L, as the engine operates alone in mode D, the different between the experimental fuel consumption rate data and that analyzed in Wang et al. [9] is not great. In general, the experiment data of fuel consumption rate is about 1.6% less than that analyzed in Wang et al. [9].
Figure 18. The relation between the fuel-consumed rate and compressor speed.
Energies 08 11254 g018

7. Conclusions

(1)
A comprehensive charging/discharging efficiency model and the energy management optimization strategy model is established. The results show that the comprehensive charging efficiency of the HPGHP system under charging/discharging conditions relates to the operating points, the engine and motor efficiency, respectively.
(2)
Different charging/discharging torque limits are obtained. The results show that the battery packs should be charged only when the required power is less than the charging power limit. In addition, the discharging torque limits become higher and the charging torque limits become lower when the SOC value becomes lower. The motor starts running only when the demand torque or power becomes larger at this moment.
(3)
In the HPGHP system operation process, during 3600 s of run-time, the SOC value of battery packs ranges between 0.58 and 0.705, the fuel consumption rate reaches a minimum value of approximately 291.3 g/(kW h) when the compressor speed is 1550 rpm in mode D and ranges between 291–330 g/(kW h), the engine thermal efficiency and comprehensive efficiency reach a maximum value of approximately 0.2727/0.2648 when the compressor speed is 1575 rpm/1475 rpm in mode D, respectively and ranges between 0.2400 and 0.2750, 0.2300 and 0.2700, respectively. In general, the fuel consumption rate reach a minimum value of approximately 291.3 g/(kW h) when the compressor speed is nearly 1550 rpm in mode D, the engine thermal efficiency and comprehensive efficiency reach maximum values of approximately 0.2727/0.2648 when the compressor speed is 1575 rpm/1475 rpm, respectively, in mode D. In addition, the motor efficiency can be maintained above 0.85 in either mode. Finally, because of the application of the gas engine economical zone control strategy to the HPGHP system, the fuel consumption rate is about 1.6% less than that analyzed in Wang et al. [9].

Acknowledgments

This study was jointly funded by the 12th Five Year National Science and Technology Support Key Project of China (No. 2011BAJ03B14). Project 51176029 supported by Natural Foundation of China and Project BK2010029 supported by Jiangsu Natural Science Foundation of China.

Author Contributions

Qingkun Meng, Liang Cai and Xiaosong Zhang designed the research; Qingkun Meng, Wenxiu Ji and Tao Zhang performed the research; Qingkun Meng, Wenxiu Ji and Jie Yan wrote the paper. All authors read and approved the final manuscript.

Conflicts of Interest

The authors declare no conflict of interest.

Nomenclature

ηf
the thermal efficiency of the gas engine
Tf
the torque of the gas engine (Nm)
ωf
the speed of the gas engine (rpm)
Td
the torque of the motor (Nm)
ωd
the speed of the motor (rpm)
ηd
the thermal efficiency of the motor
ηdc
the motor charging efficiency
ηdf
the motor discharging efficiency
ηb
transmission efficiency (%)
ηn
inverter efficiency (%)
η ¯
average comprehensive efficiency (%)
Pq
gas output power (KW)
Pf
the output power of the engine (KW)
Pdc
the battery charging power (KW)
Pd
the motor input power (KW)
Pdf
the battery discharging power (KW)
Pd
the motor output power (KW)
ω
the speed of the compressor (rpm)
Py
input power of the compressor (KW)
Pqd
gas bottle equivalent input power of the battery (KW)

Subscripts

y
the compressor
dc
the condition of charging
df
the condition of discharging
f
the engine
d
the motor
max
the maximum value
min
the minimum value
η
efficiency (%)
T
the torque (Nm)
ω
the speed (rpm)

Abbreviations

COP
coefficient of performance
GHP
gas engine heat pump
HPGHP
hybrid-power gas engine heat pump
SOC
the state of charge

References

  1. Tyrus, J.M.; Long, R.M.; Kramskaya, M. Hybrid electric sport utility vehicles. IEEE Trans. Veh. Technol. 2004, 53, 1607–1622. [Google Scholar] [CrossRef]
  2. Huang, J.Y.; Gonzalez, L.F. On parallel hybrid-electric propulsion system for unmanned aerial vehicles. Prog. Aerosp. Sci. 2012, 51, 1–17. [Google Scholar] [CrossRef] [Green Version]
  3. Huang, K.D.; Tzeng, S.C. A new parallel-type hybrid electric-vehicle. J. Appl. Energy 2004, 79, 51–64. [Google Scholar] [CrossRef]
  4. Juang, Y.S.; Lin, S.S.; Kao, H.P. A knowledge management system for series-parallel availability optimization and design. J. Expert Syst. Appl. 2008, 34, 181–193. [Google Scholar] [CrossRef]
  5. Borba, B.S.M.C.; Szklo, A.; Schaeffer, R. Plug-in hybrid electric vehicles as a way to maximize the integration of variable renewable energy in power systems: The case of wind generation in northeastern Brazil. Energy 2012, 37, 469–481. [Google Scholar] [CrossRef]
  6. Elgendy, E.; Schmidt, J. Experimental study of gas engine driven air to water heat pump in cooling mode. Energy 2010, 35, 2461–2467. [Google Scholar] [CrossRef]
  7. Huang, X. Analysis of Economic Operation and Thermodynamic of the Gas Heat Pump System; Beijing Institute of Civil Engineering and Architecture: Beijing, China, 2011. [Google Scholar]
  8. Li, Y.L.; Zhang, X.S.; Cai, L. A novel parallel-type hybrid power gas engine-driven heat pump system. Int. J. Refrig. 2007, 30, 1134–1142. [Google Scholar] [CrossRef]
  9. Wang, Y.; Cai, L.; Yu, Y.; Zhang, X. Performance study of parallel-type hybrid-power gas engine-driven heat pump system. Energy Build. 2013, 62, 37–44. [Google Scholar] [CrossRef]
  10. Wang, J.Y.; Cai, L.; Wang, Y.W.; Maa, Y.; Zhang, X. Modeling and optimization matching on drive system of a coaxial parallel-type hybrid-power gas engine heat pump. Energy 2013, 55, 1196–1204. [Google Scholar] [CrossRef]
  11. Zhou, G. Universal characteristics curve plotting method based on MATLAB. I.C.E Power Plant 2009, 2, 34–36. [Google Scholar]
  12. Jiang, W.; Cai, L.; Wang, J.; Deng, W.; Zhang, X. Simulation and validation of a hybrid-power gas engine heat pump. Int. J. Refrig. 2014, 50, 114–126. [Google Scholar] [CrossRef]
  13. Kim, C.; Goong, E.N.; Lee, S. Fuel economy optimization for parallel hybrid vehicle with CVT. SAE Paper 1999, 1148, 337–342. [Google Scholar]
  14. Dorri, M.; Shamekhi, A.H. Design and optimization of a new control strategy in a parallel hybrid electric vehicle in order to improve fuel economy. Proc. Inst. Mech. Eng. Part D J. Automob. Eng. 2011, 225, 747–759. [Google Scholar] [CrossRef]
  15. Shu, H. Study on Energy Management Strategy for Parallel Hybrid Electric Vehicles; Chongqing University: Chongqing, China, 2008. [Google Scholar]