
Total Site Heat Integration Considering Pressure Drops

Abstract
:
1. Introduction
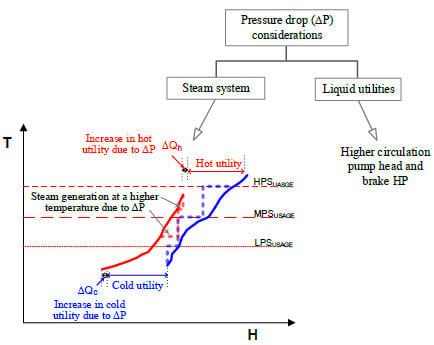
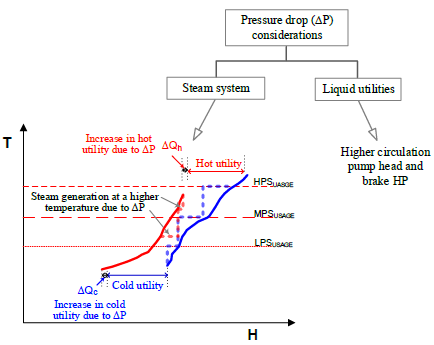
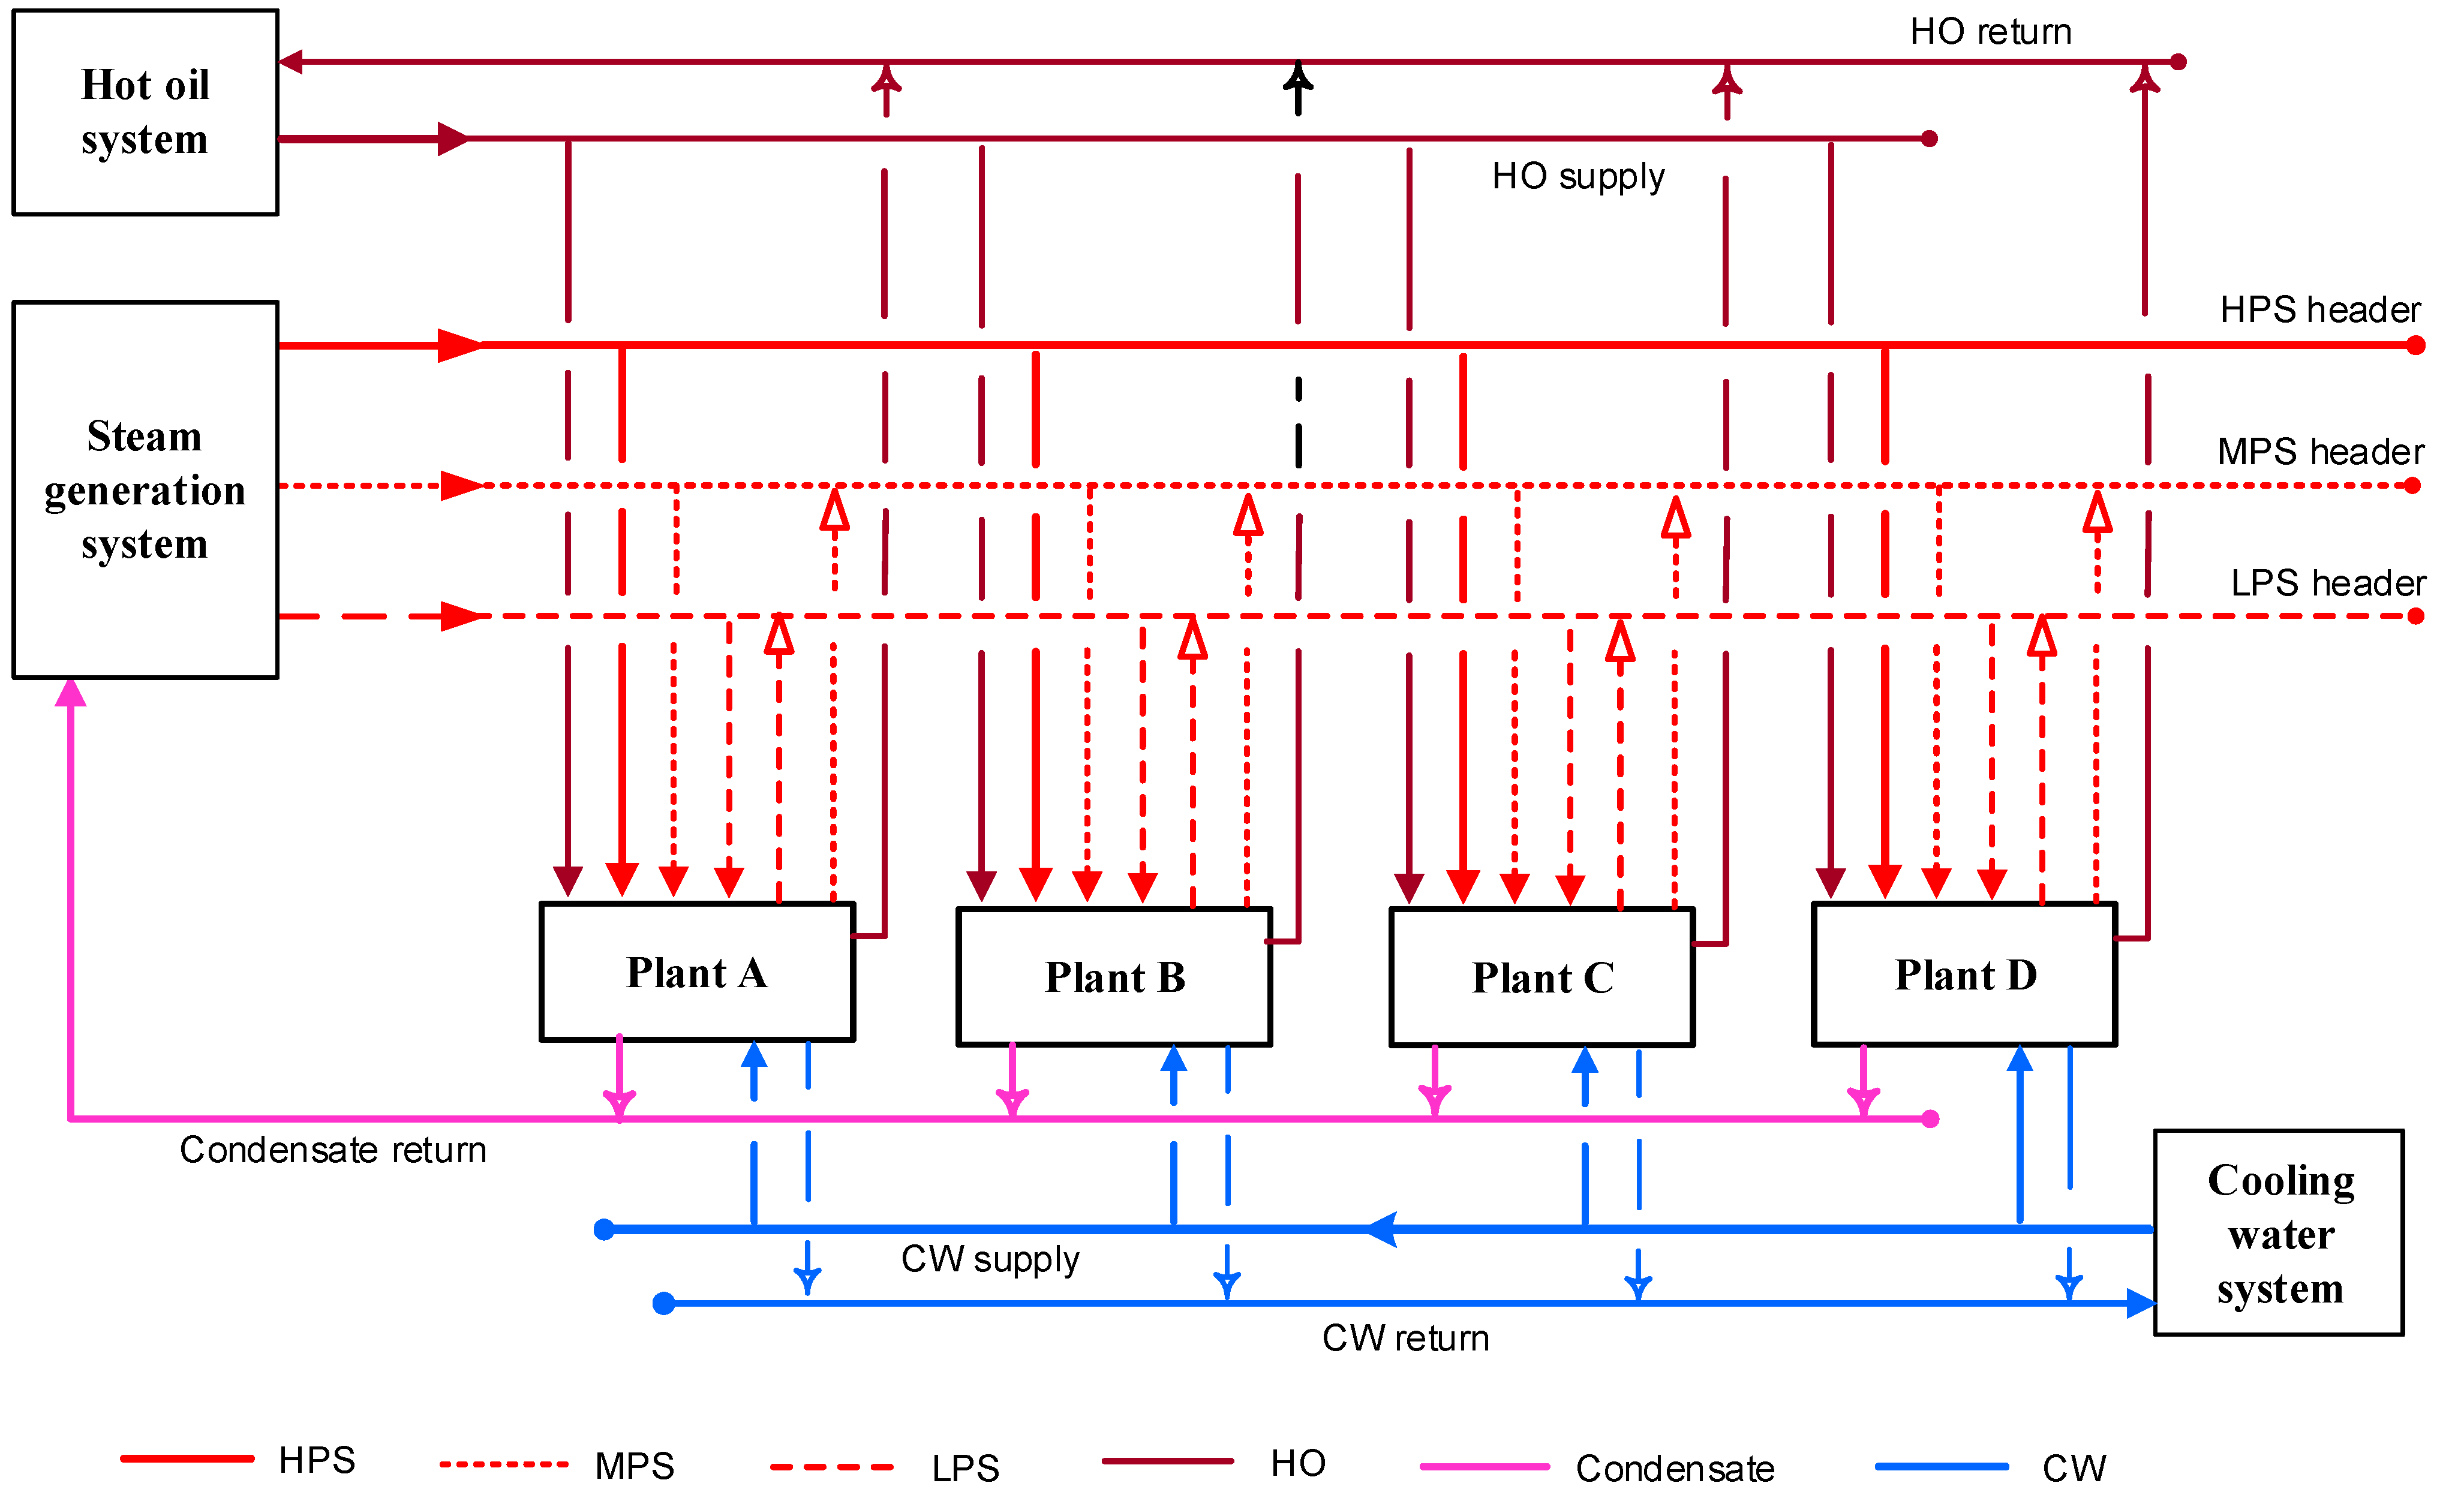
2. Pressure Drop Factor in TSHI


2.1. Steams: HPS, MPS, LPS


2.2. Cooling Water

2.3. Hot Oil

| Fluid | MER Targeting | Cost Optimisation |
|---|---|---|
| Steam e.g., HPS, MPS, LPS | Increase ∆Qh and ∆Qc | Higher BFW pump capital and pumping costs |
| Liquid utilities (e.g., CW, HO, etc.) | No impact | Higher utility circulation pump capital and pumping costs |
| Process—liquids (a) | No impact | Higher pump capital and pumping costs |
| Process—gas (b) | No impact | Higher compressor capital and compressing costs |
3. Pressure Drop Estimates
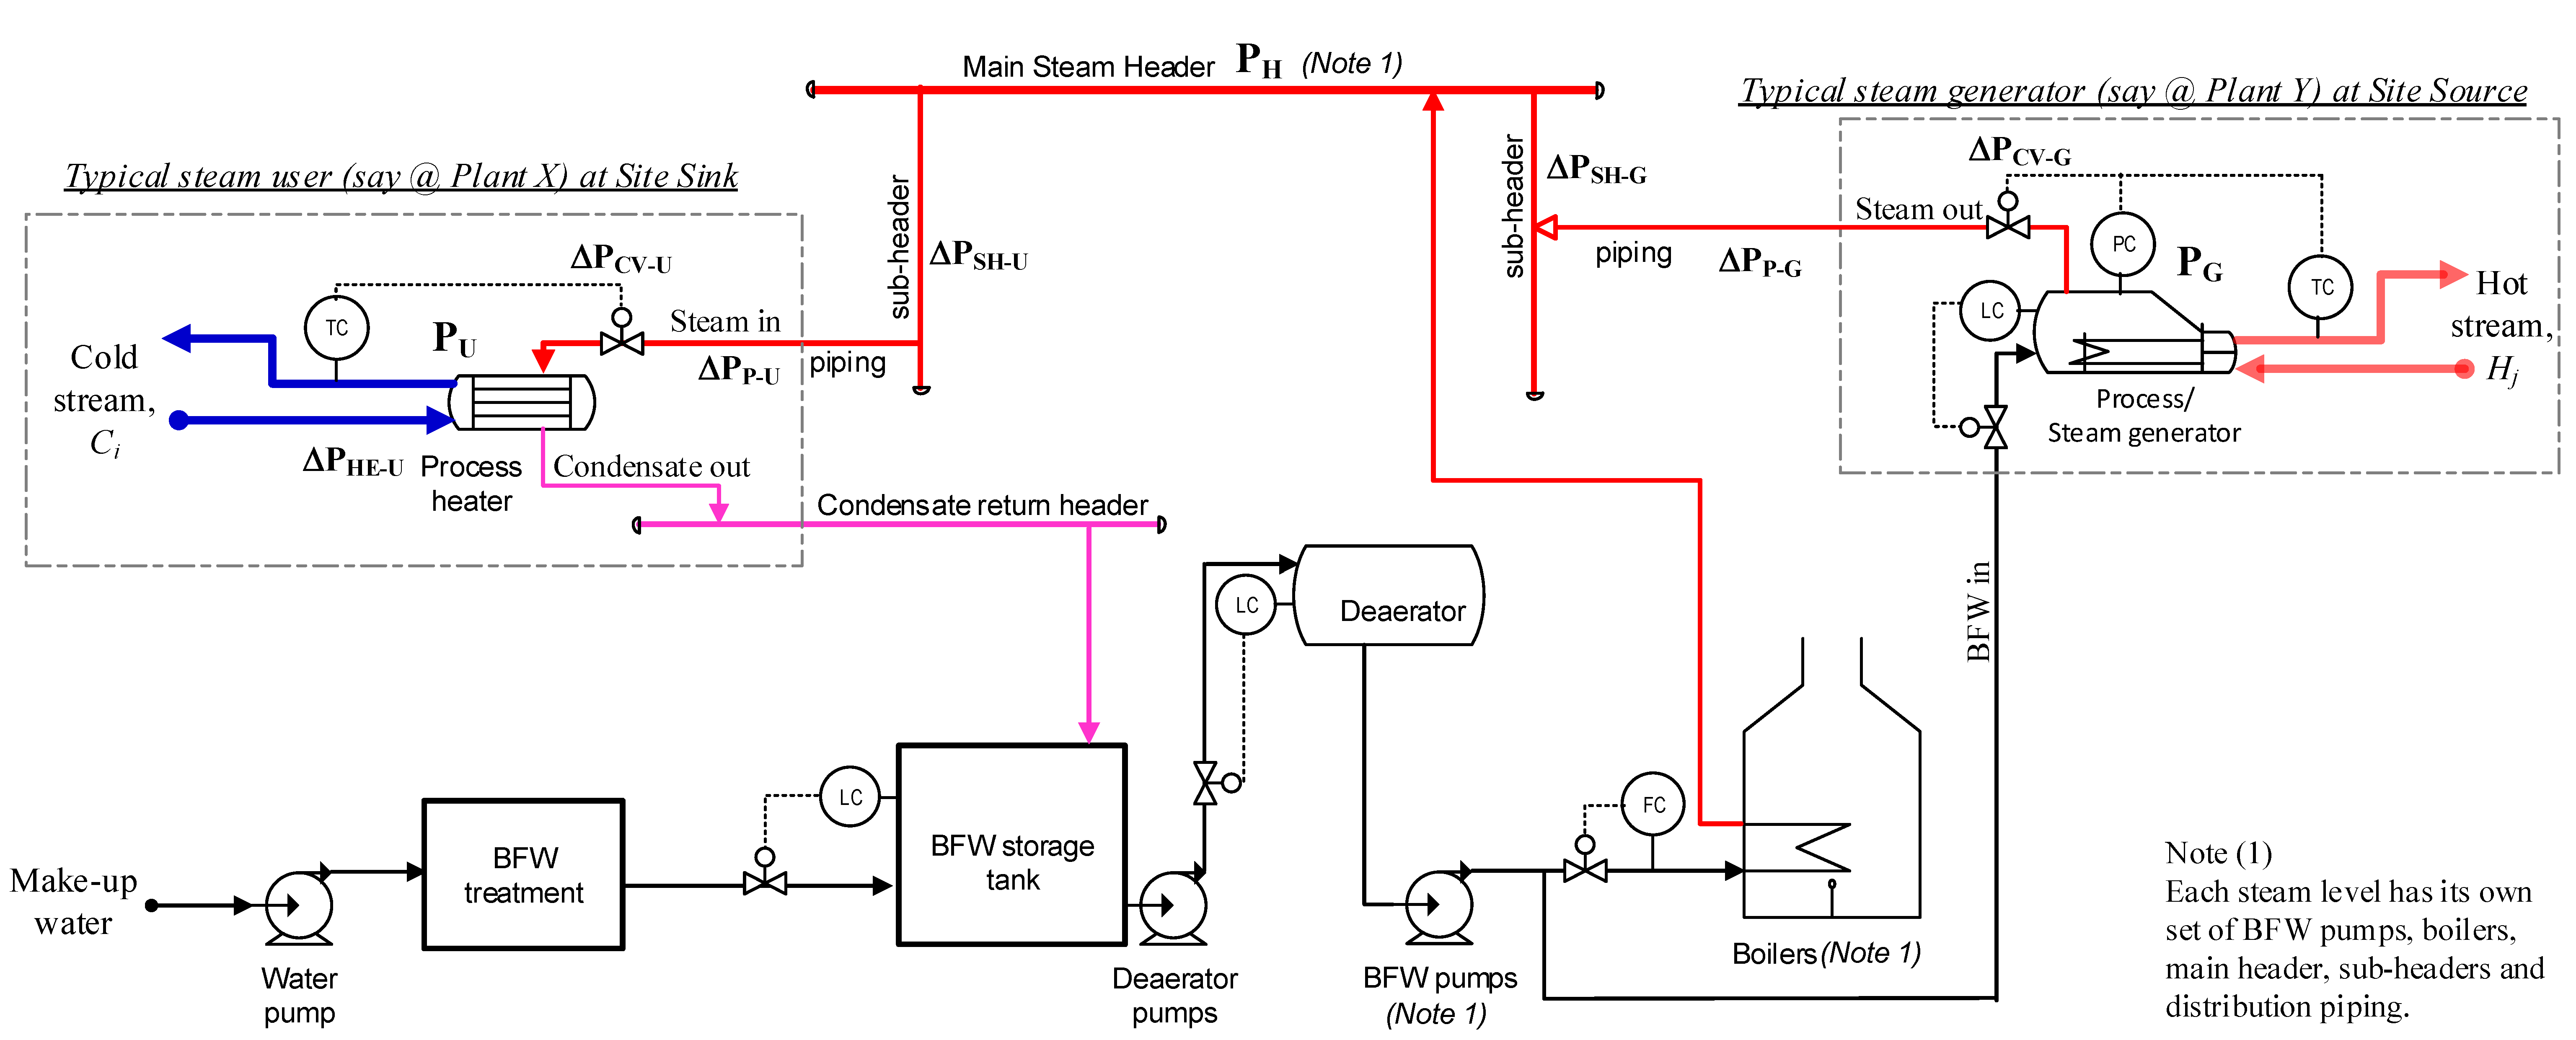
3.1. Steam Distribution System
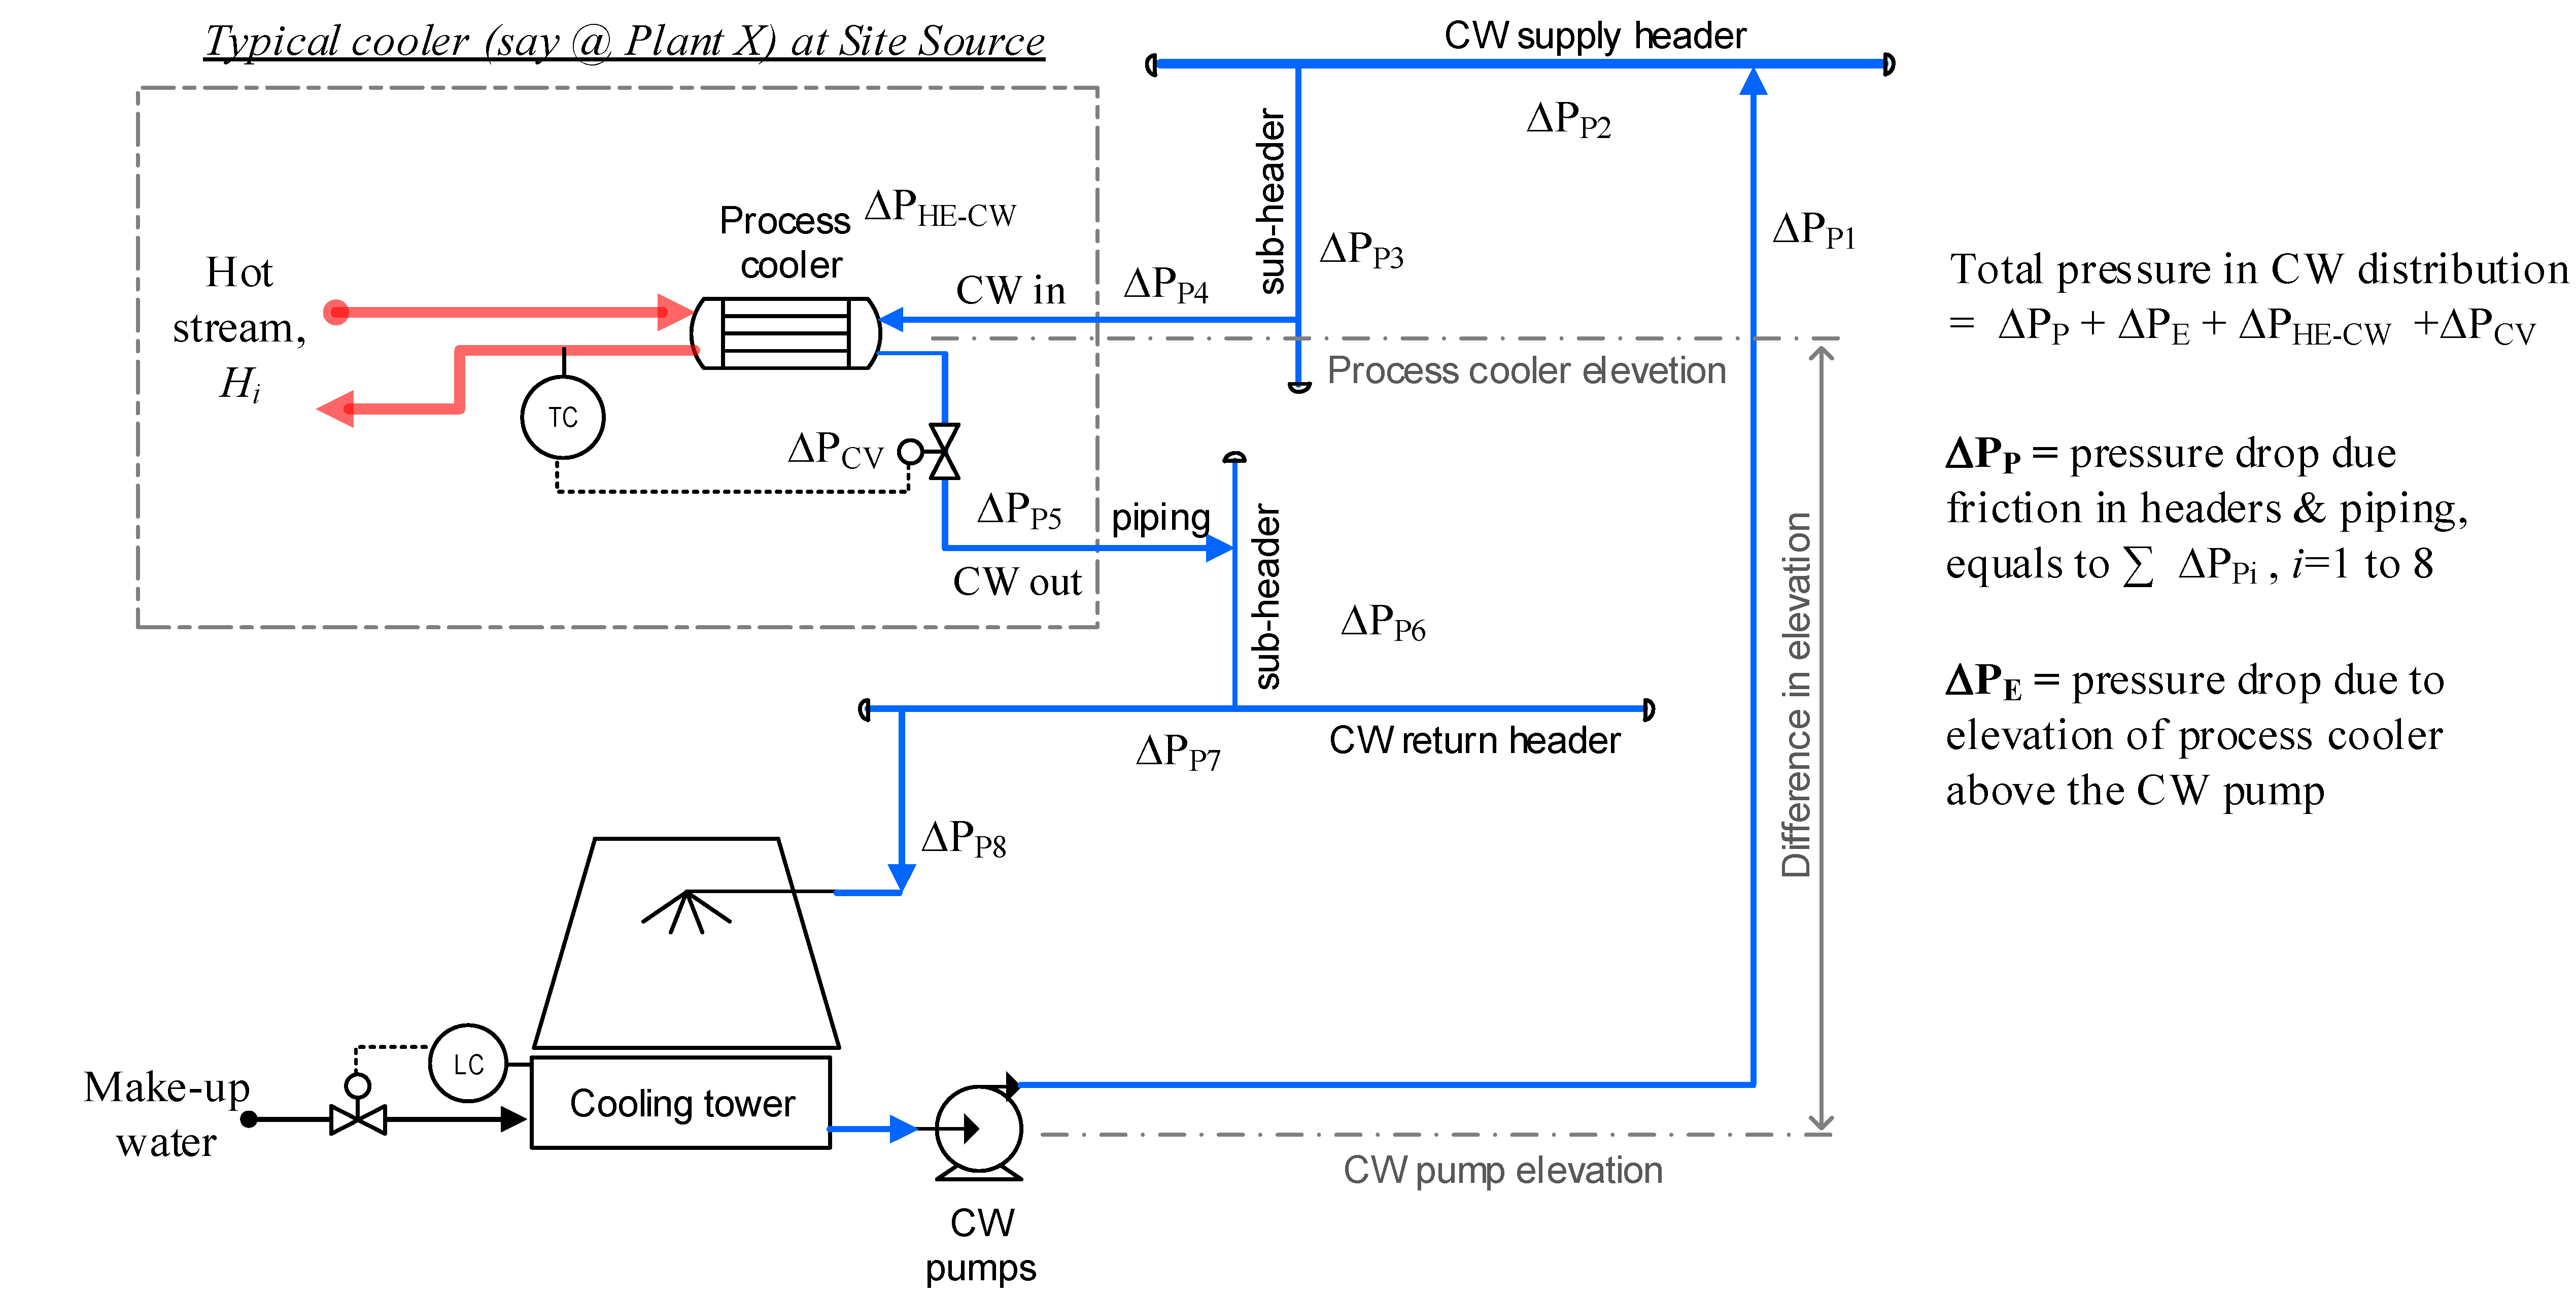
3.2. Cooling Water Distribution System
3.3. Frictional Pressure Drop in Liquid and Gas Lines, ∆PP
3.4. Elevation Pressure Drop for Liquid Lines, ∆PE
3.5. Pressure Drop across Heat Exchanger, ∆PHE
3.6. Pressure Drop across Control Valve, ∆PCV
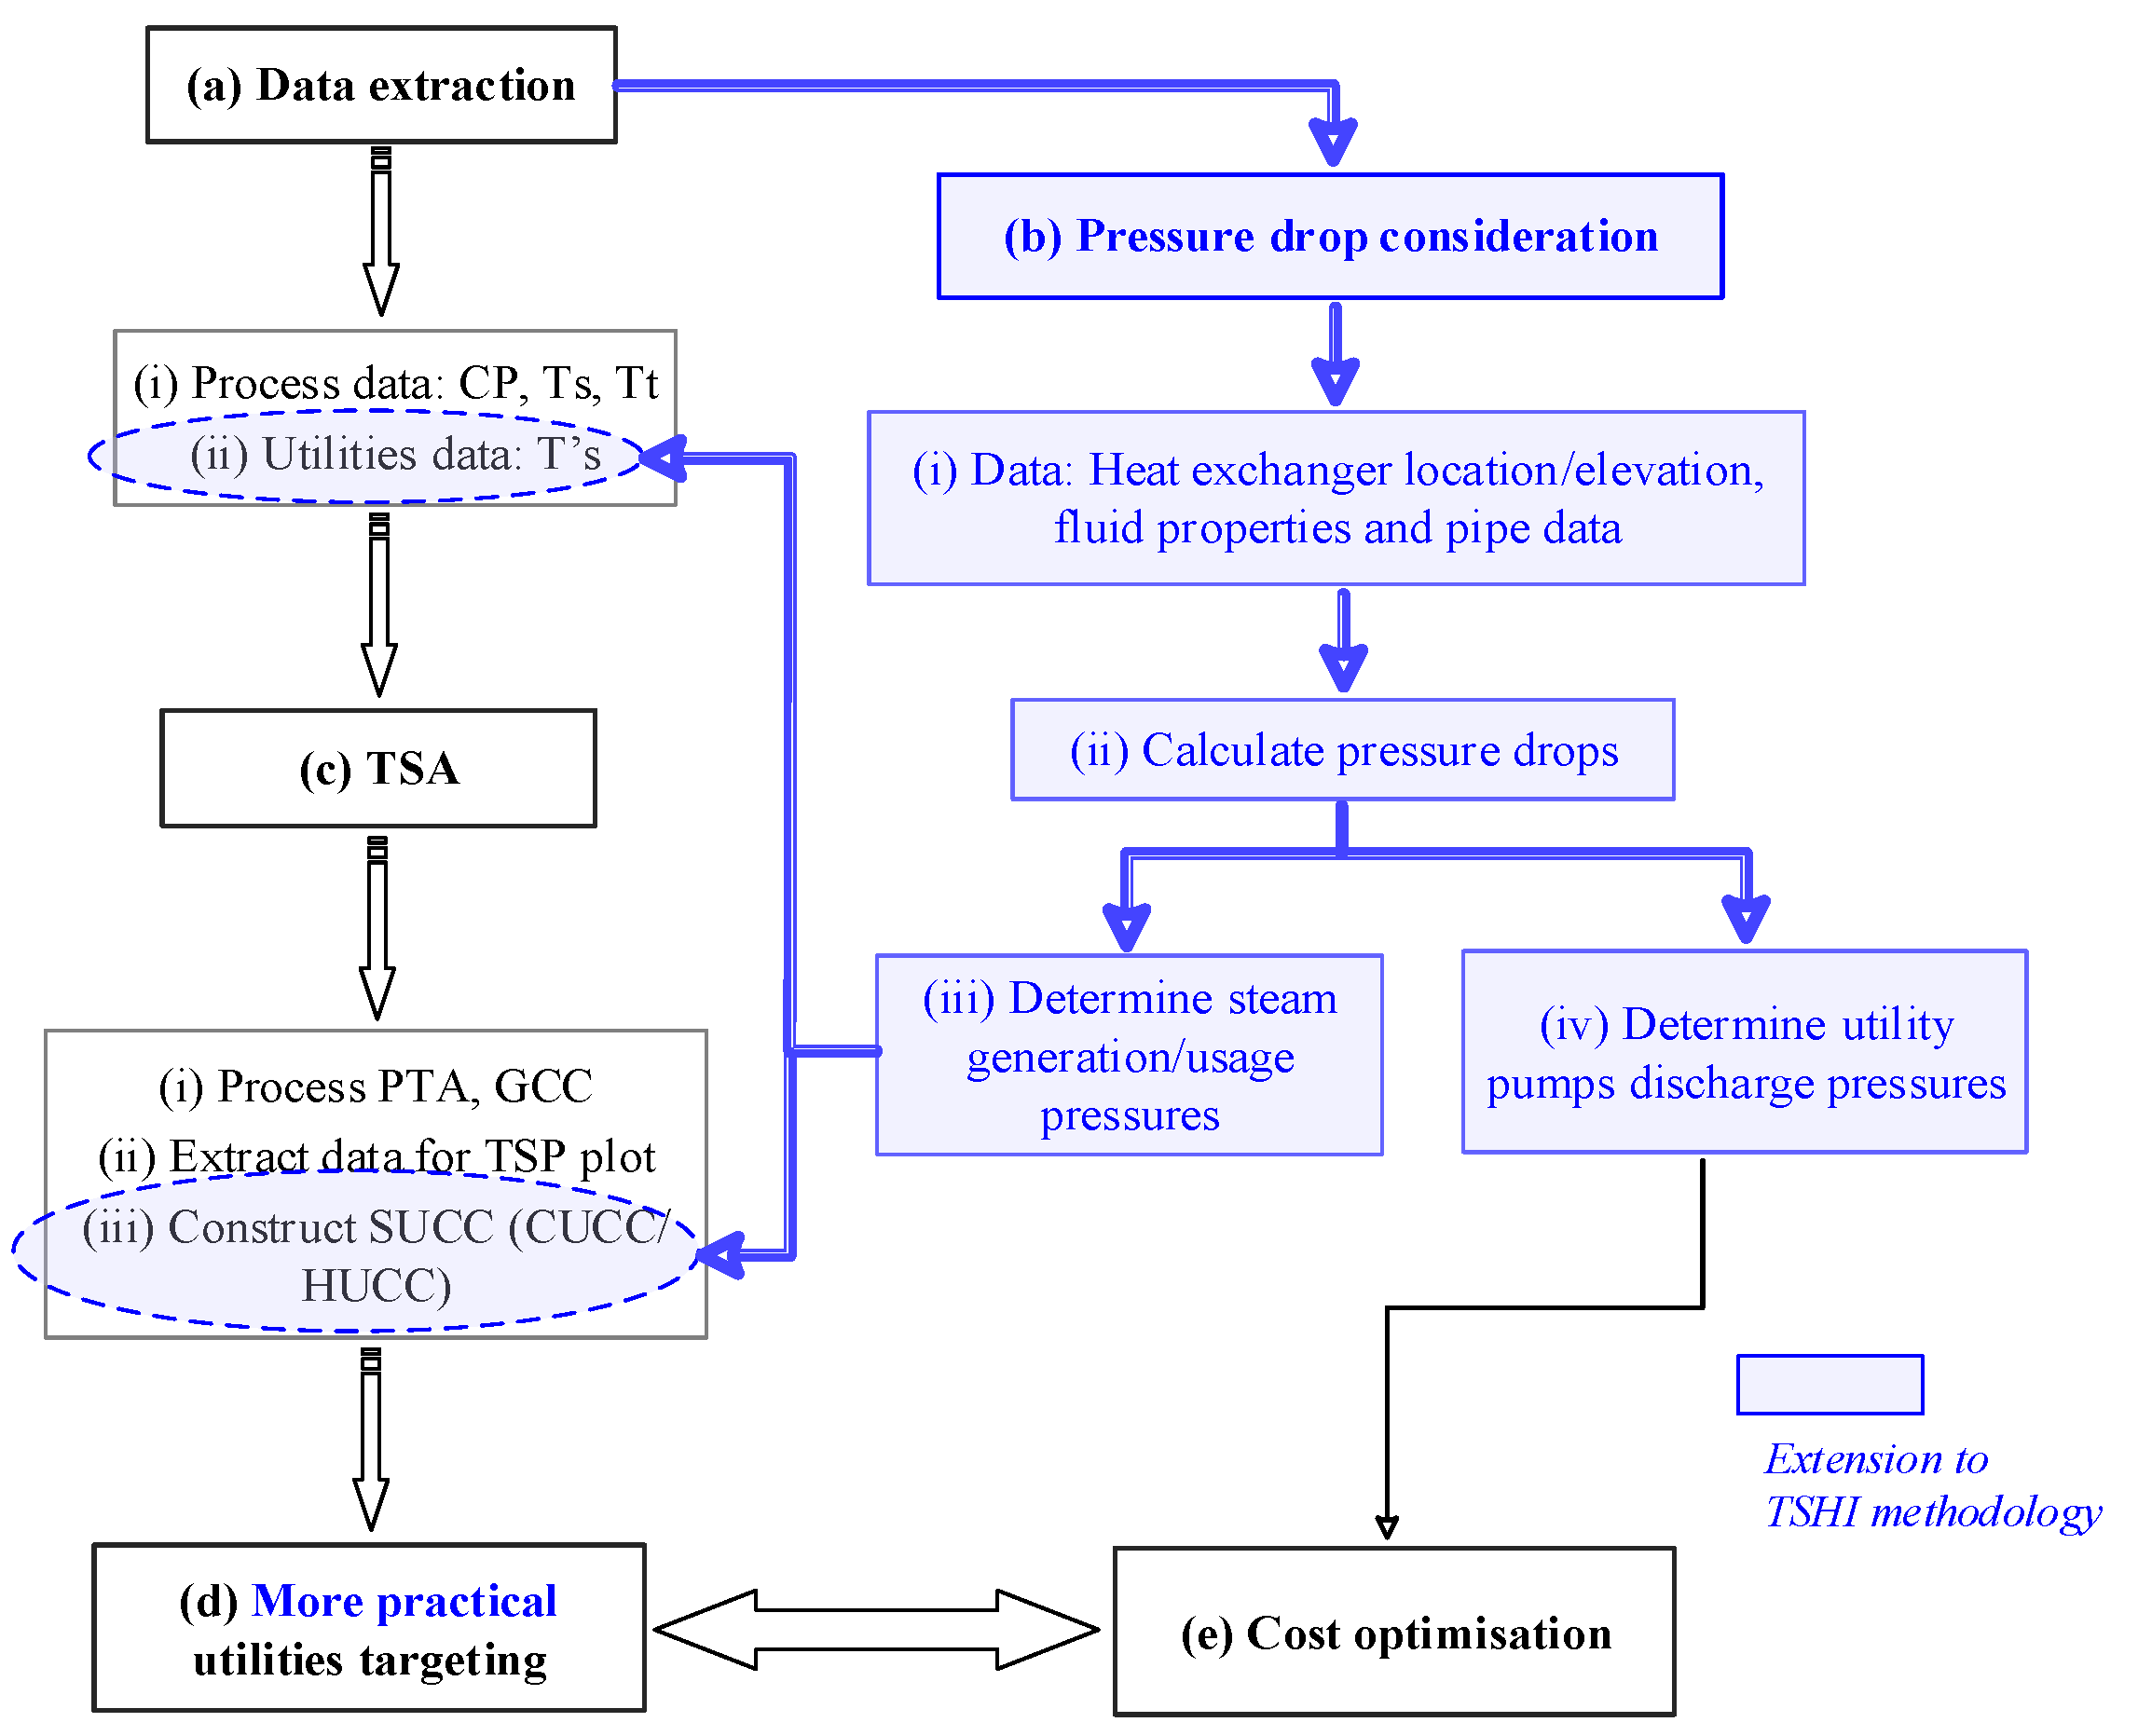
4. Methodology

- (a)
- Data extraction—extract stream and utilities data, i.e., heat capacities (CP) and temperatures.
- (b)
- To consider the pressure drop factor in TSHI:
- (i)
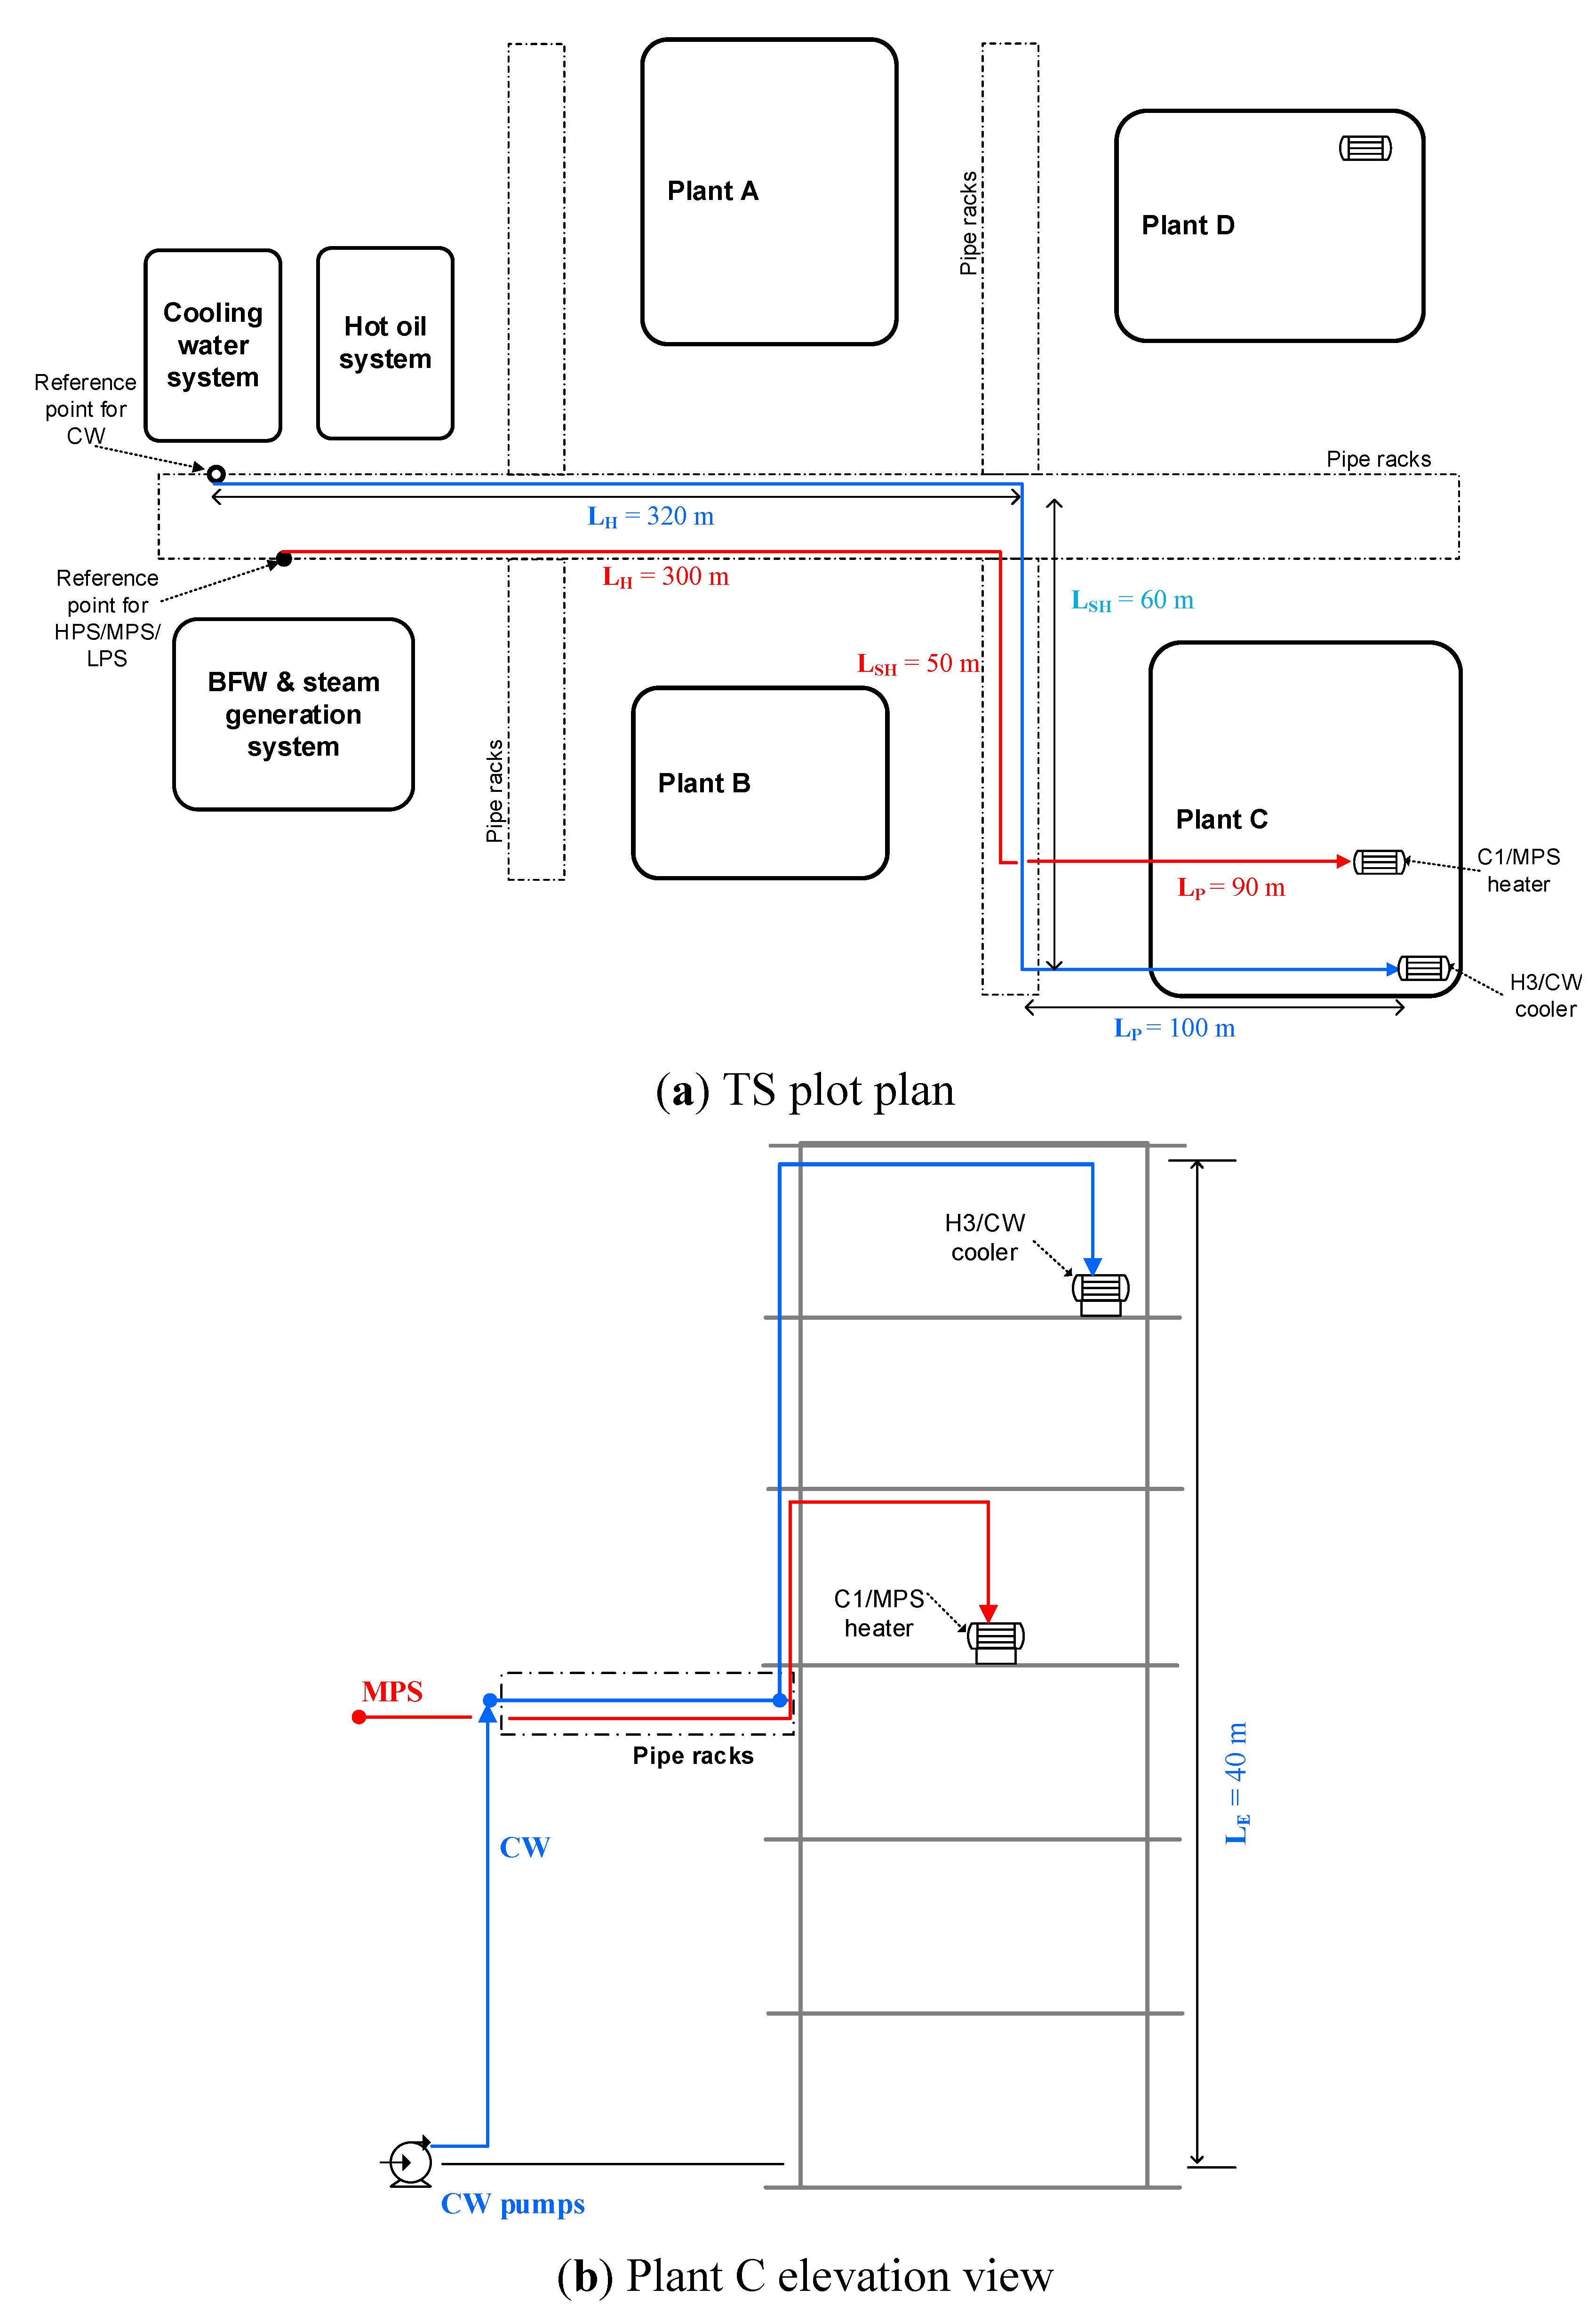
- Information on the location of the heat exchangers, fluid properties and pipe data are required in order to estimate the pressure drops. Location and elevation of the heat exchangers can be obtained from the site plot plan, individual plant layout and elevation drawings. Fluid properties such as mass flow and density can be extracted from the heat and mass balances. Pipe data required are the internal diameter and roughness factor. For each plant on site, determine the header, sub-header and pipe lengths based on the process/utility heat exchangers located furthest from the reference point and the process/utility heat exchanger at the highest elevation.
- (ii)
- The pressure drops can be estimated using the equations given in Section 3. Alternatively, pressure drops can be based on the typical ∆P per unit length for pipes, control valves and heat exchangers available from company guidelines or designer’s experiences.
- (iii)
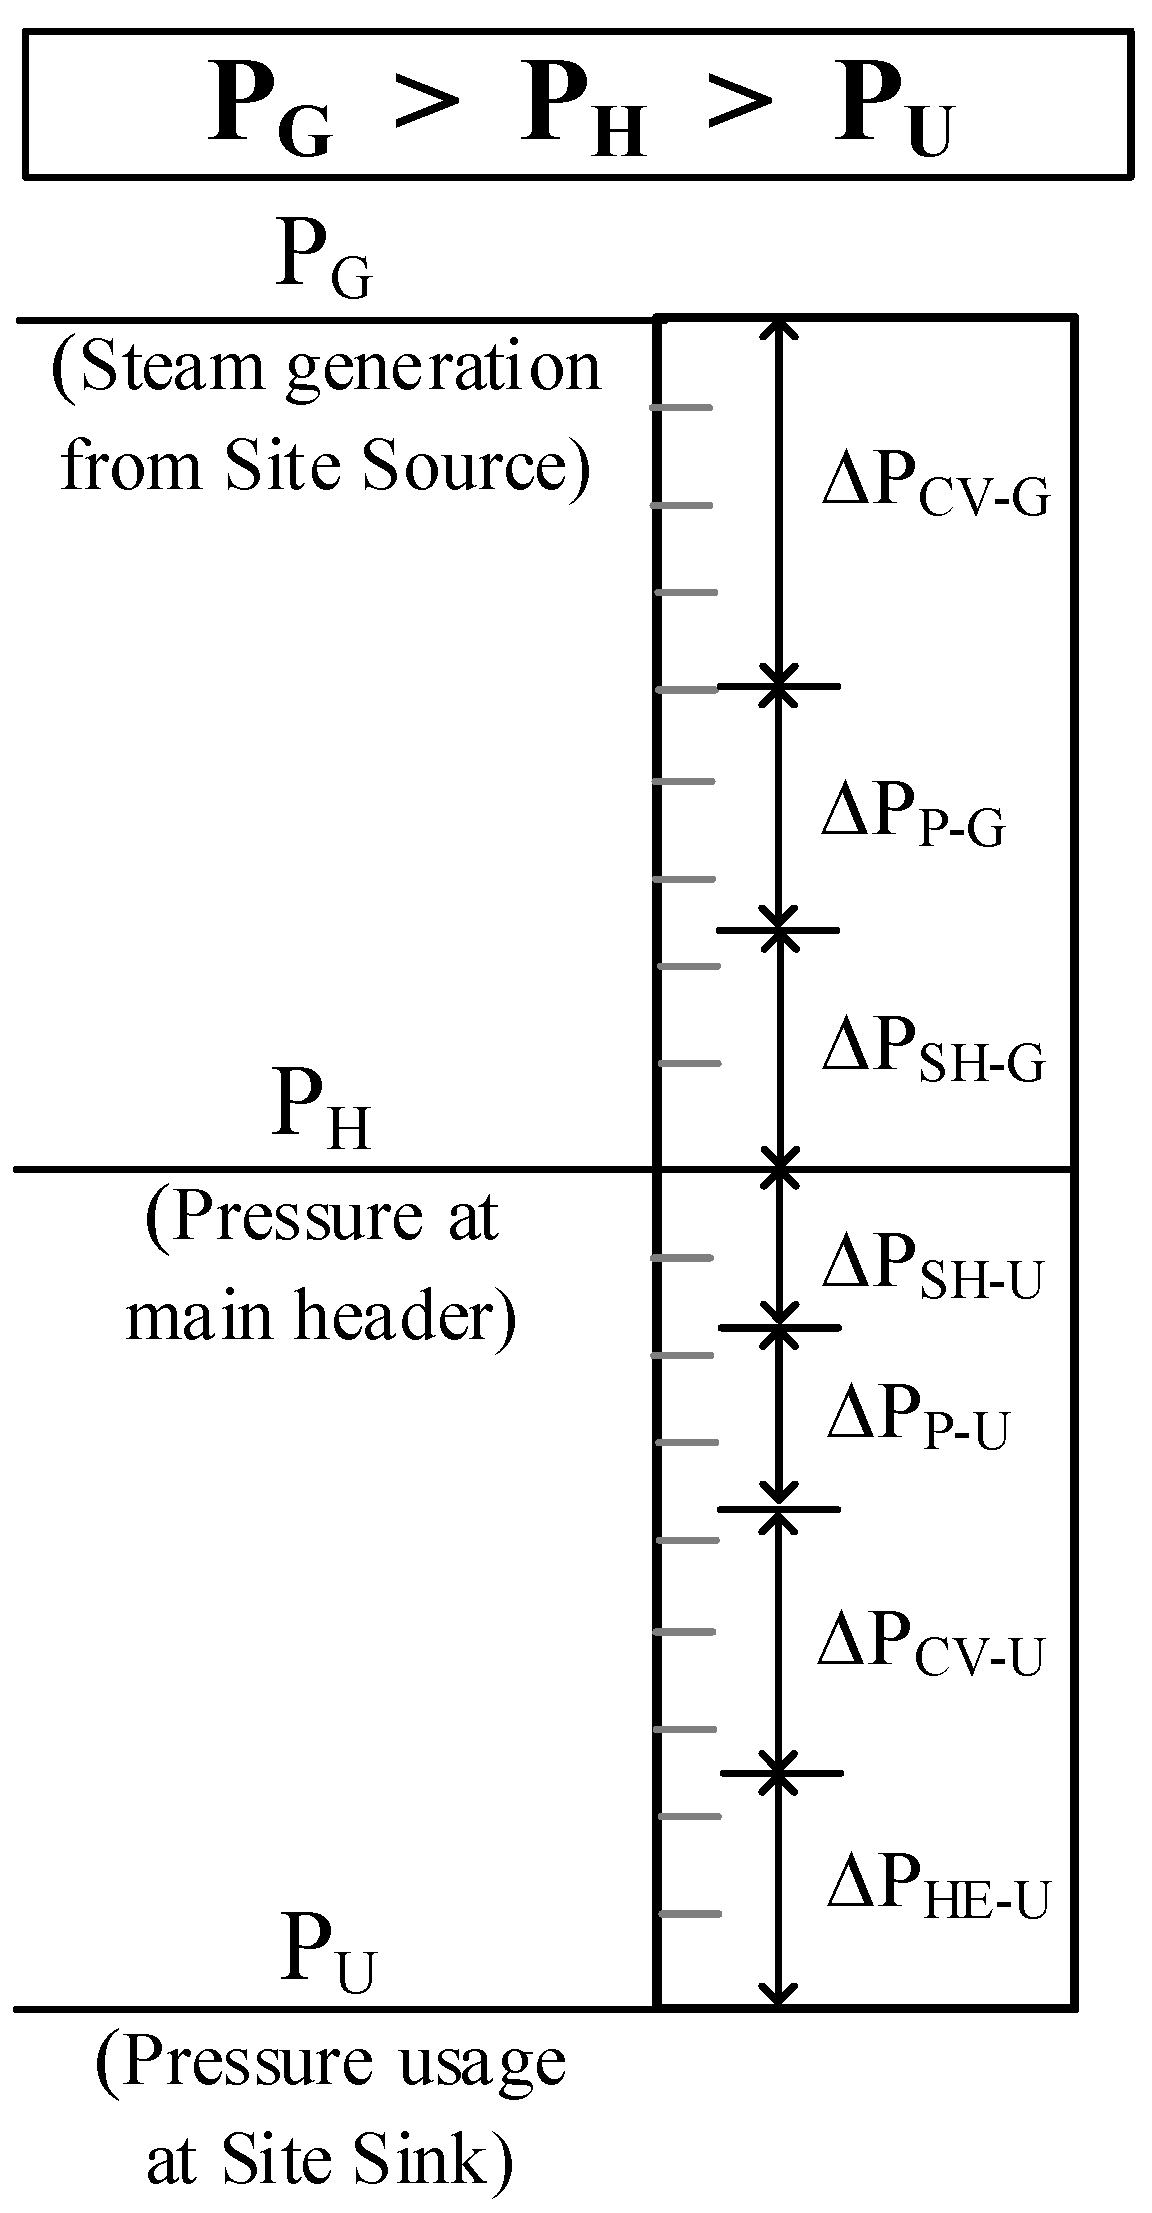
- Determine steam generation/usage pressure and corresponding steam saturation temperatures. Referring to Figure 3 again, the steam usage pressure, PU, is the steam pressure at the steam/process heater, furthest from the utility reference point:where, PH is the header pressure.The steam generation pressure, PG, is the steam pressure at the process/steam generator furthest from the utility reference pointThe steam saturation temperatures at PU and PG can be obtained from the steam tables.
- (iv)
- Determine utility pumps discharge pressure.Referring to Figure 5, the CW pump discharge pressure reads as:where subscript DES denotes destination, at the process/CW cooler furthest from the CW pumps.
- (c)
- Carry out TS analysis:
- (i)
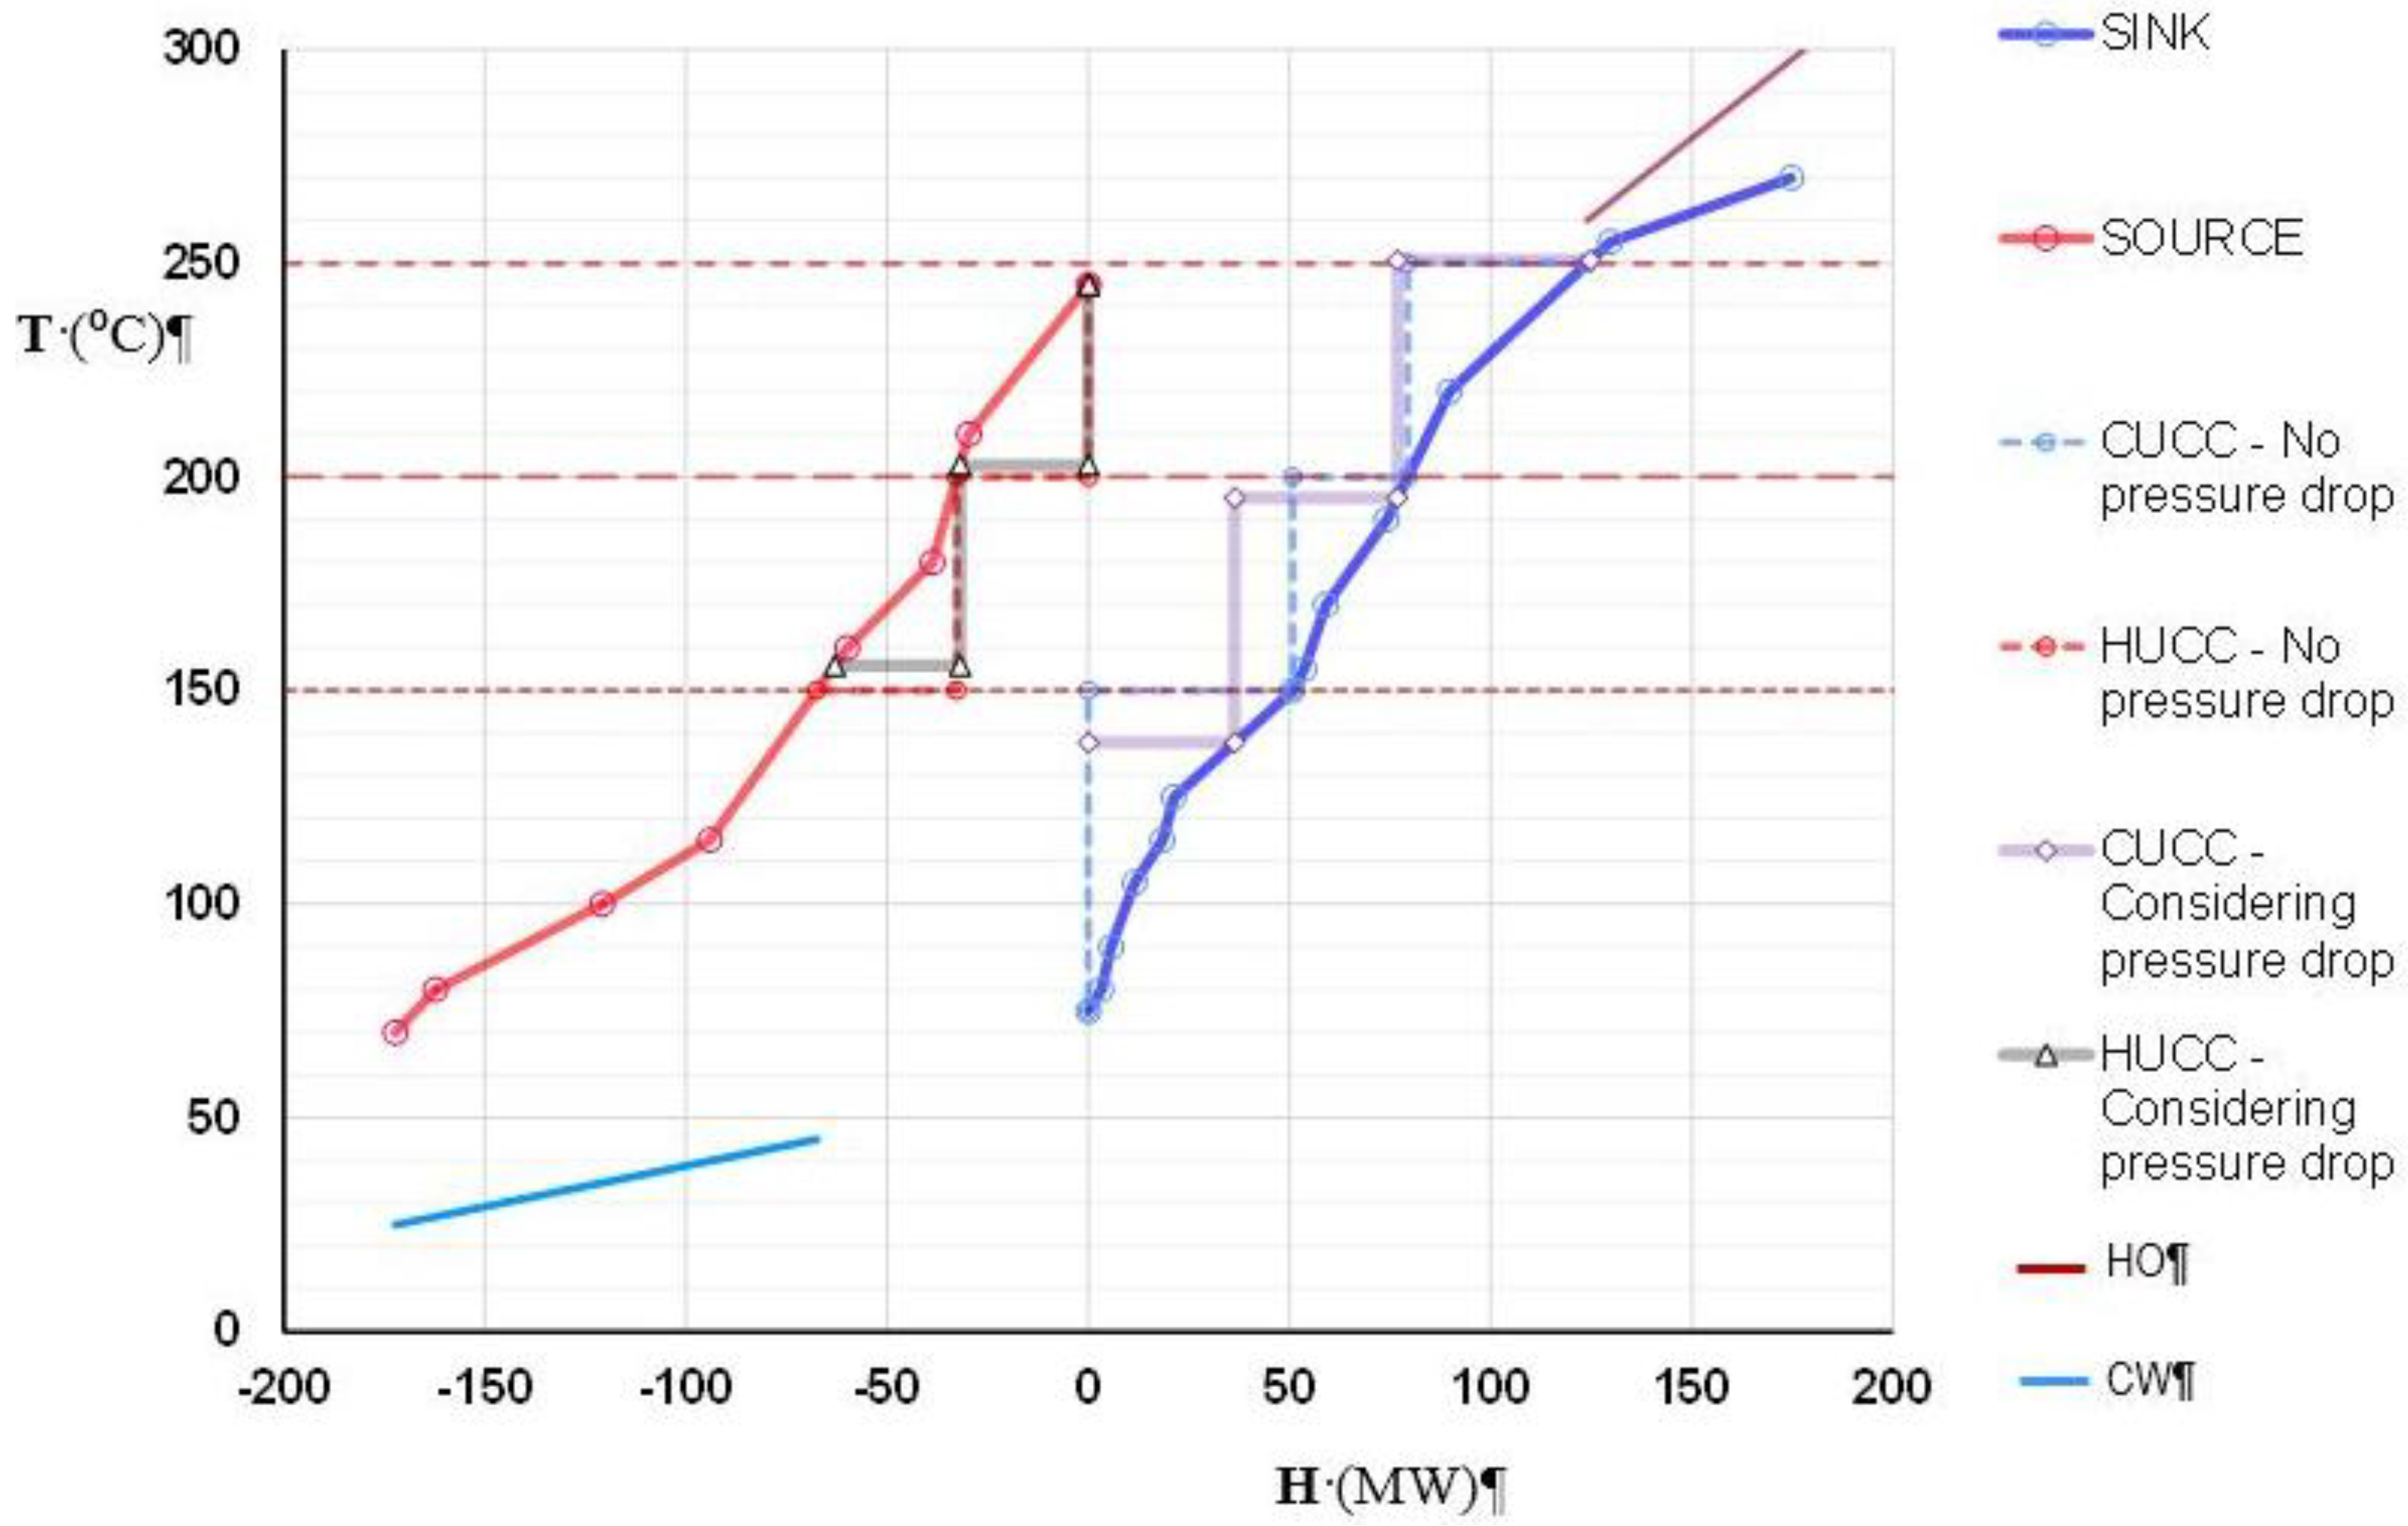
- (ii)
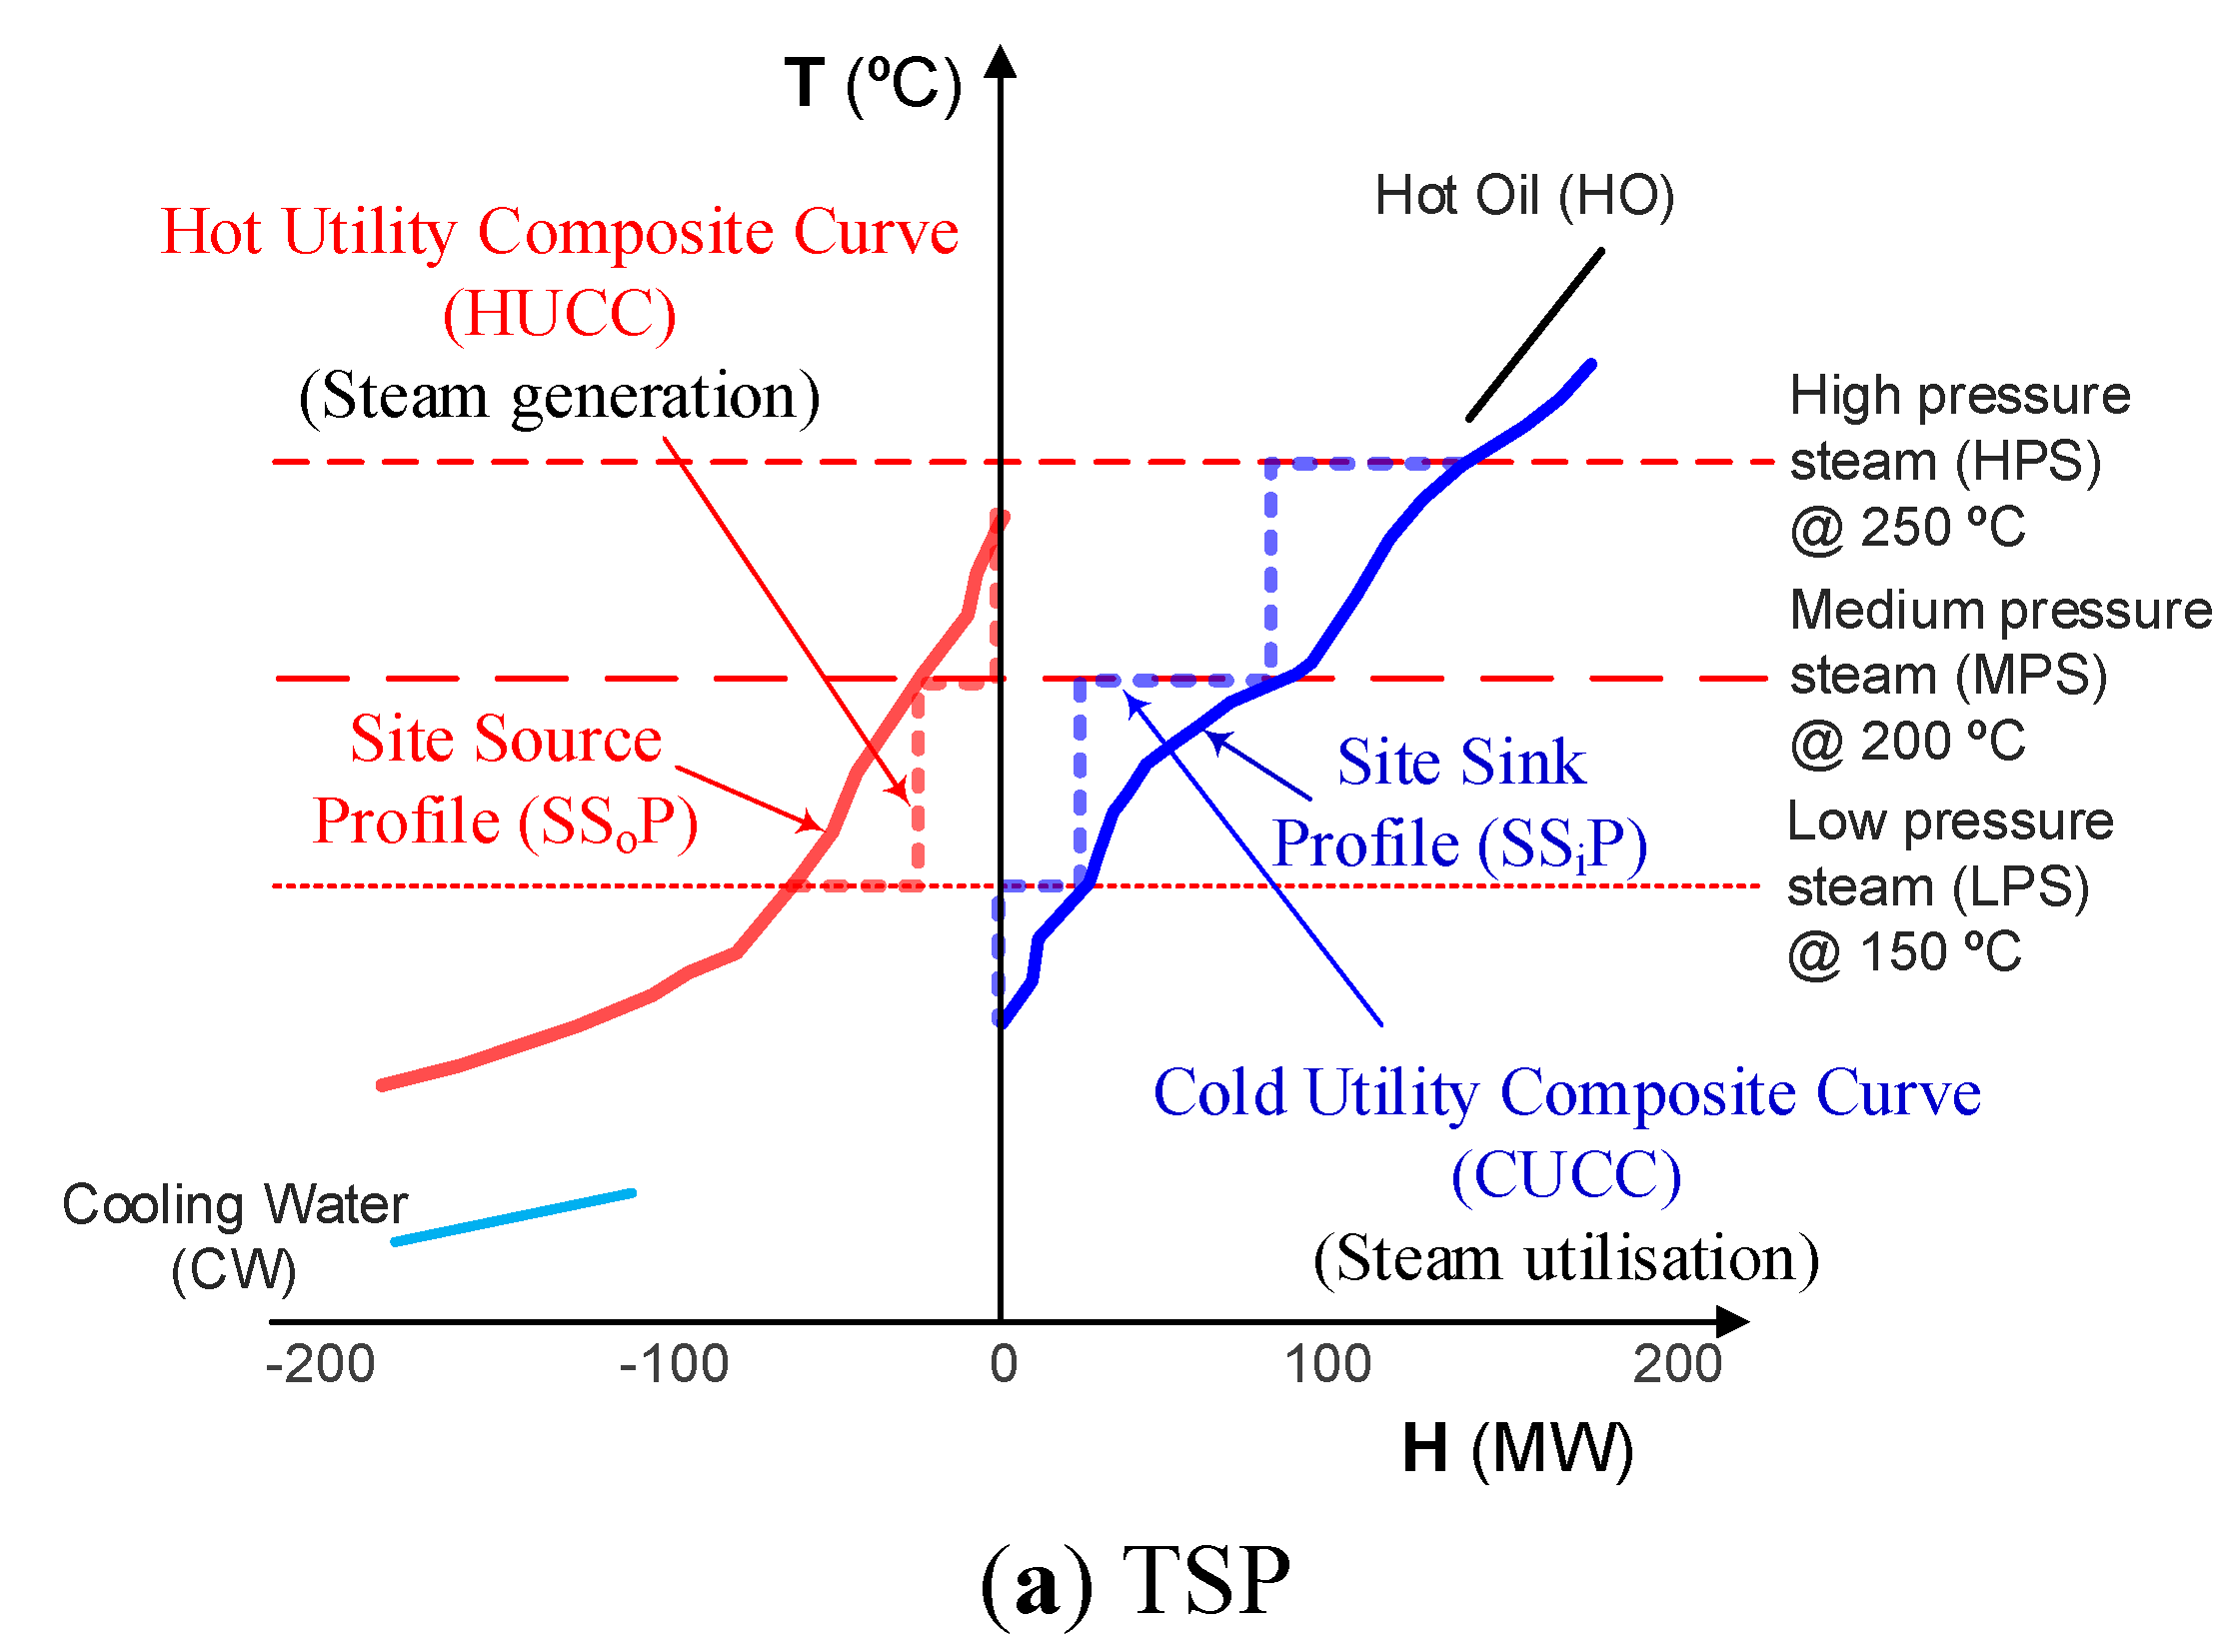
- A graphical representation of the SUCC can be obtained from the TS-PTA, see Figure 8.
- (d)
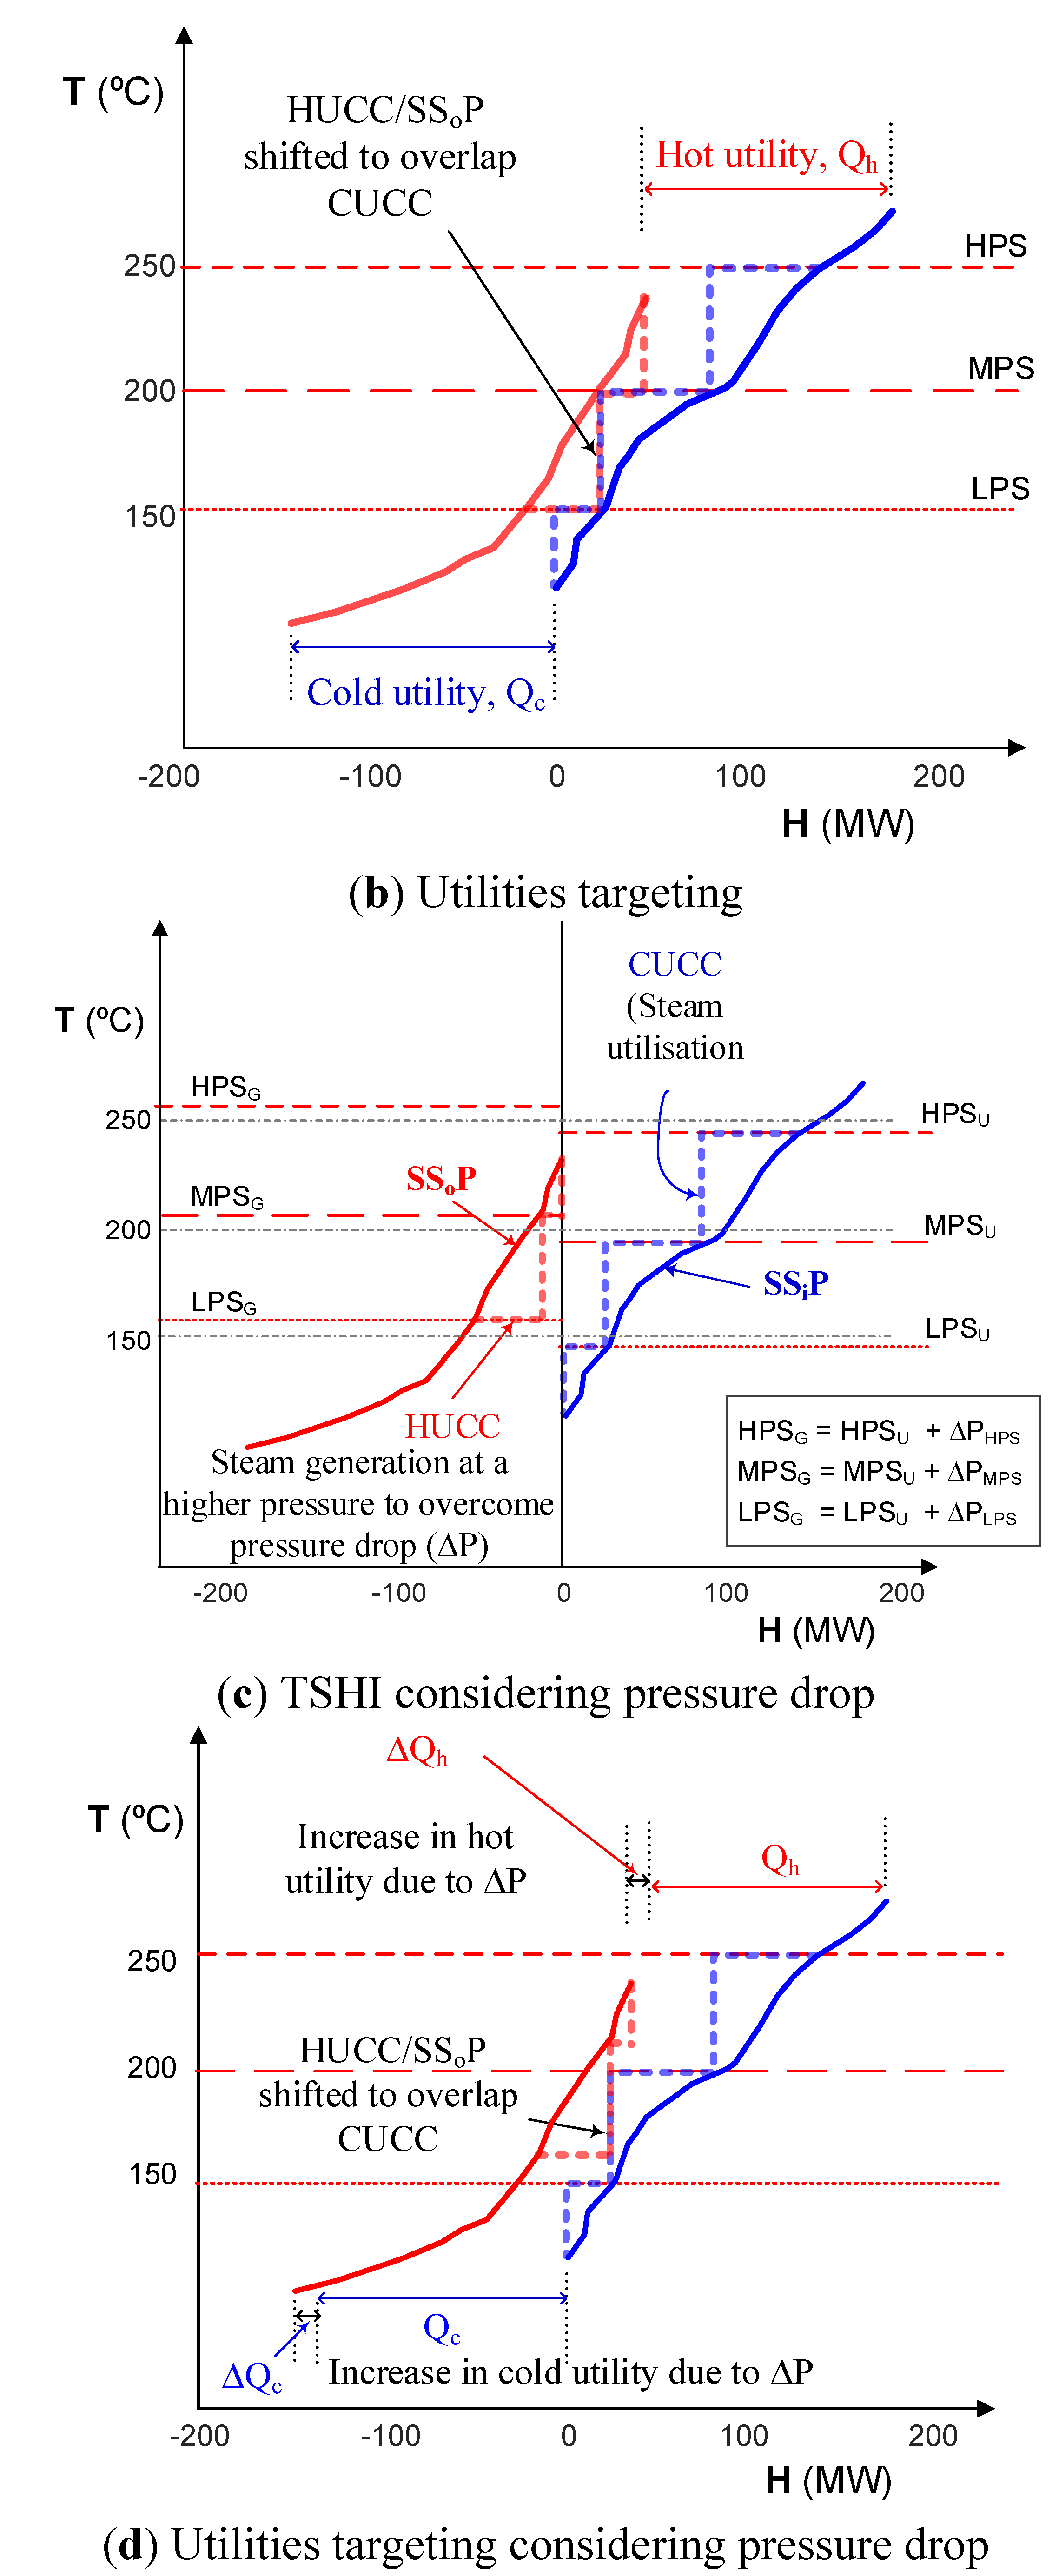
- Utilities targeting—Steam is generated and used at different temperatures due to the pressure drops in the steam distribution network. The TS energy targets are determined using the pinch-based graphical and algebraic method [20].
- (e)
- Pressure drops determined for liquid utility systems can be used as an input to the cost optimisation in terms of higher pumping cost and the constraints in allowable ∆P.
5. Illustrative Examples

| Process | Stream | CP (MW/°C) | Ts (°C) | Tt (°C) | Length, L/Elevation, E (1) | ||||
|---|---|---|---|---|---|---|---|---|---|
| LH (m) | LSH (m) | LP (m) | E (m) | Heat exch. Furthest from Utility Reference Point | |||||
| A | H1 | 0.35 | 260 | 225 | |||||
| H2 | 1.15 | 260 | 195 | ||||||
| H3 | 0.50 | 195 | 130 | ||||||
| C1 | 1.25 | 240 | 255 | ||||||
| C2 | 0.65 | 175 | 260 | ||||||
| C3 | 0.20 | 155 | 205 | ||||||
| B | H1 | 0.36 | 260 | 175 | |||||
| H2 | 0.60 | 260 | 115 | ||||||
| H3 | 0.75 | 175 | 95 | ||||||
| C1 | 1.10 | 175 | 255 | ||||||
| C2 | 0.20 | 110 | 175 | ||||||
| C3 | 0.89 | 95 | 155 | ||||||
| C | H1 | 0.62 | 225 | 155 | 300 | 50 | 90 | H1/MPS | |
| H2 | 0.32 | 195 | 95 | ||||||
| H3 | 1.00 | 130 | 85 | 320 | 60 | 100 | 40 | H3/CW | |
| C1 | 0.60 | 110 | 240 | 300 | 50 | 85 | C1/HPS, C1/MPS | ||
| C2 | 0.40 | 155 | 240 | ||||||
| C3 | 0.70 | 110 | 175 | ||||||
| D | H1 | 0.41 | 130 | 85 | 300 | 50 | 90 | H1/LPS | |
| H2 | 0.10 | 110 | 80 | ||||||
| H3 | 0.15 | 95 | 70 | ||||||
| C1 | 0.20 | 90 | 140 | 300 | 50 | 80 | C1/LPS | ||
| C2 | 0.50 | 60 | 110 | ||||||
| C3 | 0.40 | 50 | 100 | ||||||
| Utility | Ts (°C) | Tr (°C) | |||||||
| HO | 300 | 260 | ∆Tmin-pp is | 20 | °C | ||||
| HPS | 250 | - | ∆Tmin-pu is | 15 | °C | ||||
| MPS | 200 | - | |||||||
| LPS | 150 | - | |||||||
| CW | 25 | 45 | |||||||

| Operating parameter | LPS Usage | LPS Generation | MPS Usage | MPS Generation | HPS Usage | CW | ||
|---|---|---|---|---|---|---|---|---|
| Header pressure | kPag | 375 | 375 | 1453 | 1453 | 3831 | - | |
| Header temp. | °C | 150 | 150 | 200 | 200 | 250 | - | |
| Pressure drops (1): | ∆PH | kPa | 33 | 33 | 33 | 33 | 33 | - |
| ∆PSH | kPa | 5.5 | 5.5 | 5.5 | 5.5 | 5.5 | - | |
| ∆PP | kPa | 10.8 | 9.6 | 9 | 9.6 | 9 | - | |
| ∆PCV | kPa | 35 | 35 | 50 | 50 | 50 | 70 | |
| ∆PHE | kPa | 50 | - | 50 | - | 50 | 100 | |
| ∆Pf | kPa | - | - | - | - | - | 218 (2) | |
| ∆PE | kPa | - | - | - | - | - | 392.4 | |
| Total pressure drops | kPa | 134 | 83.1 | 148 | 98.1 | 148 | 780.4 | |
| Pressure @ user | PU | kPag | 240.7 | - | 1305.5 | - | 3683.5 | |
| Temperature @ user | TU | °C | 137.8 | - | 195.1 | - | 247 | |
| Pressure @ generation | PG | kPag | - | 458.1 | - | 1551 | - | |
| Temperature @ generation | TG | °C | - | 155.9 | - | 202.8 | - | |
| ∆T between usage and generation | °C | 18.1 | 7.7 | |||||
| Pressure @ CW pump | kPag | 980.4 (3) | ||||||
| T** (°C) | ∆T (°C) | Process CP | Σ CP (MW/°C) | ∆H (MW) | Cascade H (MW) | H (1) (MW) | Utility Usage | |||
|---|---|---|---|---|---|---|---|---|---|---|
| A (MW/°C) | B (MW/°C) | C (MW/°C) | D (MW/°C) | H (MW) | ||||||
| 75 | 0 | 0 | 0 | |||||||
| 80 | 5 | 0.65 | 0.65 | 3.3 | 3.3 | |||||
| 90 | 10 | 0.24 | 0.24 | 2.4 | 5.7 | |||||
| 105 | 15 | 0.39 | 0.39 | 5.9 | 11.5 | |||||
| 115 | 10 | 0.69 | 0.69 | 6.9 | 18.4 | |||||
| 125 | 10 | 0.29 | 0.29 | 2.9 | 21.3 | |||||
| 137.8 | 36.4 | LPS = 36.4 | ||||||||
| 150 | 25 | 0.98 | 0.20 | 1.18 | 29.5 | 50.8 | ||||
| 155 | 5 | 0.36 | 0.20 | 0.56 | 2.8 | 53.9 | ||||
| 170 | 15 | 0.36 | 0.36 | 5.4 | 59.0 | |||||
| 190 | 20 | 0.76 | 0.76 | 15.2 | 74.2 | |||||
| 195.1 | 76.9 | MPS = (76.9 − 36.4) = 40.5 | ||||||||
| 220 | 30 | 0.14 | 0.38 | 0.52 | 15.6 | 89.8 | ||||
| 250.7 | 124.8 | HPS = (124.8 − 76.9) = 47.9 | ||||||||
| 255 | 35 | 0.14 | 1.00 | 1.14 | 39.9 | 129.7 | ||||
| 270 | 15 | 1.90 | 1.10 | 3.00 | 45.0 | 174.7 | ||||
| 275 | 5 | 0.65 | 0.65 | 3.3 | 178.0 | |||||
| T** (°C) | ∆T (°C) | Process CP | Σ CP (MW/°C) | ∆H (MW) | Cascade H (MW) | H (1) (MW) | Utility Usage | |||
|---|---|---|---|---|---|---|---|---|---|---|
| A (MW/°C) | B (MW/°C) | C (MW/°C) | D (MW/°C) | H (MW) | ||||||
| 245 | 0 | 0 | 0 | |||||||
| 210 | 35 | 0.85 | 0.85 | 29.8 | 29.8 | |||||
| 202.8 | 31.9 | MPS = 31.9 | ||||||||
| 180 | 30 | 0.30 | 0.30 | 9.0 | 38.8 | |||||
| 160 | 20 | 0.30 | 0.76 | 1.06 | 21.2 | 60.0 | ||||
| 155.9 | 63.1 | LPS = (63.1 − 31.9) =31.2 | ||||||||
| 115 | 45 | 0.50 | 0.26 | 0.76 | 34.2 | 94.2 | ||||
| 100 | 15 | 0.46 | 1.32 | 1.78 | 26.7 | 120.9 | ||||
| 80 | 20 | 0.75 | 1.32 | 2.07 | 41.4 | 162.3 | ||||
| 70 | 10 | 1.00 | 1.00 | 10.0 | 172.3 | |||||
| Utilities | Base Case (No Pressure Drops) | Case 1 (with Pressure Drops) | (Case 1)—(Base Case) | ||||||
|---|---|---|---|---|---|---|---|---|---|
| Usage (MW) | Generation (MW) | Nett (MW) | Usage (MW) | Generation (MW) | Nett (MW) | Usage (MW) | Generation (MW) | Nett (MW) | |
| HO | 54.0 | - | 54.0 | 53.2 | - | 53.2 | −0.8 | - | −0.8 |
| HPS | 44.6 | - | 44.6 | 48.0 | - | 48.0 | +3.4 | - | +3.4 |
| MPS | 28.6 | 32.8 | −4.2 (1) | 40.5 | 31.9 | 8.6 | +11.9 | −0.9 | +8.6 |
| LPS | 50.8 | 34.8 | 11.8 (1) | 36.4 | 31.2 | 5.2 | −14.4 | −3.8 | −6.8 |
| Total heating | 100.4 | 115.0 | +14.6 | ||||||
| CW | - | - | 104.7 | 109.2 | +4.7 | ||||
6. Conclusions
Acknowledgments
Author Contributions
Appendix 1. Steam Line Sizing Chart—Pressure Drop (Spirax Sarco, 2014).

- •
- Select the steam pressure at the saturated steam line (7 barg), A;
- •
- From A, draw a horizontal line to the steam flowrate (286 kg/h) and mark B;
- •
- From B, draw a vertical line to the top of nomograph, C;
- •
- Draw a horizontal line from 0.24 bar/100 m (allowable DP) on the pressure loss scale (DE);
- •
- Point which BC crosses DE will indicate the pipe size required.
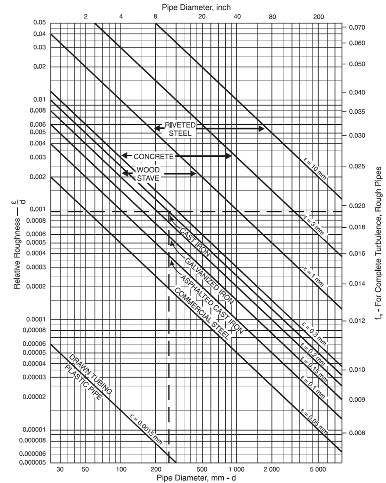
Appendix 2. Relative Roughness of Pipe Materials and Friction Factors for Complete Turbulence (GPSA, 1998).
Abbreviations
| BFW | Boiler feed water |
| CUCC | Cold Utility Composite Curve |
| CV | Control valve |
| CW | Cooling water |
| FC | Flow control |
| GCC | Grand Composite Curve |
| HE | Heat exchanger |
| HEN | Heat exchanger network |
| HI | Heat Integration |
| HO | Hot oil |
| HPS | High pressure steam |
| HUCC | Hot Utility Composite Curve |
| LC | Level control |
| LPS | Low pressure steam |
| MINLP | Mixed integer non-linear programming |
| MP | Mathematical Programming |
| MPS | Medium pressure steam |
| MER | Minimum energy requirement |
| PC | Pressure control |
| PTA | Problem Table Analysis |
| SUCC | Site utility Composite Curves |
| SSiP | Site Sink Profile |
| SSoP | Site Source Profile |
| TC | Temperature control |
| TS | Total Site |
| TS-PTA | Total Site Problem Table Analysis |
| TSHI | Total Site Heat Integration |
| TSP | Total Site Profile |
| VHPS | Very high pressure steam |
Nomenclature
| CP | Heat capacity flowrate, MW/°C |
| d | Pipe internal diameter, mm |
| ε | Pipe roughness factor, m |
| Qc | Cooling utilities heat flowrate, MW |
| Qh | Heating utilities heat flowrate, MW |
| H | Process heat flowrate, MW |
| ∆P | Pressure drop, kPa |
| ∆Tmin | Minimum approach temperature, °C |
| ∆Tmin-pp | Minimum approach temperature between process and process, °C |
| ∆Tmin-pu | Minimum approach temperature between process and utility, °C |
| fm | Moody friction factor |
| L | Length, m |
| P | Pressure, kPag |
| Re | Reynolds number |
| ρ | Density, kg/m3 |
| T | Temperature, °C |
| T* | Shifted temperature for process PTA, °C |
| T** | Double shifted temperature for TSP plot and TS-PTA, °C |
| V | Velocity, m/s |
| W | Mass flow, kg/h |
| Z | Elevation, m |
Subscripts
| CV | Control valve |
| CW | Cooling water |
| DES | Destination |
| E | Elevation |
| f | Friction |
| G | Generation |
| H | Header |
| HE | Heat exchanger |
| l | Liquids |
| P | Piping |
| r | Return |
| S | Steam |
| s | Supply |
| SH | Sub-header |
| t | Target |
| U | Utilisation |
Conflicts of Interest
References
- Klemeš, J.J.; Varbanov, P.S.; Kravanja, Z. Recent developments in process integration. Chem. Eng. Res. Des. 2013, 91, 2037–2053. [Google Scholar] [CrossRef]
- Polley, G.T.; Panjehshahi, M.H.; Jegede, F.O. Pressure drop considerations in the retrofit of heat exchanger networks. Chem. Eng. Res. Des. 1990, 68, 211–220. [Google Scholar]
- Ciric, A.M.; Floudas, C.A. A mixed integer nonlinear programming model for retrofitting heat-exchanger networks. Ind. Eng. Chem. Res. 1990, 29, 239–251. [Google Scholar] [CrossRef]
- Hui, C.W.; Ahmad, S. Minimum cost heat recovery between separate plant regions. Comput. Chem. Eng. 1994, 18, 711–728. [Google Scholar] [CrossRef]
- Sorsak, A.; Kranvanja, Z. Simultaneous MINLP synthesis of heat and power integrated heat exchanger network. Comput. Chem. Eng. Suppl. 1999, S143–S147. [Google Scholar] [CrossRef]
- Yee, T.F.; Grossman, I.E. Simultaneous optimisation models for heat integration—II. Heat exchanger network synthesis. Comput. Chem. Eng. 1990, 14, 1165–1184. [Google Scholar] [CrossRef]
- Nie, X.R.; Zhu, X.X. Heat exchanger network retrofit considering pressure drop and heat transfer enhancement. AIChE J. 1999, 45, 1239–1254. [Google Scholar] [CrossRef]
- Panjaeshahi, M.H.; Tahouni, N. Pressure optimisation in debottlenecking of heat exchanger networks. Energy 2008, 33, 942–951. [Google Scholar] [CrossRef]
- Soltani, H.; Shafiei, S. Heat exchanger networks retrofit with considering pressure drop by coupling genetic algorithm with LP (linear programming) and ILP (integer linear programming) methods. Energy 2011, 36, 2381–2391. [Google Scholar] [CrossRef]
- Zhu, X.X.; Nie, X.R. Pressure drop considerations for heat exchanger network grassroots design. Comput. Chem. Eng. 2002, 26, 1661–1676. [Google Scholar] [CrossRef]
- Chew, K.H.; Klemeš, J.J.; Wan Alwi, S.R.; Abdul Manan, Z. Industrial implementation issues of Total Site Heat Integration. Appl. Therm. Eng. 2013, 61, 17–25. [Google Scholar] [CrossRef]
- Liew, P.Y.; Wan Alwi, S.R.; Klemeš, J.J. Total Site Heat Integration targeting algorithm incorporating plant layout issues. Comput. Aided Chem. Eng. 2014, 33, 1801–1806. [Google Scholar]
- Klemeš, J.J.; Dhole, V.R.; Raissi, K.; Perry, S.J.; Puigjaner, L. Targeting and design methodology for reduction of fuel, power and CO2 on total sites. Appl. Therm. Eng. 1997, 17, 993–1003. [Google Scholar] [CrossRef]
- Spirax Sarco. Available online: spiraxsarco.com/resources/steam-engineering-tutorials/steam-distribution/pipes-and-pipe-sizing.asp (accessed on 23 September 2014).
- Flow of Fluids through Valves, Fittings and Pipe; Technical Paper No. 410; Crane Co.: Chicago, IL, USA, 1988.
- Aspen-HYSYS (Version 2006) (computer software); AspenTech: Burlington, MA, USA, 2014.
- Gas Processing Supplier Association (GPSA). Fluid flow and piping. In GPSA Engineering Data Book, 11th ed.; GPSA: Tulsa, OK, USA, 1998; Volume 17, pp. 1–28. [Google Scholar]
- Smith, R. Chemical Process—Design and Integration; McGraw-Hill: New York, NY, USA, 2005. [Google Scholar]
- Choudhury, A.A.S.; Nwaoha, C.; Vishwasrao, S.V. Process Plant Equipment: Operation, Control and Reliability; Holloway, M.D., Nwaoha, C.N., Onyewuenyi, O.A., Eds.; Wiley: New York, NY, USA, 2012; pp. 9–15. [Google Scholar]
- Chew, K.H.; Klemeš, J.J.; Wan Alwi, S.R.; Manan, Z.A. Process Modifications to Maximise Energy Savings in Total Site Heat Integration. Appl. Therm. Eng. 2014. [Google Scholar] [CrossRef]
- Klemeš, J.J. Industry-academia partnership. Clean Technol. Environ. Policy 2013, 15, 861–862. [Google Scholar] [CrossRef]
© 2015 by the authors; licensee MDPI, Basel, Switzerland. This article is an open access article distributed under the terms and conditions of the Creative Commons Attribution license (http://creativecommons.org/licenses/by/4.0/).
Share and Cite
Chew, K.H.; Klemeš, J.J.; Alwi, S.R.W.; Manan, Z.A.; Reverberi, A.P. Total Site Heat Integration Considering Pressure Drops. Energies 2015, 8, 1114-1137. https://doi.org/10.3390/en8021114
Chew KH, Klemeš JJ, Alwi SRW, Manan ZA, Reverberi AP. Total Site Heat Integration Considering Pressure Drops. Energies. 2015; 8(2):1114-1137. https://doi.org/10.3390/en8021114
Chicago/Turabian StyleChew, Kew Hong, Jiří Jaromír Klemeš, Sharifah Rafidah Wan Alwi, Zainuddin Abdul Manan, and Andrea Pietro Reverberi. 2015. "Total Site Heat Integration Considering Pressure Drops" Energies 8, no. 2: 1114-1137. https://doi.org/10.3390/en8021114