Article

EROI Analysis for Direct Coal Liquefaction without and with CCS: The Case of the Shenhua DCL Project in China

1
School of Business Administration, China University of Petroleum (Beijing), Beijing 102249, China
2
China National Oil and Gas Exploration and Development Corporation, Beijing 100034, China
3
Weichai Power Co., Ltd., Weifang 261000, China
*
Author to whom correspondence should be addressed.
Energies 2015, 8(2), 786-807; https://doi.org/10.3390/en8020786
Submission received: 2 December 2014 / Accepted: 14 January 2015 / Published: 23 January 2015
(This article belongs to the Special Issue Carbon Capture and Storage (CCS): Bio-Energy vs Fossil Fuels)

Abstract

:
Currently, there are considerable discrepancies between China’s central government and some local governments in attitudes towards coal to liquids (CTL) technology. Energy return on investment (EROI) analysis of CTL could provide new insights that may help solve this dilemma. Unfortunately, there has been little research on this topic; this paper therefore analyses the EROI of China’s Shenhua Group Direct Coal Liquefaction (DCL) project, currently the only DCL commercial project in the world. The inclusion or omission of internal energy and by-products is controversial. The results show that the EROIstnd without by-product and with internal energy is 0.68–0.81; the EROIstnd (the standard EROI) without by-product and without internal energy is 3.70–5.53; the EROIstnd with by-product and with internal energy is 0.76–0.90; the EROIstnd with by-product and without internal energy is 4.13–6.14. Furthermore, it is necessary to consider carbon capture and storage (CCS) as a means to control the CO2 emissions. Considering the added energy inputs of CCS at the plant level, the EROIs decrease to 0.65–0.77, 2.87–3.97, 0.72–0.85, and 3.20–4.40, respectively. The extremely low, even negative, net energy, which may be due to high investments in infrastructure and low conversion efficiency, suggests CTL is not a good choice to replace conventional energy sources, and thus, Chinese government should be prudent when developing it.
Keywords:
EROI; Shenhua; DCL; CTL; CCS; China

1. Introduction

Coal liquefaction, currently termed coal to liquids (CTL) [1], is a chemical process for producing synthetic transportation fuels from coal to replace or supplement conventional supplies of diesel oil and gasoline derived largely from petroleum [2]. Technologically, there are two primary routes for CTL production—direct coal liquefaction (DCL) and the Fischer–Tropsch (F–T) processes, also called indirect coal liquefaction (ICL) [3]. It is generally believed that DCL processes are more efficient than ICL—60% (the ratio of energy produced including coal and gas to energy outputs including gasoline, diesel, propane, butane) compared to 50%–55%—but also require higher quality coal and are more complicated [
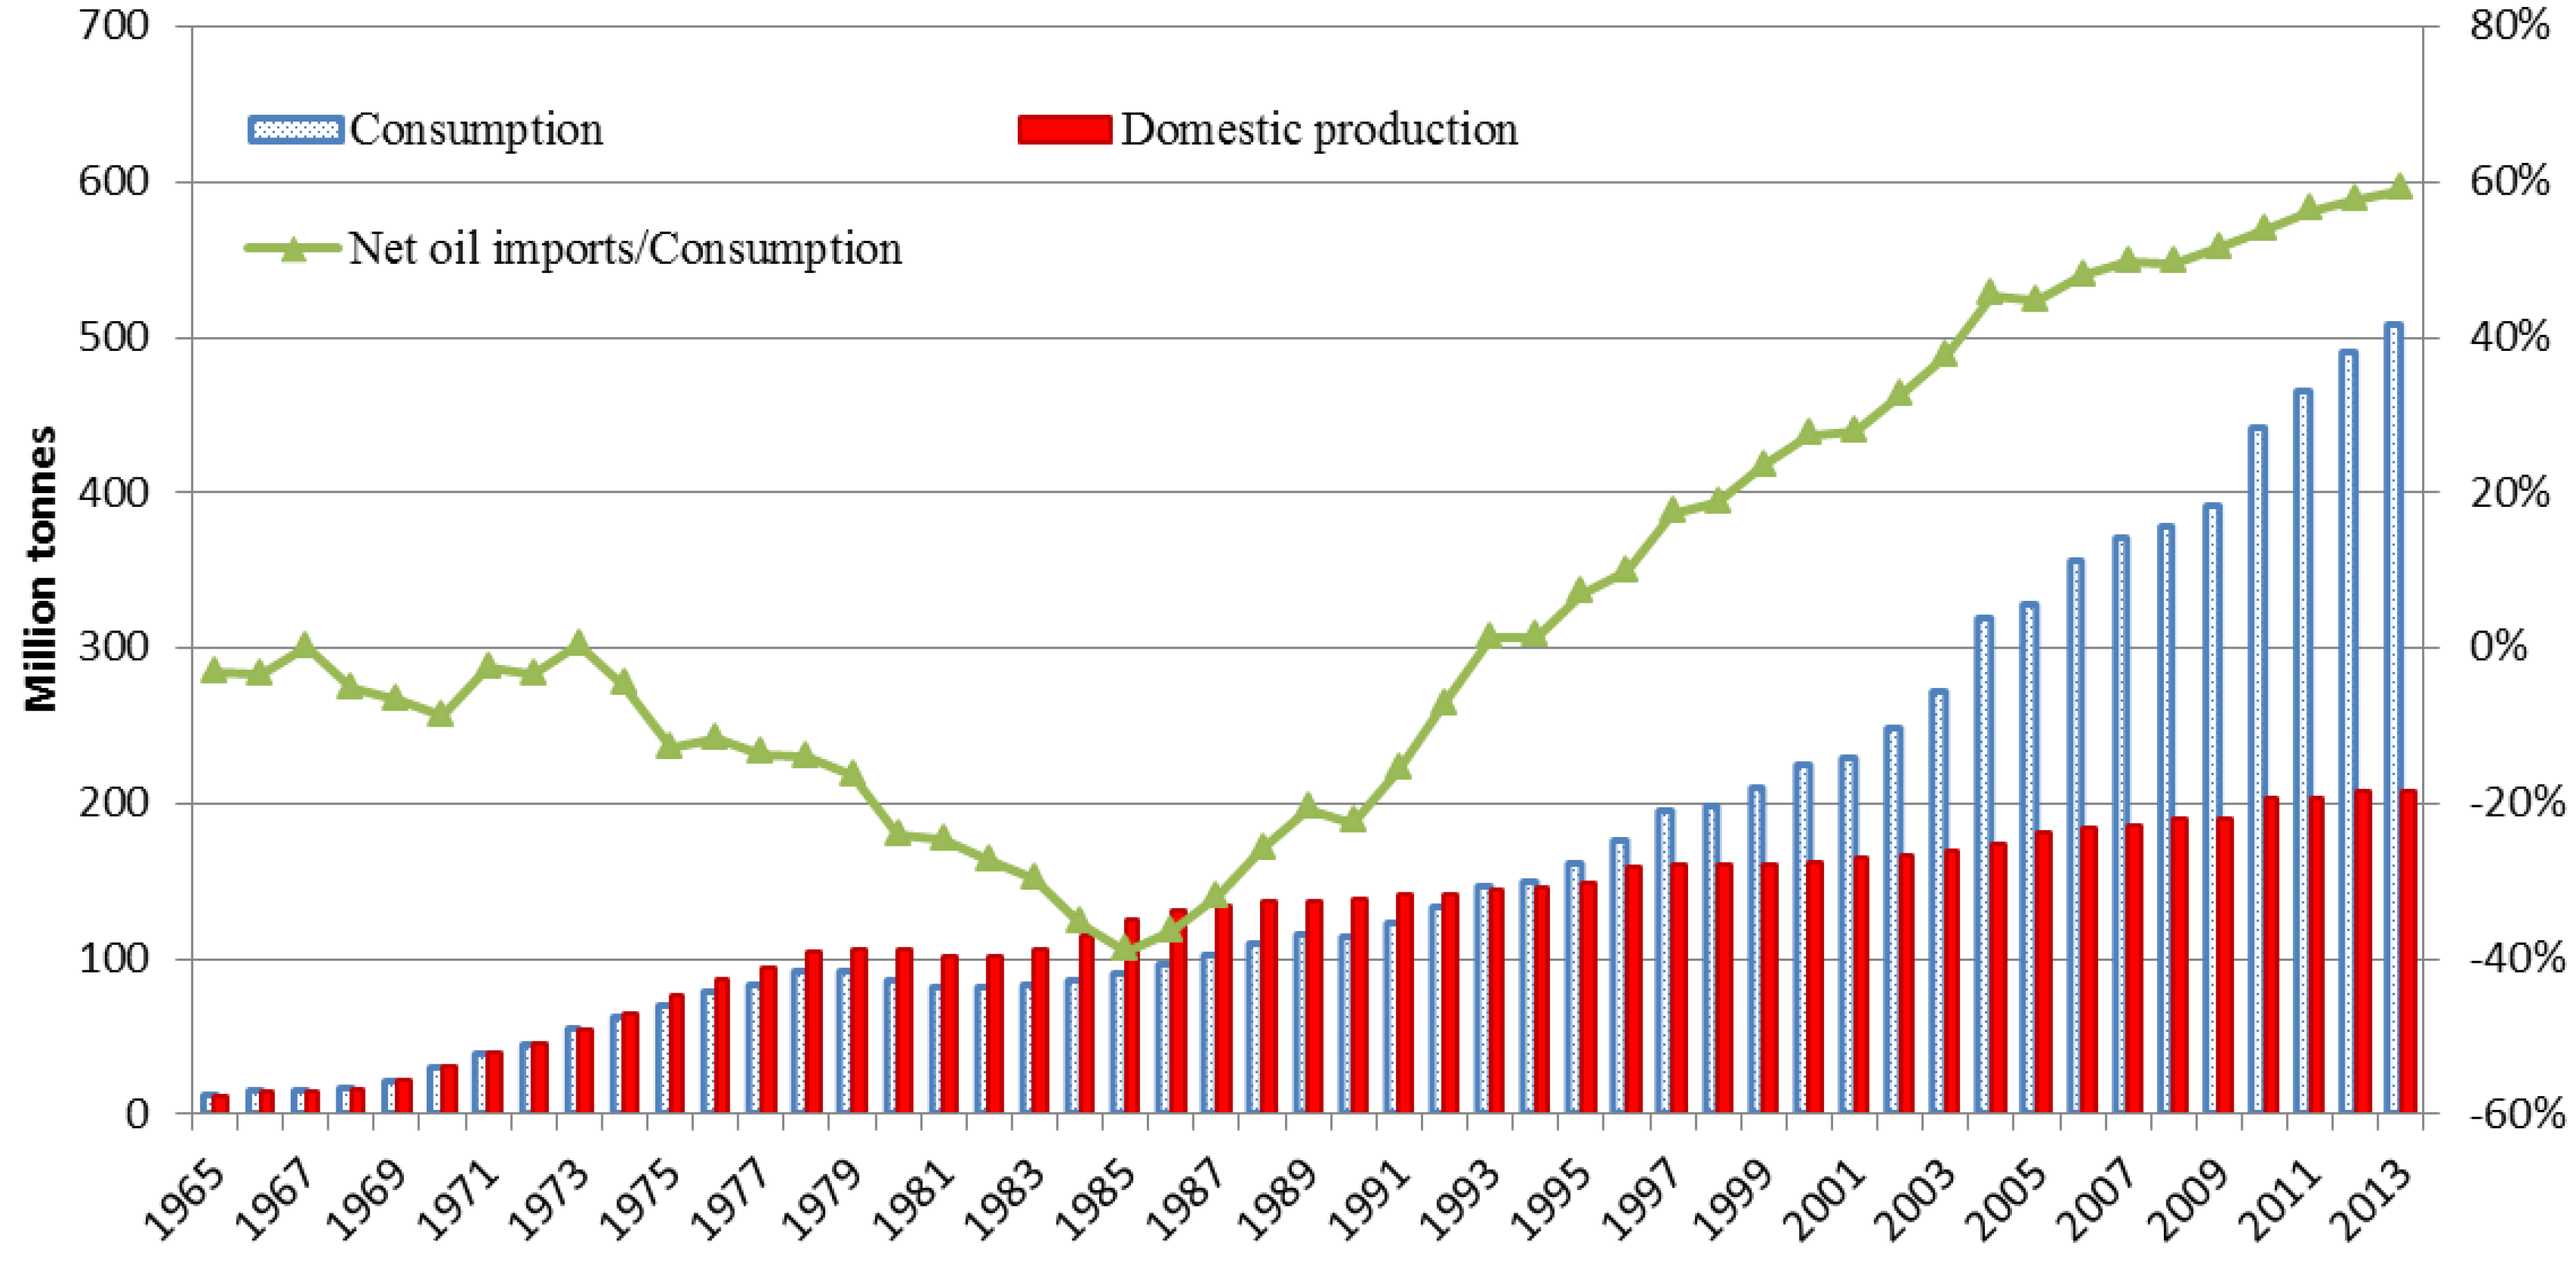
3]. With its rapidly growing demand for transportation fuels, along with its scant domestic oil and natural gas resources coupled with abundant coal, China has been actively pursuing coal liquefaction technology since the 1950s [
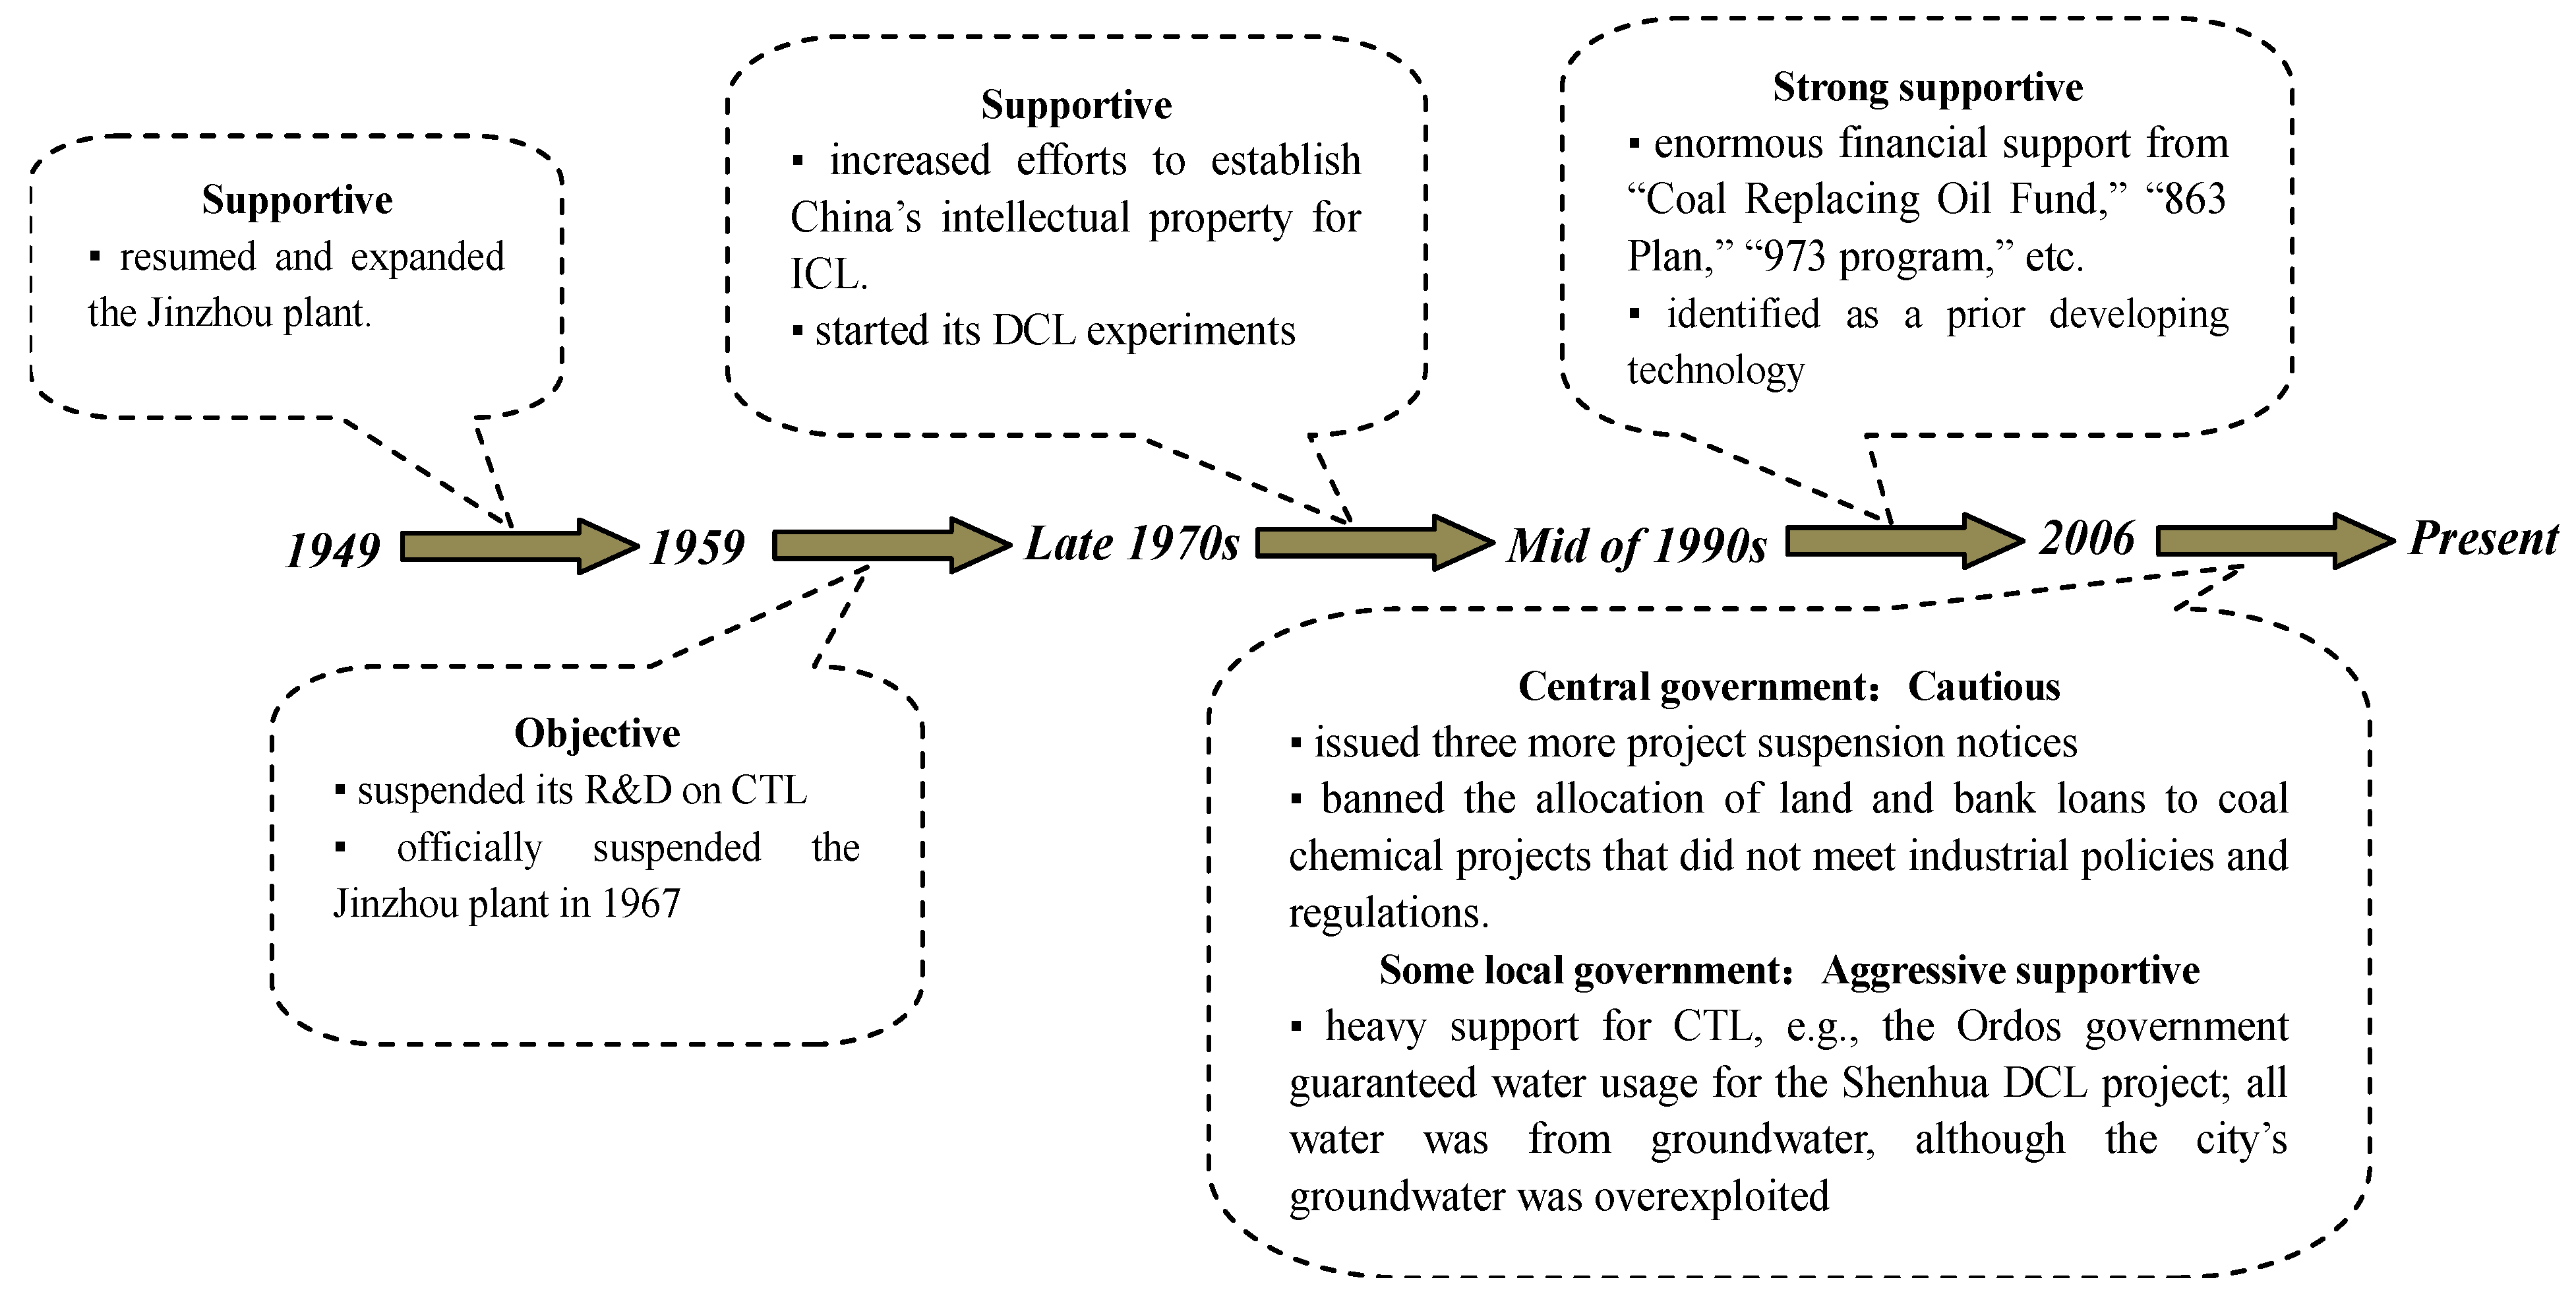
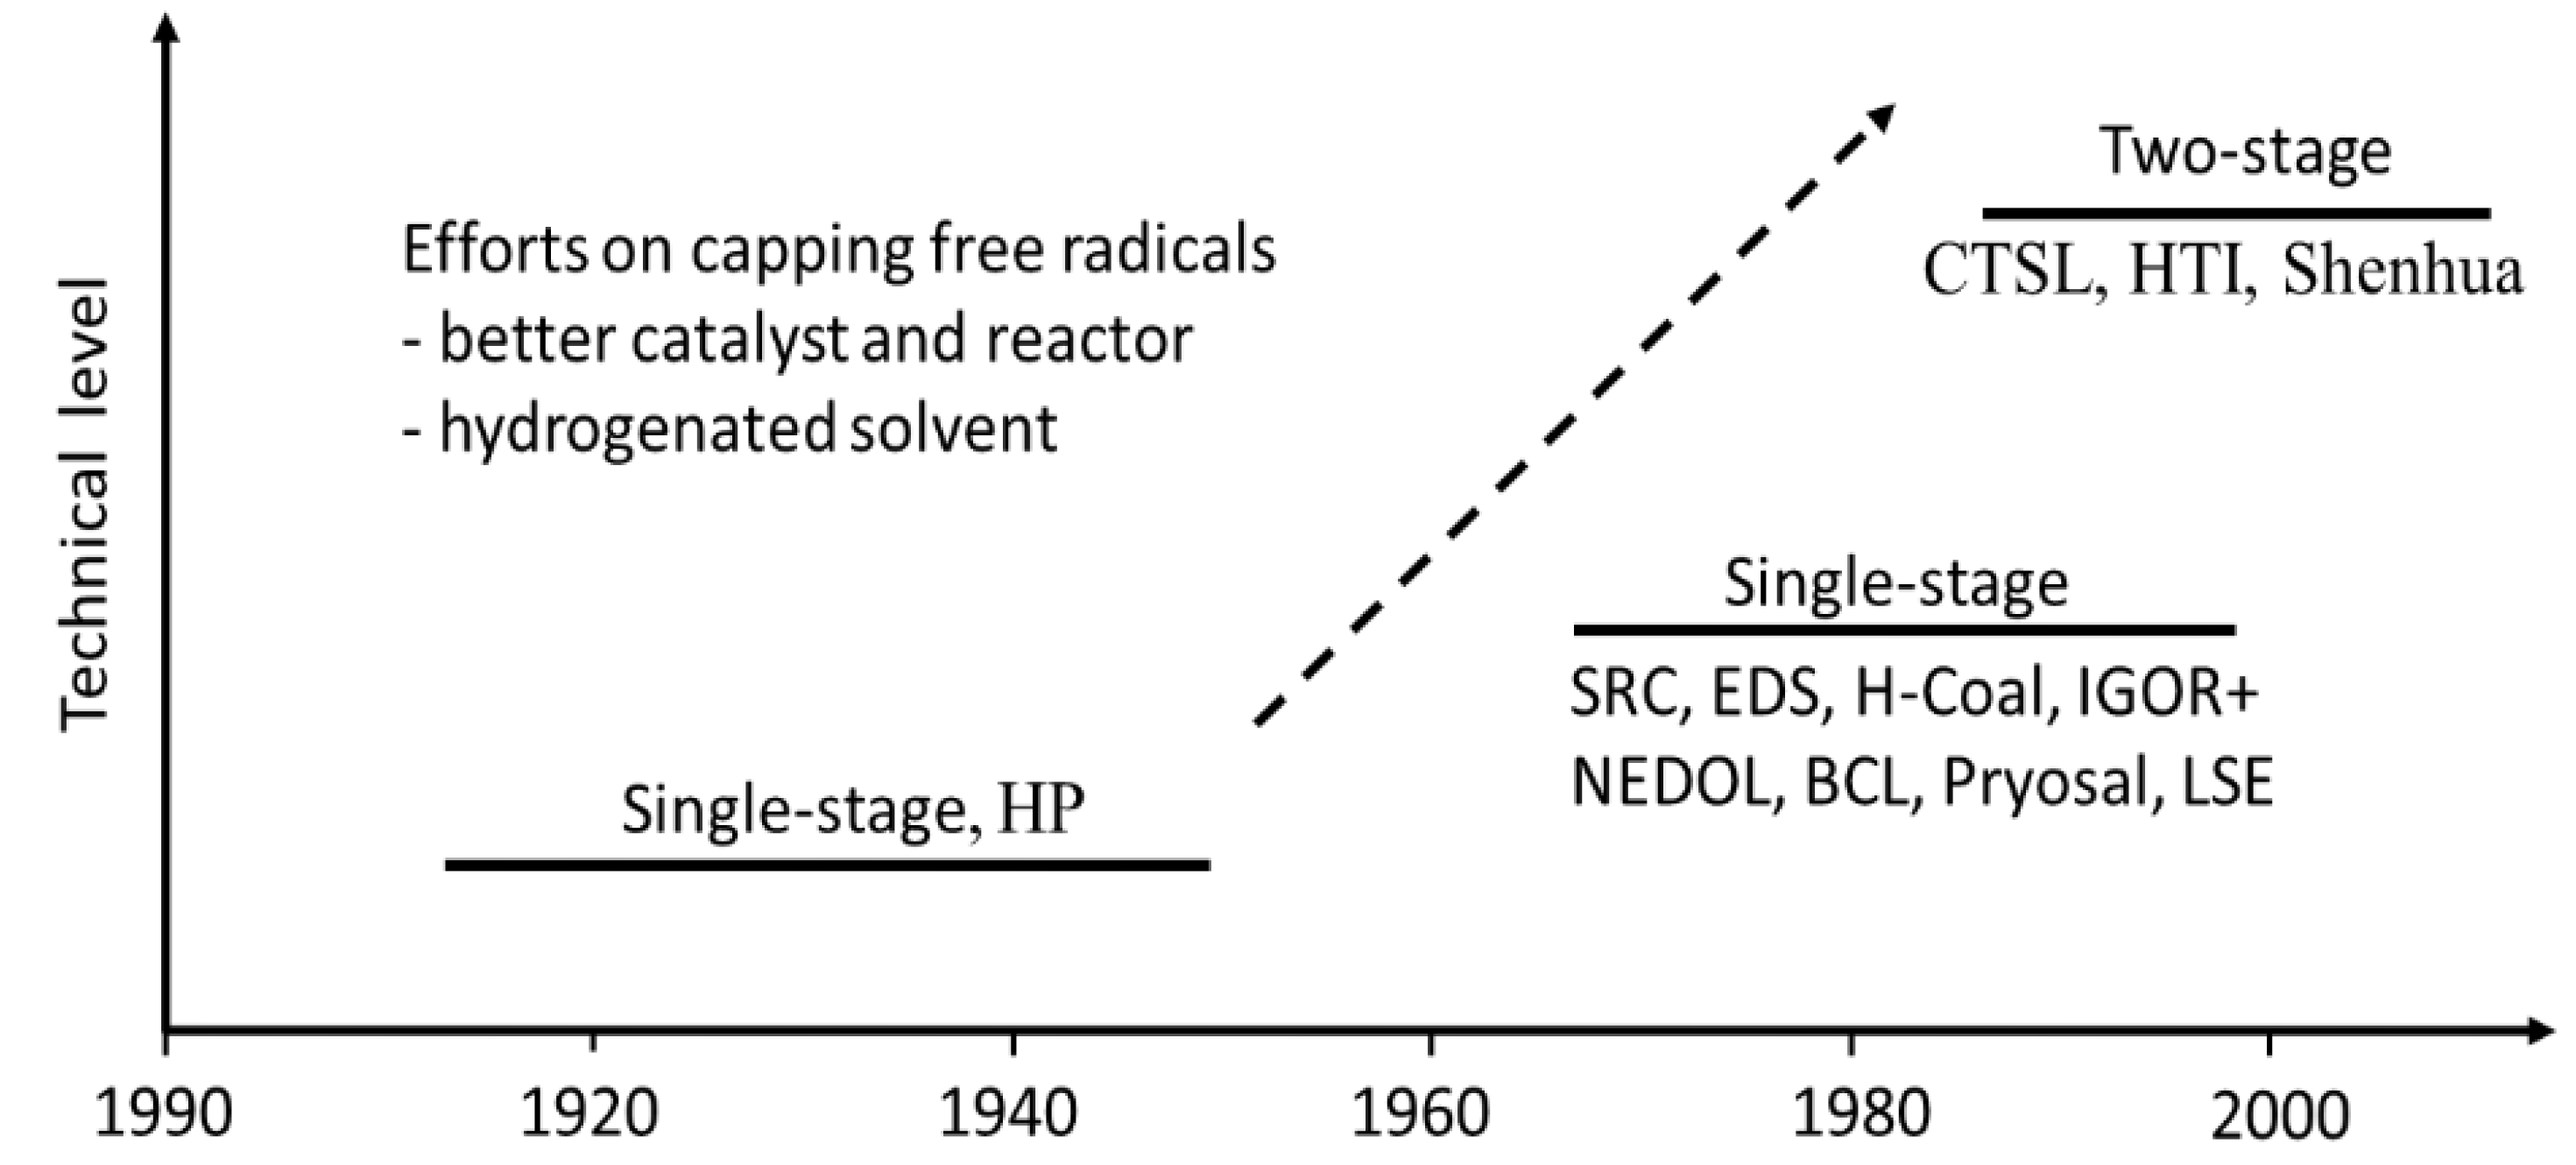
3]. However, CTL is controversial. Historically, the central government’s support for coal liquefaction has been highly uneven and volatile because its priorities have changed over time (Figure 1). Particularly, since 2006, there have been considerable discrepancies in attitudes towards CTL between the central government and some local governments. Whereas the central government restricts the development of the CTL industry, citing business risks, water scarcity, CO2 emissions and other environmental concerns, local governments in coal-rich regions cannot wait to enter the industry because doing so could create much-needed jobs and contribute to GDP (Gross Domestic Product) growth [3]. Thus, it is evident that China is facing a dilemma—should the government vigorously support the development of the CTL industry?
Figure 1. Key milestones in attitudes towards China’s coal liquefaction policy from 1949 through the present.
Energies 08 00786 g001
Currently, to answer this question, most research uses the common strategy of taking a conventional techno-economic analysis approach, such as the input-output method, to analyse the economics of CTL [4]. EROI analysis, which reflects the amount of energy that can actually be delivered [5], is a useful approach for assessing the desirability of an energy source [6]. Unfortunately, the peer-reviewed literature has paid only minimal attention to the EROI of CTL production [7]. For example, Cleveland [8] mentions the EROI for a coal liquefaction range above and below the break-even point (EROI = 1), depending on assumptions regarding location, resource quality, and technology characterisation. Farrell and Brandt [9] claim that the Shell CTL process yielded an EROI of 3.5 based on direct energy inputs, whereas Alberta [10] estimates roughly that the EROI for CTL is approximately 4:1. The two aforementioned studies suffer from two disadvantages regarding the EROI of CTL.
One disadvantage is that although these studies address ICL, none of them discusses DCL. The main reason for this neglect is that DCL technologies are less mature than ICL technologies, and thus, information available in the public domain is limited [11,12,13]. The other disadvantage is that the studies did not consider the effect of carbon mitigation technologies on EROI. Highly carbon-intensive CTL processes are not compatible with a progressive climate policy strategy, and as such, climate policy should receive more attention when developing CTL processes.
This paper seeks to analyse systematically the EROI of China’s Shenhua Group (Shenhua) Direct Coal Liquefaction Project, the only commercial demonstration project in the world since World War II [14] to operate both with and without carbon capture and storage (CCS). Shenhua is one of the largest energy companies in China, and it is the world’s largest coal producer. The Chinese National Council provided approximately $1.3 billion US from the Coal Replacement for Oil Fund to Shenhua to initiate DCL development in 1998 [3,15]. In 2009, Shenhua completed the world’s first modern commercial DCL facility in Ordos, Inner Mongolia, a facility that can produce nearly 1 million tonnes of oil products per year, which is equivalent to approximately 25,000 barrels of oil per day [15]. In China, the Shenhua DCL project is much more effective than others (including ICL projects), thus its EROI has a significant reference value for policy makers.

2. EROI Methodology

EROI, a tool used in net analysis, is a simple but powerful way to examine the quality of an energy resource. What is most relevant to our economies is the net energy flow (not the gross) provided by the energy sector, and this flow can be estimated using the EROI approach. EROI can broadly be described as the ratio between the energy made available to society through a certain process and the energy inputs to implement this process [16,17]. The general equation for EROI is given in Equation (1) [6]:
EROI =   Energy output to society Required energy input
The numerator is the summation of all energy produced for a given timeframe, and the denominator is the sum of the energy inputs. EROI is typically calculated without discounting for time. Because the numerator and denominator are usually assessed in the same units, the ratio derived is dimensionless and often expressed as x: 1 in text [17], e.g., 10:1. This implies that a particular process yields 10 joules on an investment of 1 joule (or Kcal per Kcal or barrels per barrel).
Some previous EROI analyses have generated a wide variety of results, including apparently conflicting results, when applied to the same energy resource. The reasons for these differences are not limited to intrinsic variations in energy resource quality, extraction technology, and varying geology but also include methodological issues including different boundaries of analysis, different methods used to estimate indirect energy inputs (including monetary expenditure converted into energy using different assumptions), and issues related to energy quality, e.g., whether different forms of energies should be weighted differently because of different physical characteristics and different economic utility (e.g., electricity versus coal) [18].
To formalise the analysis of EROI, Mulder and Hagens [19] established a consistent theoretical framework for EROI analysis that encompasses the various methodologies presented in the extant literature. Murphy et al. [20] proposed a more explicit two-dimensional framework for EROI analysis that describes three boundaries for energy analysis (extraction, processing, and end use) and five levels of energy inputs (direct energy inputs, indirect energy inputs, indirect labour consumption, auxiliary services consumption, and environmental consumption). The result is 15 versions of EROI.
Because most EROI analyses account for both direct and indirect energy inputs, but not for labour or environmental costs, Murphy et al. [20] deem this boundary to be the standard EROI and assign it the name “EROIstnd”. Using the standard calculation, we have the following equation:
EROI stnd = E o E d   +   E i
Where Eo is joules of all energy outputs expressed in the same units and Ed and Ei represent the total input and direct input, respectively, of different types of energy. The challenge is that the indirect energy inputs are rarely available as physical energy units. Rather, the data are available in monetary units as, e.g., investments in industrial equipment. Thus, we employ Equation (3) to complete the EROI analysis:
EROI stnd = E o E d   +   M i × E ins
Where Mi represents the indirect inputs in monetary terms and Eins expresses the energy intensity of a dollar input for indirect components.
Other approaches (e.g., including labour) can be conducted as sensitivity analyses, which will examine how changing variables affect the outcome. If both environmental and indirect energy inputs are considered, then EROI1,i+env and so on. The critical point is to clarify what is included in the analysis [20].

3. The EROI of DCL

3.1. System Boundary

The decision regarding system boundaries is perhaps the most important decision made in an EROI analysis [16]. In the past, the use of different boundaries with respect to different research objectives has resulted in significantly different findings, even when applied to the same energy resource [5].
The equation for calculating EROI is sometimes applied to finding energy, sometimes applied for producing energy, and most usually and appropriately applied to both [21]. However, it should not be used to compute conversion efficiency, i.e., going from one form of energy to another, such as upgrading petroleum in a refinery or converting diesel to electricity [17,20,22]. Accordingly, this paper discusses the overall DCL process chain from coal extraction to coal transportation to coal liquefaction to the main output of the process (Figure 2), which is diesel.
Self-use or internal energy is an important issue in the assessment of EROI. In the Shenhua DCL project, middle coal, oil residue, and tail gas that are produced in coal liquefaction are burned in the combustor of a captive power plant to create electricity that meets on-site electricity requirements, plus a modest amount of additional electricity that is exported to the electricity grid [2,13]. From a net energy perspective, however, the question is whether the analysts should credit internal energy as an energy input and thus include it in the denominator of the EROI. Energy analysts debate this point [16,23]. Some argue that these internally generated fuels should not be counted as an energy input because they do not have an opportunity cost—society did not give something up to create these fuels—unlike the electricity that a CTL facility purchases from the grid. Conversely, the internal energy generated by the process is literally used to perform useful work and, thus, is an essential expenditure of energy to produce the desired liquid fuel [16,20]. Considering the controversy with respect to internal energy, this paper calculates EROIstnd both with and without internal energy. It is also noted that EROI without internal energy is similar to external energy return [24].
Figure 2. The system boundary of the Shenhua DCL production system.
Energies 08 00786 g002
In addition, energy systems also have external costs, most notably in the form of environmental and human health costs, which are sometimes difficult to assess in energy terms [16]. The greenhouse gases that are released in the DCL process have adverse effects on the environment. In this paper (Section 4), we consider the change in EROI caused by the added energy inputs of CCS technology to control the emissions of CO2, which is one of the main greenhouse gases.

3.2. Energy Outputs

Energy output data are obtained from “The First Phase of the China Shenhua Group Direct Coal Liquefaction Project” [25]. Table 1 lists the number of all types of energy products and by-products per ten thousand tonnes (excluding electricity) of DCL. The main energy products include diesel, gasoline, electricity and liquefied petroleum gas (LPG), all of which are directly converted to heat units using the values in Table 2. By-products include naphtha, benzene, xylene, and phenol. Since the inclusion of by-product as an output is debatable, this paper would present the outcomes of the EROI analysis both with the by-products and without [26]. The by-products are converted into heat units through the prices (Table 3) and through industrial energy intensity, which was approximately 3.5 MJ/yuan in 2013 [27].
Table 1. Primary energy outputs per 10,000 tonnes of DCL products and our conversion to MJ [25].
OutputQuantityUnitOutput (MJ)Output type
Diesel6,674t276,303,600–288,984,200energy
Gasoline1,618t68,765,000–72,486,400energy
LPG176t7,884,800–9,187,200energy
Electricity276kWh966–1,021energy
Naphtha966t27,098,405by-product
Benzene188t4,520,736by-product
Xylene344t8,106,839by-product
Phenol34t769,678by-product
Total without by-productt352,954,366–370,658,821
Total with by-product393,450,024–411,154,479
Table 2. Conversion factors from physical units to thermal units [28,29].
FuelAverage calorific value
Raw coal16.0–24.5 M joule/kg
Cleaned coal26.0–29.1 M joule/kg
Gasoline42.5–44.8 M joule/kg
Diesel41.4–43.3 M joule/kg
LPG44.8–52.2 M joule/kg
Electricity (in calorific value)3.5–3.7 M joule/kWh
Oil residue39.8–41.7 M joule/kg
Table 3. Prices of some products and raw materials in 2013.
By-products and raw materialsPrice (yuan/t)
Benzene6,867
Xylene6,729
Phenol6,500
Naphtha8,013
Sulphur1,254
Sulphide7,000
Liquid ammonia3,164
Iron sulphate2,500
Water4

3.3. Energy Inputs

Table 4 lists the number of inputs—including fuel, raw materials, and other costs—to produce ten thousand tonnes of DCL products. Energy inputs in accordance with the DCL production phases are divided into three categories—energy investment in coal extraction, energy investment in coal transportation, and energy investment in coal liquefaction.
Energy investment in coal extraction: Because Shenhua does not conduct an explicit accounting of energy consumption during the process of coal mining, we estimate the energy investment by using the average EROI of coal mining in China as estimated by Hu et al. [18]. To produce ten thousand tonnes of DCL products, 36,646.9 tonnes of raw coal must be consumed [25], which is equivalent to 765,920,324 MJ. The calculation of Hu et al. suggests that China’s EROI with respect to coal production is in the range of 27:1–35:1 [30,31,32,33,34,35,36,37,38,39]. According to Equation (1), we can determine that the total energy inputs of coal production are approximately 16,752,869–42,754,717 MJ.
Table 4. Primary energy inputs per 10,000 tonnes of DCL products and our conversion to MJ [25].
InputQuantityUnitInput (MJ)Input type
Coal production16,752,869–42,754,717Eextern
Coal transportation36,646.90t5,414,579–7,723,334Eextern
Coal liquefaction
Edirect
Fuel coal3,789t98,514,000–110,259,900Eintern
Oil residue5,684t226,223,200–237,022,800Eintern
Fuel gas1,454t65,139,200–75,898,800Eintern
Purchased electricity847kWh2,965–3,134Eextern
Ematerial
Sulphur16t70,224Eextern
Sulphide11t269,500Eextern
liquid ammonia15t166,110Eextern
Iron sulphate896t7,840,000Eextern
Water59,408t831,712Eextern
Eindirect
Equipment and instrument purchase10,185,355yuan35,648,743Eextern
Total (with internal energy)456,873,102–518,488,974
Total (without internal energy)66,996,702–95,307,474
Energy investment in coal transportation: Coal consumed by the Shenhua DCL project is obtained from the Shenfu coalfield, currently the largest coalfield in China. The average distance that raw coal moves from coalmine to the DCL plant is approximately 75 km [22]. As shown in Figure 3, the range of energy consumption of truck powered by gasoline in China is 1.97–2.81 MJ/tonnekilometers [30,31,32,33,34,35,36,37,38,39]. The amount of coal transported is 36,646.9 tonnes. Therefore, the energy inputs of coal transportationare about 5,414,579–7,723,334 MJ, which is equal to the transport distance multiplied by the average transport costs and then multiplied by transport volume.
Energy investment in coal liquefaction: The energy input data for coal liquefaction were also derived from “The First Phase of the China Shenhua Group Direct Coal Liquefaction Project” [25]. There are three types of energy inputs—fuel inputs, raw material inputs, and other costs. Fuel inputs (fuel coal, oil residue, fuel gas, and purchased electricity) are converted directly into heat units using the conversion factor (Table 2). Raw material inputs (sulphur, sulphide, liquid ammonia, iron sulphate, and water) are converted to joules through the amount of raw material multiplied by the price and then multiplied by industrial energy intensity. Other costs (purchase of equipment and instrument) are converted to physical quantities by industrial energy intensity.
Figure 3. Energy consumption of truck powered by gasoline in China [30,31,32,33,34,35,36,37,38,39].
Energies 08 00786 g003
In Table 4, energy input is classified into either direct energy input (Edirect) or indirect energy input (Eindirect) and either external energy input (Eextern) or internal energy input (Eintern). Direct inputs include fuel coal, oil residue, fuel gas, and purchased electricity, whereas all others belong to indirect energy inputs. Internal inputs primarily include fuel coal (middle coal), oil residue, and fuel gas (tail gas, the main component of which is LPG), which are taken into consideration in calculating the EROI with internal energy.

3.4. Results: EROI for DCL

Our results show the EROIstnd without by-product and with internal energy is 0.68–0.81; the EROIstnd without by-product and without internal energy is 3.70–5.53; the EROIstnd with by-product and with internal energy is 0.76–0.90; the EROIstnd with by-product and without internal energy is 4.13–6.14. (Table 5). The results show that, on the one hand, the net energy of DCL is very low, or even negative, whereas on the other hand, system boundary has a significant impact on the results of net energy analysis.
Table 5. EROIstnd of the Shenhua DCL project.
EROIstndTotal energy inputs
With internal energyWithout internal energy
456,868,244–518,484,11666,991,844–95,302,616
Total Energy Outputswithout by-product352,954,366–370,658,8210.68–0.813.70–5.53
with by-product393,450,024–411,154,4790.76–0.904.13–6.14

3.5. Sensitivity Analysis

In this paper, embodied energy that each raw material or equipment includes are derived from energy intensity of the industrial sector. However, the energy intensity shows an annual variation (Figure 4), which would have some impact on EROI, so we do a sensitivity analysis by examining how the varying energy intensity of the industrial sector changes the EROIstnd value of CTL production. Our results show that the changes in the energy intensity factors do not impact the EROIstnd without by-product and with internal energy and the EROIstnd with by-product and with internal energy greatly, while they have a big impact on the EROIstnd without by-product and without internal energy and the EROIstnd with by-product and without internal energy (Figure 5).
Note that the difference between them is due to the significant difference on the ratios of embodied energy input to total energy inputs (Figure 6). When internal energy is not regarded as an energy input, the ratios increase from 10%–18% to 50%–80%, which means more energy inputs will be affected by the changes of energy intensity and the EROIstnd will be more insensitive to energy intensity.
Figure 4. Energy intensity for all industry in China [27].
Energies 08 00786 g004
Figure 5. The change of EROIstnd value caused by the varying energy intensity.
Energies 08 00786 g005
Figure 6. The ratios of embodied energy input to total energy inputs.
Energies 08 00786 g006

4. The EROI of DCL with CCS

4.1. The Necessity of Using the CCS Technology

CTL processes generate synthetic liquid fuels such as gasoline and diesel fuel from coal. A major concern, however, is the large emissions of CO2 from the process, which add to the burden of atmospheric greenhouse gases [4,40]. When all CO2 generated at the conversion plant is vented into the atmosphere, fuel-cycle-wide GHG (Greenhouse Gas) emissions from DCL-derived fuels are also high compared to making fuels from crude oil, although there is considerable uncertainty regarding these emissions [13]. In 2009, Farrell and Brandt [9] claimed that over its life cycle, liquid fuel from coal emits almost double the amount of CO2 compared to conventional liquid fuels derived from crude oil. In the same year, studies by the U.S. Environmental Protection Agency estimated that CTL without CCS could more than double the life-cycle greenhouse gas emissions compared to those of conventional petroleum-derived fuels [4]. In 2010, Vallentin [41] mentioned that DCL generates approximately 90% more CO2 than conventional fuel on a well-to-wheel basis.
CTL processes are highly carbon intensive and therefore incompatible with a progressive climate policy strategy [40]. As the leading consumer of coal-derived energy and the leading emitter of CO2, China is facing increasing international pressure to reduce emissions and commit to long-term reductions under the post-Kyoto framework [15]. In November 2009, the Chinese government proclaimed a mitigation target that proposed that CO2 emission per capita GDP in 2020 would be reduced by 40% to 45% based on the 2005 level [42]. Therefore, it may be necessary for CTL enterprises to implement some carbon mitigation technologies to reduce their greenhouse gas emissions.
One partial solution is carbon capture and storage (CCS) because it could place some of the additional upstream CO2 emissions from CTL production in deep underground locations that receive long-term monitoring [9] and could significantly lower total emissions (reductions of up to 50% for CTL) [9]. CCS is expected to be the second-most-important emission reduction technology by 2050, surpassed only by energy efficiency improvements [15]. It is also considered the only option that can provide long-term GHG mitigation while allowing for continued large-scale use of the existing fossil infrastructure and abundant fossil energy resources [15]. Because climate change considerations are motivating factors for China’s development of CCS mitigation options, it is likely that in China, any future application to establish a CTL plant will require the inclusion of CCS mitigation technology [12] in response to both improving scientific understanding of damage caused by air pollution and growing public concerns about environmental quality as incomes rise [13].

4.2. Results: EROI for DCL with CCS

CCS is one efficient method of reducing CO2 emissions. However, introducing CO2 capture techniques to a coal-based chemical process requires greater investment and energy consumption. For example, a power plant equipped with a CCS system (with access to geological or ocean storage) would require approximately 10% to 40% more energy than a plant of equivalent output without CCS, of which most is for capture and compression [43]. Because the added energy inputs would have a negative impact on EROI, it will be necessary to expand the energy input level and consider the environmental cost.
Full life-cycle accounting of carbon dioxide emissions associated with DCL plants should tabulate emissions associated with mining, transportation, plant operations, and final consumption [10]. Due to data limits, this paper only considers the energy inputs of reducing plant-level emissions by using the CCS technology. The major components of the CCS system include capture (separation plus compression), transport, and storage (including measurement, monitoring, and verification) [43]. Accordingly, CCS energy inputs include capture transportation and storage energy inputs (Table 6).
Table 6. Costs of CCS per t CO2 and our conversion to MJ.
InputQuantityUnitInput (MJ)Input type
CO2 capture
Electricity53.5kWh187.25–197.95Edirect
Recycled water24yuan84Eindirect
Instrument air2.5yuan8.75Eindirect
Labor costs12yuan42Eindirect
Depreciation costs23.1yuan80.85Eindirect
Maintenance costs10yuan35Eindirect
Other costs47yuan164.5Eindirect
CO2 transport13.3–23.7yuan46.6–83
CO2 storage
Electricity21.35kWh74.73–79Edirect
CO2 monitoring cost5.5yuan19.25Eindirect
Labor cost12yuan42Eindirect
Depreciation costs80.96yuan283.36Eindirect
Total1068.29–1119.66
In Table 2, CCS refers to post-combustion capture technology, pipeline transport, and deep saline aquifer storage. Capture and storage energy inputs are derived from “The Project Feasibility Study Report of Coal-to-Chemicals in China” [44]. To reflect the scale of CO2 pipeline transportation, this article assumes that the amount of CO2 transport is 500 million tonnes (Mt) annually, and the transport distance is approximately 250 kilometres (km). According to IPCC, transporting 5 Mt CO2 per year a distance of 250 km by pipeline would cost approximately $2.2–3.8 dollar/tCO2 [43]. In 2013, the exchange rate is in the range of 6.05–6.24 RMB/US (Figure 7) [45].
Figure 7. Chinese exchange rate [45].
Energies 08 00786 g007
In this paper, we derive the energy inputs for CCS according to Equation (4):
E CCS = P DCL × F DCL × C CCS × ( E C + E T + E S )
Where ECCS refers to total energy input of CCS; PDCL is the production of DCL products; FDCL is the amount of CO2 emissions per tonne of DCL products, and its unit is tCO2/t DCL products; CCCS is the capture efficiency of a current commercial CO2 capture system; and EC, ET, and ES, respectively, represent energy inputs of capture, transport and storage per tCO2 (Table 6).
In this paper, the production of DCL products was 10,000 tonnes. According to the data of the Shenhua CCS demonstration project, the emission factor is equal to 2.75 tCO2/t DCL products [45] and according to the IPCC report, CCS technology captures approximately 85% to 95% of the CO2 processed in a capture plant, where the middle value is 90% [46]. Thus, according to Equation (4), we can easily calculate the value of ECCS to be equal to 26,440,178–27,711,585 MJ. Under these circumstances, we can also determine the EROI with CCS, as shown in Table 7.
When we consider energy inputs of the CCS technology at the plant level of emissions, the EROI with internal energy decreases by 4%–6% and the EROI without internal energy decreases by 22%–28%.The inclusion or omission of by-product has also some impact on the EROI of DCL. When by-products are regarded as an energy output, both the EROIstnd and the EROI with CCS increased by 10%–12%, respectively. Since by-product is controversial, more attention should be paid to it in the future.
Table 7. EROI of the Shenhua DCL project with CCS.
EROITotal energy inputs with CCS
With internal energyWithout internal energy
483,308,421–546,195,70193,432,021–123,014,201
Total Energy Outputswithout by-product352,954,366–370,658,8210.65–0.772.87–3.97
with by-product393,450,024–411,154,4790.72–0.853.20–4.40

4.3. Sensitivity Analysis

Our results show that when we consider energy inputs of the CCS technology at the plant level of emissions, the changes in the energy intensity factors do not impact the EROI with internal energy greatly, while it has a big impact on the EROI without internal energy (Figure 8). The results are similar to the results of sensitivity analysis for EROIstnd. The main reason is that when considering the energy inputs of CCS, the different ratios of embodied energy input to total energy inputs have not changed essentially.
Figure 8. The change of EROI with CCS caused by the varying energy intensity.
Energies 08 00786 g008

5. Discussion

5.1. Comparison to Other Energy Resources

During what researchers have characterised as the post-peak oil production era [47,48], it has been necessary for societies to find some sound alternative energy resources. EROI analysis is useful for determining whether developing a new source of energy is viable from an energy balance perspective and for assessing how it compares to other investments [10]. Of course, it is useful to compare the EROI for CTL with alternative fuels. Figure 9 compares the EROI for CTL with coal, oil and gas, tar sands, oil shale, ethanol from biomass, diesel from biomass, nuclear, hydroelectric, geothermal, wind, and solar [8]. As a fuel, coal is characterised by a more favourable energy return on energy investment with a mean of approximately 46:1, whereas the mean EROI of CTL is only 2.6:1. An average EROI for crude oil stands at approximately 17:1. Thus, using CTL liquids rather than crude is far more inefficient, implying a faster drawdown of scarce energy supplies relative to what we can achieve by greatly improving the energy efficiency of transport and power production [10].
Hydroelectric energy has a much higher EROI than CTL, —84:1—and has virtually no CO2 emissions [10]. Dam power could replace power now generated by diesel, likely at a significantly lower cost, while obviating the need for new diesel sources. If a dam could be constructed in a way that preserved fish passage and minimised ecological impacts to aquatic ecosystems, it may be a far better investment than CTL for the future of energy. Replacing diesel-based electricity generation with wind, nuclear, and solar energy should receive similar scrutiny. These renewable resources also have relatively higher EROIs—18 for wind, 14 for nuclear, and 10 for solar photovoltaic—and they are truly sustainable in the long term [10]. The return to CTL is as great as that of ethanol from biomass and diesel from biomass, oil shale, and tar sands. Ethanol from grain and diesel from biomass are at or near the break-even point, even in light of substantial technical improvements during the last two decades. The EROI for tar sands and oil shale range above and below the break-even point, depending on assumptions regarding location, resource quality, and technology characterisation [8].
Figure 9. The mean EROI values for various fuel sources from published values. CTL has a mean EROI of approximately 2.6:1 (n of 19 from 4 publications, including this paper) [7,8,9]. The mean EROI values for other fuel sources are from [49,50,51].
Energies 08 00786 g009

5.2. Outlook for the EROI of CTL

It is important to stress that the EROI results for CTL presented herein cannot be simply extrapolated to the future [52]. On the one hand, technological advances are expected to continue to improve the energy return on energy investment with respect to the CTL process [52]. Moreover, in the technical field, there are two factors that influence EROI value. One is how much energy must be embodied within the equipment used to extract energy [53], because a degree of energy must be exerted to function as an energy extraction device. For instance, the foundation of a coal liquefaction reactor must successfully endure a large moment load. The other factor is how well that equipment performs the function of extracting energy from the environment. Under normal circumstances, as a technology matures, i.e., as experience is gained, the processes involved become better equipped to use fewer resources [54]. For example, reactors become more efficient and less energy intensive to produce, the catalyst preparation technique becomes more efficient, and increasing size allows for the liquefaction of economies of scale. These factors serve to increase energy returns. As presented in Figure 10, over the past 100 years, DCL technology has been in a state of constant progress, and conversion efficiency has been increasing [1]. In the future, as technologies become more efficient and their use is systematically improved through research and development [53], EROI ratios will improve for a given level of resource quality [7].
Figure 10. Developments of DCL technology [1].
Energies 08 00786 g010
On the other hand, coal is a non-renewable resource whose reserves are limited. As reserves are gradually reduced, the difficulty of extraction will increase accordingly, which means that more energy will be used for coal production. According to the study of Hu et al., the EROI for China’s coal production sector has declined from 35:1 in 1995–1997 to approximately 27:1 in 2010 (Figure 11). They further predict that the average EROIstnd for the coal production sector will be approximately 24:1 in 2020 [18]. The increasing energy requirements of coal production processes will result in decreased EROI. Furthermore, for most fuels, especially alternative fuels, energy gains are reasonably well understood but the boundaries of the denominator, especially with respect to environmental issues, are poorly understood and even more poorly quantified [22]. For example, it is incontrovertible that the negative effects of the greenhouse gas emissions caused by CTL cannot remain unaddressed much longer without an increasingly heavy toll on human societies in terms of external monetary and energy costs [52].
Figure 11. History and forecast of EROIstnd for China’s coal production sector [18].
Energies 08 00786 g011
In this paper, we only consider the costs of reducing CO2 emissions in coal liquefaction and do not include emissions from coal production and transportation. If the overall costs of a full life cycle are considered, the EROI will decline. In addition, except for environmental issues, indirect labour consumption and auxiliary services consumption are poorly understood because it is difficult to quantify them precisely. Therefore, we think that most EROIs, including those considered herein, would decline if we had complete information [22]. The interplay of all of the issues hinted at herein makes the long-term prospective analysis of the EROI of CTL an extremely complex and inherently uncertain endeavour [52]. Of course, because that issue is beyond the scope of this paper, we only propose this arbitrary conjecture to provoke thought.

5.3. Policy Implications

In Section 3, we determined the EROI value of coal liquefaction to be less than 1, which is considered low, especially given its internal energy. This low, or even negative net energy means that any increases in production will not meaningfully affect the net energy available to society and accordingly, CTL should not currently be developed on a large scale in China. In other words, the Chinese central government’s cautious attitude towards CTL production is more reasonable than that of those local governments, which support the rapid development of CTL. In Section 5.1, the comparison of EROI between CTL and other energy sources suggests that at least at the moment, when compared to CTL, nuclear power, wind power, solar, or geothermal energy may be a better choice. Even so, the government could continue to support research into coal liquefaction technology and regard it as a strategic technology reserve. This conclusion is primarily based on two considerations. First, China is the world’s second largest oil importer, second only to the US [3]. Over the last 20 years, China’s oil import dependency has increased by 21.5% annually and in 2013, it reached 59% (Figure 12). Thus, oil security has become an issue that cannot be ignored. If a crude oil import interruption occurs or the importation price increases, the economy will be seriously affected. For example, as a result of the 1973 oil shock, the world economy passed through the hitherto worst recession in post-war history [55]. With respect to the short-term difficulties of crude oil imports, CTL is at least an emergency tactic for meeting the energy needs of economic development. Second, there is a possibility to improve the EROI of CTL production in the future. As mentioned in Section 5.2, as energy efficiency and energy conversion efficiency improve, along with possible results of the technological advances in the production of CTL, applied electrical energy will decrease while energy gain will increase, thereby possibly increasing the overall value of EROI [56].
Environmental concerns, especially greenhouse gas emissions, could hinder the development of the CTL industry in oil-scarce countries [4]. Compared to traditional energy, CTL emits more greenhouse gases and does not comply with environmental requirements. Although CCS technology can be used to control carbon emissions, it will also increase energy investment, which could have a considerably negative impact on EROI. Our calculation (Section 4) indicates that when we consider the additional energy inputs of the CCS technology on plant-level emissions, the EROI both with and without internal energy decreases. In addition, the added energy inputs of CCS will make it more difficult for CTL to compete with petroleum-derived fuels than such competition is for CTL without CCS [4]. Although some aspects of CCS technology, on a global scale, currently appear mature, the technology is still in the research and demonstration phase in China [57,58]. Improving CCS technology will improve the efficiency of all aspects of the CTL process and thus lower the overall energy inputs associated with its deployment and improve its EROI [43,59]. To promote the development of CCS on a large scale, the government should gradually establish applicable national laws and regulations along with a standard infrastructure system to implement CCS projects commercially and consistent with the legislation in advanced countries. Furthermore, the government should provide more subsidies and support for the research and development of CCS-related equipment and technology [58].
Figure 12. China’s dependence on foreign oil [60].
Energies 08 00786 g012

6. Conclusions

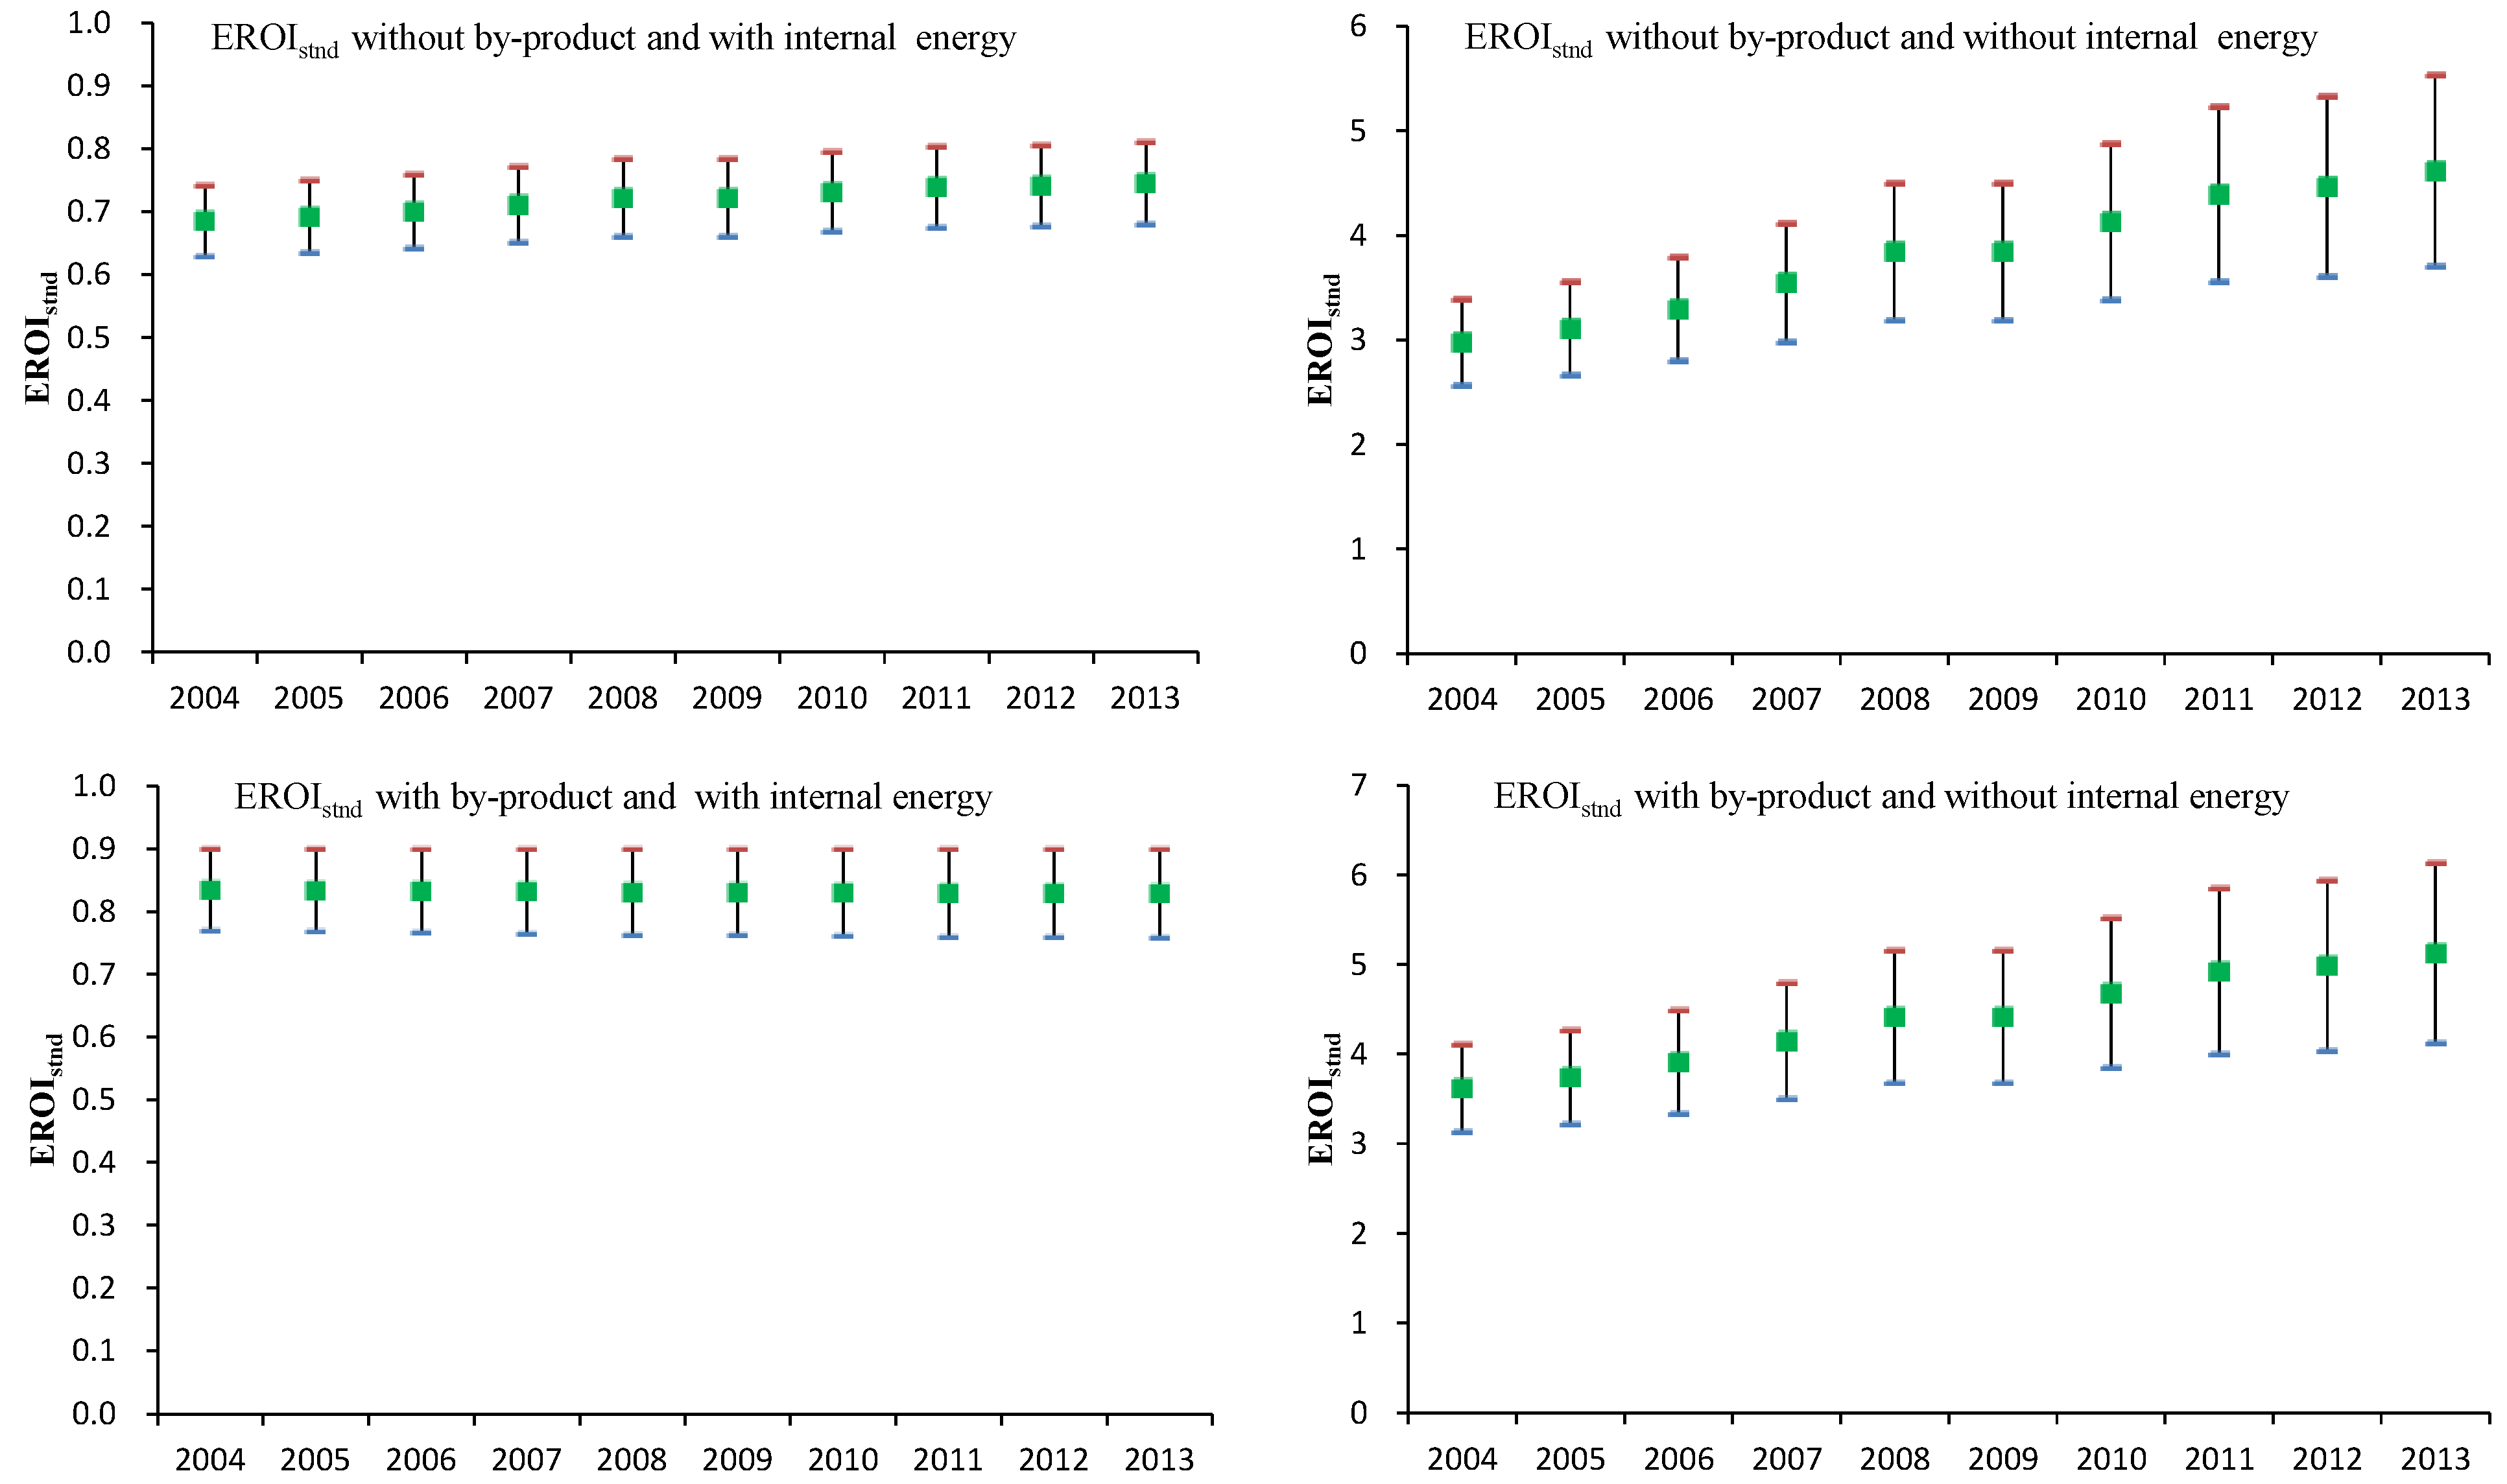
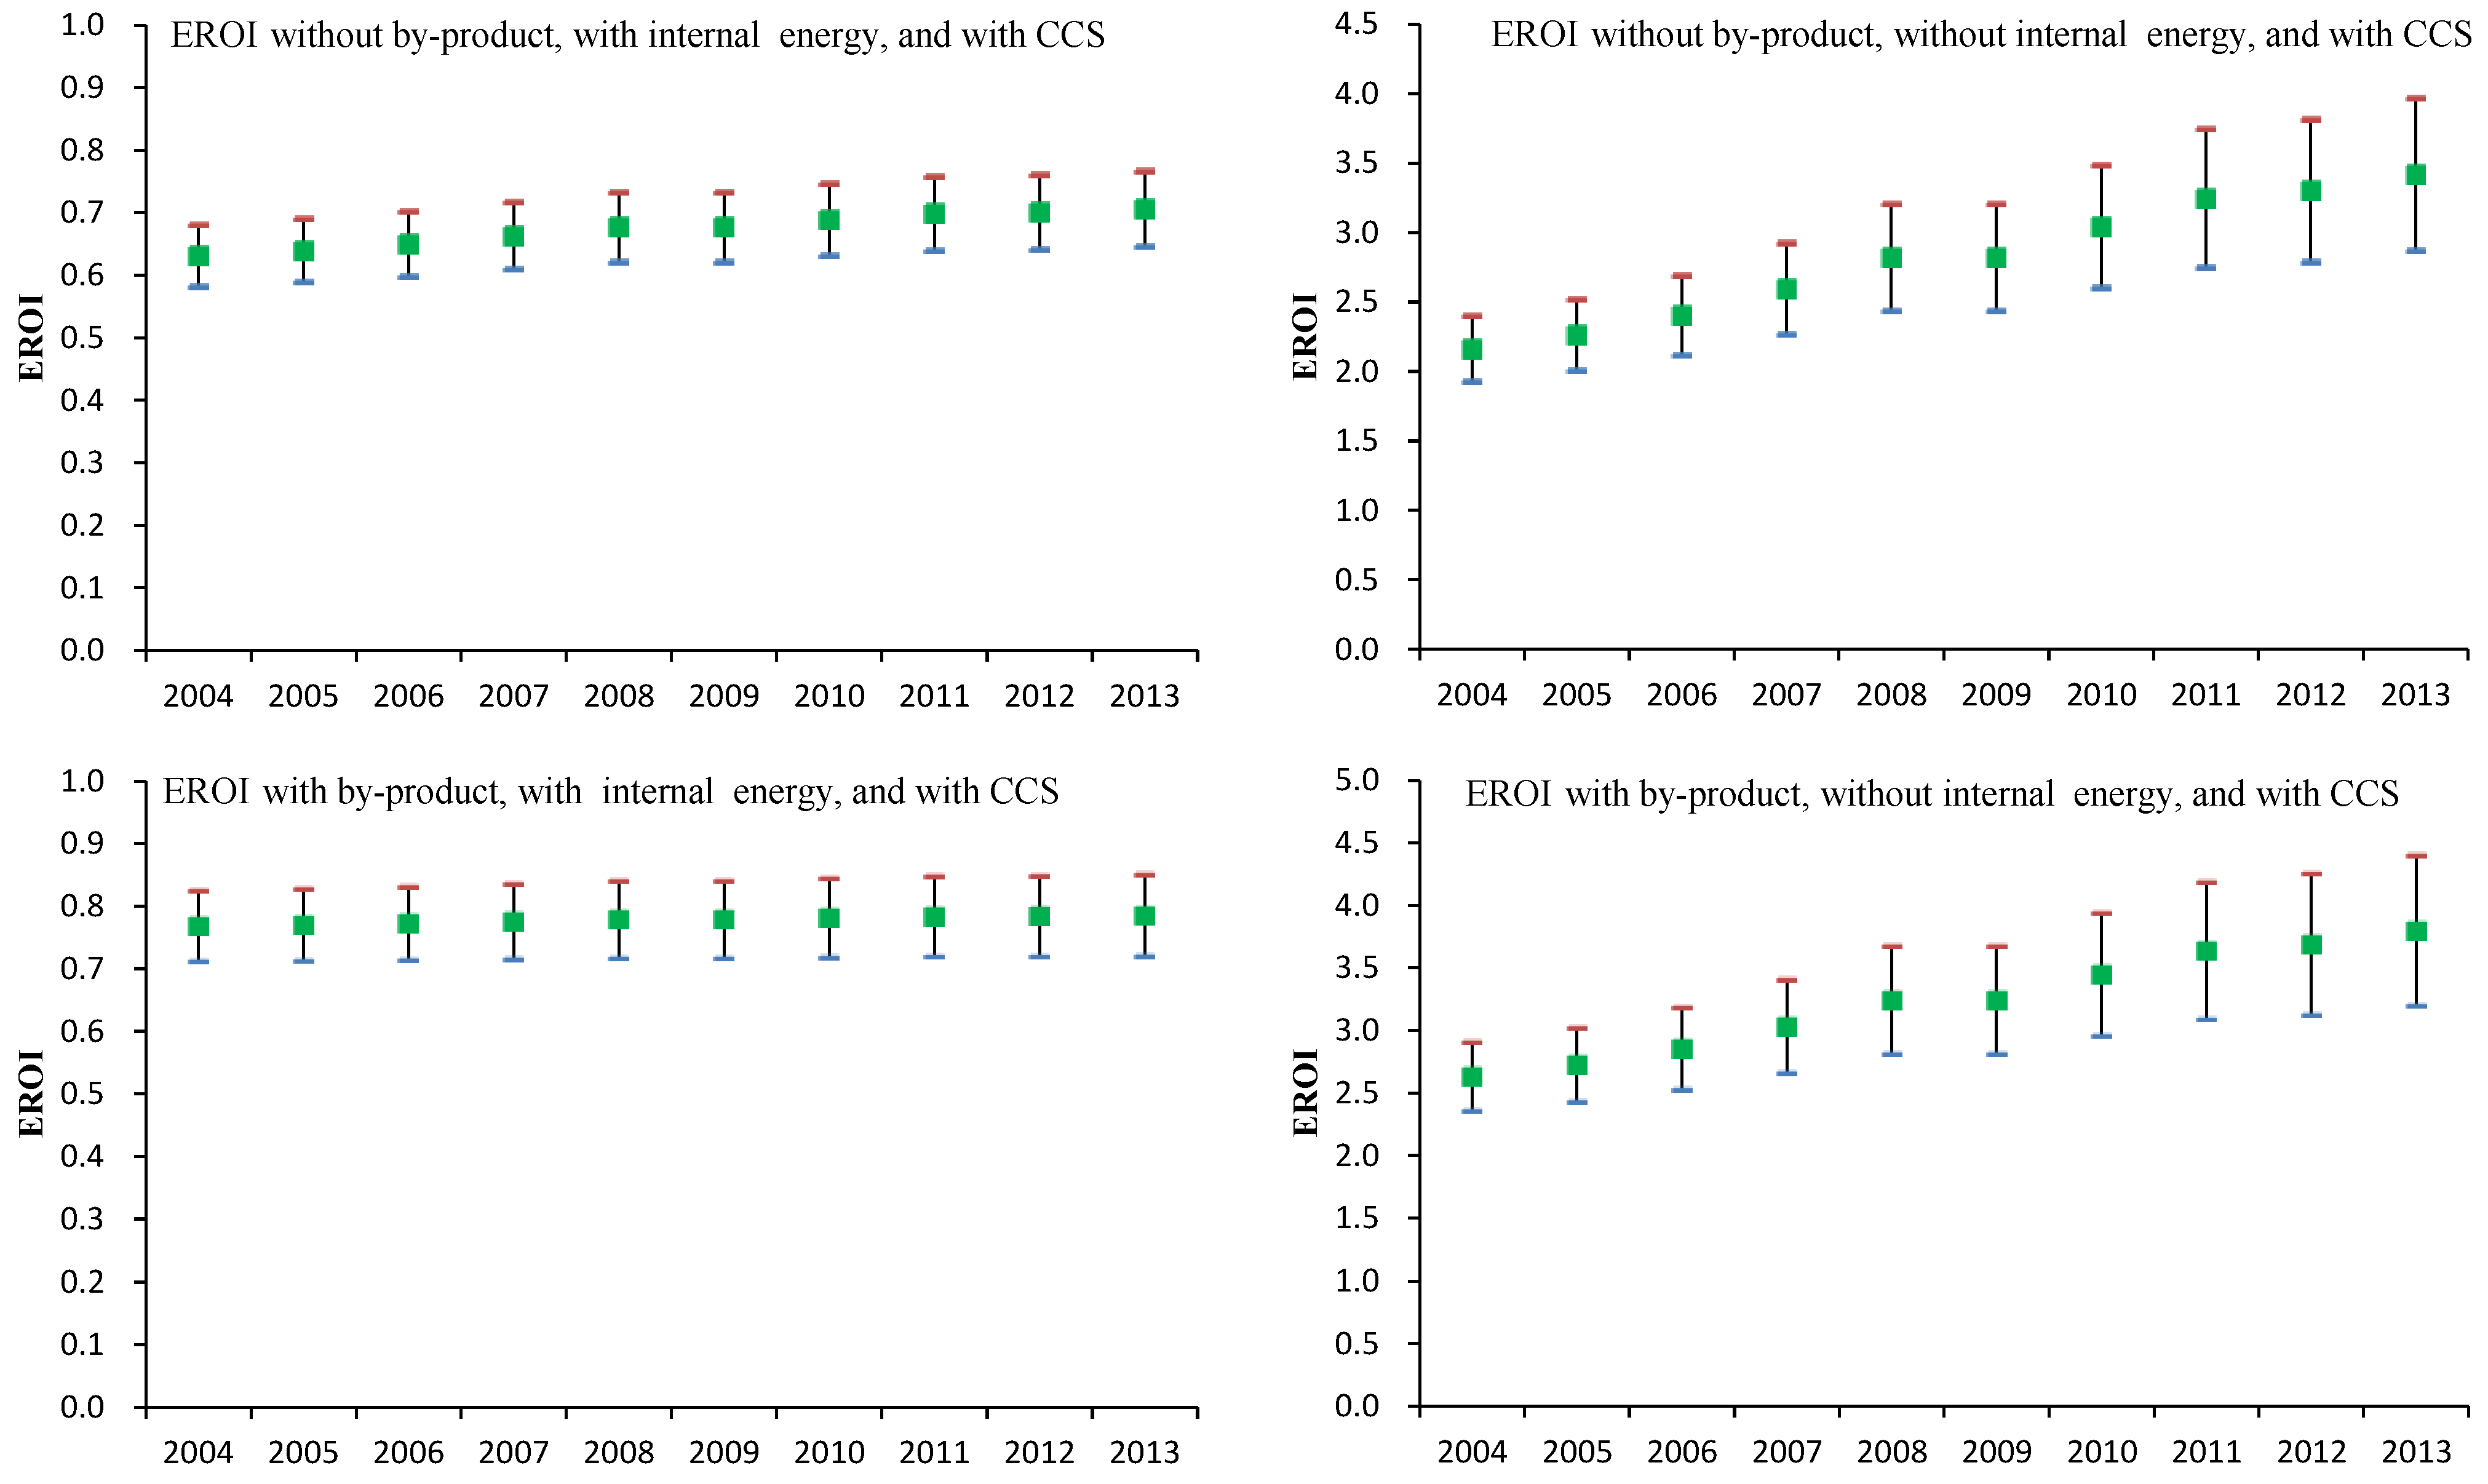
In this paper, we calculated the EROI of the Shenhua DCL project in China. The inclusion or omission of internal energy and by-product is a controversial issue. The results show that the EROIstnd without by-product and with internal energy is 0.68–0.81; the EROIstnd without by-product and without internal energy is 3.70–5.53; the EROIstnd with by-product and with internal energy is 0.76–0.90; the EROIstnd with by-product and without internal energy is 4.13–6.14. It is also important to consider that the production of CTL liquids suffers from much higher life-cycle CO2 emissions than does conventional fuel. Furthermore, it is necessary to consider CCS as a means to control the emissions [
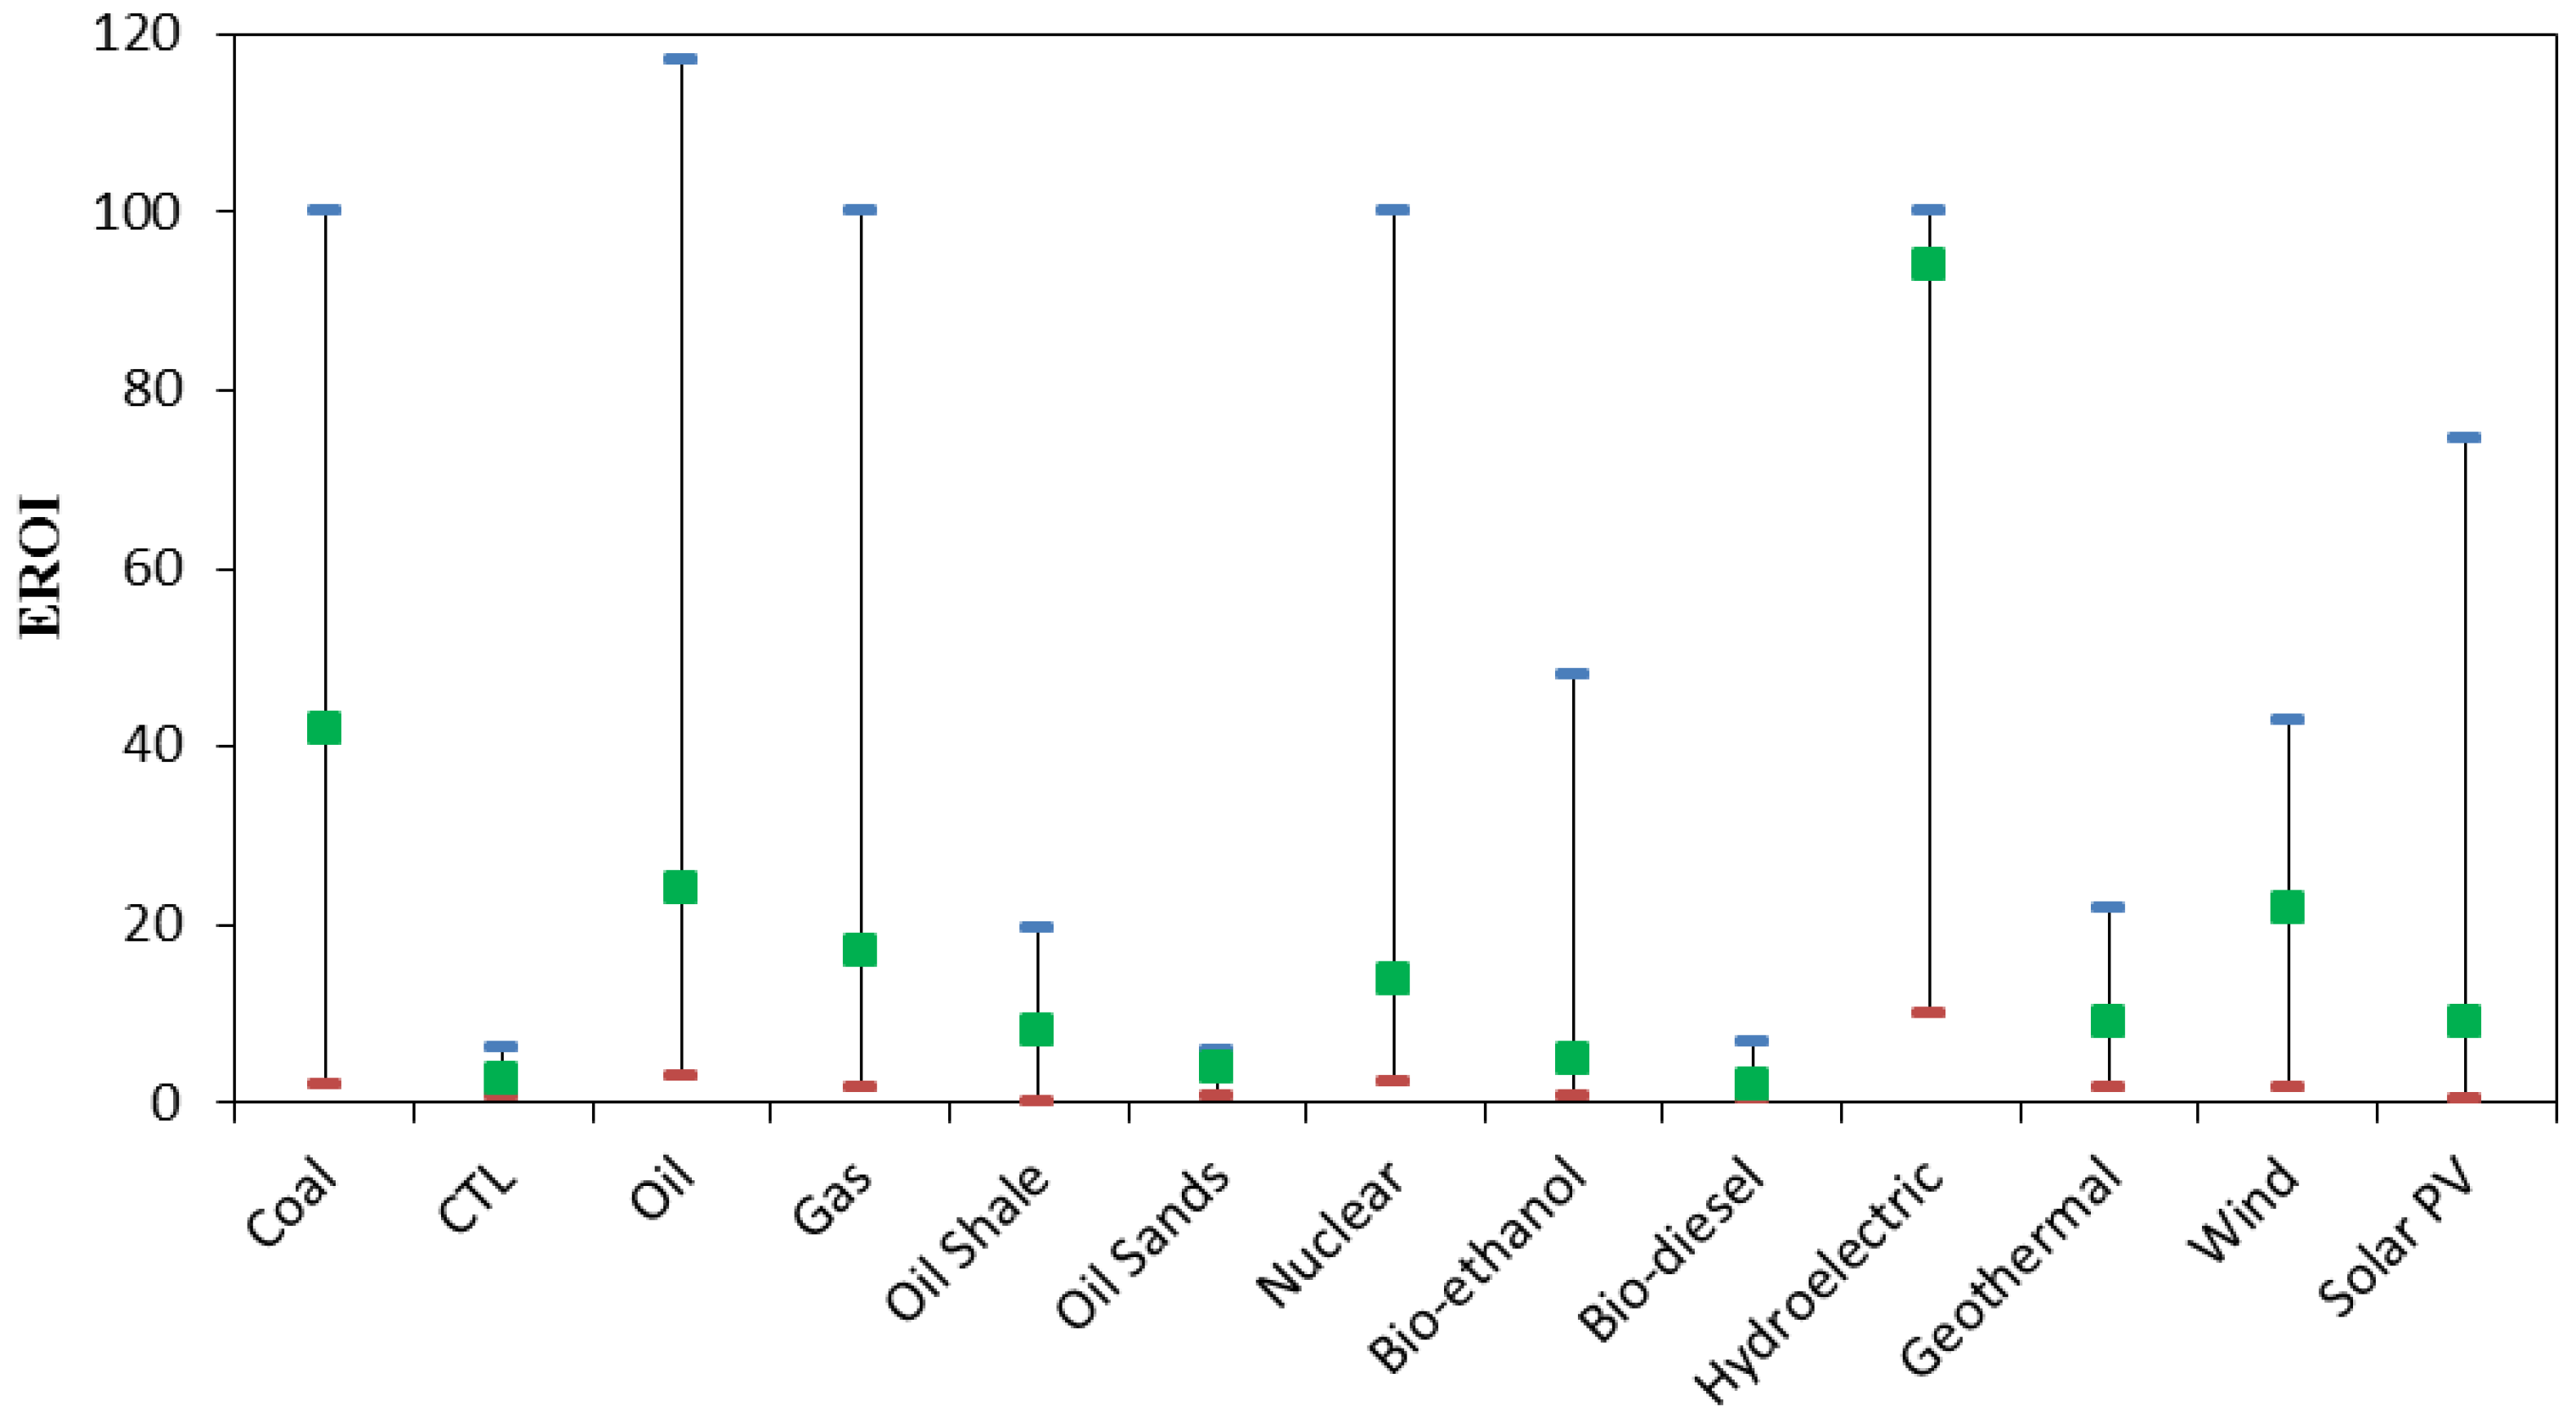
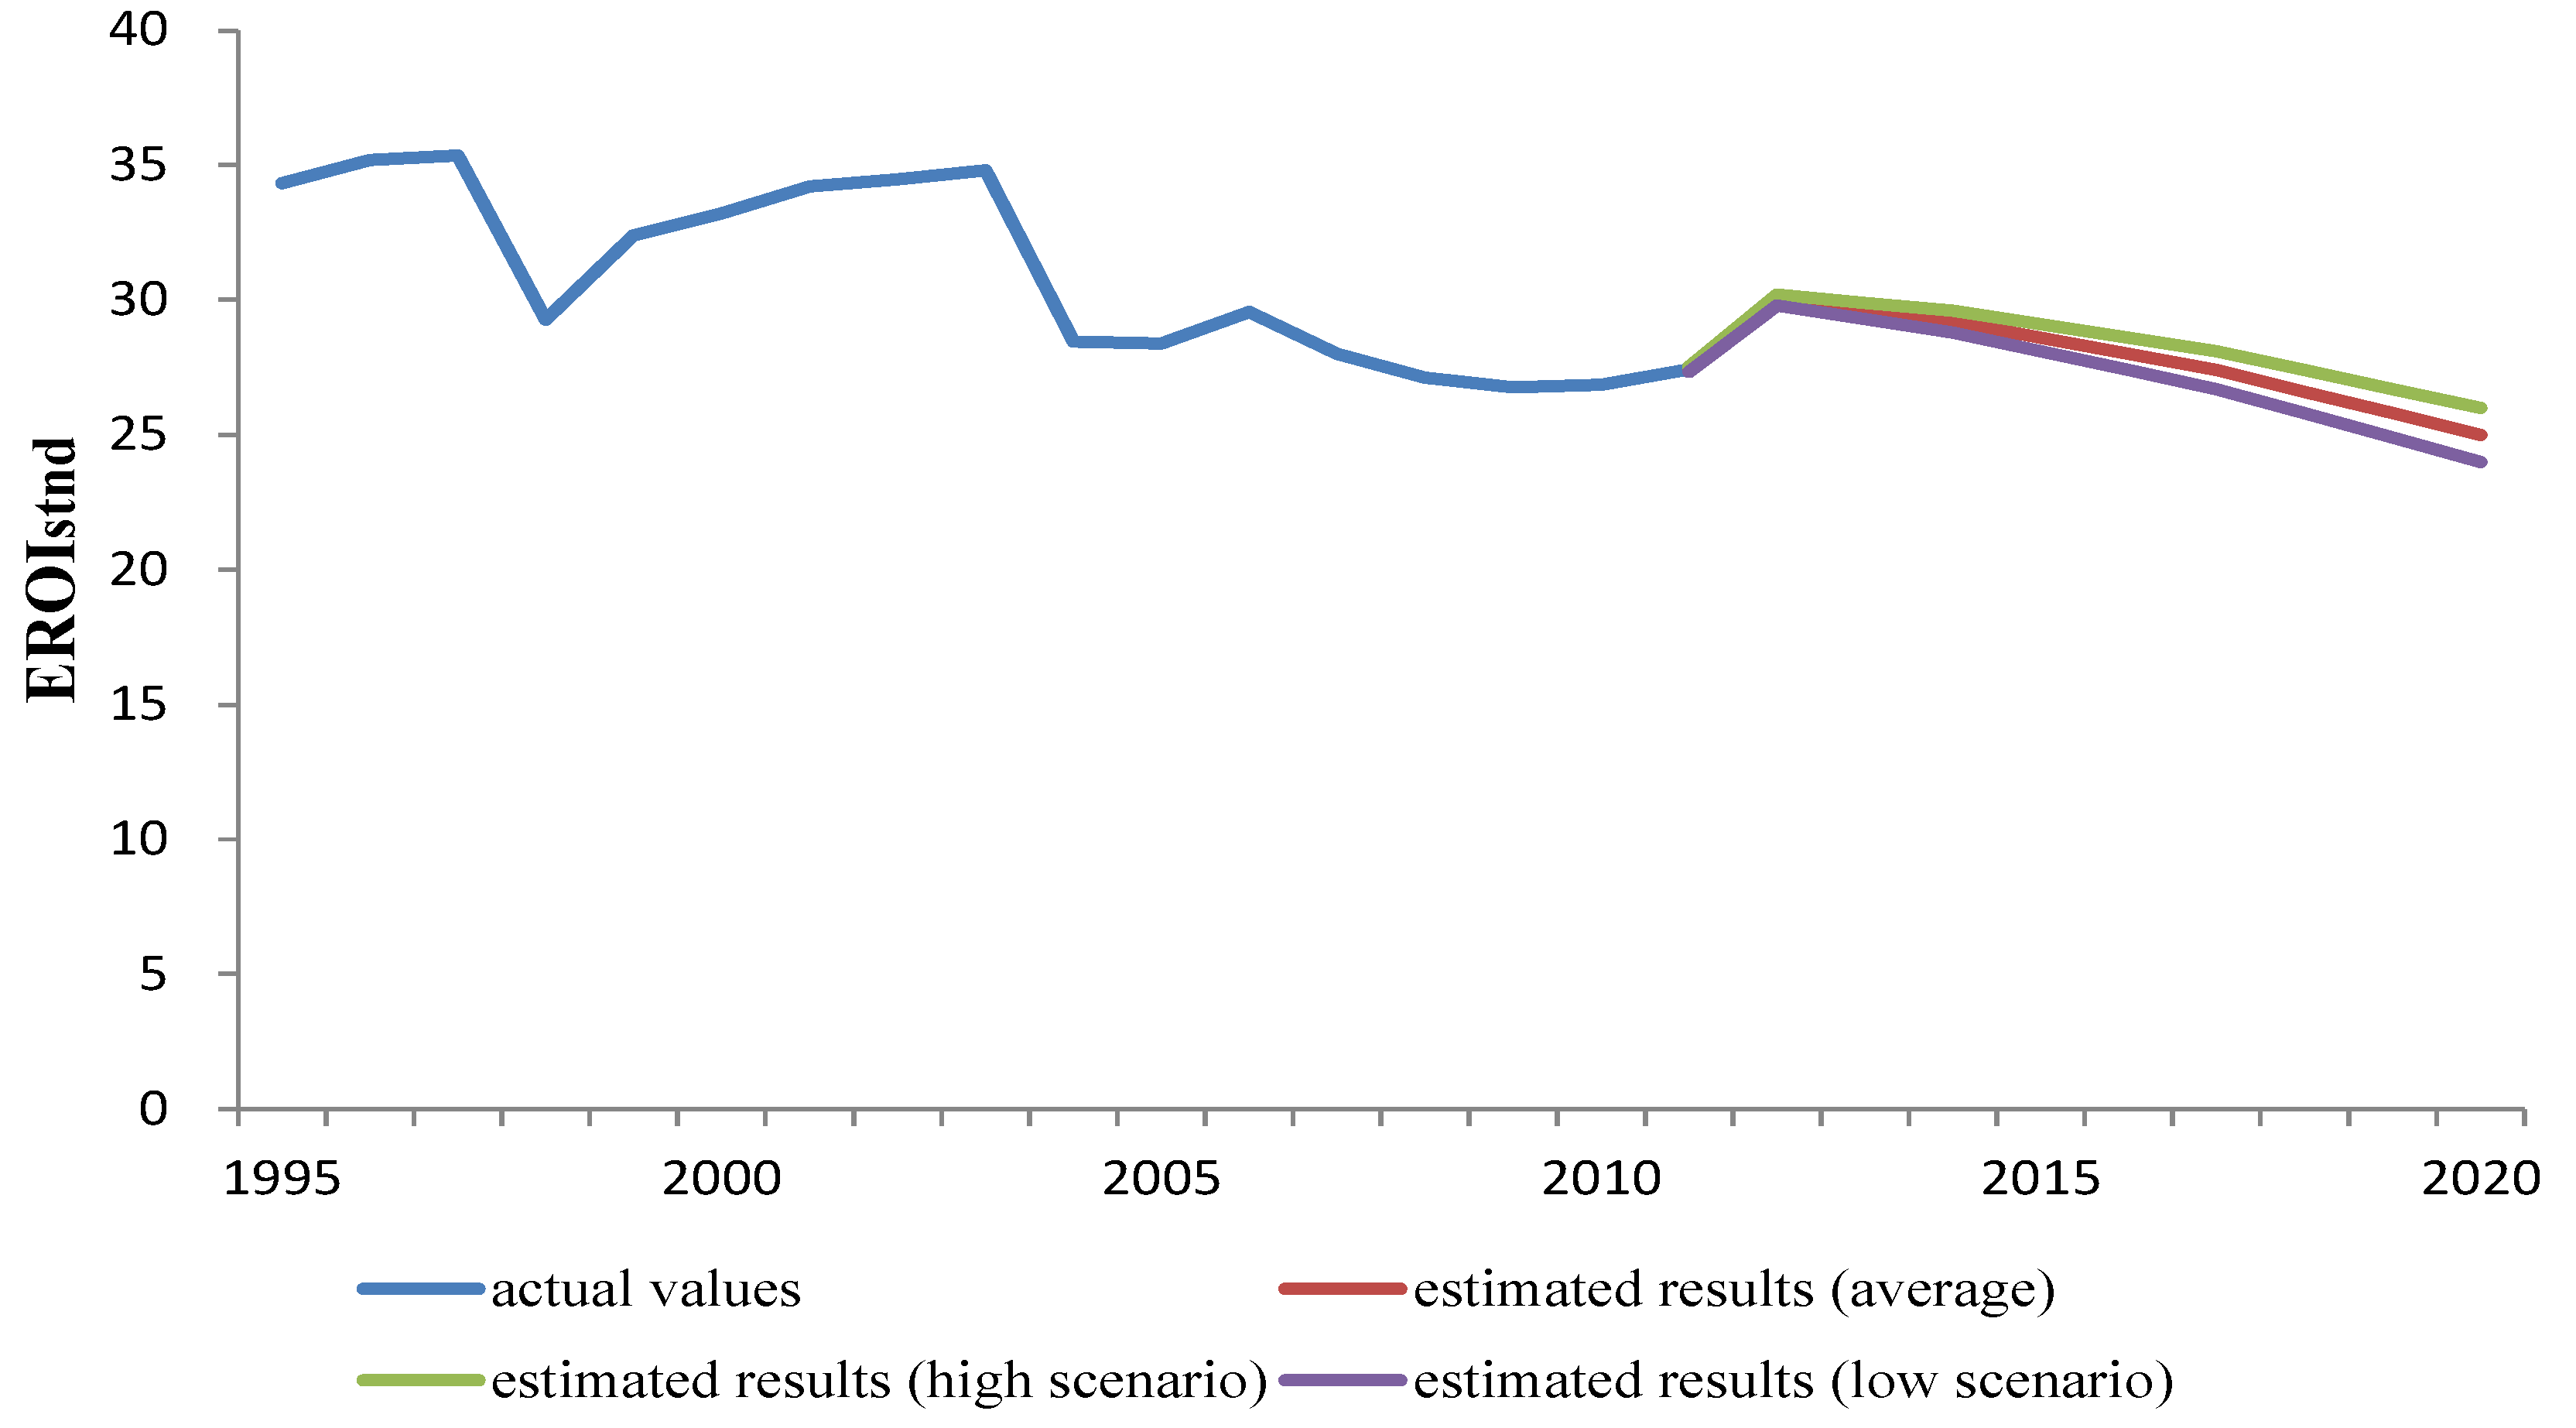
52]. When we consider energy inputs of the CCS technology at the plant level of emissions, the EROIs decrease to 0.65–0.77, 2.87–3.97, 0.72–0.85, and 3.20–4.40, respectively. Currently, a CTL project may generate a financial profit, but from the EROI analysis, the quantity of net energy delivered to society by CTL production is extremely low, perhaps even negative, which may be due to high investments in infrastructure and low conversion efficiency. Compared to other sources, the EROI of the CTL process is much less than that of coal, oil, gas, hydroelectric, and nuclear energy. Therefore, the Chinese government and investors should be prudent when developing it. In the future, whether the EROI of CTL production will improve is highly uncertain because it depends on a variety of factors such as technological progress, environmental protection, and defined system boundaries [61]. Accordingly, this is an area that requires further research. At last, what we must emphasize is that though the EROI analysis is a useful method in energy analysis, it also has some own shortcomings that would affect the decision on a new project. For example, the EROI method is restricted by the data available and energy intensity. Therefore, it is more advisable to use not only the EROI method but also other possible methods such as net present value (NPV) to analysis the new project. Of course, this is beyond the scope of this paper, and we only propose this in order to provoke thought.

Acknowledgments

We gratefully acknowledge that this work is supported by the National Natural Science Foundation of China (No. 71273277/71373285/71303258) and the Philosophy and Social Sciences Major Research Project of the Ministry of Education (No. 11JZD048). Helpful comments by anonymous reviewers would be most appreciated.

Author Contributions

All the authors have co-operated for the preparation of this work. Rui Li, Zhaoyang Kong, and Xiucheng Dong designed research; Zhaoyang Kong, Rui Li, and Bo Xu drafted the main part of the paper. A final review, including final manuscript revisions, was performed by Qiang Yin and Cuifang Song.

Conflicts of Interest

The authors declare no conflict of interest.

References

  1. Liu, Z.Y.; Shi, S.D.; Li, Y.W. Coal liquefaction technologies—Development in China and challenges in chemical reaction engineering. Chem. Eng. Sci. 2010, 65, 12–17. [Google Scholar] [CrossRef]
  2. Mantripragada, H.C.; Rubin, E.S. Performance, cost and emissions of coal-to-liquids (CTLs) plants using low-quality coals under carbon constraints. Fuel 2013, 103, 805–813. [Google Scholar] [CrossRef]
  3. Rong, F.; Victor, D.G. Coal liquefaction policy in China: Explaining the policy reversal since 2006. Energy Policy 2011, 39, 8175–8184. [Google Scholar] [CrossRef]
  4. Chen, Y.H.; Reilly, J.M.; Paltsev, S. The prospects for coal-to-liquid conversion: A general equilibrium analysis. Energy Policy 2011, 39, 4713–4725. [Google Scholar] [CrossRef]
  5. Hu, Y.; Feng, L.Y.; Hall, C.C.S.; Tian, D. Analysis of the energy return on investment (EROI) of the huge Daqing oil field in China. Sustainability 2011, 3, 2323–2338. [Google Scholar] [CrossRef]
  6. Kampa, K.B. An Energy Return on Investment for a Geothermal Power Plant on the Texas Gulf Coast. Master’s Thesis, The University of Texas at Austin, Austin, TX, USA, 1 May 2013. [Google Scholar]
  7. Brandt, A.R. Oil depletion and the energy efficiency of oil production: The case of California. Sustainability 2011, 3, 1833–1854. [Google Scholar] [CrossRef]
  8. Cleveland, C.J. Net energy from the extraction of oil and gas in the United States. Energy 2005, 30, 769–782. [Google Scholar] [CrossRef]
  9. Farrell, A.E.; Brandt, A.R. Risks of the oil transition. Environ. Res. Lett. 2006. [Google Scholar] [CrossRef]
  10. Talberth, J. Economic Feasibility of Coal to Liquids Development in Alaska’s Interior. Center for Sustainable Economy. 2009. Available online: http://sustainable-economy.org/ (accessed on 1 October 2014).
  11. Höök, M.; Aleklett, K. A review on coal to liquid fuels and its coal consumption. Int. J. Energy Res. 2010, 34, 848–864. [Google Scholar] [CrossRef]
  12. Review of worldwide coal-to-liquids R,-D&D-activities and the need for further initiatives within Europe. Available online: http://www.iea-coal.org.uk/documents/82184/7171/Review-of-worldwide-coal-to-liquids-R,-D&D-activities-and-the-need-for-further-initiatives-within-Europe (accessed on 1 October 2014).
  13. Williams, R.H.; Larson, E.D. A comparison of direct and indirect liquefaction technologies for making fluid fuels from coal. Energy Sustain. Dev. 2003, 8, 103–129. [Google Scholar] [CrossRef]
  14. Xua, L.; Tang, M.C.; Duana, L.; Liua, B.; Ma, X.X.; Zhang, Y.L.; Argyle, M.D.; Fan, M.H. Pyrolysis characteristics and kinetics of residue from China Shenhua industrial direct coal liquefaction plant. Thermochim. Acta 2014, 589, 1–10. [Google Scholar] [CrossRef]
  15. Su, H.; Fletcher, J.J. Carbon Capture and Storage in China: Options for the Shenhua Direct Coal Liquefaction Plant. Available online: http://www.bellona.org/filearchive/fil_Carbon_Capture_and_Storage_in_China.pdf (accessed on 1 October 2014).
  16. Cleveland, C.J.; O’Connor, P.A. Energy return on investment (EROI) of oil shale. Sustainability 2011, 3, 2307–2322. [Google Scholar] [CrossRef]
  17. Lundin, J. EROI of Crystalline Silicon Photovoltaics-Variations under Different Assumptions Regarding Manufacturing Energy Inputs and Energy Output. Available online: http://uu.diva-portal.org/smash/record.jsf?pid=diva2%3A620665&dswid=-3486 (accessed on 2 October 2014).
  18. Hu, Y.; Hall, C.A.S.; Wang, J.L.; Feng, L.Y.; Poisson, A. Energy return on investment (EROI) of China’s conventional fossil fuels: Historical and future trends. Energy 2013, 54, 352–364. [Google Scholar] [CrossRef]
  19. Mulder, K.; Hagens, J.N. Energy return on investment: Toward a consistent framework. J. Hum. Environ. 2008, 37, 74–79. [Google Scholar] [CrossRef]
  20. Murphy, D.J.; Hall, C.A.S.; Dale, M.; Cleveland, C. Order from chaos: A preliminary protocol for determining the EROI of fuels. Sustainability 2011, 3, 1888–1907. [Google Scholar] [CrossRef]
  21. Grandell, L.; Hall, C.A.S.; Höök, M. Energy return on investment for Norwegian oil and gas from 1991 to 2008. Sustainability 2011, 3, 2050–2070. [Google Scholar] [CrossRef]
  22. Hall, C.A.S.; Balogh, S.; Murphy, D.J. What is the minimum EROI that a sustainable society must have? Energies 2009, 2, 25–47. [Google Scholar] [CrossRef]
  23. Markussen, M.V.; Østergård, H. Energy analysis of the danish food production system: Food-EROI and fossil fuel dependency. Energies 2013, 6, 4170–4186. [Google Scholar] [CrossRef]
  24. Guilford, M.C.; Hall, C.A.S.; O’Connor, P.; Cleveland, C.J. A new long term assessment of energy return on investment (EROI) for U.S. Oil and gas discovery and production. Sustainability 2011, 3, 1866–1887. [Google Scholar] [CrossRef]
  25. Zhang, M.H. The comprehensive evaluation of Shenhua direct coal liquefaction project. Master’s Thesis, China University of petroleum (Beijing), Beijing, China, 25 May 2009. [Google Scholar]
  26. Atlason, R.S.; Unnthorsson, R. Hot water production improves the energy return on investment of geothermal power plants. Energy 2013, 51, 273–280. [Google Scholar] [CrossRef]
  27. Xu, B.; Feng, L.Y.; Wei, W.X.; Hu, Y.; Wang, J.L. A preliminary forecast of the production status of China’s Daqing Oil field from the perspective of EROI. Sustainability 2014, 6, 8262–8282. [Google Scholar] [CrossRef]
  28. Chen, W.M.; Liu, S.Y.; Wang, Z.L. The instruction of calorific value grading of coal. Coal Anal. Util. 1995, 3, 46–48. [Google Scholar]
  29. Garg, A.; Kazunari, K.; Pulles, T. 2006 IPCC Guidelines for National Greenhouse Gas Inventories. Available online: http://www.ipcc-nggip.iges.or.jp/public/2006gl/index.html (accessed on 26 December 2014).
  30. Xi, J.P. Study of Energy Saving and Emission Reduction in Road Transportation. Master’s Thesis, Chang’an University, Xi’an, China, 25 May 2008. [Google Scholar]
  31. Liu, Y.N. Cargo Transportation Structure Optimization Research Based on Energy Consumption. Master’s Thesis, Master’s Thesis, Beijing, China, 1 March 2014. [Google Scholar]
  32. Cai, F.T.; Liu, L.; Han, L.B. The status of road transport energy consumption and energy saving countermeasures. Energy Conserv. Environ. Prot. Transp. 2006, 3, 24–27. (In Chinese) [Google Scholar]
  33. Zhang, M. Analysis and Prediction on China’s Energy-related CO2 Emission and Transport Energy Consumption Based on Index Decomposition Method. Ph.D. Thesis, Dalian University of Technology, Dalian, China, 1 June 2009. [Google Scholar]
  34. Li, X.-M.; Xie, R.-H. The relationship between transportation and energy—Transport energy consumption and energy saving. Compr. Transp. 1999, 10, 23–27. (In Chinese) [Google Scholar]
  35. Zhou, X.J. Present situation and trend of energy consumption in traffic and transportation Industry. Sino-Glob. Energy 2010, 15, 9–18. (In Chinese) [Google Scholar]
  36. Shi, B.L. An analysis of energy demand supply balance in the development of road transport and its countermeasures. J. Highw. Transp. Res. Dev. 1991, 8, 51–58. (In Chinese) [Google Scholar]
  37. Yang, H.N. China’s strategic choice of energy savings in transportation. Compr. Transp. 2006, Z1, 17–19. (In Chinese) [Google Scholar]
  38. Ding, J.X. The analysis of carbon emissions and emission reduction potential in Chinese transportation. Compr. Transp. 2012, 12, 20–26. (In Chinese) [Google Scholar]
  39. Wang, L.L. Optimization of Transportation Energy Saving and Emission Reduction Technology Plan Based on System Dynamics. Master’s Thesis, 1 May 2012. [Google Scholar]
  40. Mantripragada, H.C.; Rubin, E.S. Techno-economic evaluation of coal-to-liquids (CTL) plants with carbon capture and sequestration. Energy Policy 2011, 39, 2808–2816. [Google Scholar] [CrossRef]
  41. Vallentin, D. Policy drivers and barriers for coal-to-liquids (CTL) technologies in the United States. Energy Policy 2008, 36, 3198–3211. [Google Scholar] [CrossRef]
  42. Shi, M.J.; Li, N.; Zhou, S.L.; Yuan, Y.N.; Ma, G.X. Can China realize CO2 mitigation target toward 2020? J. Resour. Ecol. 2010, 1, 145–154. [Google Scholar]
  43. Metz, B.; Davidson, O.; Coninck, H.D.; Loos, M.; Meyer, L. IPCC Special Report on Carbon Dioxide Capture and Storage. 2005. Available online: http://www.ipcc.ch/report/srccs/ (accessed on 8 October 2014).
  44. Xu, H.; Cheng, X.L.; Wang, W.F. The Project Feasibility Study Report of Coal-to-Chemicals in China; China Petrochemical Corporation Economics & Technology Research Institute: Beijing, China, 2013. (In Chinese) [Google Scholar]
  45. Chinese Exchange Rate, The People’s Bank of China. Available online: http://www.pbc.gov.cn/publish/english/963/index.html (accessed on 26 December 2014).
  46. Sun, G.D. Coal in China: Resources, Uses, and Advanced Coal Technologies. Available online: http://www.c2es.org/publications/coal-initiative-series-coal-china-resources-uses-advanced-coal-technologies (accessed on 8 October 2014).
  47. Dale, M.; Krumdieck, S.; Bodger, P. Net energy yield from production of conventional oil. Energy Policy 2011, 39, 7095–7102. [Google Scholar] [CrossRef]
  48. Hall, C.A.S.; Powers, R.; Schoenberg, W. Peak Oil, EROI, Investments and the economy in an uncertain future. In Biofuels, Solar and Wind as Renewable Energy Systems: Benefits and Risks; Pimentel, D., Ed.; Springer: Dordrecht, The Netherlands, 2008; pp. 109–132. [Google Scholar]
  49. Hall, C.A.S.; Lambert, J.G.; Balogh, S.B. EROI of different fuels and the implications for society. Energy Policy 2014, 64, 141–152. [Google Scholar] [CrossRef]
  50. Gupta, A.K.; Hall, C.A.S. A review of the past and current state of EROI data. Sustainability 2011, 3, 1796–1809. [Google Scholar] [CrossRef]
  51. Lambert, J.; Hall, C.A.S.; Balogh, S.; Poisson, A.; Gupta, A. EROI of Global Energy Resources: Preliminary Status and Trends; United Kingdom Department for International Development: London, UK, 2012. [Google Scholar]
  52. Raugei, M.; Fullana-i-Palmer, P.; Fthenakis, V. The energy return on energy investment (EROI) of photovoltaics: Methodology and comparisons with fossil fuel life cycles. Energy Policy 2012, 45, 576–582. [Google Scholar] [CrossRef]
  53. Dale, M.; Krumdieck, S.; Bodger, P. A dynamic function for energy return on investment. Sustainability 2011, 3, 1972–1985. [Google Scholar] [CrossRef]
  54. Pawelzik, P.F.; Zhang, Q. Evaluation of environmental impacts of cellulosic ethanol using life cycle assessment with technological advances over time. Biomass Bioenergy 2012, 40, 162–173. [Google Scholar] [CrossRef]
  55. Kesicki, F. The third oil price surge–What’s different this time? Energy Policy 2010, 38, 1596–1606. [Google Scholar] [CrossRef]
  56. Callarotti, R.C. Energy return on energy invested (EROI) for the electrical heating of methane hydrate reservoirs. Sustainability 2011, 3, 2105–2114. [Google Scholar] [CrossRef]
  57. Wang, Z. Designing and Evaluating the Early Implementation Schemes of Carbon Dioxide Capture and Storage (CCS) in China. Ph.D. Thesis, Chengdu University of Technology, Chengdu, China, 1 April 2012. [Google Scholar]
  58. Zeng, M.; Ouyang, S.J.; Zhang, Y.J.; Shi, H. CCS technology development in China: Status, problems and counter measures—Based on SWOT analysis. Renew. Sustain. Energy Rev. 2014, 39, 604–616. [Google Scholar] [CrossRef]
  59. Rubin, E.S.; Rao, A.B. A Technical, Economic and Environmental Assessment of Amine-based CO2 Capture Technology for Power Plant Greenhouse Gas Control. Available online: http://www.osti.gov/scitech/servlets/purl/804932-MqrF4u/native/ (accessed on 15 October 2014).
  60. BP Statistical Review of World Energy 2014. Available online: http://www.bp.com/en/global/corporate/about-bp/energy-economics/statistical-review-of-world-energy.html (accessed on 21 January 2015).
  61. Brandt, A.R.; Englander, J.; Bharadwaj, S. The energy efficiency of oil sands extraction: Energy return ratios from 1970 to 2010. Energy 2013, 55, 693–702. [Google Scholar] [CrossRef]

