Article

Regression Models Using Fully Discharged Voltage and Internal Resistance for State of Health Estimation of Lithium-Ion Batteries

Department of Mechanical Engineering, Ming Chi University of Technology, 84 Gungjuan Road, Taishan, New Taipei City 24301, Taiwan
*
Author to whom correspondence should be addressed.
Energies 2015, 8(4), 2889-2907; https://doi.org/10.3390/en8042889
Submission received: 31 December 2014 / Revised: 13 March 2015 / Accepted: 7 April 2015 / Published: 15 April 2015

Abstract

:
Accurate estimation of lithium-ion battery life is essential to assure the reliable operation of the energy supply system. This study develops regression models for battery prognostics using statistical methods. The resultant regression models can not only monitor a battery’s degradation trend but also accurately predict its remaining useful life (RUL) at an early stage. Three sets of test data are employed in the training stage for regression models. Another set of data is then applied to the regression models for validation. The fully discharged voltage (Vdis) and internal resistance (R) are adopted as aging parameters in two different mathematical models, with polynomial and exponential functions. A particle swarm optimization (PSO) process is applied to search for optimal coefficients of the regression models. Simulations indicate that the regression models using Vdis and R as aging parameters can build a real state of health profile more accurately than those using cycle number, N. The Monte Carlo method is further employed to make the models adaptive. The subsequent results, however, show that this results in an insignificant improvement of the battery life prediction. A reasonable speculation is that the PSO process already yields the major model coefficients.

1. Introduction

1.1. Reliability and Life Analysis of Lithium-Ion Batteries

Research works regarding transportation systems have been focusing on the development of various types of power generators using clean energy to replace internal combustion engines (ICE), which have been recognized as significant contributors to air pollutants and greenhouse gases linked to global climate change [1,2]. The newly developed vehicle systems such as Hybrid Electric Vehicles (HEVs), Battery Electric Vehicles (BEVs) and Plug-in Hybrid Electric Vehicles (PHEVs) [3,4,5,6] all require rechargeable batteries for continuous power delivery. The lithium-ion type of battery, among numerous types, is lighter in weight, higher in power density, longer in cycle life, with a lower self-discharge rate and generates lesser pollution in use. Therefore, many researchers have been focusing their efforts on the improvement of lithium-ion batteries in the past decade, and lithium-ion batteries have become the most commonly adopted power supply for many systems [7].
The existing research on lithium-ion batteries mostly emphasizes the design of battery components such as various battery chemistries to enhance their performance [8,9,10,11,12,13]. In addition to performance, the capacity fade should be another important factor to be considered in selecting a battery. Capacity decrease is inevitable due to aging and failure processes like electrode passivation and corrosion. When the capacity drops to a certain level, the battery fails suddenly, often without any warning. Unexpected battery failures often cause serious losses and can sometimes result in catastrophes. The use of batteries is anticipated to grow rapidly, e.g., with the hybrid electric vehicle market. This demands the urgent development of battery monitoring techniques [14]. Accurate enough battery life estimation is therefore essential for the development of a reliable energy supply system.
Battery operation is a dynamic process, which is strongly influenced by the ambient environment and loading conditions [15]. As a result of that, comprehensive studies of battery ageing phenomena under various operating conditions are, if not impossible, very difficult to perform. Using test data in combination with statistical methods to build empirical relations for battery life estimation has hence become the common approach. Battery monitoring during usage has two main streams, as based on the existing researches: state of charge (SOC) and state of health (SOH) [12]. SOC provides the real information about a battery’s remaining energy, that is, the percentage of the remaining charge to the maximum capacity. SOH, which describes the physical health condition of a battery compared to a fresh one, is used to characterize the current health status and to estimate the remaining performance of a battery. To estimate SOC/SOH requires a precise capacity evaluation of a battery and the ampere-hour counting method is frequently used for this [7].
Techniques developed for SOC and SOH estimation include: fuzzy logic, electrochemical impedance spectroscopy (EIS), extended Kalman filter (EKF), and neuro-fuzzy [11,16,17,18,19,20,21,22,23,24]. Bole et al. [25,26,27] stated that the unscented Kalman filter (UKF) generally has better accuracy than the EKF [28] and derived a physics-based model for Li-ion batteries, in which an electrochemical model was constructed and a state age-dependent parameter was identified over randomized discharge profiles data via a UKF algorithm. Researches regarding battery prognosis and remaining useful life (RUL) prediction are also available. Dalal et al. [29] presented a particle filtering (PF) framework for a lithium-ion battery life prognostic system, in which a lumped parameter battery model was used to account for all the dynamic characteristics of the battery. Lately Orchard et al. [30] developed a simplified PF-based prognostic method for SOC and the estimation of discharge time. Zhang et al. [31] further implemented this technique into a mission planning to minimize failure risk. Other approaches, such as relevance vector machines (RVMs), combinations of regressions, neural networks, fuzzy logic, and distributed active learning, were developed as well for predicting battery RUL [20,32,33,34,35]. All the mentioned papers emphasized the model updating functions or the so-called adaptive modeling to account for individual batteries’ variations in addition to initial modeling. Though SOC and SOH of lithium-ion batteries have been studied for years, there is still large room for improvement in more accurate modeling and RUL prediction from test data. This is partially due to the very complicated and dynamic nature of batteries due to the environmental impact and operation profiles. The authors herein employ statistical methods, regression models and the PSO scheme to develop accurate and reliable models for the SOH estimation of lithium-ion batteries.

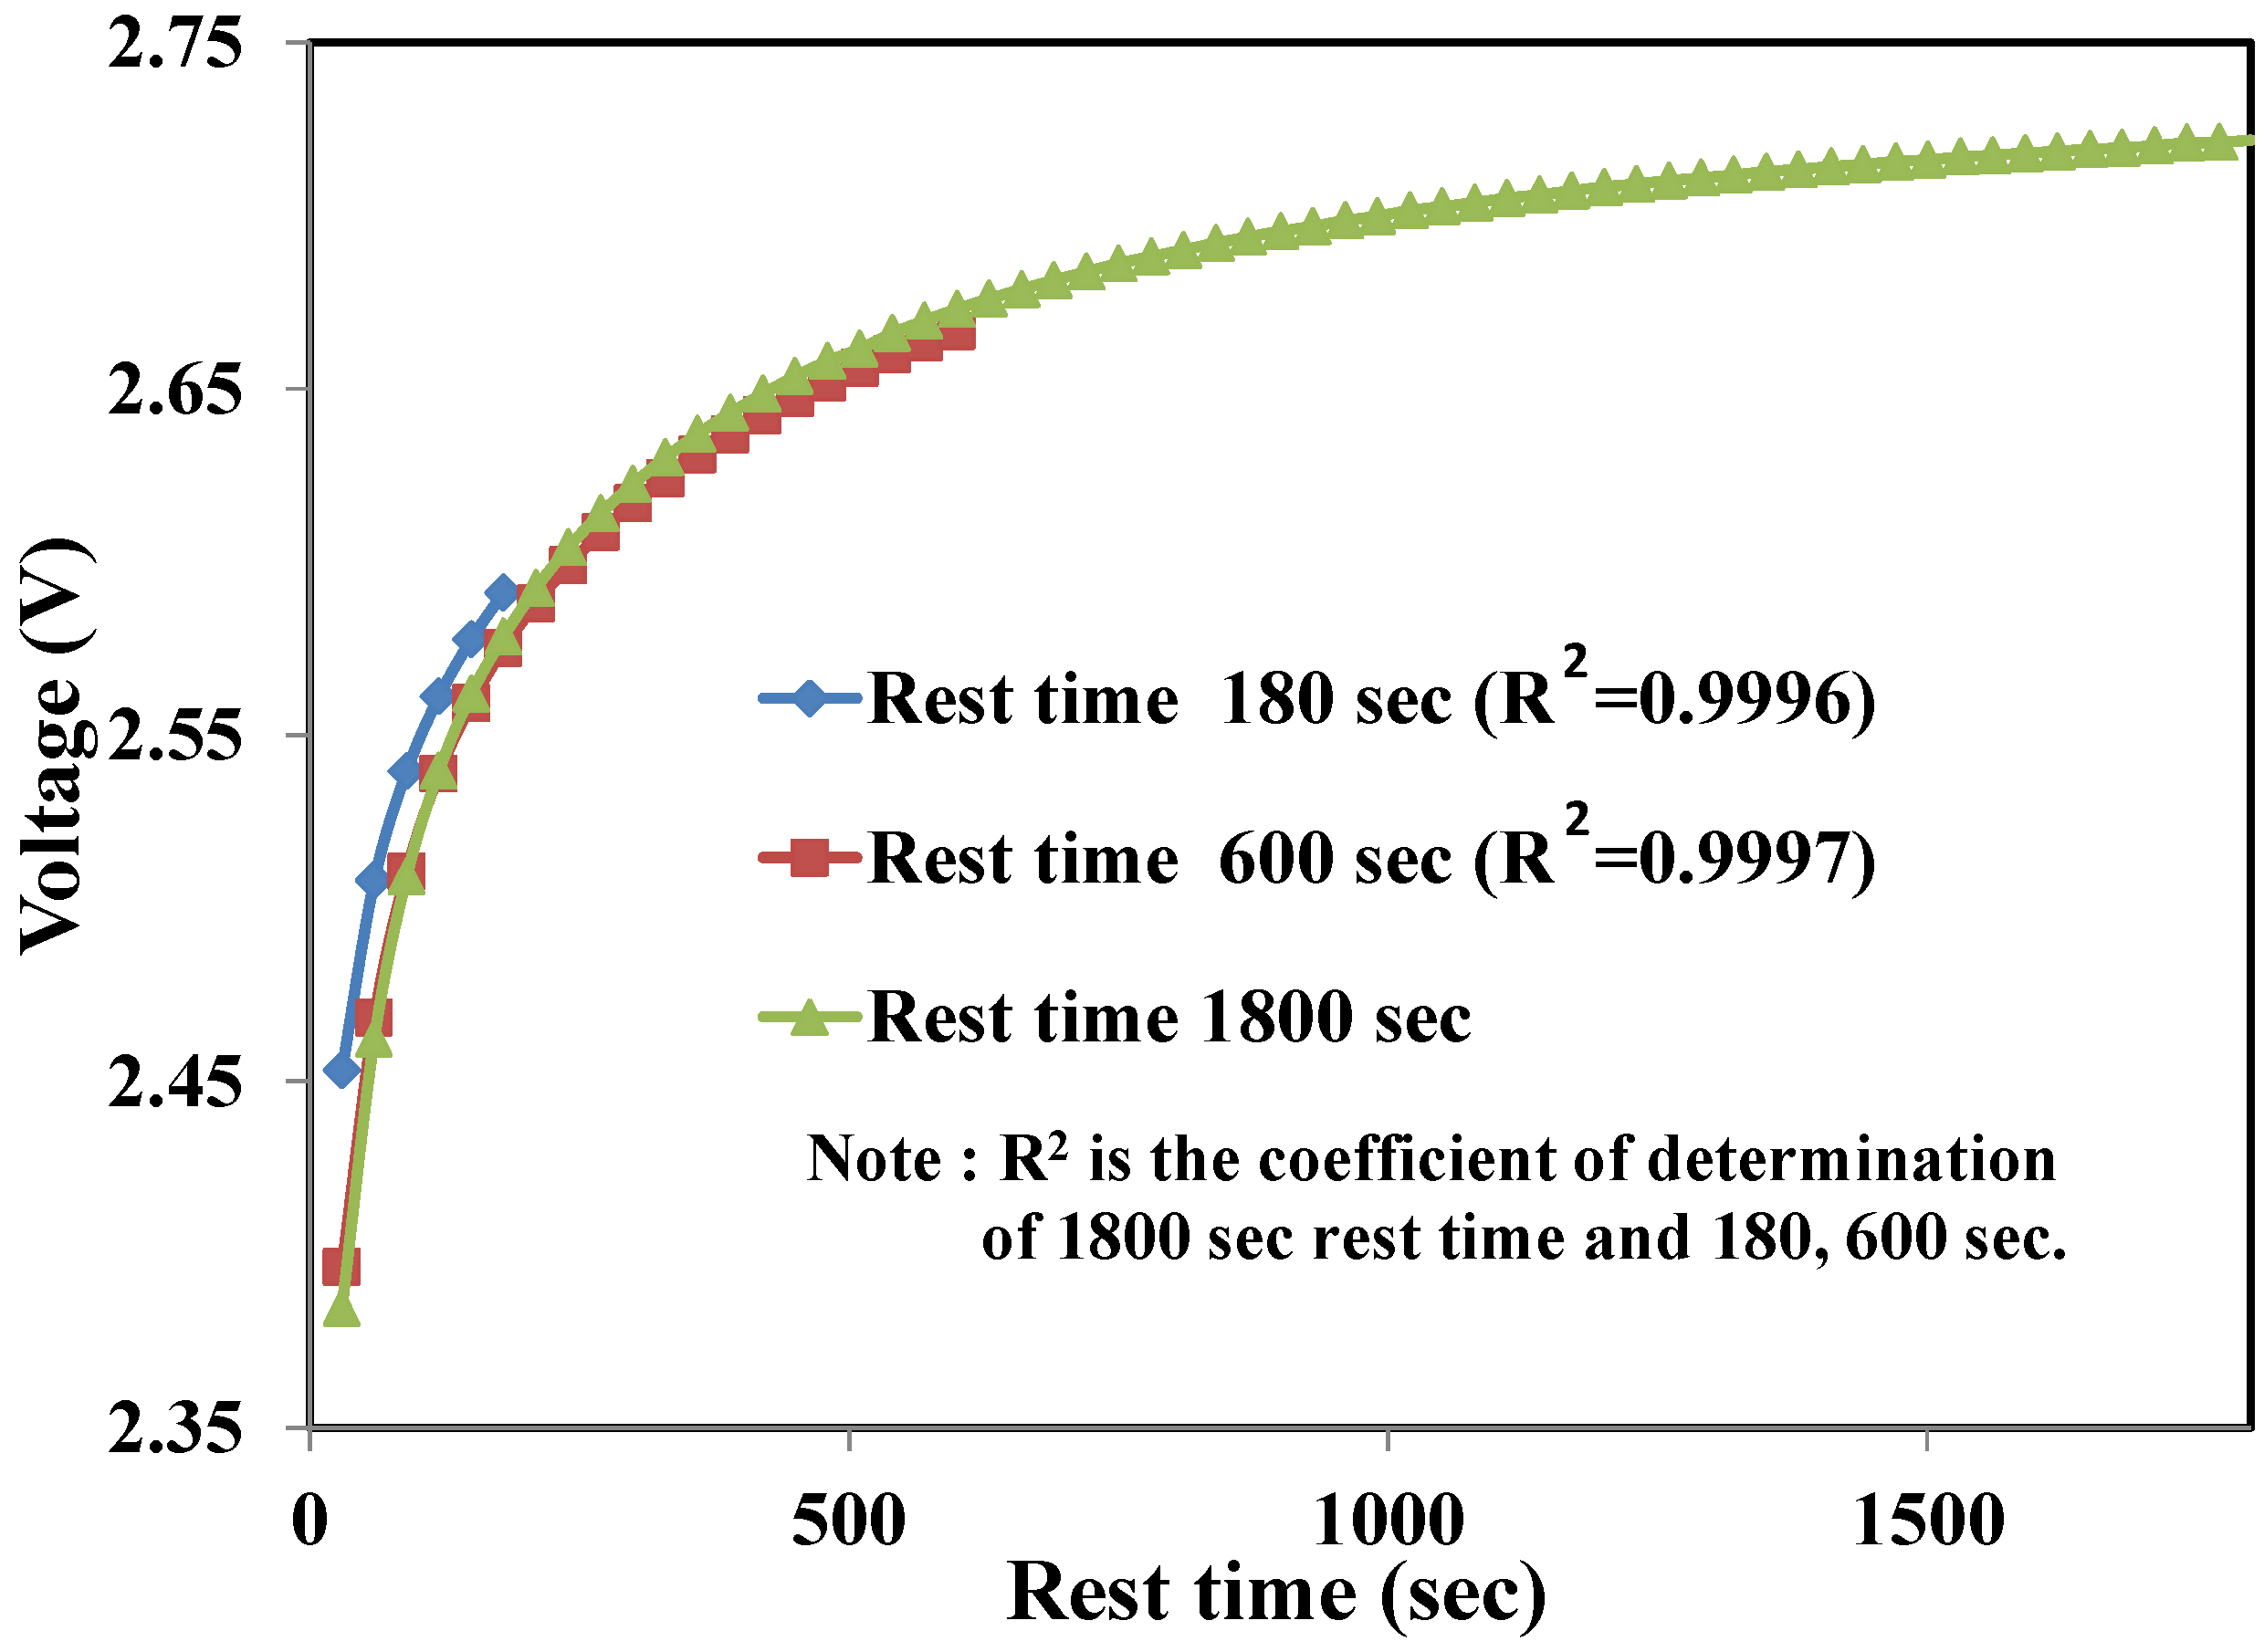
1.2. Aging Parameters of the Battery
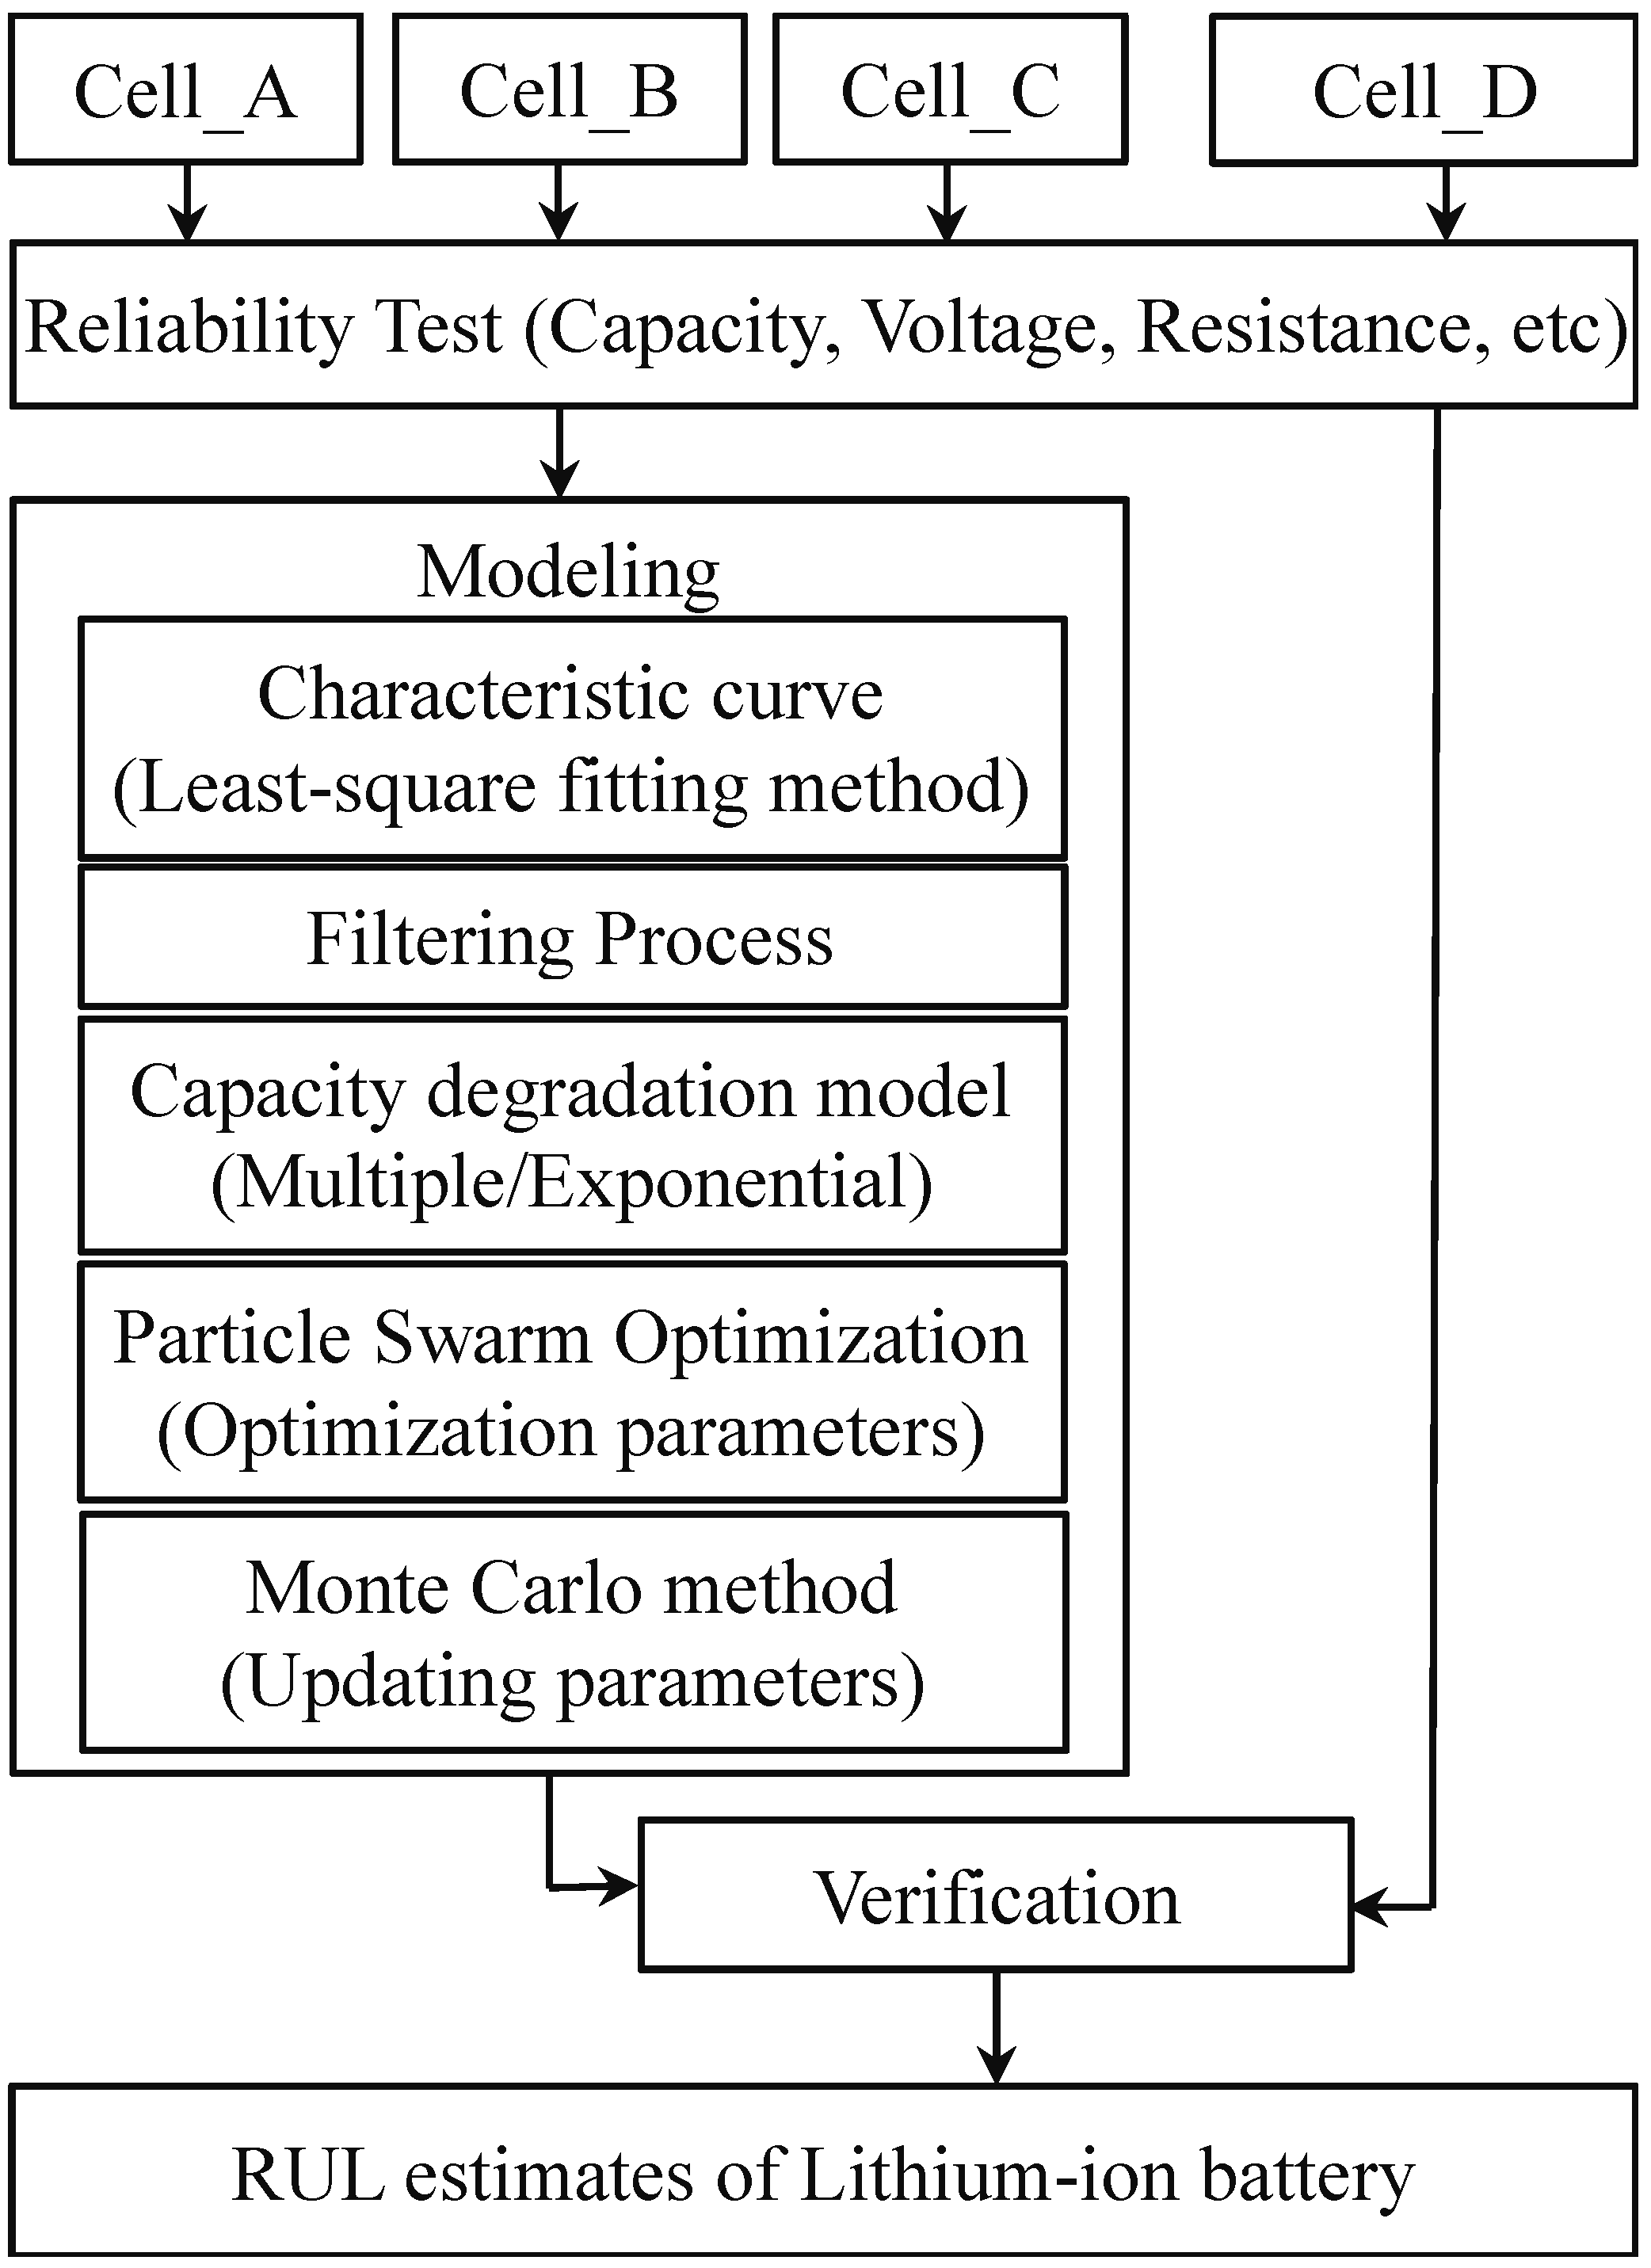
A battery’s performance declines with the increase of charge/discharge process and the rate of decline is strongly related to its loading conditions and working environment. Most of the literature has adopted the fully charge/discharge cycle number N as the model parameter for battery’s SOH and RUL estimation. Micea et al. [36] employed N into a second-degree polynomial regression equation for SOH model and RUL estimation in which a least square criterion was set. He et al. [37] used N to derive an exponential growth model in terms of the sum of two exponential functions to fit the degradation curves. Xing et al. [38] compared two degradation models: one based on [37] and the other based on [36]. The comparison showed that the exponential model was superior to the polynomial one.
The cycle number N is an appropriate indicator for a battery’s aging condition. The SOH deteriorates with the increase of N as long as the operational environment does not change drastically. Nevertheless, changes of load conditions and/or working environments during a battery’s whole operation life are not uncommon. These changes may consequently result in contradictory phenomena, e.g., increasing N also increases RUL because of working temperature change. Excluding environmental changes appears to be the disadvantage of using N as the aging parameter. One way of remedying environmental changes or battery’s variations is to implement an adaptive model that updates the model coefficients after certain cycles of present operation.
This updating function nevertheless complicates the subsequent implementation and becomes less cost-effective. The thought of finding appropriate aging parameters that could truly reflect a battery’s present state hence prompted the authors to do this research. In searching for possible ageing parameters, references [39,40] discussed the internal resistance (R) increase in lithium-ion batteries and showed that a cell experienced a significant impedance rise due to power loss. The fade rate was further proved to be dependent on SOC and working temperature. Pattipati et al. [32] hence utilized the capacity decrease and power fade to describe a battery SOH. Schmidt et al. [41] developed similar methods utilizing capacity and R to estimate SOH. They presented an algorithm that distinguished the capacity fade due to cathode degradation from the impedance rise. It has been observed that the increase in internal impedance is closely related to battery capacity degradation and is suitable for battery health monitoring. R is hence selected for SOH degeneration estimation in the present study.
The open circuit voltage (OCV) is another appropriate indicator for a battery’s SOC and SOH. However, the measurement of every OCV is time-consuming because it requires a complete rest time to reach a steady state. OCV seems impractical for an on-line SOH estimation due to this limitation. The authors studied the fully discharged voltage variation with different resting time in a separate experiment and searched for any possible replacement for OCV. It is observed that taking the voltage 60 s after full discharge, denoted Vdis, to replace OCV in SOH modeling is more feasible and accurate enough to represent OCV.

2. Test Methodology

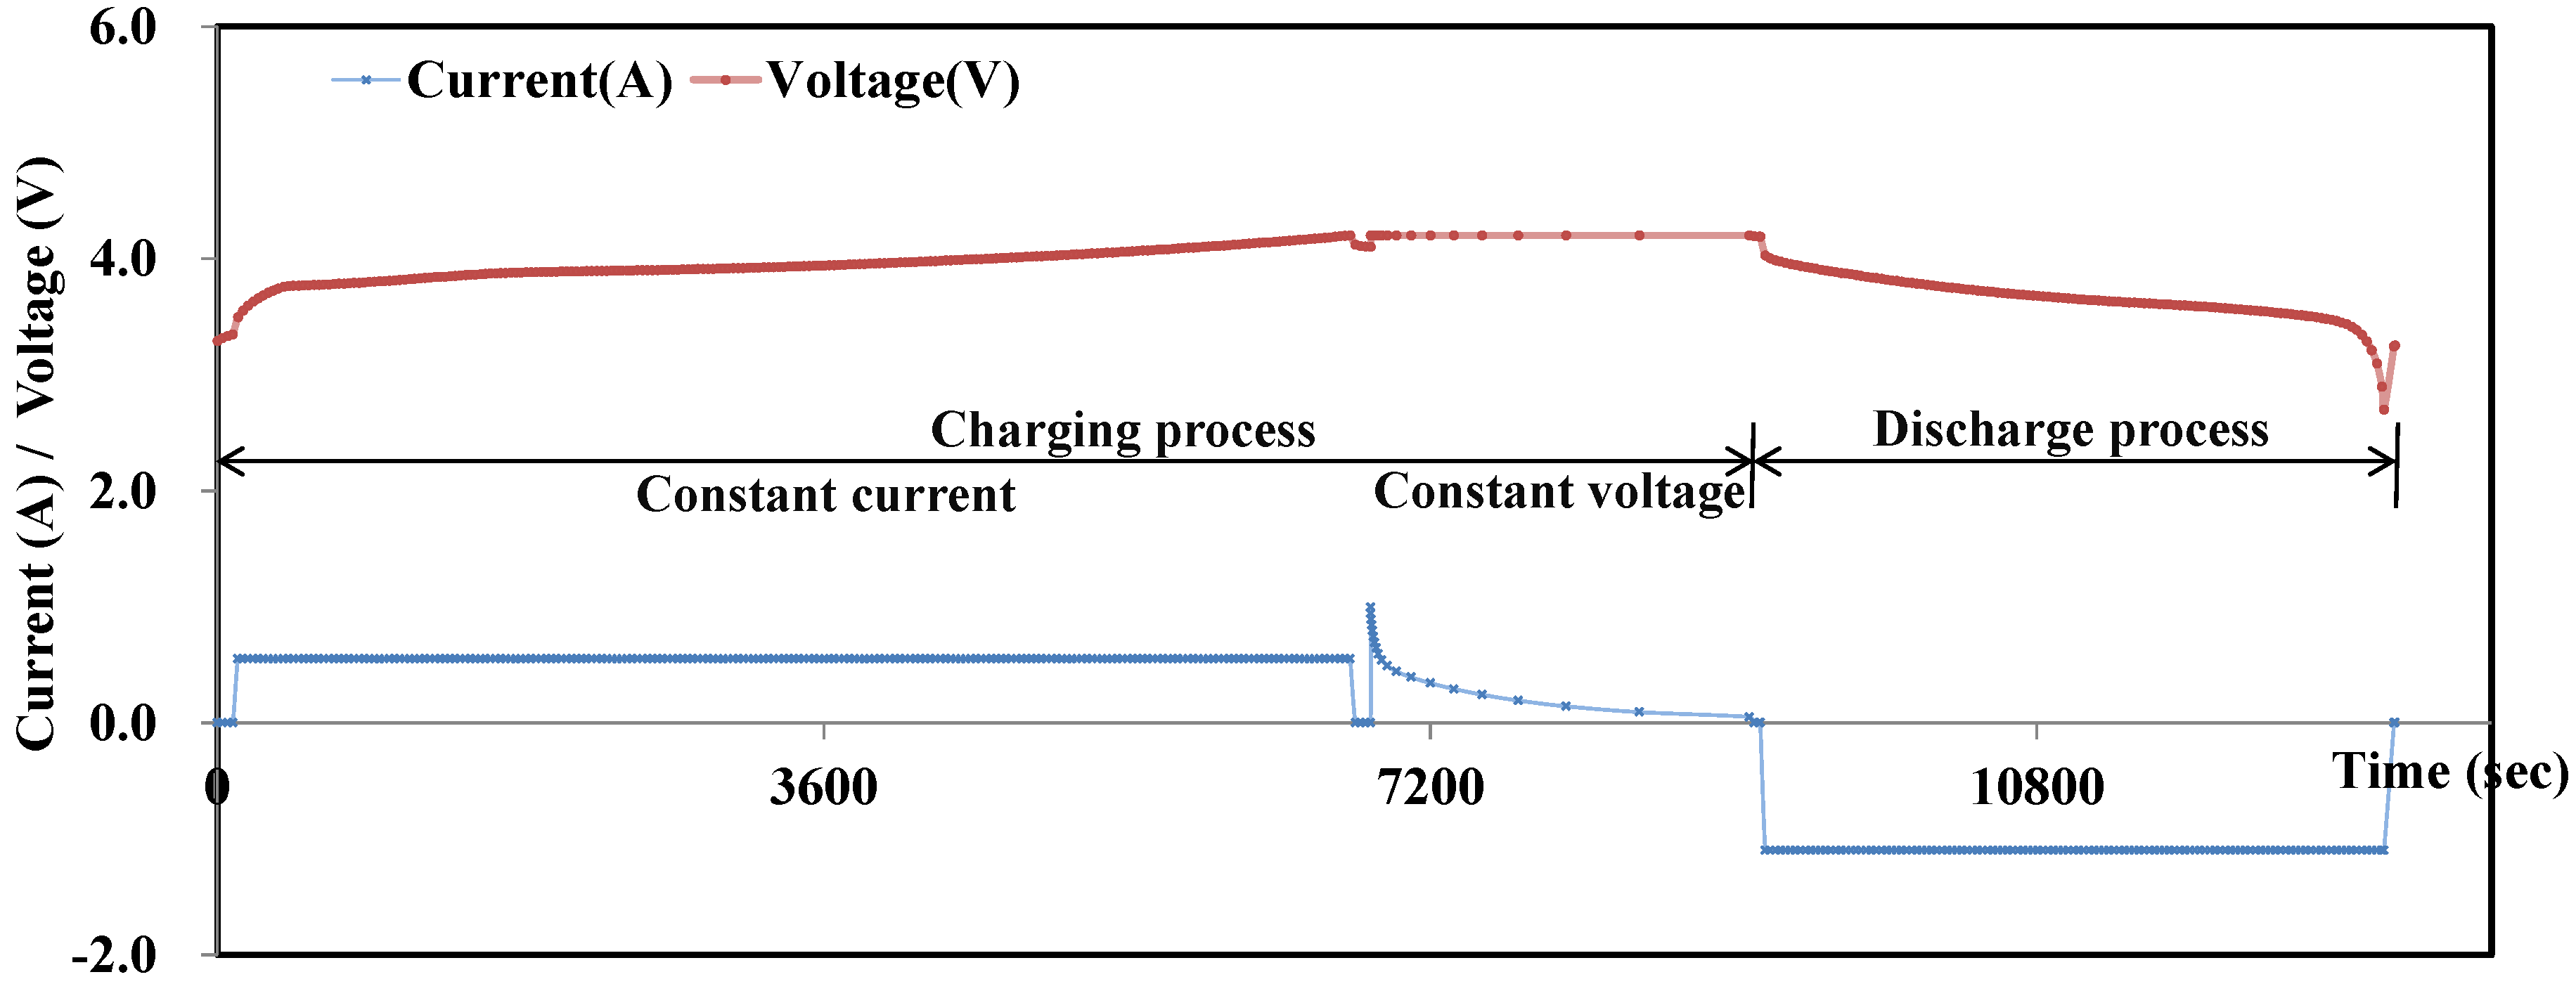
2.1. Reliability Testing

Four identical lithium cobalt oxide batteries (LiCoO2) were used for the reliability tests in this study. The rated capacity of the tested lithium-ion batteries is 1.10 Ah. The tests were performed at room temperature, i.e., approximately 25 °C. The battery capacity was calculated as the integral of the current over the time (Coulomb counting method, [7]), i.e., Q = ∫Idt, where Q, I, and t represent the battery capacity, the current flow, and the whole discharging time, respectively.
Figure 1 shows a typical current and voltage profile of the battery for one full charge/discharge process. The current remains a constant of 1 C rate in the discharging stage till the voltage drops to a pre-designated cut-off voltage of 2.7 V. The charging process then follows the widely used constant-current/constant-voltage (CCCV) protocol, wherein, the current is held 0.55 A (0.5 C) until the voltage reaches its designated maximum value of 4.2 V, then constant voltage charging takes over till the charging current falls below 0.05 A.
Figure 1. Charge-Discharge current and voltage profiles.
Energies 08 02889 g001
The methodology for lithium battery SOH prediction is illustrated in Figure 2. Four identical batteries, labeled A, B, C and D, were tested. All these tests were 100% depth of discharge (DOD) and continuously repeated to battery failure. The parameters: fully discharged voltage (Vdis), internal resistance (R), cycle numbers (N) and charging/discharging times, were recorded at every cycle. The averages of the three batteries, A, B and C, test data are used as the training set to build up SOH model, and the test data of D is used for model validation.
Figure 2. Algorithm of SOH modeling and RUL prediction of lithium-ion batteries.
Energies 08 02889 g002

2.2. State of Health

SOH is defined as a “measure” of the health condition of a battery and its ability to deliver a specified performance compared to a fresh battery [3,4]. SOH estimation is an important factor in battery prognostics. Given the failure threshold and the SOH measurements, a battery’s RUL can be predicted through extrapolation. The SOH is commonly expressed as [42]:
S O H = C i C f u l l × 100 % = f ( N , O C V , R , ...... )
where Ci, the actual discharge capacity (Ah); Cfull, the nominal capacity or initial discharge capacity; N, OCV, R,…, suitable parameters for reflecting battery health state.
The capacity decreases with various aging and failure processes with electrode passivation or corrosion. The failure of a lithium-ion battery occurs when the capacity degradation data drops below certain percentage of its nominal capacity [14,43]. The ISO 12405-2 standard defines a battery’s end of life when the discharge capacity drops to 80% of its original capacity and this is used in this study as the threshold of battery failure. The present study adopts Vdis and R as aging parameters. Unlike N, a monotonically increasing variable, Vdis and R are dynamic in nature so that the measures unavoidably fluctuate with many factors such as chemical reaction, ambient temperature, connector pressure, etc. Therefore, in light of standard performance test regulation of IPC, the battery is considered failed when its capacity drops below the threshold for the fifth time in the following tests.

2.3. Particle Swarm Optimizer (PSO)

The accuracy of models highly relies on the identification of model coefficients from the training data. The present study employs the particle swarm optimization (PSO) technique to search for optimal model coefficients. PSO is a stochastic population-based optimization technique that can be applied to a wide range of problems. PSO was first introduced for simulating collaborative behavior and swarming in biological populations. Unlike conventional local search optimization methods such as the least squares method and intelligent algorithms, PSO is a multi-agent parallel search technique [44,45,46]. Conceptually, each particle in PSO is equipped with a small memory comprising its previous best position. The latter includes the personal best experience and the best value so far in the group among the best positions. The “group best” is referred to as the global best particle in the entire swarm.
Hence, the potential solutions of PSO, or trial particles, basically fly through the whole problem space and settle down at an optimal position. The optimal position usually is defined by an optimization criterion which in identification problem is also referred to as fitness function or the square sum of errors between outputs obtained from real system and the identified model. Some researchers have used PSO to train neural networks and found that PSO-based adaptive neural network had a better training performance, namely faster convergence rate, as well as a better predicting ability than back propagation (BP)-based adaptive neural network.

2.4. Monte Carlo (MC) Method

Monte Carlo (MC) methods are a broad class of computational algorithms that rely on repeated random sampling to obtain numerical results. Obtaining the distribution of an unknown probabilistic entity is a typical application of MC method in which one may run simulations many times over. A MC method is employed in the present study to search for optimal parameters of the adaptive regression models. The models are used to improve the RUL prediction. With the variations of battery conditions taken into account, the MC method is applied to dynamically update regression models so that the variations of the system can be accounted for.
The adaptive algorithm is configured in the following procedure: (1) Adopt the parameters obtained from the PSO approach as the mean values and use 5% of these mean values as the standard deviations. (2) Generate 10,000 sets of random parameters using normal distributions where the mean values and standard deviations are those determined in Step (1), and the range for random-number generating is centered at the mean value with a span of plus and minus one standard deviation. (3) Compute SOH values using these 10,000 sets of random parameters with 10 sets of measured input-output data, and compared each input-output data to the predicted SOH with the measured SOH. (4) Find the most accurate predicted SOH and determines the point-wise parameters that correspond to the most accurate prediction of SOH value. It will end up with 10 sets of parameters. Average out these 10 sets of parameters to obtain mean values and standard deviations which will be used in generating next 10,000 sets of random parameters. (5) Regenerate point-wise optimal solutions and the associated mean values and standard deviations. (6) Repeat steps (2)–(5) until 25 batches (each has 10 points of data) of measured data have been examined and optimal parameters have been updated. (6) Average out the optimal parameters of previous 25 batches and apply the parameters obtained to the remaining SOH prediction.

3. Test Results

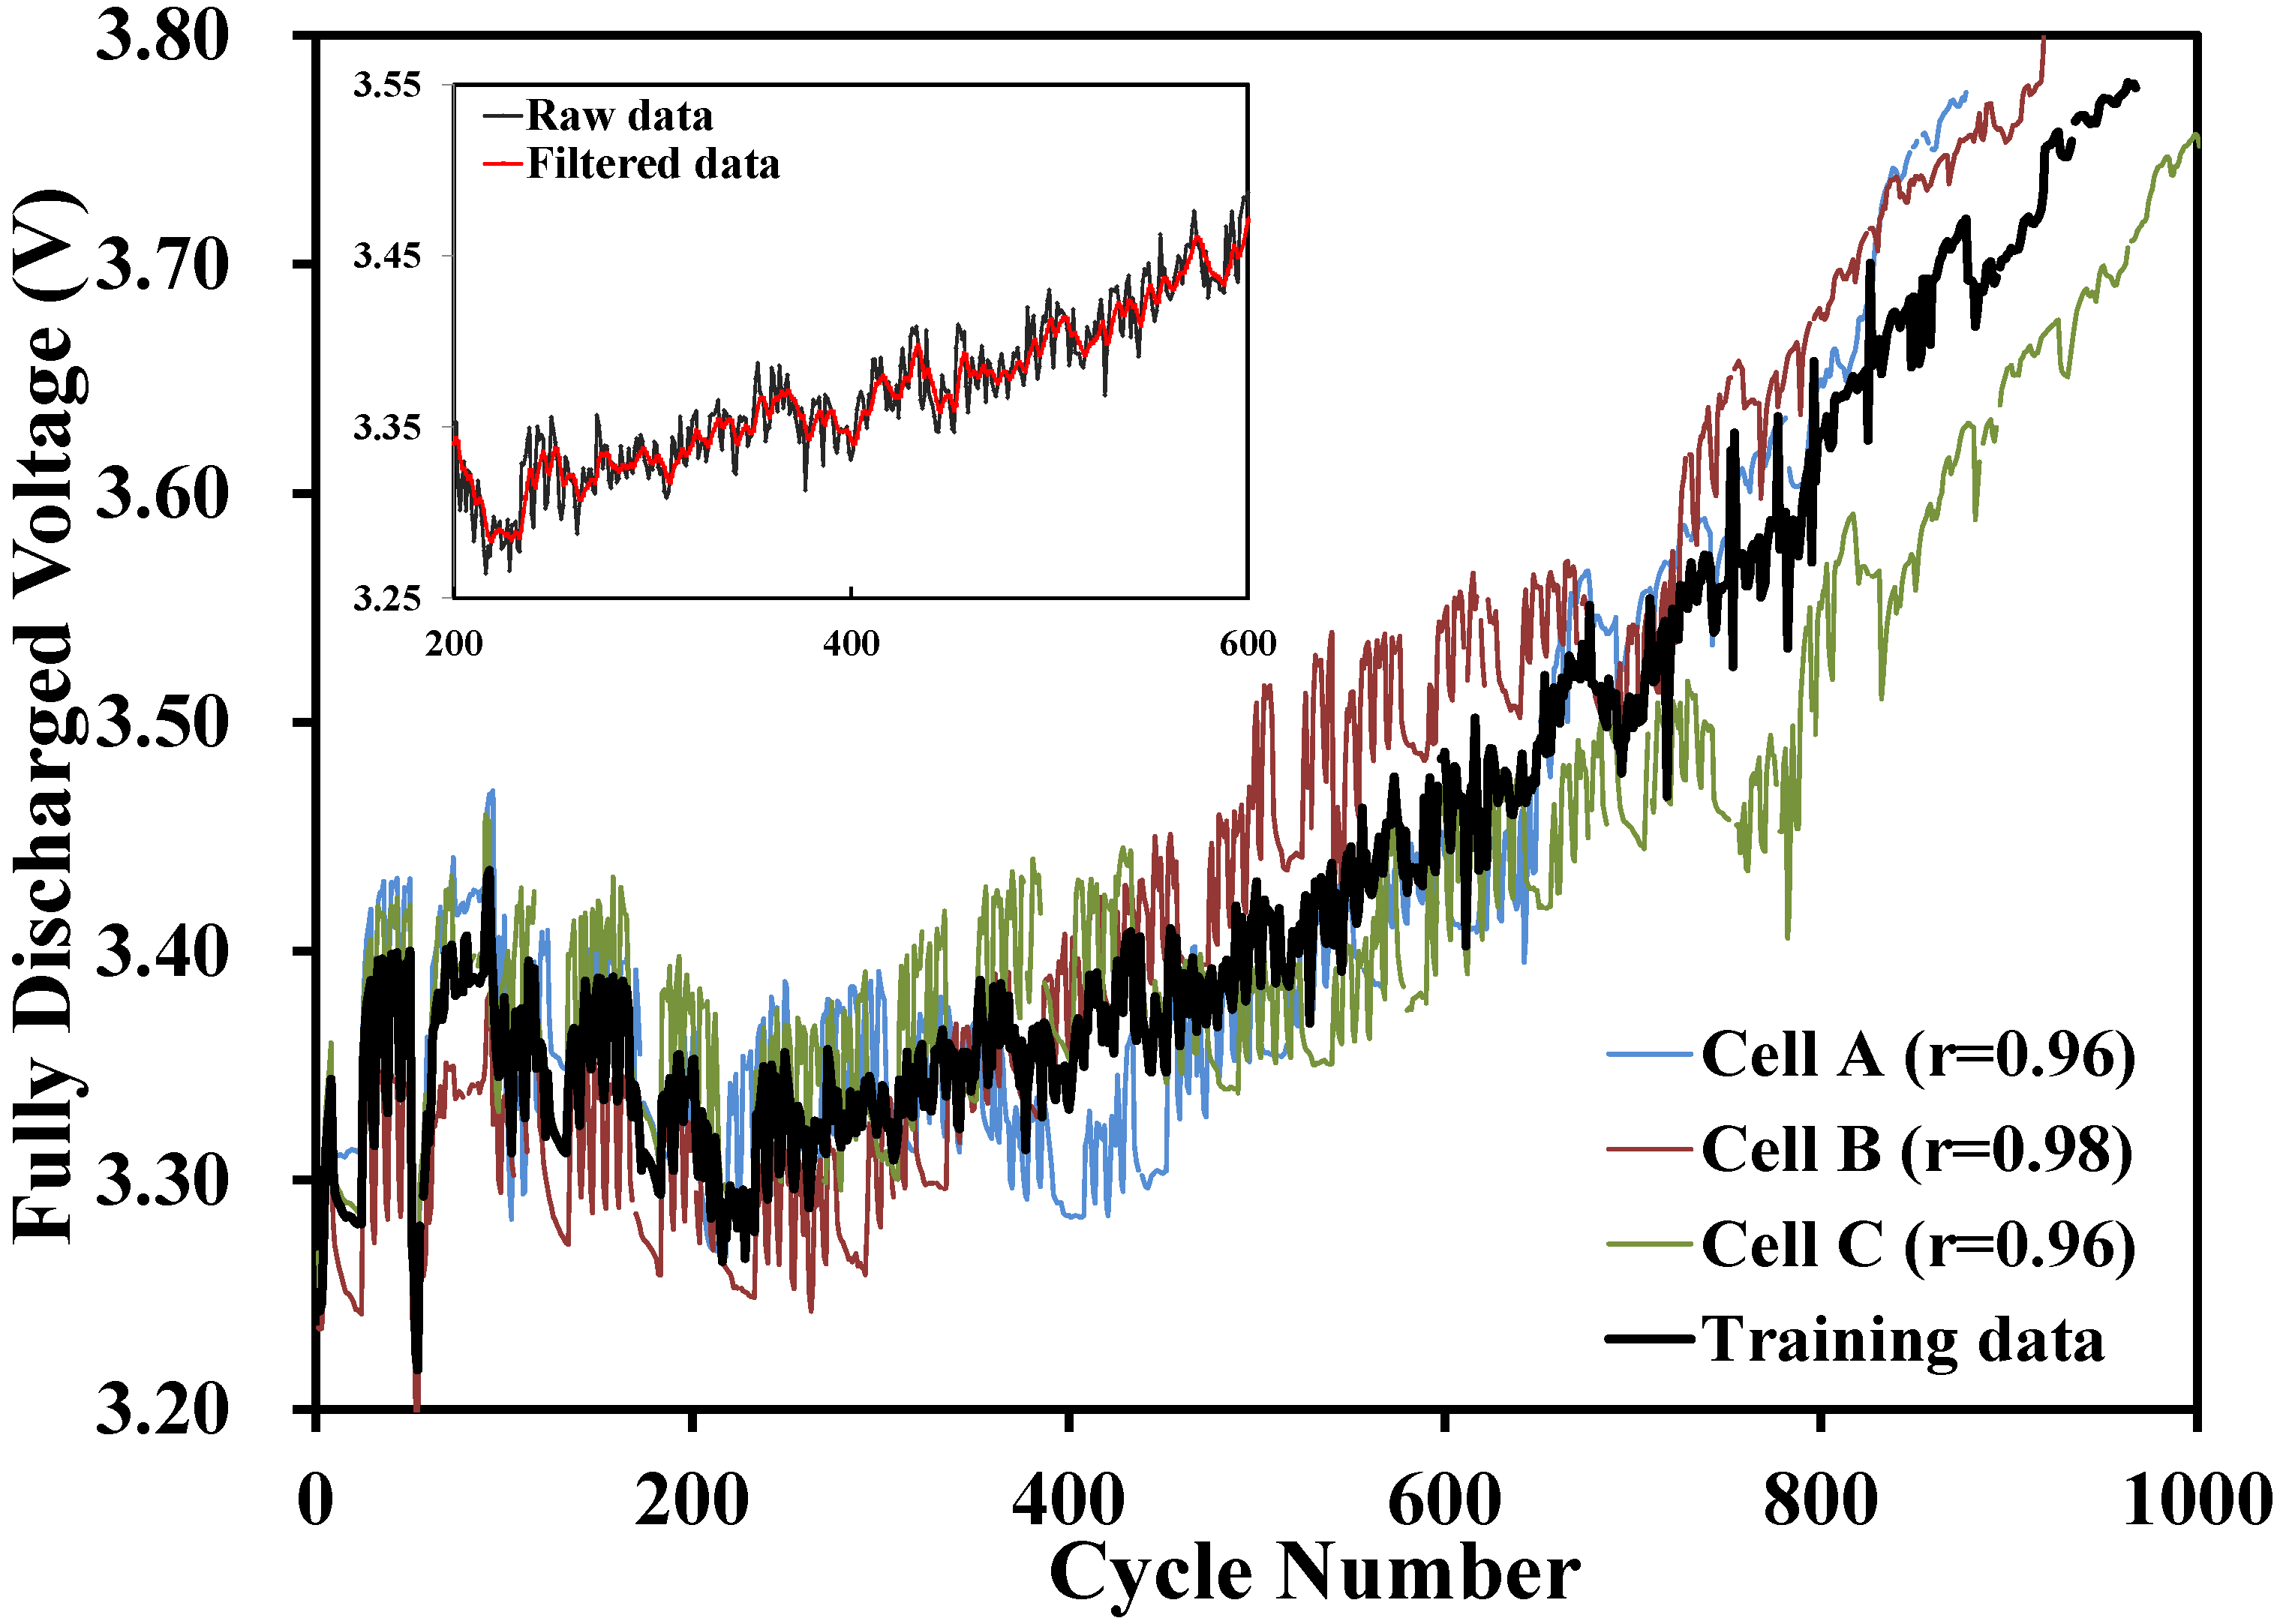
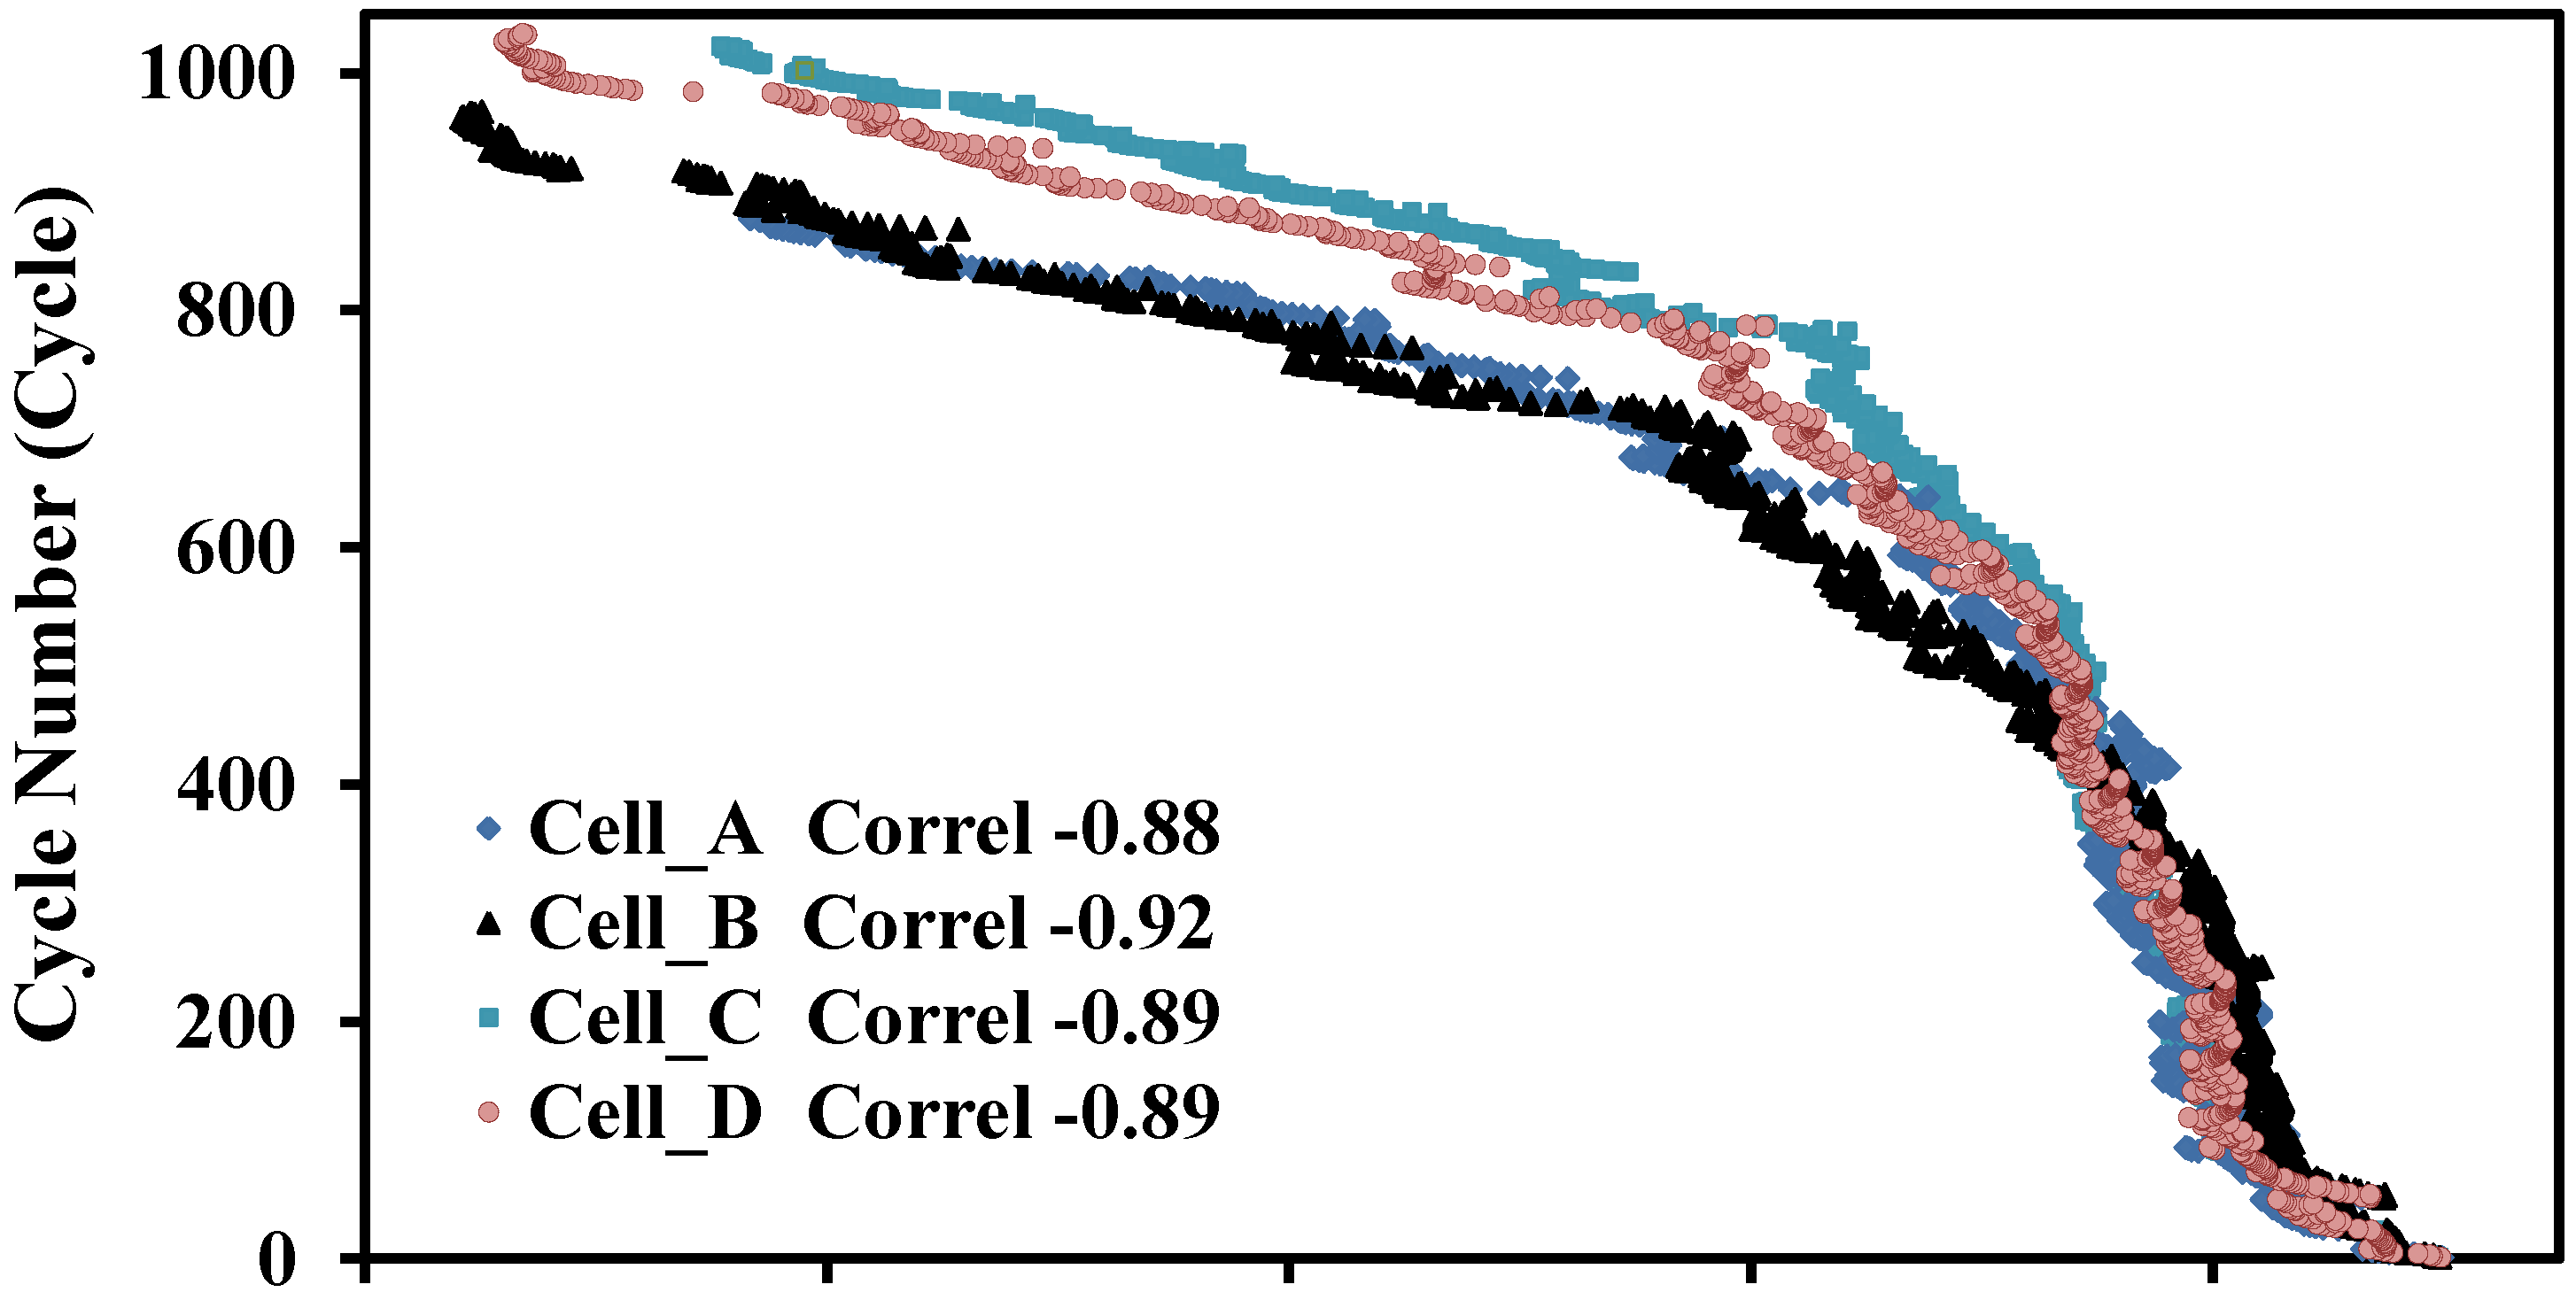
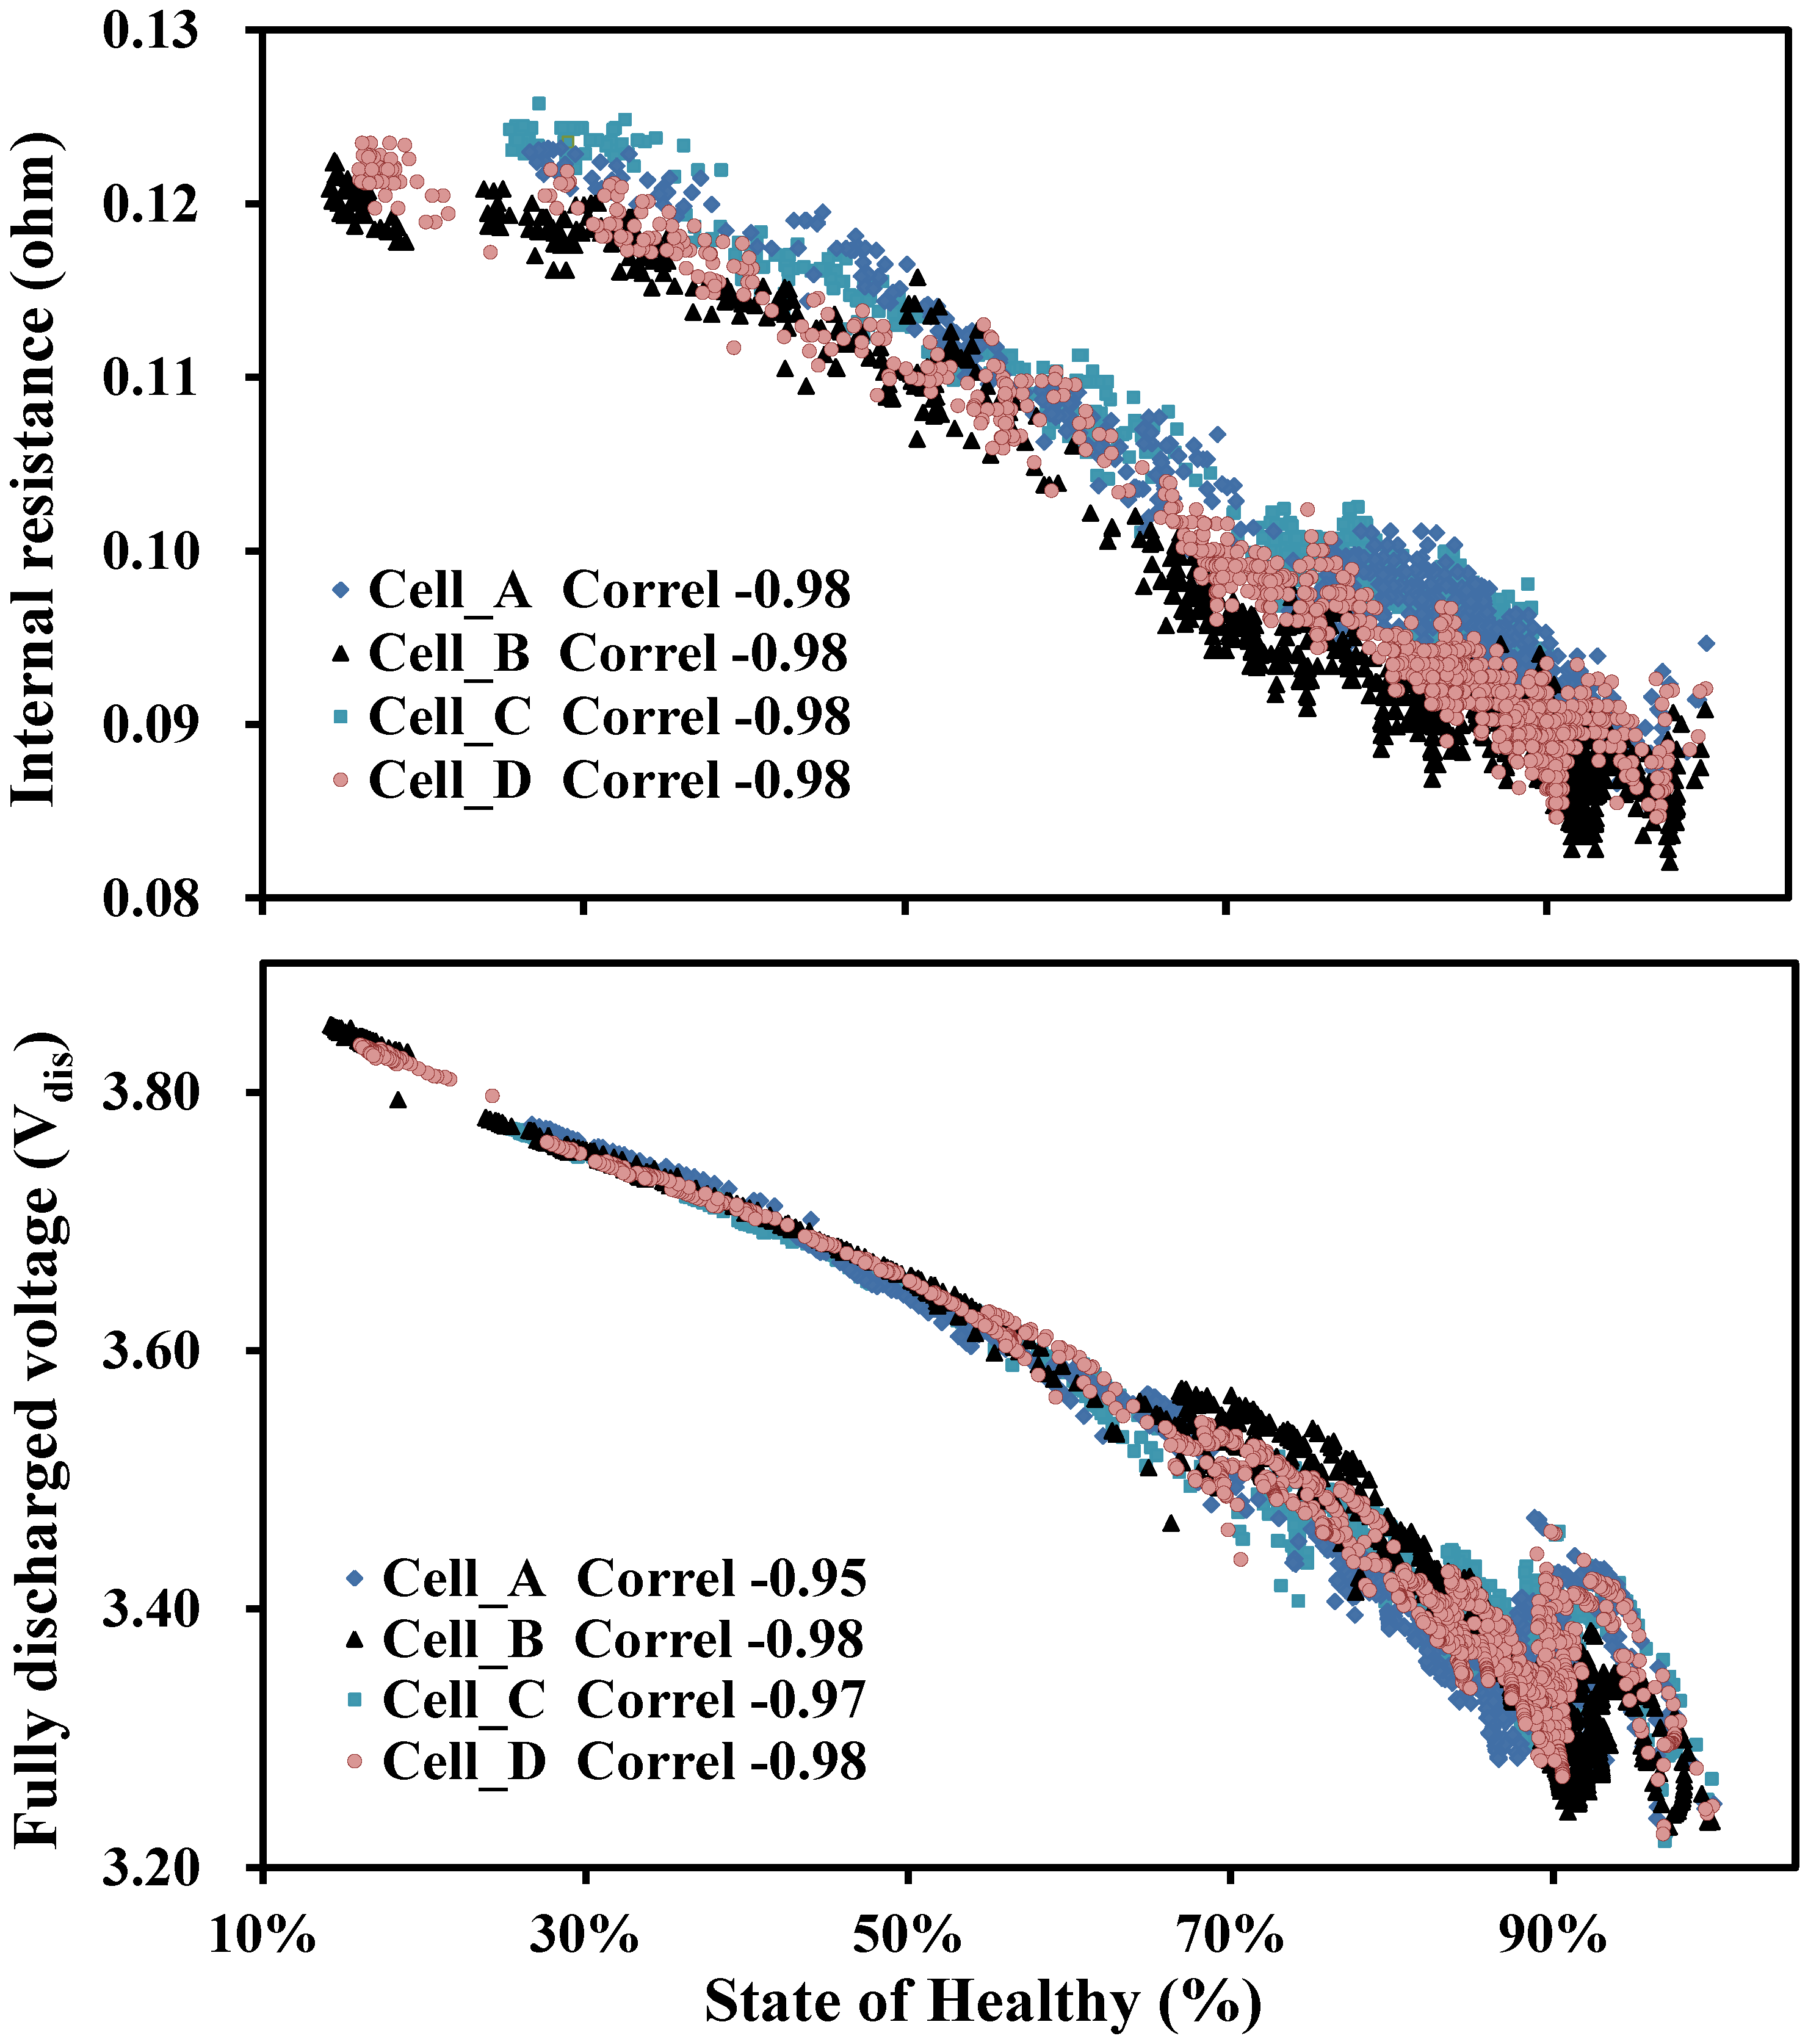
3.1. The Correlations of N, Vdis, R and SOH

The SOH of a battery is often evaluated according to the battery’s internal resistance or its ability to deliver a given amount of charge. Though the tested batteries were of the same batch it is known that in the battery manufacture and assembly process there inevitably exist some uncertainties. The individual variations among them have to be in an acceptable range to assure the accuracy of regression models. The profiles of SOH versus N for the four tested batteries are illustrated in Figure 3 to show their correlations (>0.97). High correlations among them allow us to use these data in the subsequent modeling and validation. The battery aging phenomenon, from the SOH profiles, showed the degradation was non-uniform with N. SOH decreases moderately when N falls between 100 and 600. After 600 cycles, SOH descends sharply and the four SOH profiles differentiate more obviously in this stage. When the number of cycles exceeds 600, SOH values approach 80% and the batteries are expected to die soon.
Figure 3. The SOH profiles correlated to N for the four tested batteries.
Energies 08 02889 g003
The authors measured the fully discharged voltages recovered after the resting time in a separate experiment and the results are shown in Figure 4. The voltage soon after a complete discharge is usually still in transient state. It is necessary for the battery to rest for a few seconds to quench the transient oscillation. Three voltage curves, recorded every 30 s, with respect to different resting times of 3, 10, and 30 min are shown. These voltage curves are very close to each other and all consistent in trend. The voltage increases gradually and eventually reaches a steady value, presumably the OCV. This figure implies that using the OCV or some earlier measurements for SOH modeling would make less difference as long as the measurements are consistently taken at the same time instant. The OCV is hereafter replaced by an earlier measurement (60 s), denoted Vdis throughout the test because it is more feasible in real applications.
Figure 4. Fully discharged voltage recovers with rest time for three different cases.
Energies 08 02889 g004
Figure 5 shows, separately, the correlations of SOH with the three aging parameters, N, R and Vdis for the four batteries. The results indicate SOH is strongly correlated to Vdis and R with coefficients higher than 0.95, compared to N of lower 0.9. This implies that using Vdis and R is more appropriate than using N in describing the battery aging phenomenon. The authors therefore derive new regression models of SOH using these two parameters, Vdis and R as follows.
The values of Vdis and R vary in a relatively small range throughout the battery’s useful life and appear to be sensitive to the complex chemical reactions, operating environment and measurement process, thus resulting in the significant data fluctuations shown in Figure 6. A filtering process after the raw data is collected is helpful to smooth out Vdis and R fluctuations. The raw data of Vdis and R are extracted by the first order low-pass Butterworth filter in MATLAB®, in which the cut-off frequency is 0.1 Hz. Figure 6 illustrates cell A, B, C’s test data and their averaged (training data). The training data before and after filtering are contrasted on the figure’s upper left corners. The correlation coefficients between unfiltered and filtered data are high: 0.993 and 0.995, respectively for Vdis and R. The filtered data are apparently smoother and hence used for SOH modeling.
Figure 5. Correlations of SOH and aging parameters (N, R, and Vdis) for four batteries.
Energies 08 02889 g005aEnergies 08 02889 g005b
Figure 6. Illustrations of raw data, training data and filtered data.
Energies 08 02889 g006aEnergies 08 02889 g006b

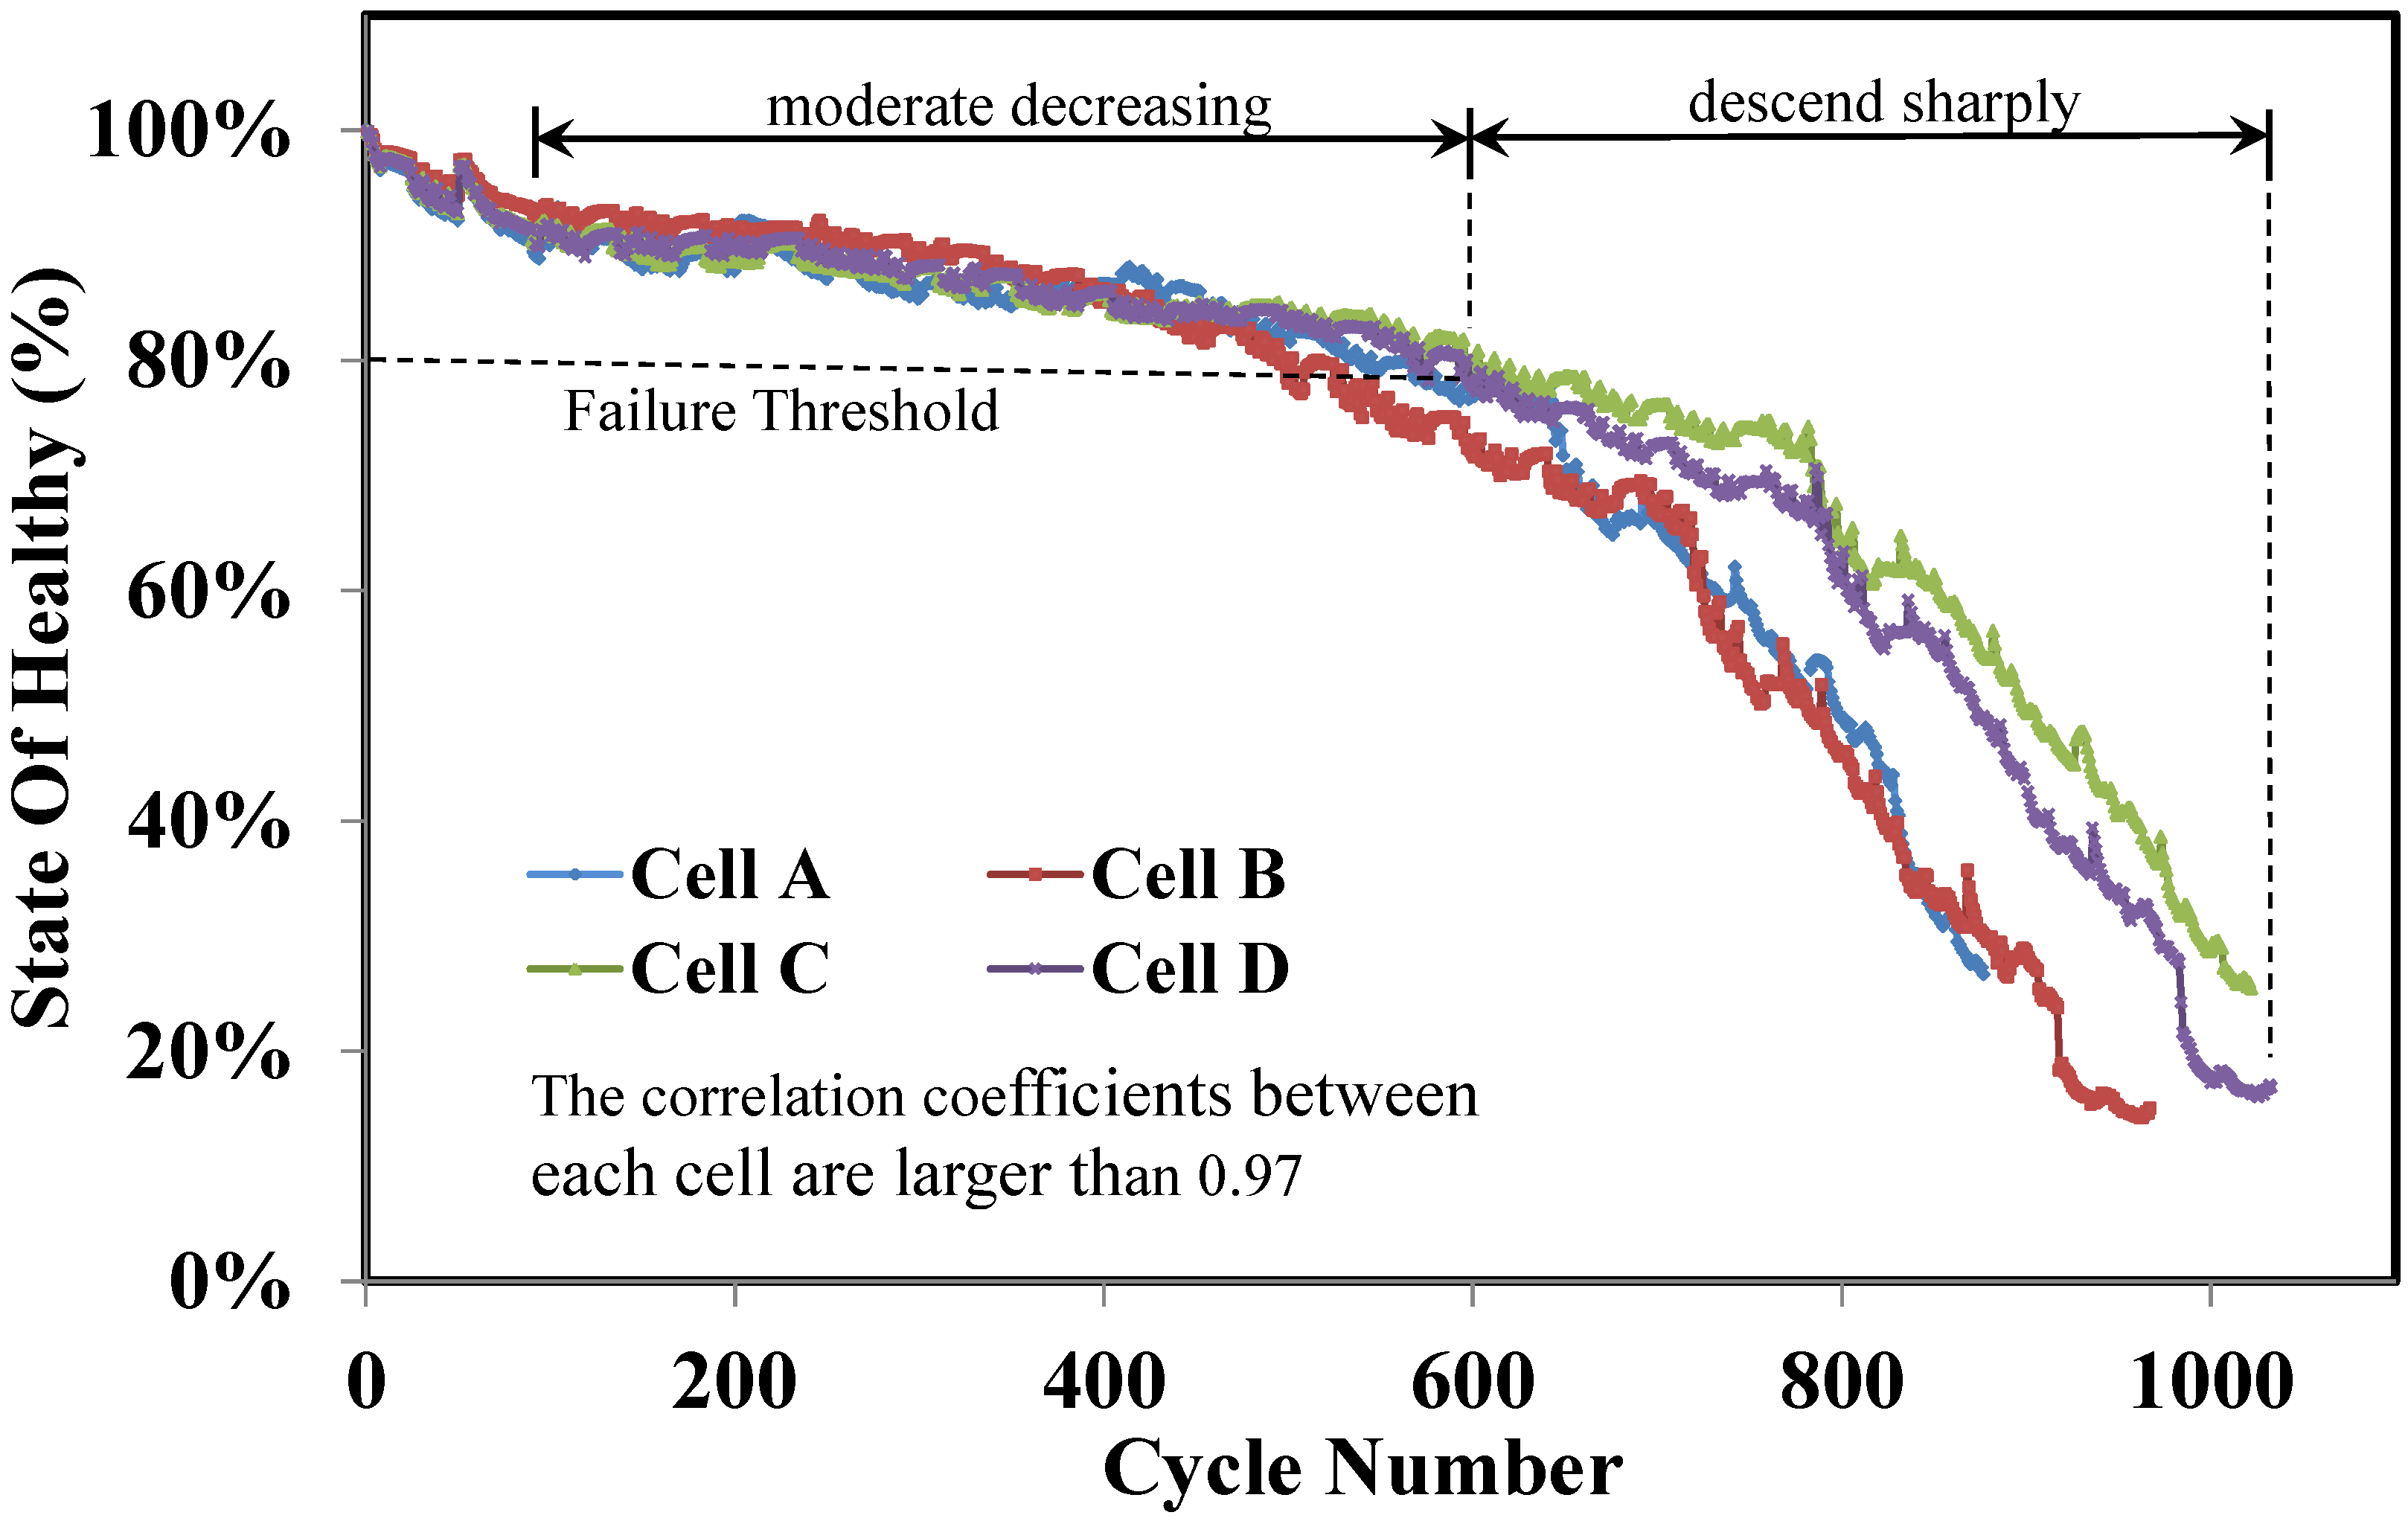
3.2. Degradation of SOH

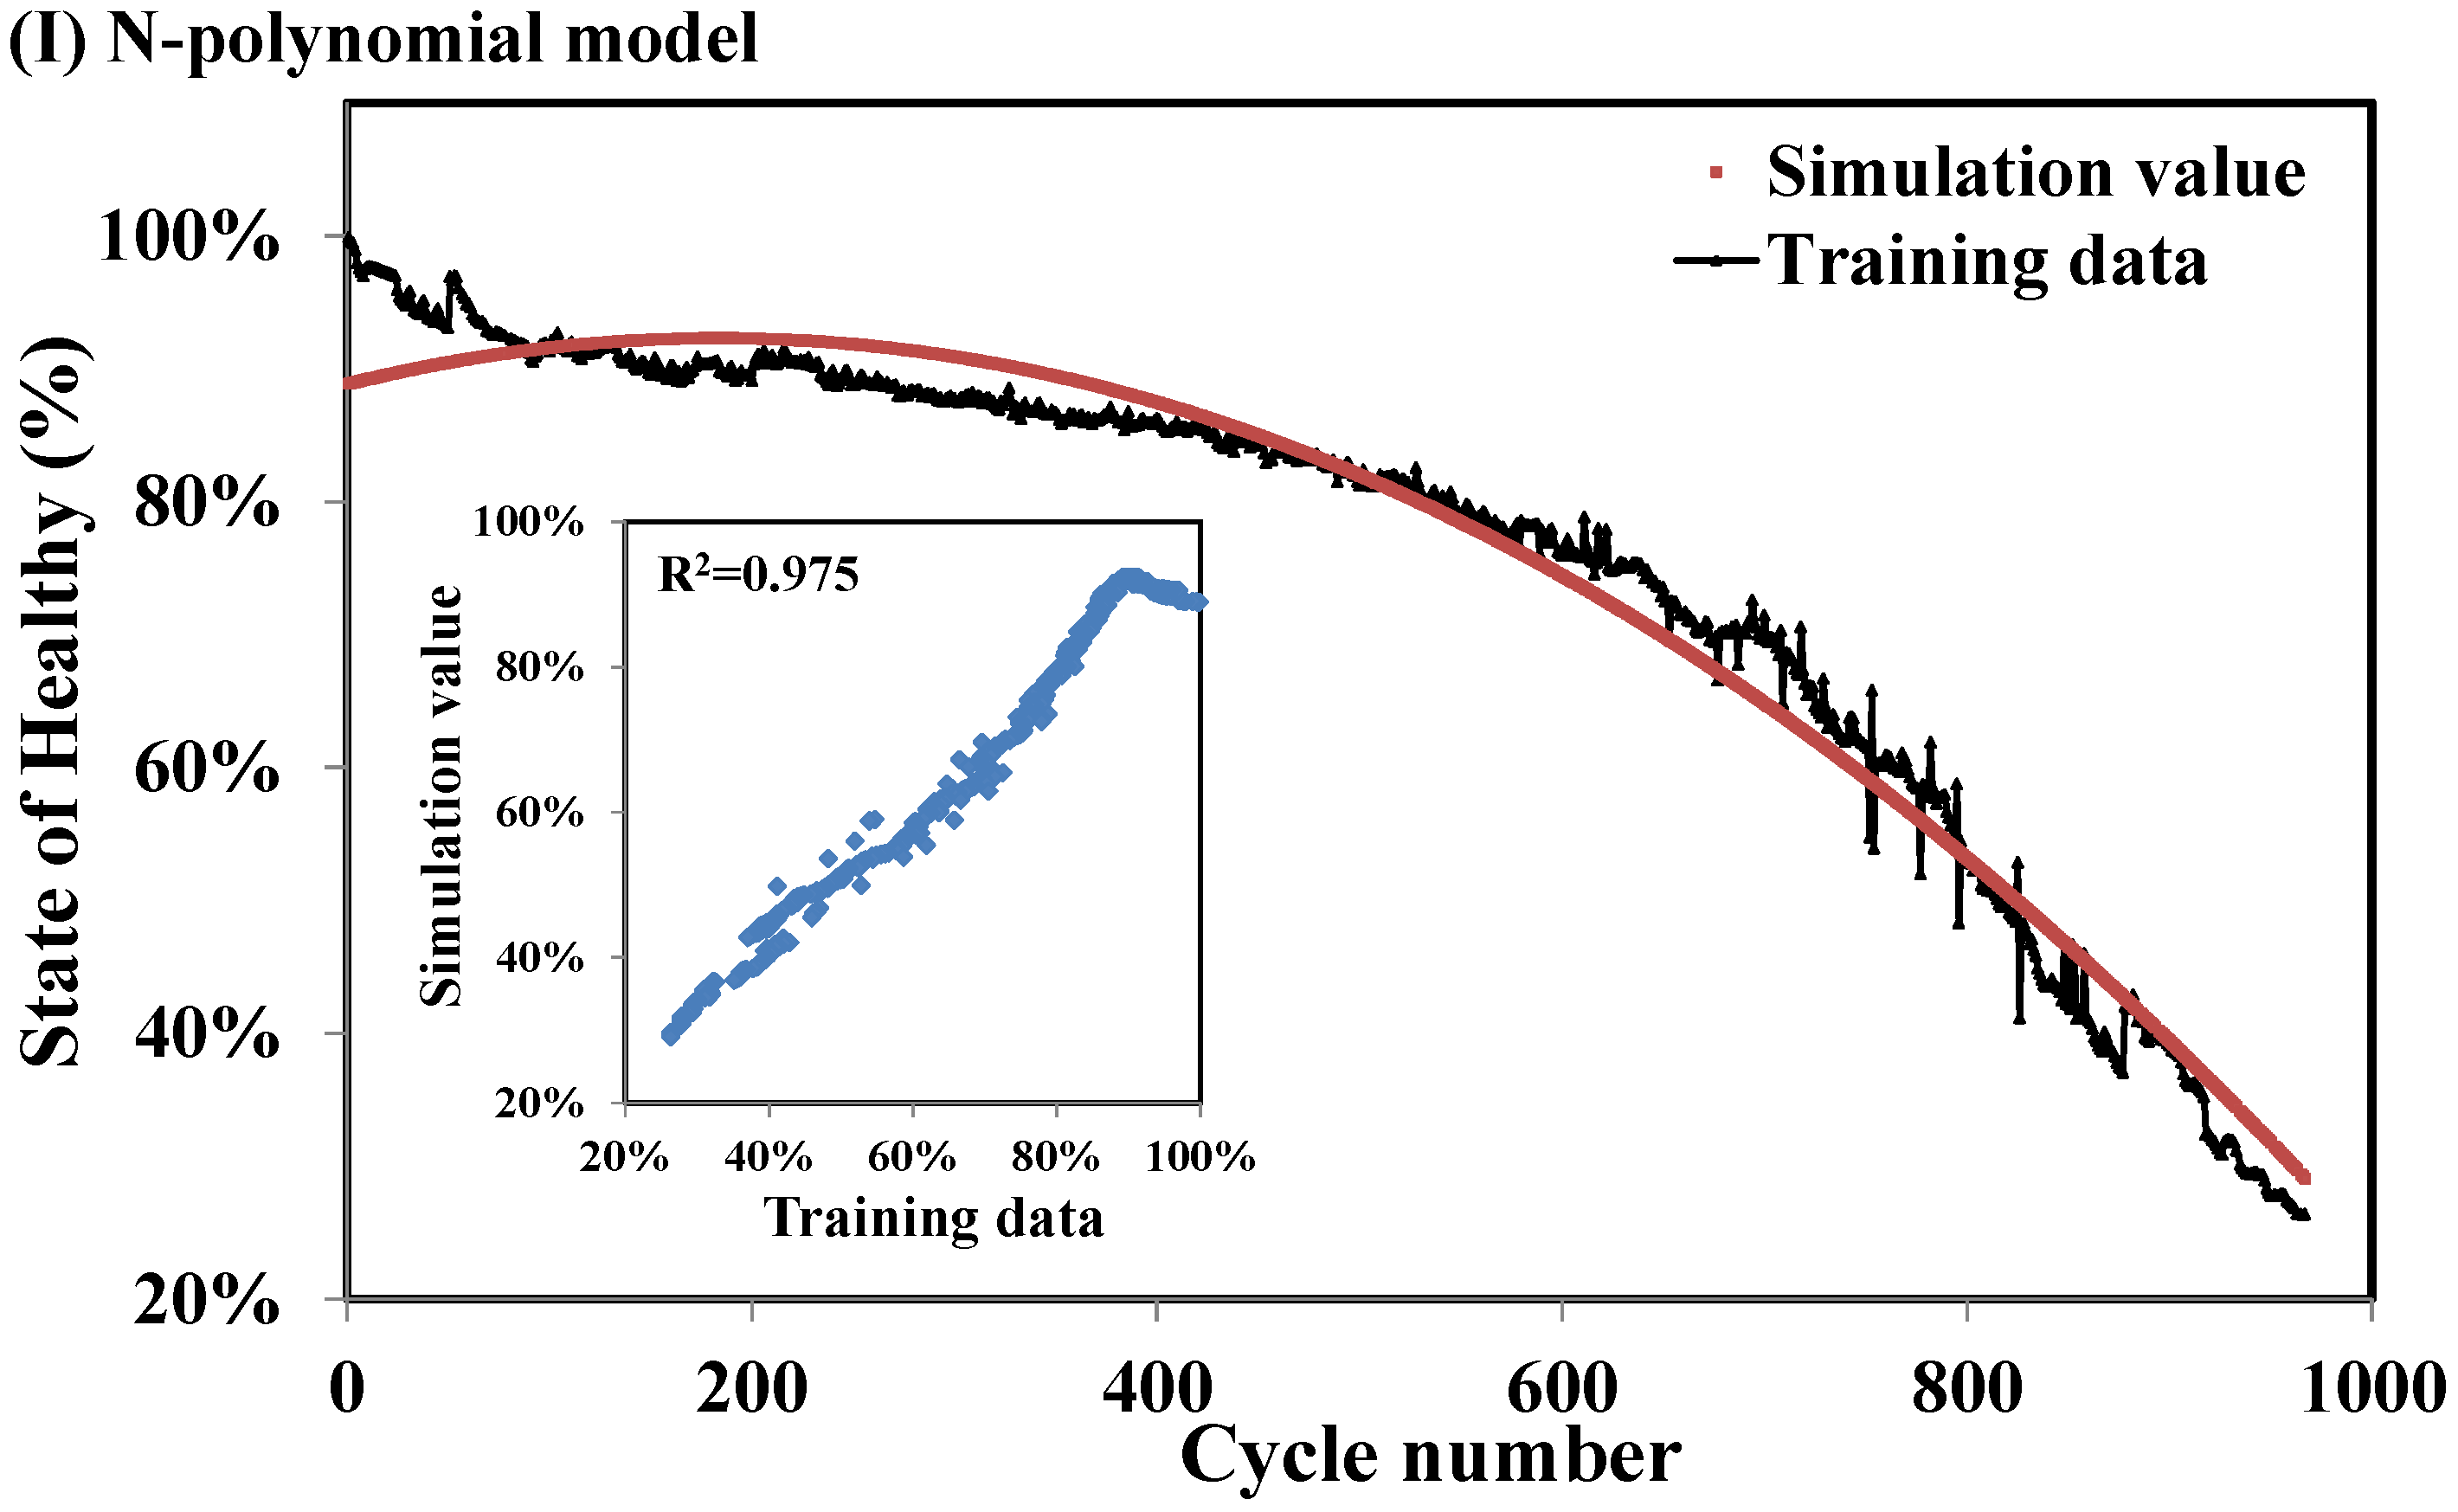
3.2.1. (A) Cycle Number and SOH Degradation

SOH decays with the increase of charge/discharge cycle number N. Therefore, the charge/discharge cycle number N has been widely used for estimating the SOH via regression process. Micea et al. [30] used cycle number as the only variable in a second-order polynomial regression model, i.e.:
Model I (N-polynomial):
S O H N = γ 1 N 2 + γ 2 N + γ 3
where the subscript N stands for cycle number and γi are the model coefficients. The above equation will be used as well in the present study to reconstruct SOH degeneration model in [36]. The coefficients, via the least square fitting method of MATLAB®, are obtained as −0.000001, 0.0003 and 0.8969 for γ1, γ2 and γ3, respectively. Figure 7I shows the fitted curve of Equation (2). The coefficient of determination (R2) for empirical relationship of SOH is 0.975.

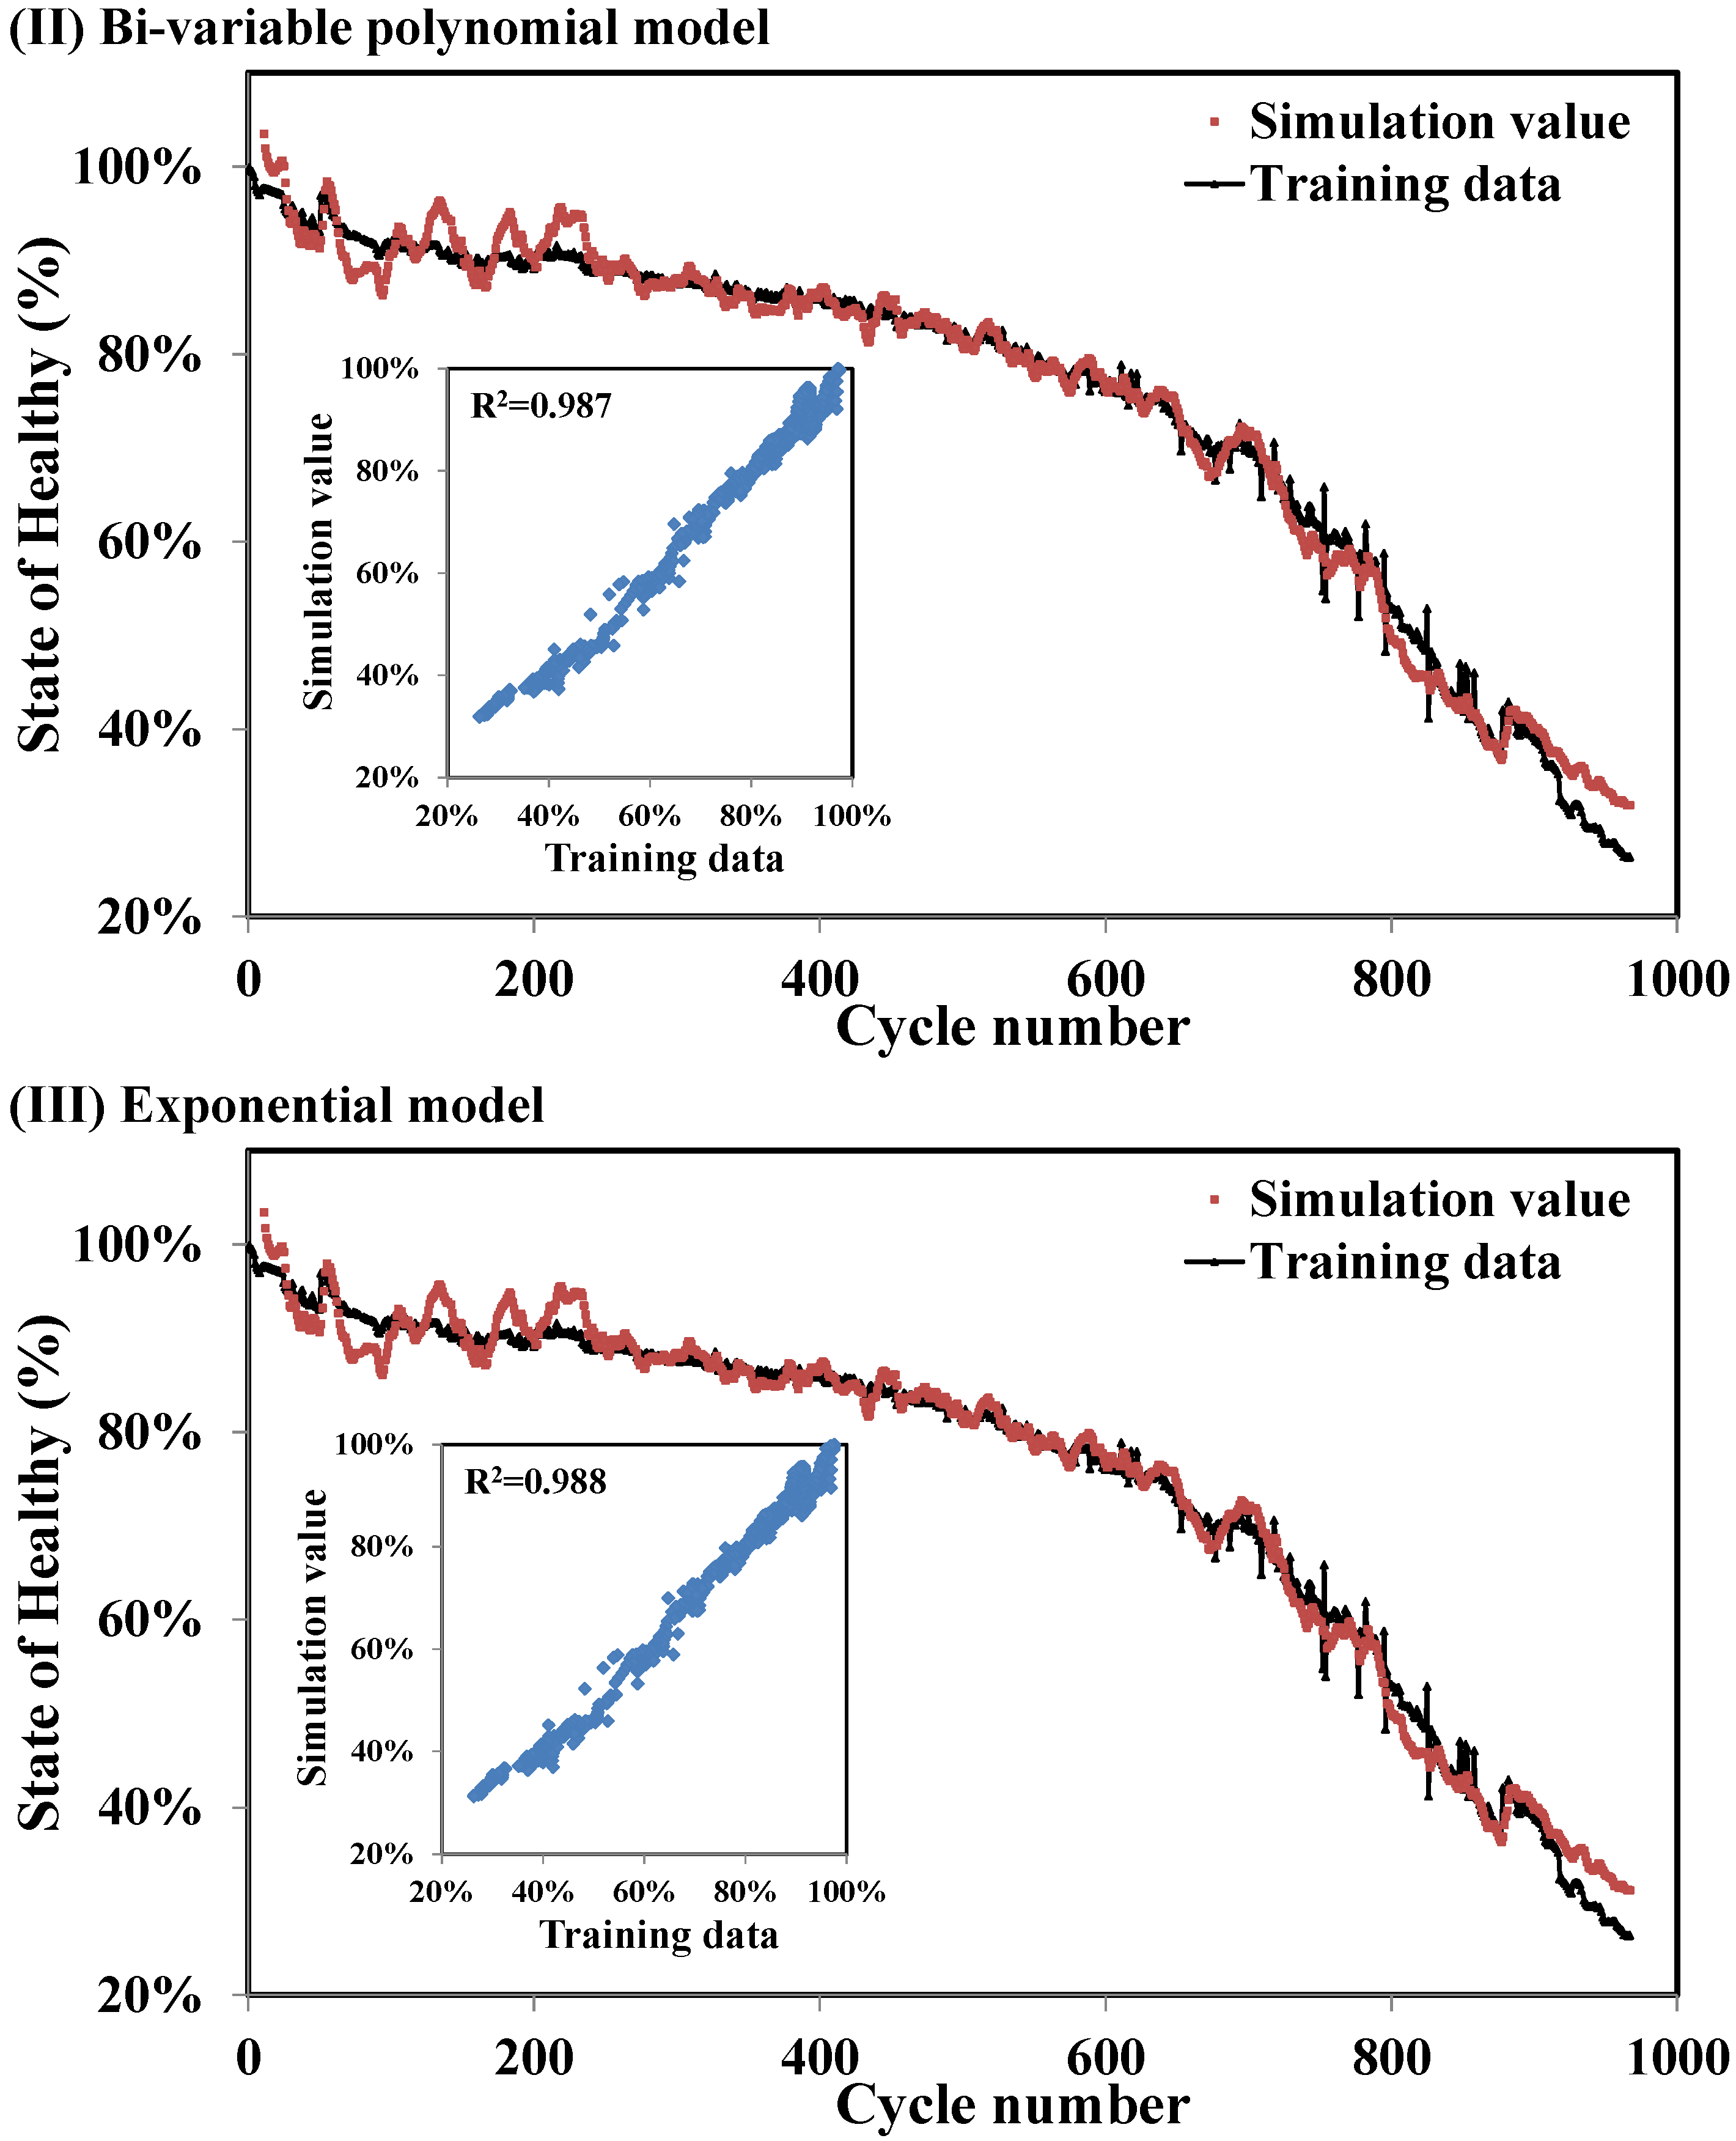
3.2.2. (B) New SOH degradation model via Vdis and R

Polynomial and exponential types were frequently used for establishing SOH degradation model in the existing literature. The authors hence adopt these two types of functions to build new SOH degradation models but using Vdis and R rather than N as the aging parameters. The two models, called bi-variable polynomial (Model II) and exponential (Model III), are:
Model II (Bi-variable polynomial):
S O H N = α 1 V d i s , N + α 2 R N + α 3
Model III (Exponential):
S O H N = β 1 e β 2 V d i s , N + β 3 e β 4 R N
α’s and β’s are the models coefficients; α1, β1, β2 are related to voltage; α2, β3, β4 are associated with internal impedance; α3 is a bias constant in the bi-variable polynomial model.
We apply the training data in Equations (3) and (4) and employ the PSO method for the model coefficients. The simulations from Model II and III (red) and the original training data (black) are superimposed in Figure 7II,III. Both models closely resemble the training data with a significant correlation. Using Vdis and R in both polynomial and exponential models is inferred, from a comparison with Figure 7I, to be better than using N in polynomial model. The degrees of fitness of these two models, in model coefficients, R2, average error and root mean squared error (RMSE), are given in Table 1. The R2 turn out very high (>0.987) and RMSEs are very close to zero. That infers these two new SOH degradation equations are adequate to reflect a battery’s SOH. The fitness of model III is slightly better than model II if simply the model statistical parameters are compared.
Table 1. Parameters of regression model II and III.
RelationshipsModel IIModel III
S O H N = α 1 V d i s , N + α 2 R N + α 3 S O H N = β 1 e β 2 V d i s , N + β 3 e β 4 R N
Coefficientα1: −0.4546; α2: −13.5975 α3: 3.6551β1: 4.7603; β2: −0.2189 β3: −0.6383; β4: 8.5675
Avg. error (%)1.661.59
R20.9870.988
RMSE0.0220.021
Figure 7. SOH degradation curves of three different models.
Energies 08 02889 g007aEnergies 08 02889 g007b

4. Discussion

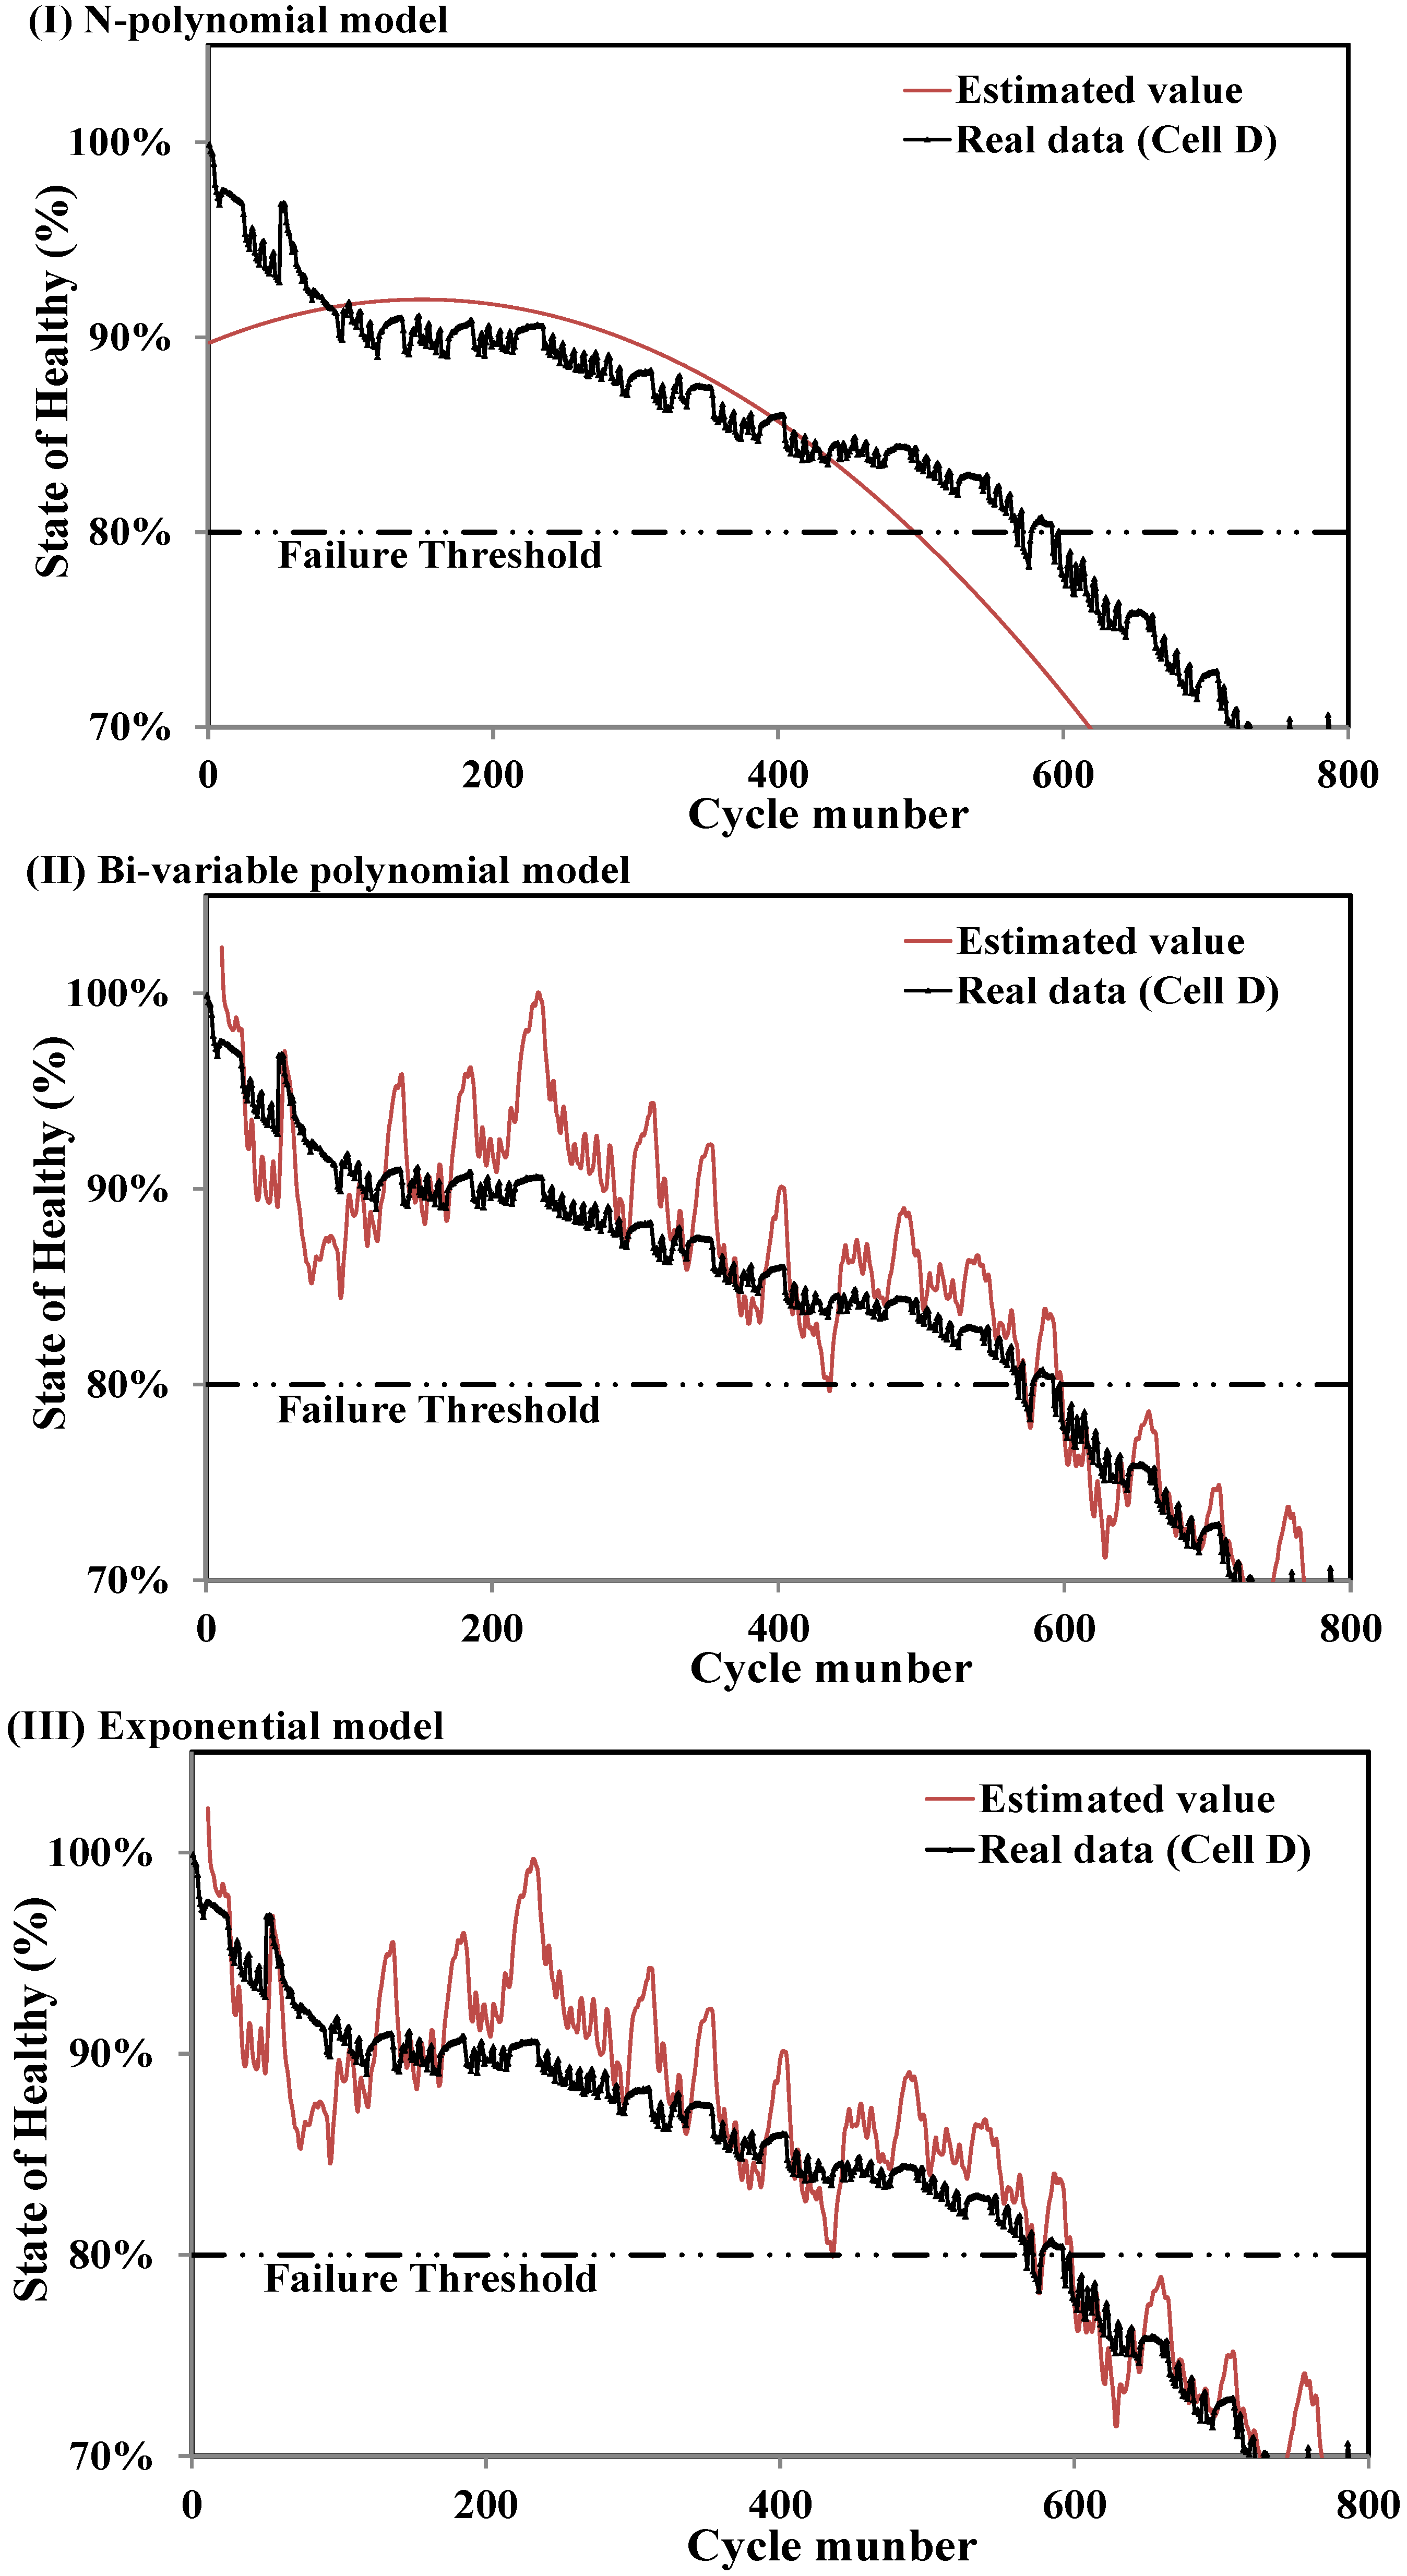
4.1. Battery Cycle Life Prediction

The R2 and RMSE of the proposed models after comparison with the training data have shown excellent suitability. Experimental data of D are now applied to all three models and inspections of the cycle life predictions are examined. The results and comparisons are given in Table 2. All models’ R2 are approaching 1 indicating appropriate fitness. The RMSE’s are 0.066, 0.034 and 0.032 and the estimated cycle lives are 500, 577 and 599, respectively, for Model I, II (open) and III (open). Compared to the experimental real life of 576 cycles, the errors are 76 (13.2%), 1 (0.2%), and 23 (4.0%). From these comparisons, the prediction by Model II is the most accurate, then III and I. Figure 8 overlaps the experimental data of D (black) and the calculated data of the newly derived and the existing one (red). Model I uses N as the aging parameter, which is monotonically increasing, and Equation (2) is a 2nd degree polynomials in N. The SOH curve of Model I, Figure 8I, is not surprisingly a smooth one. Models II and III use Vdis and R as aging parameters, which are fluctuating in nature, therefore the curves in Figure 8II,III oscillate. Nevertheless, the predictions by Equations (3) and (4) are apparently superior to that of Equation (2).
Figure 8. SOH calculations compared with D’s test data.
Energies 08 02889 g008
The verification through D’s data inferred using the bi-variables, Vdis and R, in regression models is better than using N alone. That the difference between Model II and III is not so obvious implies that a polynomial or exponential model makes less difference as far as Vdis and R are used as main parameters and employing the same PSO scheme.

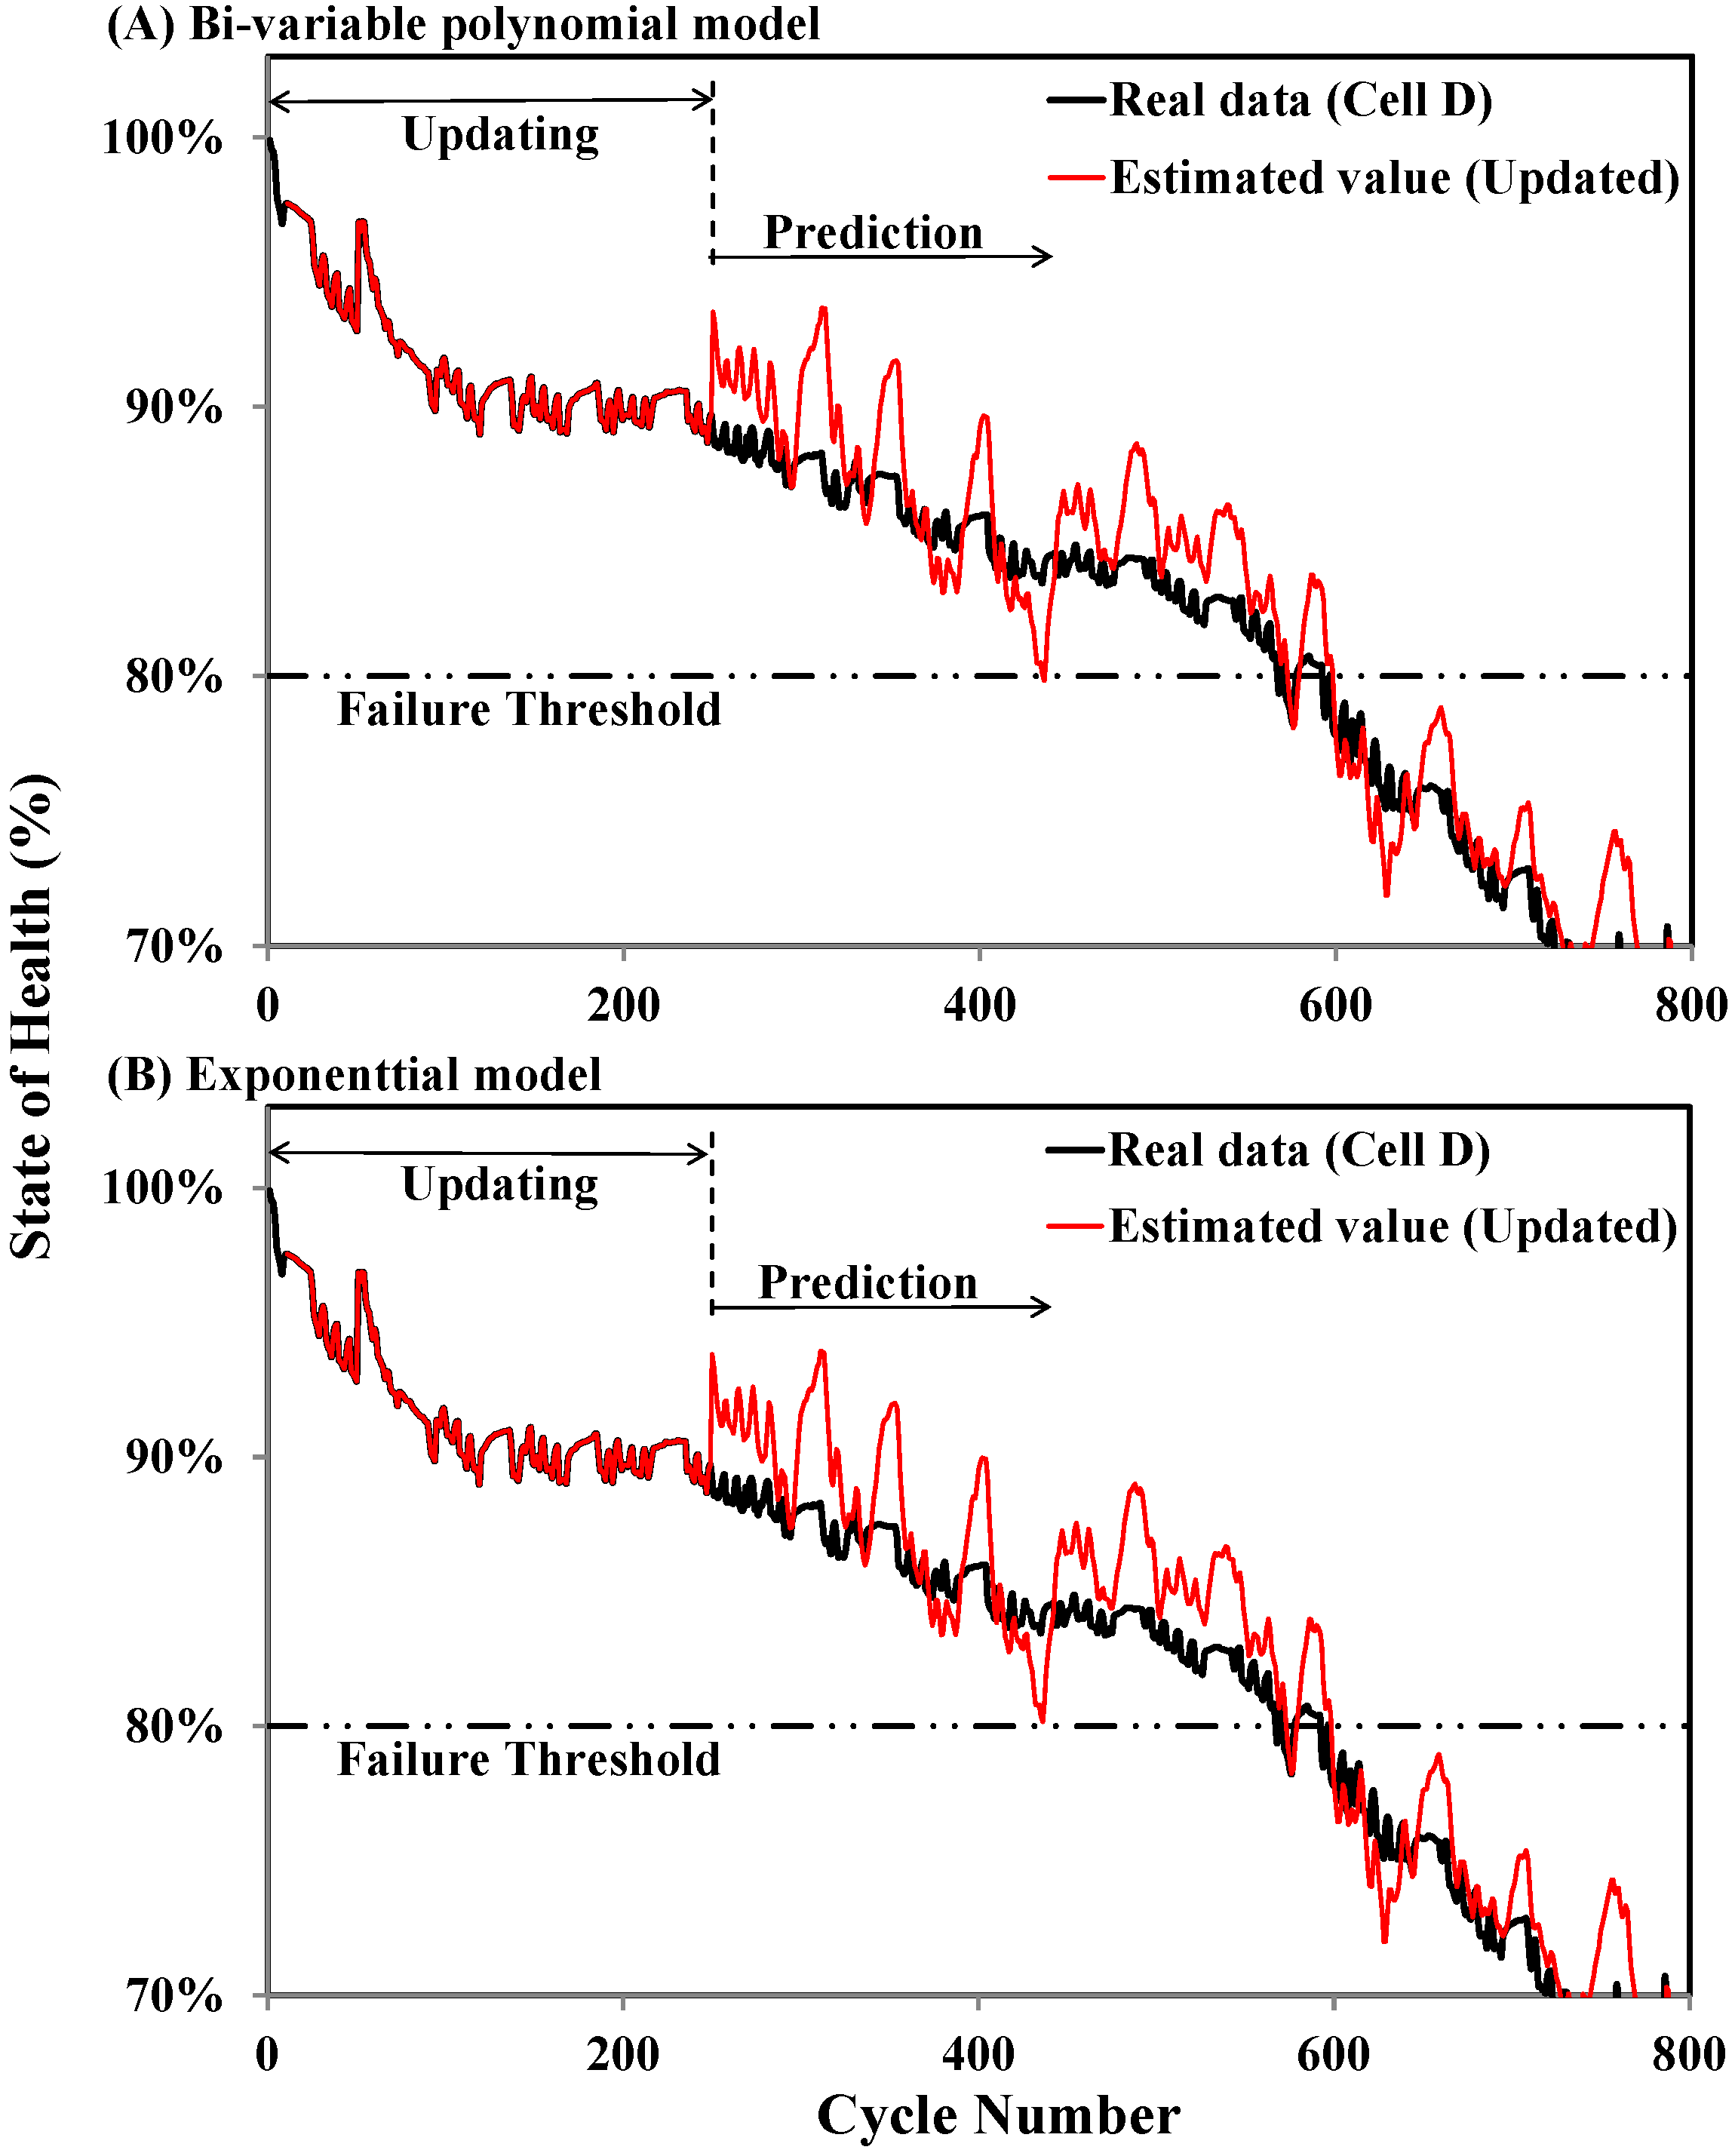
4.2. Battery Cycle Life Prediction with Model Updating

The operation mechanism of a battery is an electrical-chemical reaction. This reaction is complex and relies strongly on the battery’s manufacturing process and operational environments. A regression model always needs to take each battery’s individual variations into account when implementing real applications. One of the possible ways is to provide the model with self-updating or so-called adaptive ability. Extended Kalman filter, neuro-fuzzy, and Monte Carlo are some of the feasible algorithms to achieve this purpose. He et al. [37] employed the Bayesian Monte Carlo method and obtained satisfactory results. The authors herein implemented the Monte Carlo method in the developed models to see if the life predictions could be improved. The process is described as Section 2.4. The previously obtained model coefficients from the training data are updated using every 10 cycles of D’s experimental data up to 250 cycles. After that, the models are fixed and run for cycle life predictions.
The predicted results of bi-variable polynomial and exponential model are given in Table 2 under the label “Adaptive.” It shows that the adaptive function although it enhanced the degrees of fitness, i.e., increasing R2, the life prediction shows no apparent improvement.
Table 2. Predicted battery D’s cycle life from the three models.
TypeStateR2RMSECycle life prediction
CycleError (%)
Model IOpen0.9560.066050076 (13.2)
Model IIOpen0.9770.03425771 (0.2)
Adaptive0.9860.03505771 (0.2)
Model IIIOpen0.9800.032259923 (4.0)
Adaptive0.9880.028059923 (4.0)
These results imply that the derived models employing Vdis and R as aging parameters and PSO scheme for coefficients are already accurate enough and reach their limit in life prediction. Figure 9 shows D’s experimental data (black) and the predicted values with MC updating (red), respectively. After updating, R2 is very close to 1 but the cycle life predictions remain unchanged.

4.3. Comparison of Models with Existing Literature

The predicted cycle lives via the derived models are now compared with those obtained from the existing models. Polynomial and exponential models have been widely cited to establish SOH degradation curves, e.g., by Xing et al. [38] and He et al. [37]. In their models, cycle number (N) was the only aging variable and both implemented an adaptive function to update the model coefficients. The comparisons with the present research are shown in Table 3 and Table 4. In Table 3, the second column is directly digested from [47] and the third column is the result of replicating their approach onto the present data of battery D. The forth column is those of bi-variable polynomial model. Using Vdis and R is apparently better than using N in life estimation as is observed from the comparisons.
Figure 9. Predictions with updating function in bi-variable polynomial and exponential model.
Energies 08 02889 g009
Table 3. Comparison of the results of polynomial model.
ResearchXing et al. [38]This study (Eq. 2)This study (Eq. 3)
Battery typeLithium-ionLiCoO2LiCoO2
Capacity (Ah)1.351.11.1
Equation C N = p 1 N 2 + p 2 N + p 3 S O H N = γ 1 N 2 + γ 2 N + γ 3 S O H N = α 1 V d i s , N + α 2 R N + α 3
ConditionLSA & PFLSAPSO & Monte Carlo
VariableCycle numberCycle numberVdis, R
R20.96~0.980.9500.98
Performance102 cycles earlier76 cycles late 1 cycle late
Table 4. Comparison of the results of exponential model.
ResearchHe et al. [37]Xing et al. [38]This study (Eq. 4)
Battery typeLithium-ionLithium-ionLiCoO2
Capacity (Ah)1.11.351.1
Equation Q N = a exp b N + c exp d N Q N = a exp b N + c exp d N S O H N = β 1 e β 2 V d i s , N + β 3 e β 4 R N
ConditionDST & Monte CarloLSA & PFPSO & Monte Carlo
VariableCycle numberCycle numberVdis, R
R2--0.980.98
Performance7 cycles3 cycles earlier23 cycles late
In the cases of exponential modeling, Table 4 illustrates the results of [37], using Dempster–Shafer theory (DST), of [38], using Least Squares Approach (LSA) plus Particle Filtering (PF), and the present work. Using cycle number N as the aging parameter seems better than using Vdis and R, as seen from the table. The authors yet would remind readers that both references [37,38] employed adaptive function but the present model need not.

5. Conclusions

Lithium-ion batteries are core components in a wide variety of power source systems. Battery health monitoring, as a result of the increasing demand for lithium-ion batteries, has become more important than ever. This study combined statistical methods, regression models, and the particle swarm optimization scheme to develop new models for battery prognostics. Four identical batteries were tested and grouped into training set and validation set. N, Vdis, R were measured as aging parameters in each cycle and two different types of model, polynomial and exponential, were examined. Models employing Vdis and R as aging parameters were developed and compared to similar researches which used N was the only parameter. The authors have arrived at the following conclusions through the comparisons of SOH models and cycle predictions:
  • The SOH curves decayed slowly with N in the beginning, then dropped sharply as SOH approached the failure threshold, as observed from reliability test.
  • SOH is highly correlated to Vdis and R, as indicated from the test data, so that Vdis and R are suitable parameters for SOH modeling. Using Vdis and R as aging parameters rather than the commonly used N further proved to have better cycle life prediction as referred to R2 and RMSE values.
  • The PSO algorithm yielded optimal model coefficients and partially because of PSO was used, the selection of model type, polynomial or exponential, showed less significance. Both of the derived models accurately generated results resembling the real SOH curves of tested batteries.
  • Regarding the discrimination between polynomial and exponential model, the present study showed in the polynomial model using Vdis and R as model parameters is superior to using N, but in the exponential model using N yielded better life predictions.

Acknowledgments

The authors would like to thank M. Pecht and the Center for Advanced Life Cycle Engineering (CALCE) of University of Maryland, for providing the reliability testing data of the Lithium-ion battery. This research was supported by Taiwan’s Ministry of Science and Technology under the Grant Numbers NSC 102-2632-E-131-001-MY3.

Conflicts of Interest

The authors declare no conflict of interest.

References

  1. Mierlo, J.V.; Maggetto, G.; Burgwal, E.V.D.; Gense, R. Driving style and traffic measures influences vehicle emissions and fuel consumptions. J. Automob. Eng. 2003, 218, 43–50. [Google Scholar] [CrossRef]
  2. Mierlo, J.V.; Vereecken, L.; Maggetto, G.; Favrel, V.; Meyer, S.; Hecq, W. How to define clean vehicles? Environmental impact rating of vehicles. Int. J. Automot. Technol. 2003, 4, 77–86. [Google Scholar]
  3. Burke, A.; Miller, M. Performance characteristics of lithium-ion batteries of various chemistries for plug-in hybrid vehicles. In Proceedings of the EVS24 International Battery, Hybrid and Fuel Cell Electric Vehicle Symposium, Stavanger, Norway, 13–16 May 2009.
  4. Omar, N.; Daowd, M.; Verbrugge, B.; Mulder, G.; van den Bossche, J.; van Mierlo, J.; Dhaens, M.; Pauwels, S.; Leemans, F. Assessment of performance characteristics of lithium-ion batteries for PHEV vehicles applications based on a newly test methodology. In Proceedings of the EVS 25, Shenzhen, China, 5–9 November 2010.
  5. Silva, C.; Ross, M.; Farias, T. Evaluation of energy consumption, emissions and cost of plug-in hybrid vehicles. Energy Convers. Manag. 2009, 50, 1635–1643. [Google Scholar] [CrossRef]
  6. Omar, N. Assessment of Rechargeable Energy Storage Systems for Plug-in Hybrid Electric Vehicles. Ph.D. Thesis, Vrije Universiteit Brussel, Brussel, Belgium, September 2012. [Google Scholar]
  7. Nishi, Y. Lithium ion secondary batteries; past 10 years and future. J. Power Sources 2001, 100, 101–106. [Google Scholar] [CrossRef]
  8. Omar, N.; Daowd, M.; Hegazy, O.; Bossche, P.V.D.; Coosemans, T.; Mierlo, J.V. Electrical double-layer capacitors in hybrid topologies—Assessment and evaluation of their performance. Energies 2012, 5, 4533–4568. [Google Scholar] [CrossRef]
  9. Omar, N.; Daowd, M.; Mulder, G.; Timmermans, J.M.; van den Bossche, P.; van Mierlo, P.; Pauwels, S. Assessment of performance of lithium iron phosphate oxide, nickel manganese cobalt oxide and nickel cobalt aluminum oxide based cells for using in plug-in battery electric vehicle applications. In Proceedings of the IEEE Vehicle Power and Propulsion Conference, Chicago, IL, USA, 6–9 September 2011.
  10. Omar, N.; Mierlo, J.V.; Mulders, F.V.; Bossche, P.V.D. Assessment of behaviour of super capacitor-battery system in heavy hybrid lift truck vehicles. J. Asian Electr. Veh. 2009, 7, 1277–1282. [Google Scholar] [CrossRef]
  11. He, W.; Williard, N.; Osterman, M.; Pecht, M. Prognostics of Lithium-ion Batteries using Extended Kalman Filtering. In Proceedings of the IMAPS Advanced Technology Workshop on High Reliability Microelectronics for Military Applications, Linthicum Heights, MD, USA, 17–19 May 2011.
  12. Bhangu, B.S.; Bentley, P.; Stone, D.A.; Bingham, C.M. Nonlinear observers for predicting state-of-charge and state-of-health of lead-acid batteries for hybrid-electric vehicles. IEEE Trans. Veh. Technol. 2011, 54, 783–794. [Google Scholar] [CrossRef]
  13. Kozlowski, J.D. Electrochemical cell prognostics using online impedance measurements and model-based data fusion techniques. In Proceedings of the IEEE Aerospace Conference, Big Sky, MT, USA, 8–15 March 2003.
  14. Zhang, J.; Lee, J. A review on prognostics and health monitoring of Li-ion battery. J. Power Sources 2011, 196, 6007–6014. [Google Scholar] [CrossRef]
  15. Saha, B.; Goebel, K.; Poll, S.; Christophersen, J. An integrated approach to battery health monitoring using bayesian regression and state estimation. In Proceedings of the IEEE Autotestcon, Baltimore, MD, USA, 17–20 September 2007.
  16. Piller, S.; Perrin, M.; Jossen, A. Methods for state-of-charge determination and their applications. J. Power Sources 2001, 96, 113–120. [Google Scholar] [CrossRef]
  17. Lee, J.; Nam, O.; Cho, B.H. Li-ion battery SOC estimation method based on the reduced order extended Kalman filtering. J. Power Sources 2007, 174, 9–15. [Google Scholar] [CrossRef]
  18. Wan, S.; Zhao, L.; Su, X.; Ma, P. Prognostics of lithium-Ion batteries based on battery performance analysis and flexible support vector regression. Energies 2014, 7, 6492–6508. [Google Scholar]
  19. Widodo, A.; Shim, M.C.; Caesarendra, W.; Yang, B.S. Intelligent prognostics for battery health monitoring based on sample entropy. Expert Syst. Appl. 2011, 38, 11763–11769. [Google Scholar] [CrossRef]
  20. Saha, B.; Goebel, K.; Christophersen, J. Comparison of prognostic algorithms for estimating remaining useful life of batteries. Trans. Inst. Meas. Control 2009, 31, 293–308. [Google Scholar] [CrossRef]
  21. Williard, N.; He, W.; Pecht, M. Model based Battery Management System for Condition based Maintenance. In Proceedings of the MFPT 2012 Proceedings: The Prognostics and Health Management Solutions Conference, Dayton, OH, USA, 24–26 April 2012.
  22. Chen, C.; Pecht, M. Prognostics of lithium-ion batteries using model-based and data-driven methods. In Proceedings of the 2012 Prognostics & System Health Management Conference, Beijing, China, 23–25 May 2012.
  23. He, W.; Williard, N.; Chen, C.; Pecht, M. State of charge estimation for electric vehicle batteries using unscented kalman filtering. Microelectron. Reliab. 2013, 53, 840–847. [Google Scholar] [CrossRef]
  24. Miao, Q.; Xie, L.; Cui, H.J.; Liang, W.; Pecht, M. Remaining useful life prediction of lithium-ion battery with unscented particle filter technique. Microelectron. Reliab. 2013, 53, 805–810. [Google Scholar] [CrossRef]
  25. Bole, B.; Daigle, M.; Gorospe, G. Online prediction of battery discharge and estimation of parasitic loads for an electric aircraft. In Proceedings of the Second European Conference of the Prognostics and Health Management Society, Nantes, France, 8–10 July 2014.
  26. Daigle, M.; Kulkarni, C. A battery health monitoring framework for planetary rovers. In Proceedings of the IEEE Aerospace Conference, Big Sky, MT, USA, 1–8 March 2014.
  27. Bole, B.; Kulkarni, C.S.; Daigle, M. Adaptation of an electrochemistry-based li-ion battery model to account for deterioration observed under randomized use. In Proceedings of Annual Conference of the Prognostics and Health Management Society, Fort Worth, TX, USA, 29 September–2 October 2014.
  28. Arulampalam, M.S.; Maskell, S.; Gordon, N.; Clapp, T. A tutorial on particle filters for online nonlinear/non-Gaussian Bayesian tracking. IEEE Trans. Signal Process. 2002, 50, 174–188. [Google Scholar] [CrossRef]
  29. Dalal, M.; Ma, J.; He, D. Lithium-ion battery life prognostic health management system using particle filtering framework. J. Risk Reliab. 2011, 225, 81–90. [Google Scholar]
  30. Orchard, M.E.; Hevia-Koch, P.; Zhang, B.; Tang, L. Risk measures for particle-filtering-based state-of-charge prognosis in lithium-ion batteries. IEEE Trans. Ind. Electron. 2013, 60, 5260–5269. [Google Scholar] [CrossRef]
  31. Zhang, B.; Tang, L.; DeCastro, J.; Roemer, M.; Goebel, K. Autonomous vehicle battery state-of-charge prognostics enhanced mission planning. Int. J. Progn. Health Manag. 2014, 5, 1–12. [Google Scholar]
  32. Pattipati, B.; Pattipati, K.; Christopherson, J.P.; Namburu, S.M.; Prokhorov, D.V.; Liu, Q. Automotive battery management systems. In Proceedings of the 2008 IEEE Autotestcon, Salt Lake City, UT, USA, 8–11 September 2008.
  33. Qian, K.; Zhou, C.; Yuan, Y.; Allan, M. Temperature effect on electric vehicle battery cycle life in vehicle-to-grid applications. In Proceedings of the 2010 China International Conference on Electricity Distribution, Nanjing, China, 13–16 September 2010.
  34. Salkind, J.; Fennie, C.; Singh, P.; Atwater, T.; Reisner, D.E. Determination of state-of-charge and state-of-health of batteries by fuzzy logic methodology. J. Power Sources 1999, 80, 293–300. [Google Scholar] [CrossRef]
  35. Liu, D.; Wang, H.G.; Peng, Y.; Xie, W.; Liao, H. Satellite lithium-ion battery remaining cycle life prediction with novel indirect health indicator extraction. Energies 2013, 6, 3654–3668. [Google Scholar] [CrossRef]
  36. Micea, M.V.; Ungurean, L.; Carstoiu, G.N.; Groza, V. Online state-of-health assessment for battery management systems. IEEE Trans. Instrum. Meas. 2011, 60, 1997–2006. [Google Scholar] [CrossRef]
  37. He, W.; Williard, N.; Osterman, M.; Pecht, M. Prognostics of lithium-ion batteries based on Dempster–Shafer theory and the Bayesian Monte Carlo method. J. Power Sources 2011, 196, 10314–10321. [Google Scholar]
  38. Xing, Y.; Ma, E.W.M.; Tsui, K.L.; Pecht, M. A case study on battery life prediction using particle filtering. In Proceedings of Prognostics & System Health Management Conference, Beijing, China, 23–25 May 2012.
  39. Amine, K.; Chen, C.H.; Liu, J.; Hammond, M.; Jansen, A.; Dees, D.; Bloom, I.; Vissers, D.; Henriksen, G. Factors responsible for impedance rise in high power lithium ion batteries. J. Power Sources 2001, 97–98, 684–687. [Google Scholar]
  40. Vetter, J.; Novák, P.; Wagner, M.R.; Veit, C.; Möller, K.-C.; Besenhard, J.O.; Winter, M.; Wohlfahrt-Mehrens, M.; Vogler, C.; Hammouche, A. Ageing mechanisms in lithium-ion batteries. J. Power Sources 2005, 147, 269–281. [Google Scholar] [CrossRef]
  41. Schmidt, A.P.; Bitzer, M.; Imre, Á.W.; Guzzella, L. Model-based distinction and quantification of capacity loss and rate capability fade in Li-ion batteries. J. Power Sources 2010, 195, 7634–7638. [Google Scholar] [CrossRef]
  42. Liu, D.; Pang, J.; Zhou, J.; Peng, Y.; Pecht, M. Prognostics for state of health estimation of lithium-ion batteries based on combination Gaussian process functional regression. Microelectron. Reliab. 2013, 53, 832–839. [Google Scholar] [CrossRef]
  43. Dubarry, M.; Liaw, B.Y. Identify capacity fading mechanism in a commercial LiFePO4 cell. J. Power Sources 2009, 194, 541–549. [Google Scholar] [CrossRef]
  44. Bazi, Y. Semisupervised PSO-SVM regression for biophysical parameter estimation. IEEE Trans. Geosci. Remote Sens. 2007, 45, 1887–1895. [Google Scholar] [CrossRef]
  45. Marinaki, M.; Marinakis, Y.; Stavroulakis, G.E. Vibration control of beams with piezoelectric sensors and actuators using particle swarm optimization. Expert Syst. Appl. 2011, 38, 6872–6883. [Google Scholar] [CrossRef]
  46. Kao, C.-C.; Fung, R.-F. Using the modified PSO method to identify a Scott-Russell mechanism actuated by a piezoelectric element. Mech. Syst. Signal Process. 2009, 23, 1652–1661. [Google Scholar] [CrossRef]
  47. Xing, Y.; Ma, E.W.M.; Tsui, K.L.; Pecht, M. Battery management systems in electric and hybrid vehicles. Energies 2011, 4, 1840–1857. [Google Scholar] [CrossRef]

