
Comprehensive Characterization of Napier Grass as a Feedstock for Thermochemical Conversion

 ,
,
Abstract
:1. Introduction
2. Experiment
3. Results and Discussion

| Property | Biomass | ||
|---|---|---|---|
| NGS | NGL | NGT | |
| Proximate analysis (wt. %) | |||
| Moisture content a | 75.27 ± 0.21 | 62.25 ± 0.14 | 74.22 ± 0.17 |
| Volatile matter b | 81.51 ± 0.30 | 79.06 ± 0.26 | 85.17 ± 0.21 |
| Ash content b | 1.75 ± 0.01 | 4.00 ± 0.03 | 6.34 ± 0.01 |
| Fixed carbon c | 16.74 ± 0.09 | 16.94 ± 0.04 | 8.49 ± 0.02 |
| HHV (MJ/kg) | 18.11 ± 0.10 | 16.21 ± 0.10 | 16.58 ± 0.10 |
| Ultimate analysis (wt. %) b | |||
| Carbon (C) | 48.61 ± 0.80 | 44.17 ± 0.73 | 45.10 ± 0.70 |
| Hydrogen (H) | 6.01 ± 0.14 | 5.51 ± 0.14 | 5.93 ± 0.15 |
| Nitrogen (N) | 0.99 ± 0.03 | 1.01 ± 0.03 | 1.45 ± 0.04 |
| Sulfur (S) | 0.32 ± 0.01 | 0.27 ± 0.01 | 0.35 ± 0.01 |
| Oxygen (O)c | 44.07 ± 0.66 | 49.04 ± 0.74 | 47.17 ± 0.71 |
| O/C (atomic ratio) | 0.91 | 1.11 | 1.05 |
| H/C (atomic ratio) | 0.124 | 0.125 | 0.131 |
| Structural composition (wt. %) | |||
| Cellulose | 38.75 ± 2.30 | 29.36 ± 2.01 | 34.21 ± 2.17 |
| Hemicellulose | 19.76 ± 1.68 | 15.96 ± 1.55 | 20.44 ± 1.70 |
| Lignin | 26.99 ± 1.29 | 30.09 ± 1.30 | 24.34 ± 1.34 |
| Extractives | 12.07 ± 0.32 | 5.57 ± 0.30 | 9.26 ± 0.27 |
| EDX Analysis of ash (wt. %) | |||
| Sodium (Na) | 0.27 ± 0.006 | 0.21 ± 0.004 | 0.25 ± 0.005 |
| Magnesium (Mg) | 2.34 ± 0.075 | 2.17 ± 0.070 | 1.89 ± 0.049 |
| Aluminum (Al) | 0.93 ± 0.032 | 1.67 ± 0.057 | 1.66 ± 0.057 |
| Silicon (Si) | 7.44 ± 0.248 | 24.98 ± 0.833 | 7.78 ± 0.265 |
| Phosphorus (P) | 2.31 ± 0.064 | 3.55 ± 0.107 | 2.25 ± 0.068 |
| Sulfur (S) | 1.47 ± 0.047 | 1.75 ± 0.060 | 3.37 ± 0.104 |
| Chlorine (Cl) | 16.13 ± 0.471 | 12.44 ± 0.400 | 18.95 ± 0.653 |
| Potassium (K) | 64.77 ± 2.228 | 49.88 ± 1.716 | 59.85 ± 2.061 |
| Calcium (Ca) | 4.34 ± 0.129 | 3.34 ± 0.100 | 4.01 ± 0.129 |

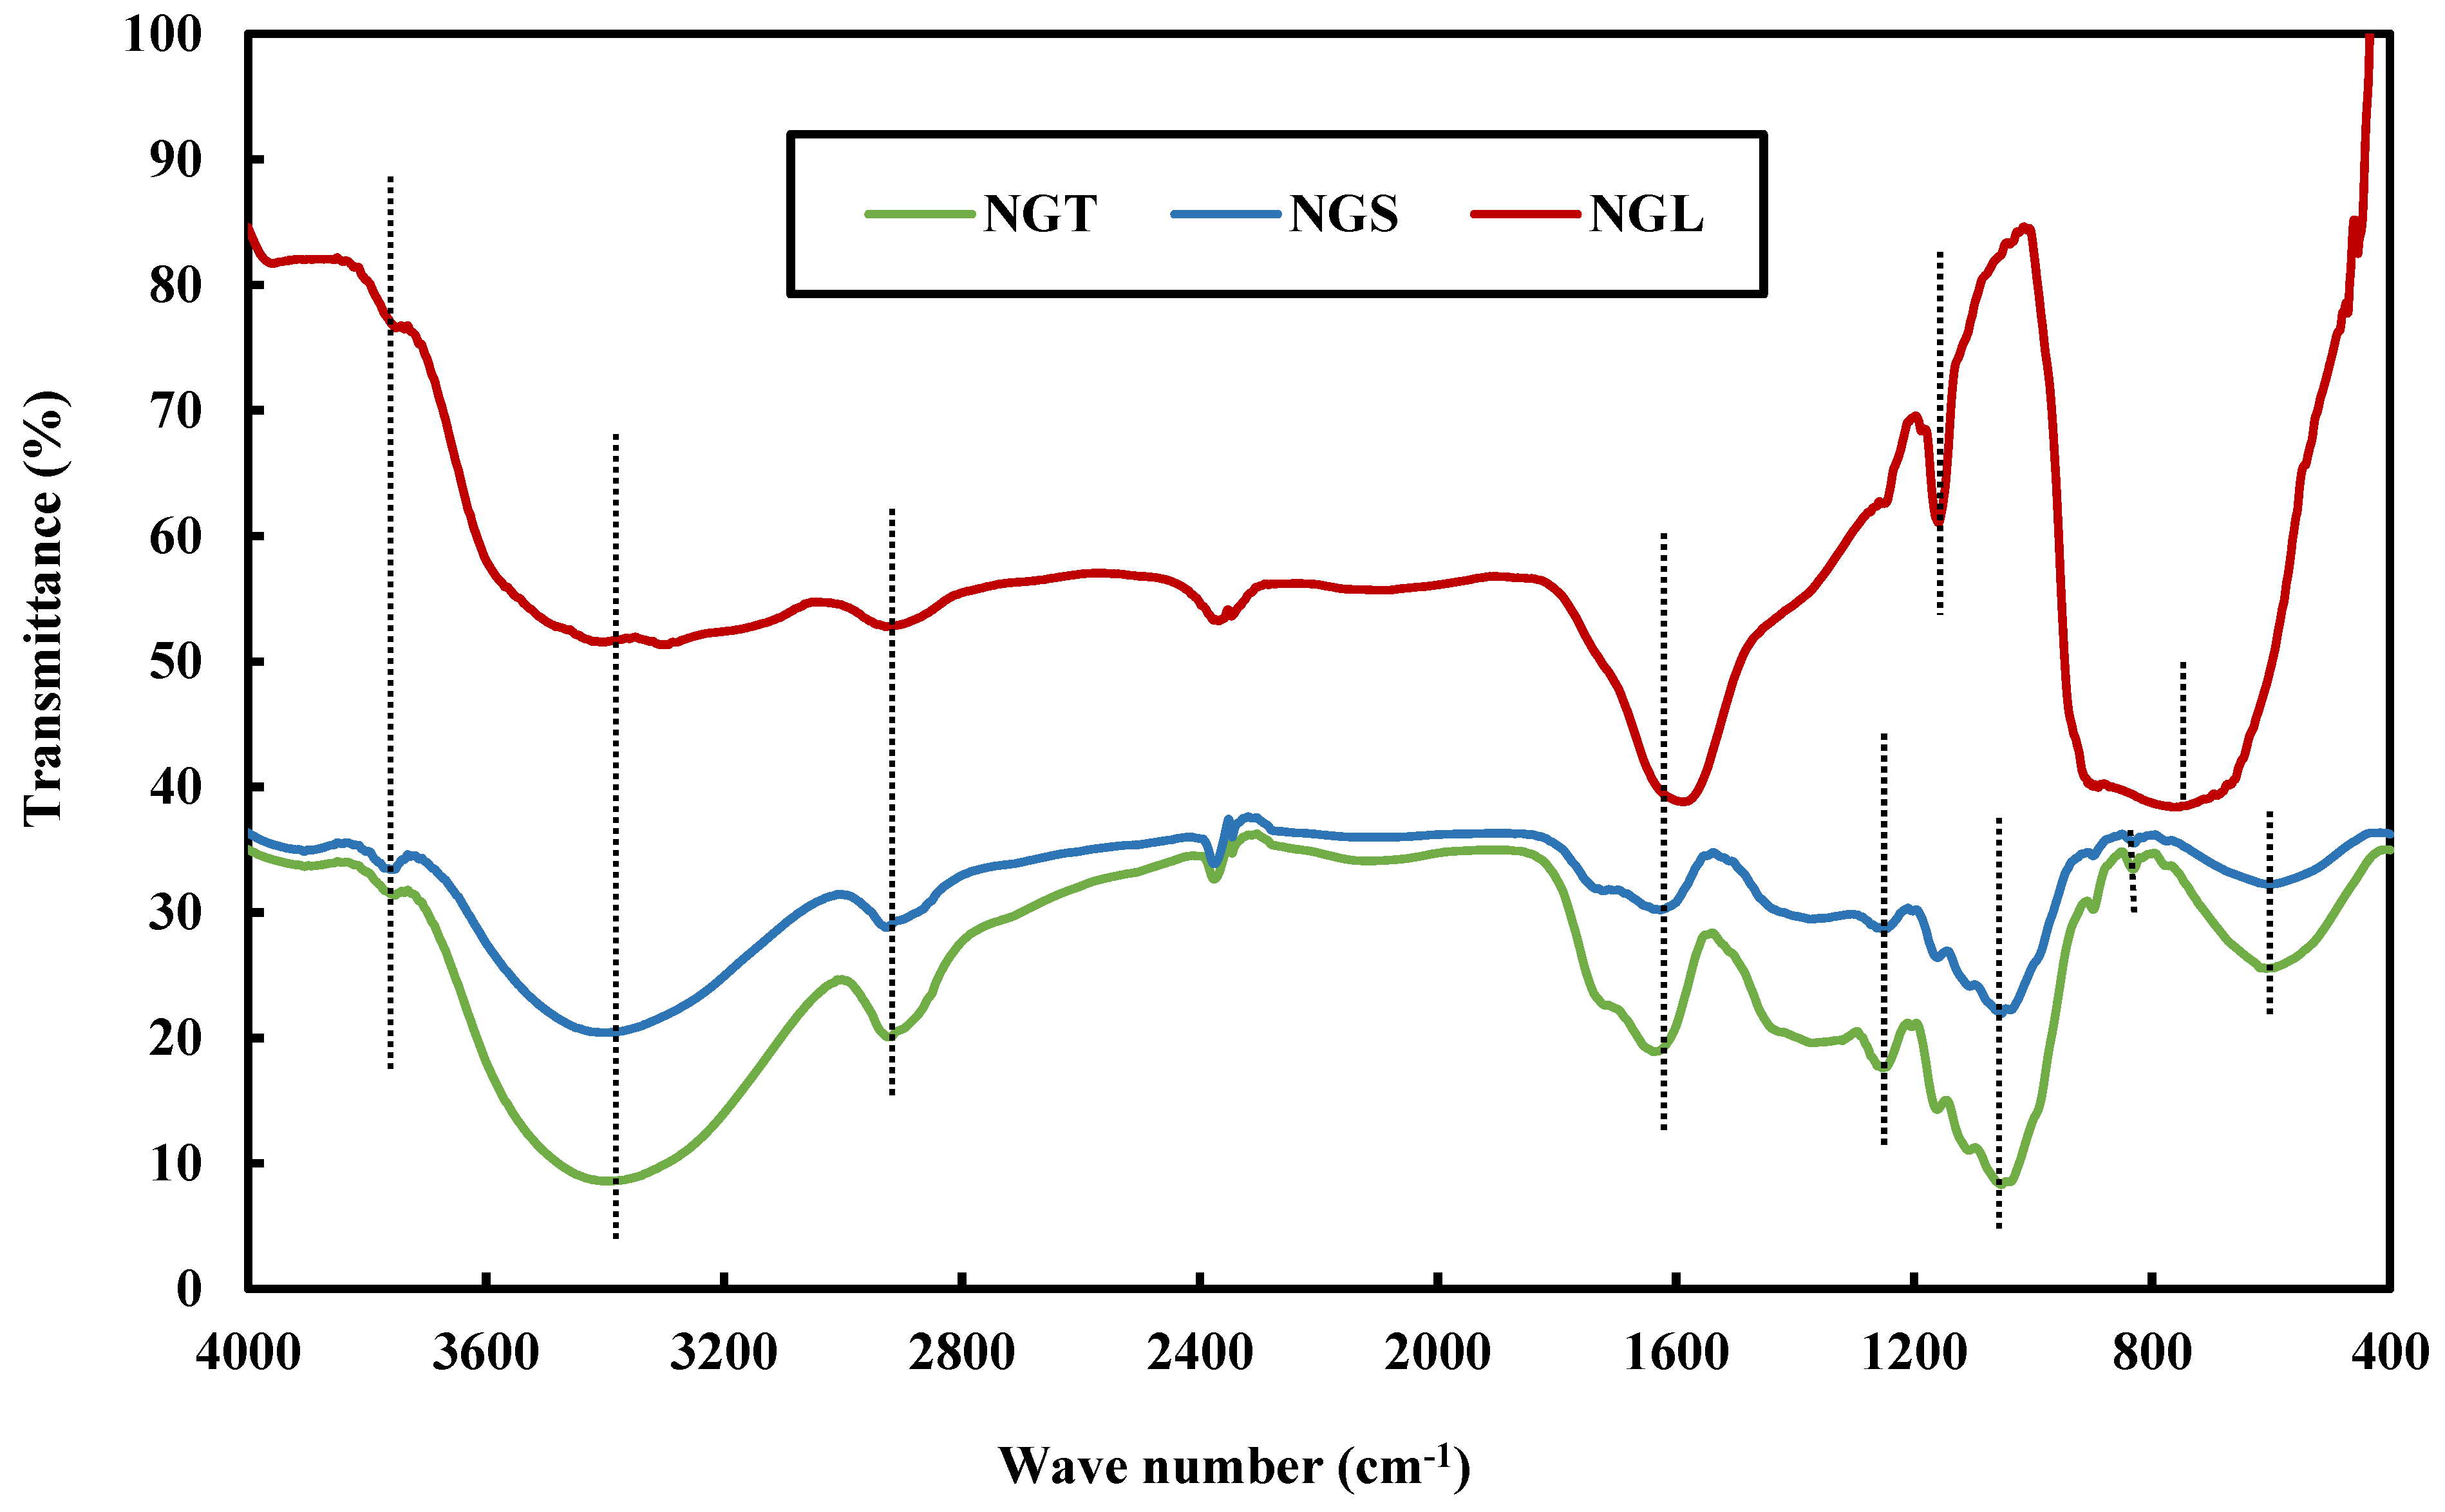
| Wavenumber (cm−1) | Functional Group | Reference |
|---|---|---|
| 3700, 3421 | O-H Stretching vibration | [25,26,27,28] |
| 2937 | Alkyl C-H stretching | [29,30,31,32] |
| 1600 | Aromatic C=C Bending | [26,35,36] |
| 1200 | O-H bending in cellulose and hemicellulose | [5,25,28,34,36] |
| 1050 | C-O, C=C and C-C-O stretching | [5,24,28,34,36] |
| 860–680 | Aromatic C-H bending | [5,35,36] |

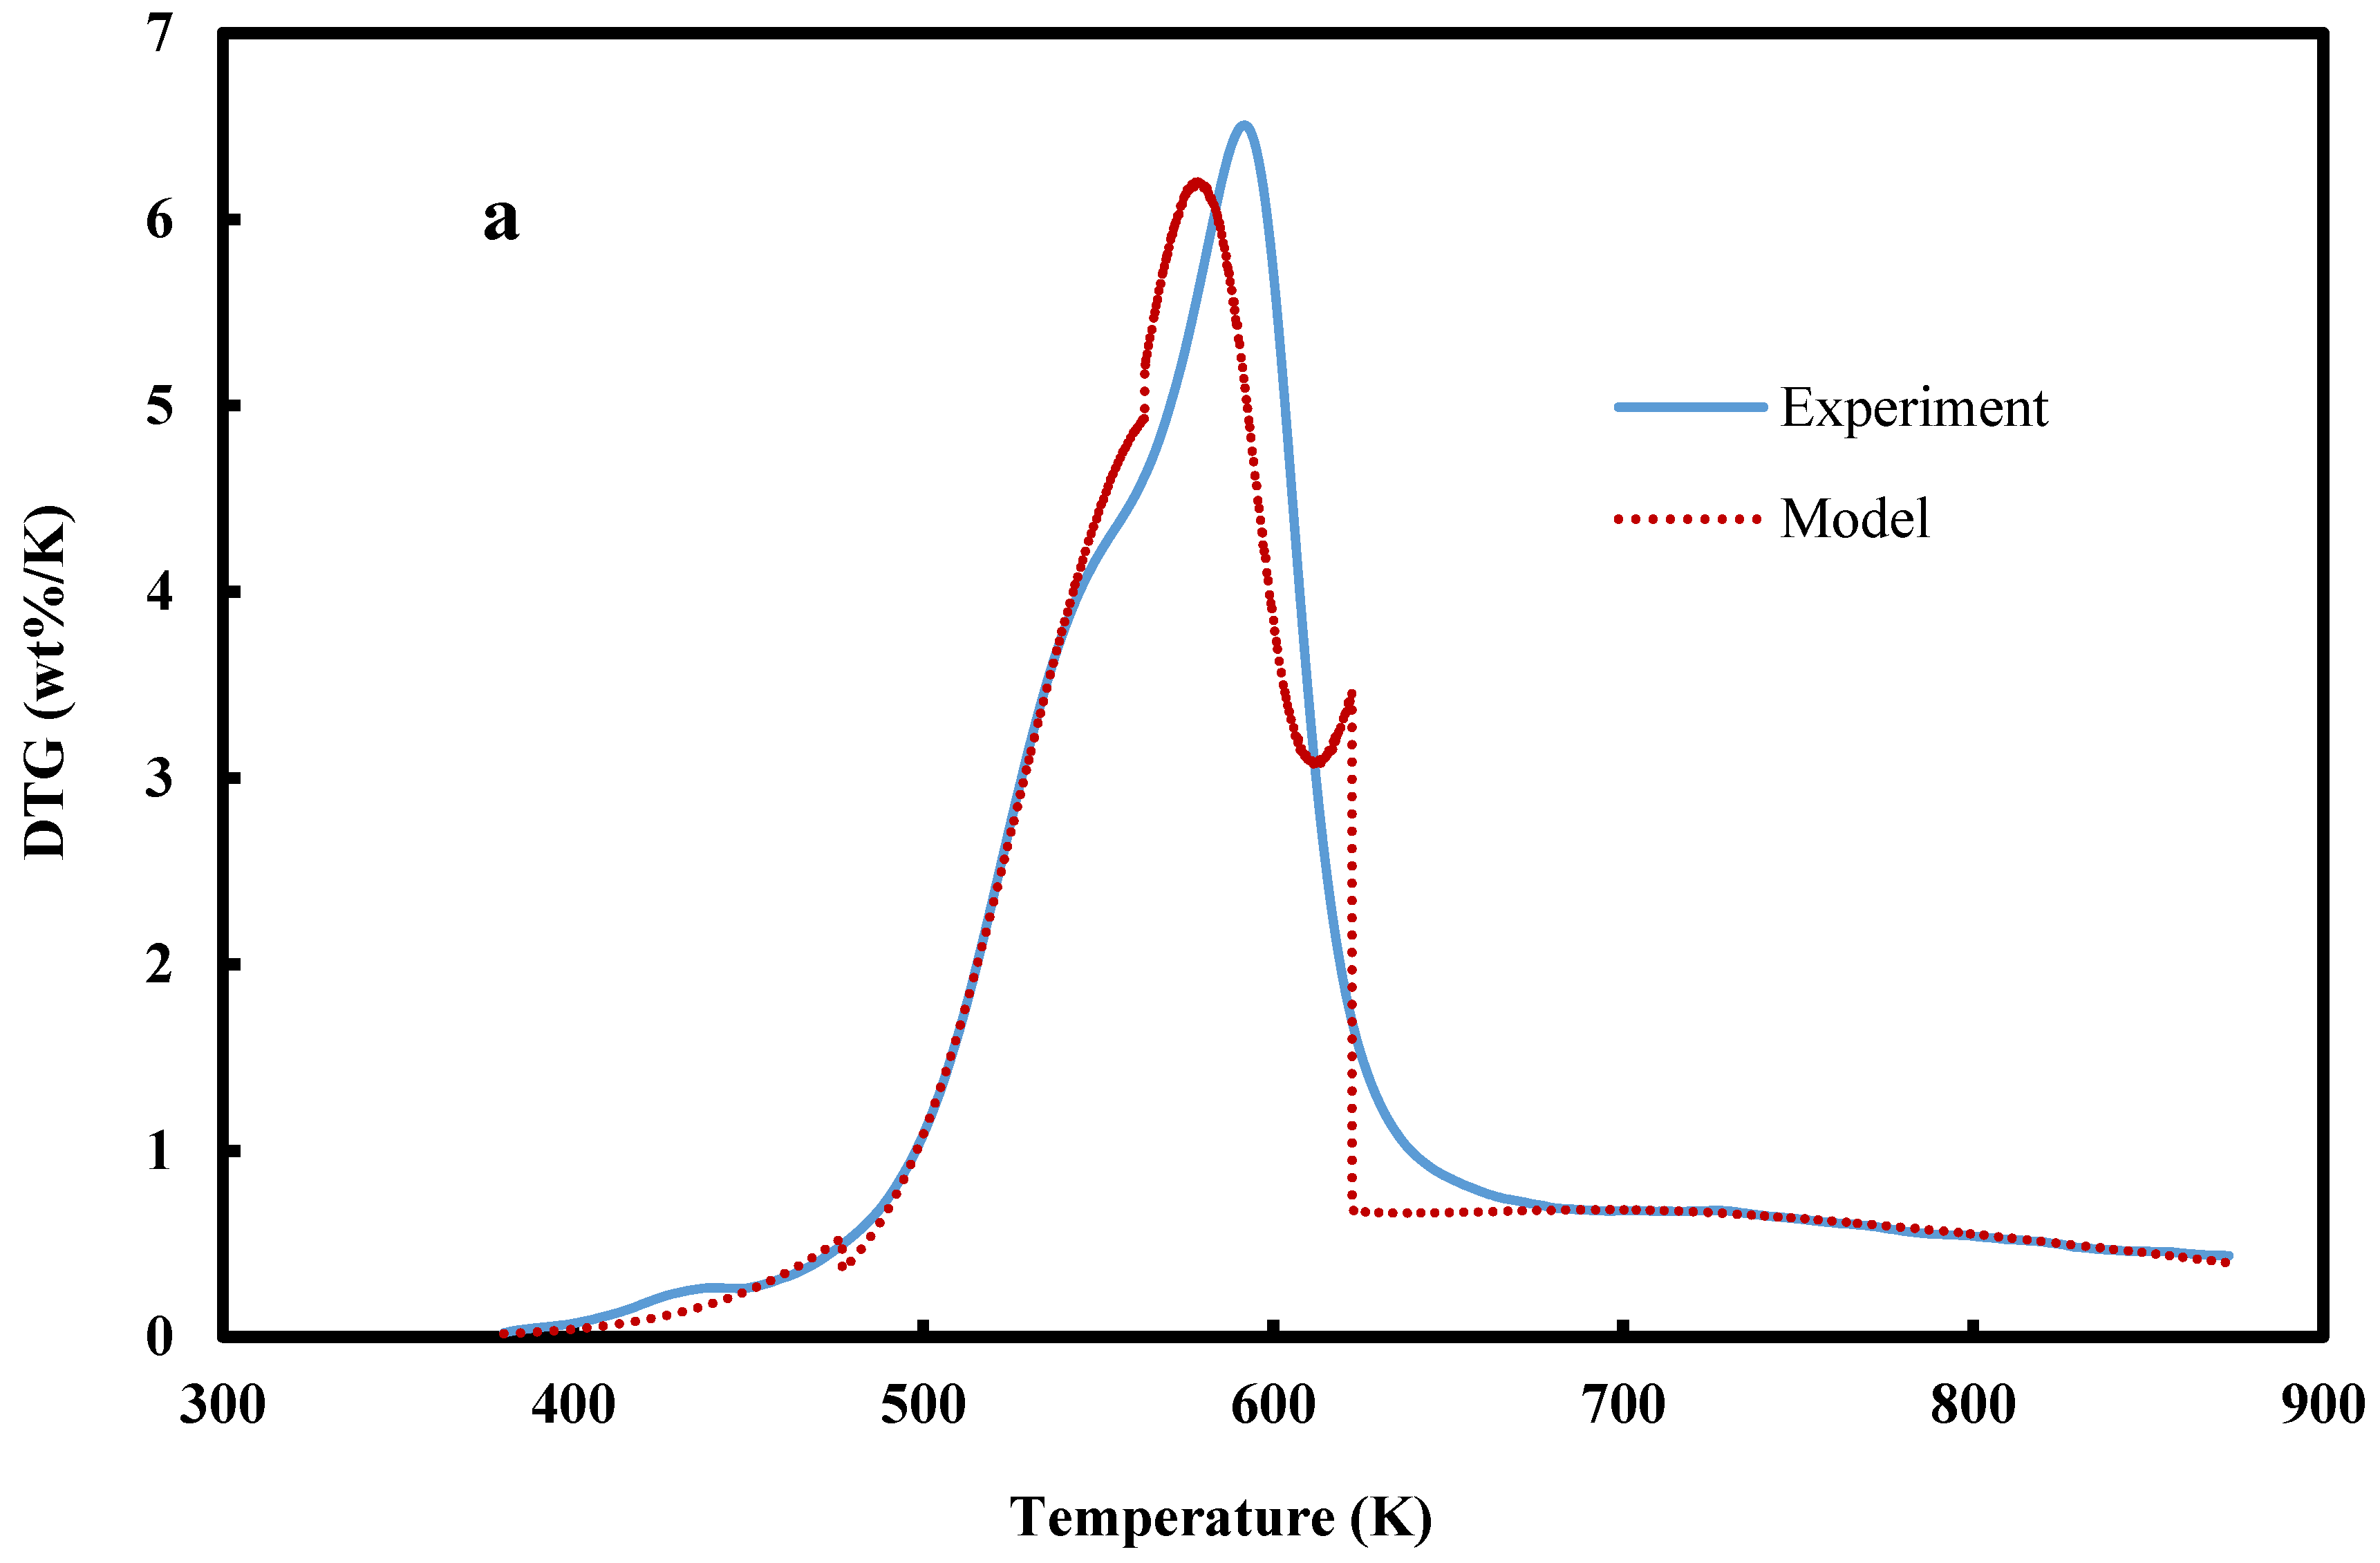
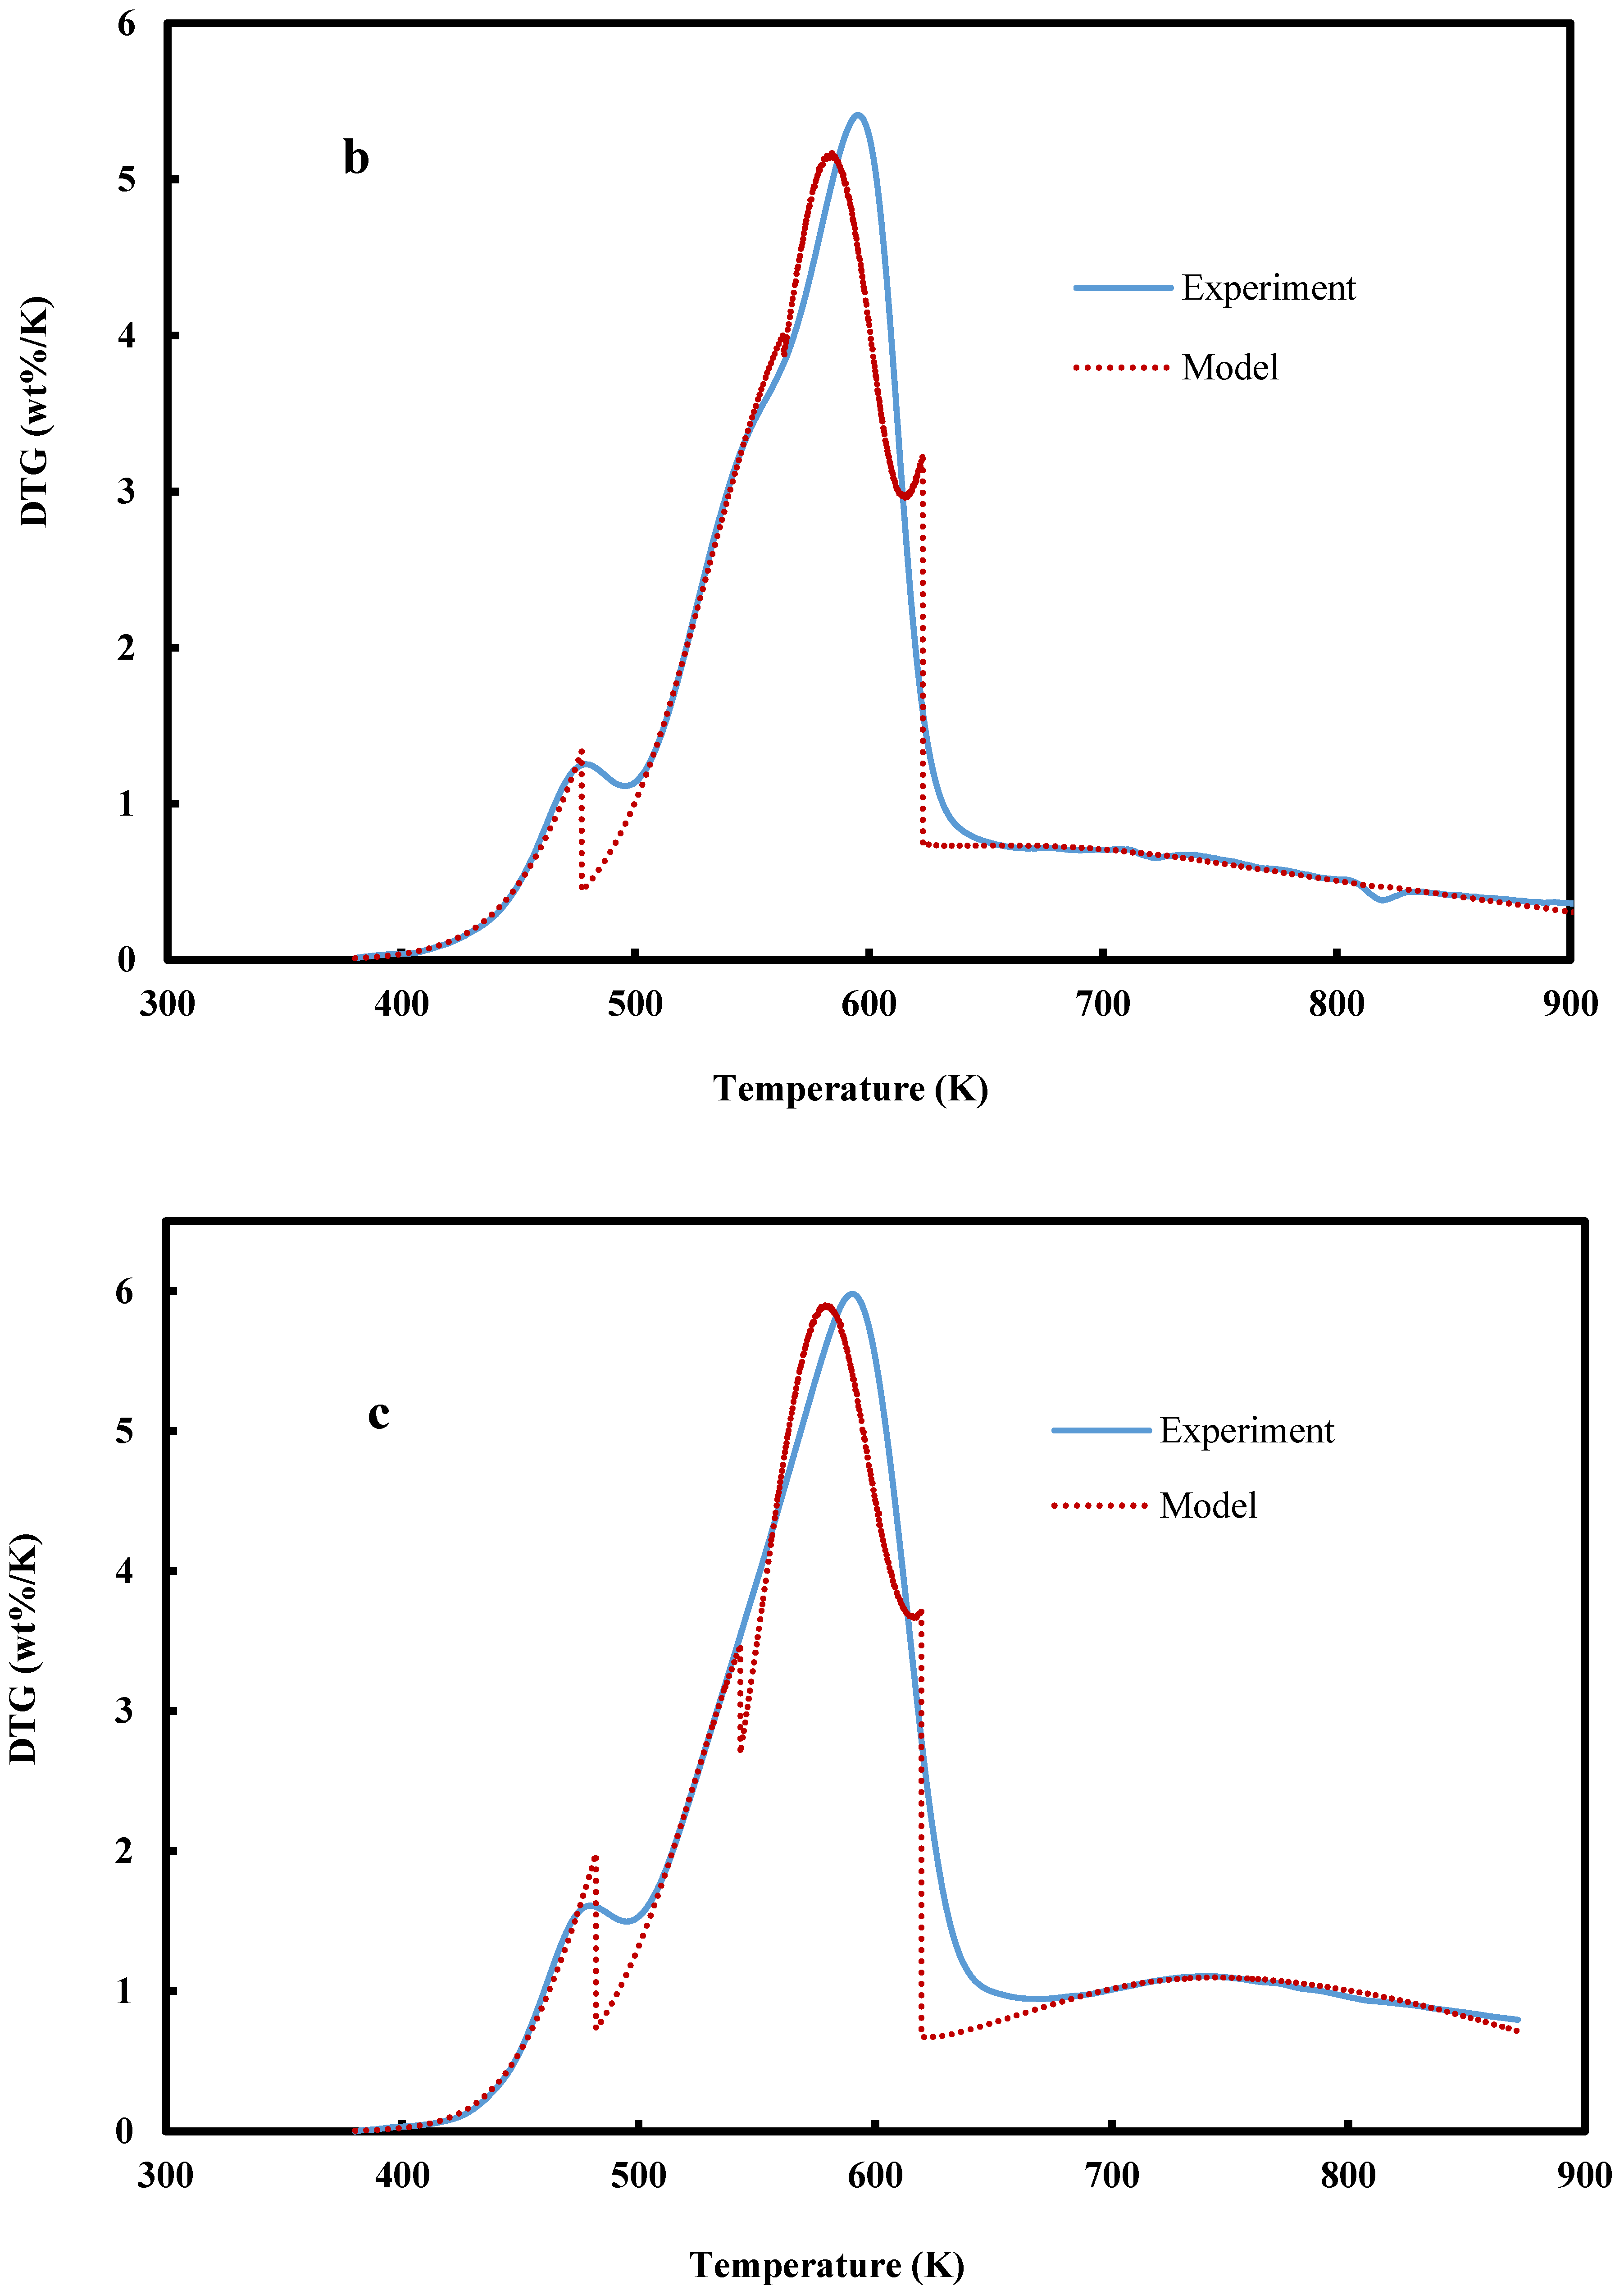
| Biomass | Slope | Intercept | Order (n) | R-Square Value | A (min−1) | EA (kJ/mol.) |
|---|---|---|---|---|---|---|
| NGT | ||||||
| Extractives | −11,578.0 | 23.217 | 11.00 | 0.9880 | 1.21 × 10¹⁰ | 96.26 |
| Hemicellulose | −9,748.3 | 17.982 | 4.50 | 0.9991 | 6.45 × 10⁷ | 81.05 |
| Cellulose | −21,484.0 | 39.912 | 7.00 | 0.9786 | 2.16 × 10¹⁷ | 178.62 |
| Lignin | −5,570.1 | 8.3817 | 2.30 | 0.9961 | 4.37 × 10³ | 46.31 |
| NGS | ||||||
| Extractives | −9,470.8 | 18.854 | 5.00 | 0.9813 | 1.54 × 10⁸ | 78.74 |
| Hemicellulose | −9,933.8 | 18.416 | 3.00 | 0.9990 | 9.95 × 10⁷ | 82.59 |
| Cellulose | −20,597.0 | 38.25 | 5.00 | 0.9573 | 4.09 × 10¹⁶ | 171.25 |
| Lignin | −2,811.1 | 4.3639 | 1.80 | 0.9697 | 7.86 × 101 | 23.37 |
| NGL | ||||||
| Extractives | −6,700.4 | 12.25 | 5.00 | 0.9864 | 2.09 × 10⁵ | 55.71 |
| Hemicellulose | −12,335.0 | 23.345 | 4.00 | 0.9993 | 1.38 × 10¹⁰ | 102.56 |
| Cellulose | −20,307.0 | 38.054 | 5.00 | 0.9317 | 3.36 × 10¹⁶ | 168.84 |
| Lignin | −3,234.2 | 4.9492 | 1.80 | 0.9927 | 1.41 × 10² | 26.89 |


4. Conclusions
Acknowledgments
Conflicts of Interest
References
- Margeot, A.; Hahn-Hagerdal, B.; Edlund, M. New improvements for lignocellulosic ethanol. Curr. Opin. Biotechnol. 2009, 20, 372–380. [Google Scholar] [CrossRef] [PubMed]
- Nigam, P.S.; Singh, A. Production of liquid biofuels from renewable resources. Prog. Energy Combust. Sci. 2011, 37, 52–68. [Google Scholar] [CrossRef]
- Srirangan, K.; Akawi, L.; Moo-Young, M. Towards sustainable production of clean energy carriers from biomass resources. Appl. Energy 2012, 100, 172–186. [Google Scholar] [CrossRef]
- Samson, R.; Mani, S.; Boddey, R. The potential of C4 perennial grasses for developing a global bioheat industry. Crit. Rev. Plant Sci. 2005, 24, 461–495. [Google Scholar] [CrossRef]
- Reddy, K.O.; Maheswari, C.U.; Shukla, M.; Rajulu, A.V. Chemical composition and structural characterization of Napier grass fibers. Mater. Lett. 2012, 67, 35–38. [Google Scholar] [CrossRef]
- Reddy, K.O.; Maheswari, C.U.; Reddy, D.J.P.; Rajulu, A.V. Thermal properties of Napier grass fibers. Mater. Lett. 2009, 63, 2390–2392. [Google Scholar] [CrossRef]
- Strezov, V.; Evans, T.J.; Hayman, C. Thermal conversion of elephant grass (Pennisetum Purpureum Schum) to bio-gas, bio-oil and charcoal. Bioresour. Technol. 2008, 99, 8394–8399. [Google Scholar] [CrossRef] [PubMed]
- Lee, M.-K.; Tsai, W.-T.; Tsaic, Y.-L.; Lin, S.-H. Pyrolysis of Napier grass in an induction-heating reactor. J. Anal. Appl. Pyrolysis 2010, 88, 110–116. [Google Scholar] [CrossRef]
- Solid Biofuels. Determination of Moisture Content. Oven Dry Method. Total Moisture. Reference Method; BS EN 14774-1; British Standards Institution: London, UK, 2009.
- Solid Biofuels. Determination of the Content of Volatile Matter; BS EN 15148; British Standards Institution: London, UK, 2009.
- Solid Biofuels. Determination of Ash Content; BS EN 14775; British Standards Institution: London, UK, 2009.
- Solid Biofuels. Determination of Calorific Value; BS EN 14918; British Standards Institution: London, UK, 2009.
- Sluiter, A.; Hames, B.; Ruiz, R.; Scarlata, C.; Sluiter, J.; Templeton, D.; Crocker, D. Determination of structural carbohydrates and lignin in biomass. In Laboratory Analytical Procedure; NREL/TP-510-42618; National Renewable Laboratory: Golden, CO, USA, 2012. [Google Scholar]
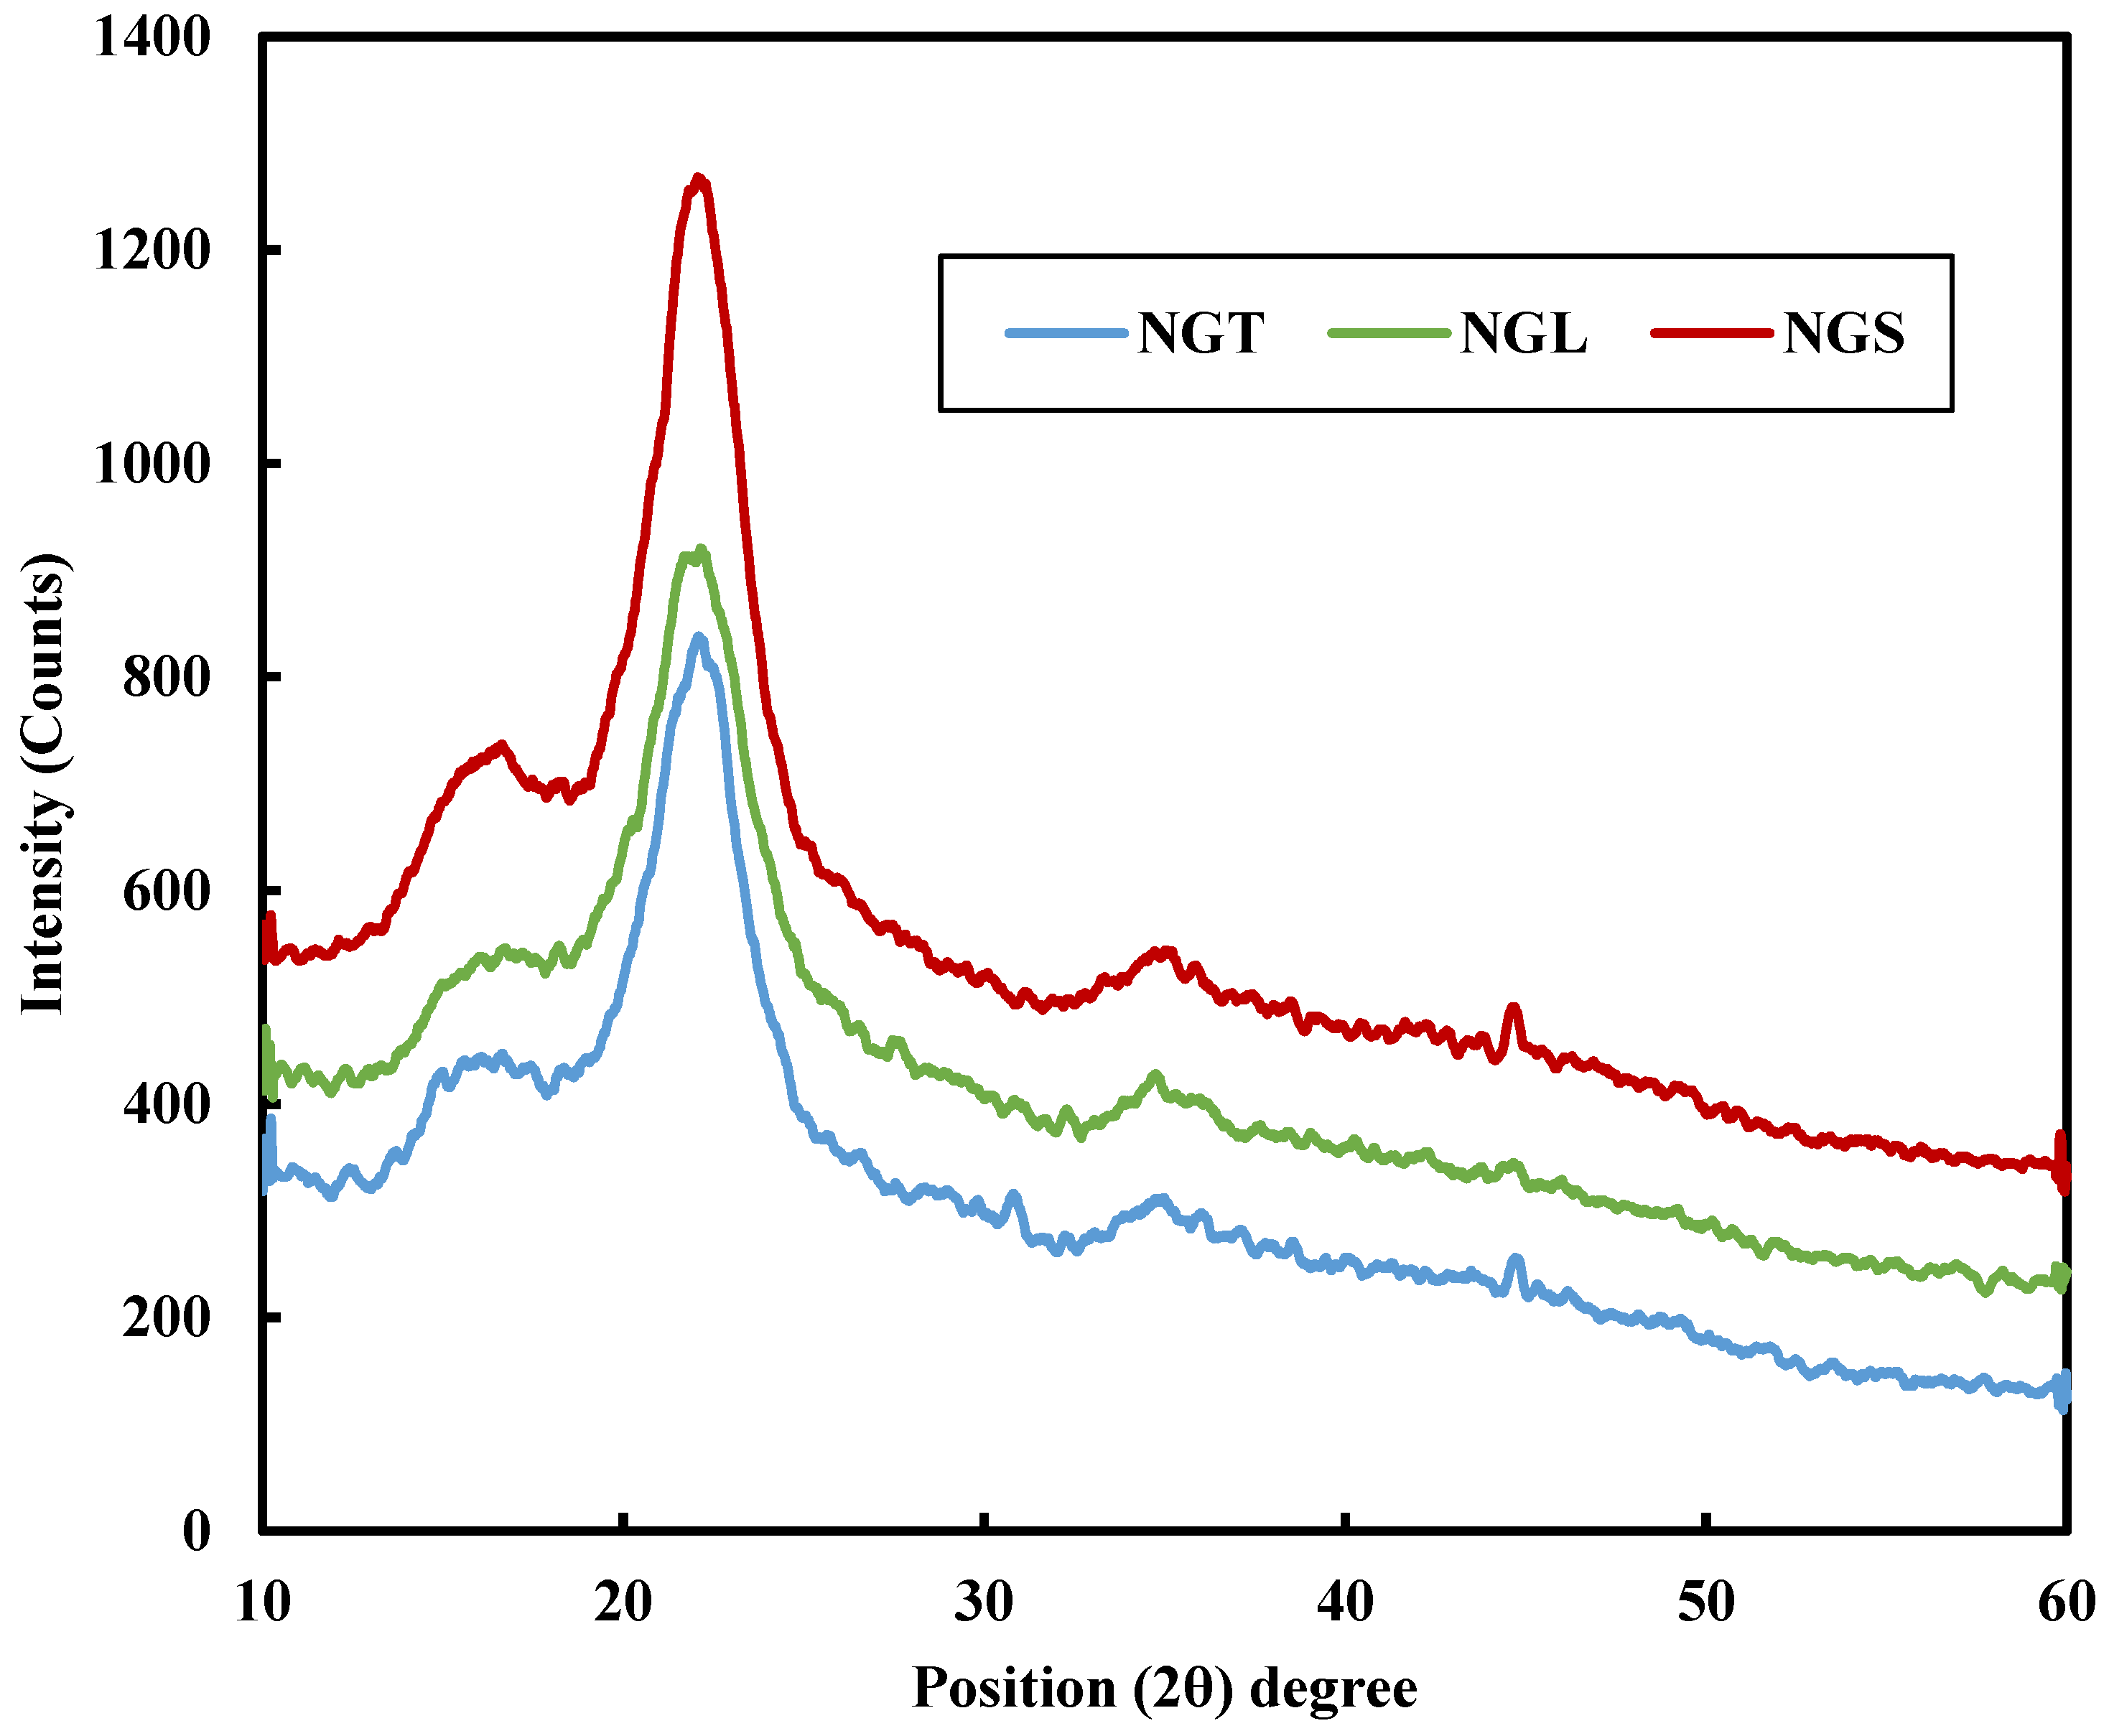
- Segal, L.; Creely, L.; Martin, A.E.; Conrad, C.M. An empirical method for estimating the degree of crystallinity of native cellulose using X-ray diffractometer. Text. Res. J. 1959, 29, 786–794. [Google Scholar] [CrossRef]
- Vassilev, S.V.; Baxter, D.; Andersen, L.K.; Vassileva, C.G. An overview of the chemical composition of biomass. Fuel 2010, 89, 913–933. [Google Scholar] [CrossRef]
- Lindberg, D.; Backman, R.; Chartrand, P.; Hupa, M. Towards a comprehensive thermodynamic database for ash-forming elements in biomass and waste combustion—Current situation and future developments. Fuel Process. Technol. 2013, 105, 129–141. [Google Scholar] [CrossRef]
- Yeboah, N.N.N.; Shearer, C.R.; Burns, S.E.; Kurtis, K.E. Characterization of biomass and high carbon content coal ash for productive reuse applications. Fuel 2014, 116, 438–447. [Google Scholar] [CrossRef]
- Bioenergy System Planners Handbook. Available online: http://bisyplan.bioenarea.eu/html-files-en/04-02.html (accessed on 23 April 2015).
- DoKyung, L.; Vence, N.O.; Arvid, B.; Peter, J. Composition of herbaceous biomass feedstocks. In Sun Grant Initiative 2007; North Dakota University: Brookings, SD, USA, 2007. [Google Scholar]
- Wada, M.; Okano, T.; Sugiyama, J. Allomorphs of native crystalline cellulose I evaluated by two equatorial d-spacings. J. Wood Sci. 2001, 47, 124–128. [Google Scholar] [CrossRef]
- Park, S.; Baker, J.O.; Himmel, M.E.; Parilla, P.A.; Johnson, D.K. Cellulose crystallinity index: Measurement techniques and their impact on interpreting cellulase performance. Biotechnol. Biofuels 2010, 3, 4–10. [Google Scholar] [CrossRef] [PubMed]
- Poletto, M.; Pistor, V.; Zattera, A.J. Structural characteristics and thermal properties of native cellulose. In Cellulose-Fundamental Aspects; van de Ven, T., Gdbout, L., Eds.; InTech.: Caxias do Sul, Brazil, 2013; pp. 45–68. [Google Scholar]
- Timpano, H.; Sibout, R.; Devaux, M.-F.; Alvarado, C.; Looten, R.; Pontoire, B.; Martin, M.; Legée, F.; Cézard, L.; Lapierre, C.; et al. Brachypodium cell wall mutant with enhanced saccharification potential despite increased lignin content. Bioenerg. Res. 2014. [Google Scholar] [CrossRef]
- Cheng, G.; Varanasi, P.; Li, C.; Liu, H.; Melnichenko, Y.B.; Simmons, B.A.; Kent, M.S.; Singh, S. Transition of cellulose crystalline structure and surface morphology of biomass as a function of ionic liquid pretreatment and its relation to enzymatic hydrolysis. Biomacromolecules 2011, 12, 933–941. [Google Scholar] [CrossRef]
- Yang, H.; Yan, R.; Chen, H.; Lee, D.H.; Zheng, C. Characteristics of hemicellulose, cellulose and lignin pyrolysis. Fuel 2007, 86, 1781–1788. [Google Scholar] [CrossRef]
- Xu, F.; Yu, J.; Tesso, T.; Dowell, F.; Wang, D. Qualitative and quantitative analysis of lignocellulosic biomass using infrared techniques: A mini-review. Appl. Energy 2013, 104, 801–809. [Google Scholar] [CrossRef]
- Nazir, M.S.; Wahjoedi, B.A.; Yussof, A.W.; Abdaulla, M.A. Eco-friendly extraction and characterization of cellulose from oil palm empty fruit bunches. BioResources 2013, 8, 2161–2172. [Google Scholar] [CrossRef]
- Lupoi, J.S.; Singh, S.; Simmons, B.A.; Henry, R.J. Assessment of lignocellulosic biomass using analytical spectroscopy: an evolution to high-throughput techniques. Bioenergy Res. 2014, 7, 1–23. [Google Scholar] [CrossRef]
- Yokoi, H.; Nakase, T.; Goto, K.; Ishida, Y.; Ohtani, H.; Tsuge, S.; Sonoda, T.; Ona, T. Rapid characterization of wood extractives in wood by thermal desorption-gas chromatography in the presence of tetramethylammonium acetate. J. Anal. Appl. Pyrolysis 2003, 67, 191–200. [Google Scholar] [CrossRef]
- Ishida, Y.; Goto, K.; Yokoi, H.; Tsuge, S.; Ohtani, H.; Sonoda, T.; Ona, T. Direct analysis of phenolic extractives in wood by thermochemolysis-gas chromatography in the presence of tetrabutylammonium hydroxide. J. Anal. Appl. Pyrolysis 2007, 78, 200–206. [Google Scholar] [CrossRef]
- Mészáros, E.; Jakab, E.; Várhegyi, G. TG/MS, Py-GC/MS and THM-GC/MS study of the composition and thermal behavior of extractive components of Robinia pseudoacacia. J. Anal. Appl. Pyrolysis 2007, 79, 61–70. [Google Scholar] [CrossRef]
- Plis, A.; Lasek, J.; Skawinska, A.; Kopczynski, M. Thermo-chemical properties of biomass from Posidonia Oceanica. Chem. Pap. 2014, 68, 879–889. [Google Scholar] [CrossRef]
- Naik, S.; Goud, V.V.; Rout, P.K.; Jacobson, K.; Dalai, A.K. Characterization of Canadian biomass for alternative renewable biofuel. Renew. Energy 2010, 35, 1624–1631. [Google Scholar] [CrossRef]
- Nanda, S.; Mohanty, P.; Pant, K.K.; Naik, S.; Kozinski, J.A.; Dalai, A.K. Characterization of north american lignocellulosic biomass and biochars in terms of their candidacy for alternate renewable fuels. Bioenergy Res. 2013, 6, 663–677. [Google Scholar] [CrossRef]
- Qian, K.; Kumar, A.; Patil, K.; Bellmer, D.; Wang, D.; Yuan, W.; Raymond, L.; Huhnke, R.L. Effects of biomass feedstocks and gasification conditions on the physiochemical properties of char. Energies 2013, 6, 3972–3986. [Google Scholar] [CrossRef]
- Sills, D.L.; Gossett, J.M. Using FTIR to predict saccharification from enzymatic hydrolysis of alkali-pretreated biomasses. Biotechnol. Bioeng. 2012, 109, 353–362. [Google Scholar] [CrossRef] [PubMed]
- Raveendra, K.; Ganesh, A.; Khilar, K.C. Pyrolysis characteristics of biomass and biomass components. Fuel 1996, 75, 987–998. [Google Scholar] [CrossRef]
- Hagedorn, M.M.; Bockhorn, H.; Krebs, L.; Muller, U. A comparative kinetics study on the pyrolysis of three different wood species. J. Anal. Appl. Pyrolysis 2003, 68–69, 231–249. [Google Scholar]
- Biwas, A.K.; Umeki, K.; Yang, W.; Blasiak, W. Change of pyrolysis characteristics and structure of wood biomass due to steam explosion pretreatment. Fuel Process. Technol. 2011, 92, 1849–1854. [Google Scholar] [CrossRef]
- Mohammed, I.Y.; Abakr, Y.A.; Kabir, F.; Yusuf, S. Effect of aqueous pretreatment on pyrolysis characteristics of napier grass. J. Eng. Sci. Technol. 2015, in press. [Google Scholar]
- Khawam, A.; Flanagan, D.R. Solid-state kinetic models: Basics and mathematical fundamentals. J. Phys. Chem. B 2006, 110, 17315–17328. [Google Scholar] [CrossRef] [PubMed]
- Pasquali, C.E.L.; Herrera, H. Pyrolysis of lignin and IR analysis of residues. Thermochim. Acta 1997, 293, 39–46. [Google Scholar] [CrossRef]
- Teng, H.; Wei, Y.-C. Thermogravimetric studies on the kinetics of rice hull pyrolysis and the influence of water treatment. Ind. Eng. Chem. Res. 1998, 37, 3806–3811. [Google Scholar] [CrossRef]
- Orfao, J.J.M.; Antunes, F.J.A.; Figueiredo, J.L. Pyrolysis kinetics of lignocellulosic materials—Three independent reactions model. Fuel 1999, 78, 349–358. [Google Scholar] [CrossRef]
- Brebu, M.; Vasile, C. Thermal degradation of lignin—A review. Cellul. Chem. Technol. 2010, 44, 353–363. [Google Scholar]
- Chen, W.-H.; Kuo, P.-C. Isothermal torrefaction kinetics of hemicellulose, cellulose, lignin and xylan using thermogravimetric analysis. Energy 2011, 36, 6451–6460. [Google Scholar] [CrossRef]
- Braga, R.M.; Costa, T.R.; Freitas, J.C.O.; Barros, J.M.F.; Melo, D.M.A.; Melo, M.A.F. Pyrolysis kinetics of elephant grass pretreated biomasses. J. Therm. Anal. Calorim. 2014, 117, 1341–1348. [Google Scholar] [CrossRef]
© 2015 by the authors; licensee MDPI, Basel, Switzerland. This article is an open access article distributed under the terms and conditions of the Creative Commons Attribution license (http://creativecommons.org/licenses/by/4.0/).
Share and Cite
Mohammed, I.Y.; Abakr, Y.A.; Kazi, F.K.; Yusup, S.; Alshareef, I.; Chin, S.A. Comprehensive Characterization of Napier Grass as a Feedstock for Thermochemical Conversion. Energies 2015, 8, 3403-3417. https://doi.org/10.3390/en8053403
Mohammed IY, Abakr YA, Kazi FK, Yusup S, Alshareef I, Chin SA. Comprehensive Characterization of Napier Grass as a Feedstock for Thermochemical Conversion. Energies. 2015; 8(5):3403-3417. https://doi.org/10.3390/en8053403
Chicago/Turabian StyleMohammed, Isah Y., Yousif A. Abakr, Feroz K. Kazi, Suzana Yusup, Ibraheem Alshareef, and Soh A. Chin. 2015. "Comprehensive Characterization of Napier Grass as a Feedstock for Thermochemical Conversion" Energies 8, no. 5: 3403-3417. https://doi.org/10.3390/en8053403