Article

Influence of Coal Blending on Ash Fusibility in Reducing Atmosphere

1
State Key Laboratory of Clean Energy Utilization, Zhejiang University, Hangzhou 310027, China
2
Laboratory for Thermal Hydraulic and Safety, China Nuclear Power Technology Research Institute, Shenzhen 528026, China
*
Author to whom correspondence should be addressed.
Energies 2015, 8(6), 4735-4754; https://doi.org/10.3390/en8064735
Submission received: 16 April 2015 / Revised: 11 May 2015 / Accepted: 14 May 2015 / Published: 26 May 2015
(This article belongs to the Special Issue Recent Advances in Coal Combustion and Gasification)

Abstract

:
Coal blending is an effective way to organize and control coal ash fusibility to meet different requirements of Coal-fired power plants. This study investigates three different eutectic processes and explains the mechanism of how coal blending affects ash fusibility. The blended ashes were prepared by hand-mixing two raw coal ashes at five blending ratios, G:D = 10:90 (G10D90), G:D= 20:80 (G20D80), G:D = 30:70 (G30D70), G:D = 40:60 (G40D60), and G:D = 50:50 (G50D50). The samples were heated at 900 °C, 1000 °C, 1100 °C, 1200 °C, and 1300 °C in reducing atmosphere. XRD and SEM/EDX were used to identify mineral transformations and eutectic processes. The eutectic processes were finally simulated with FactSage. Results show that the fusion temperatures of the blended ashes initially decrease and then increase with the blending ratio, a trend that is typical of eutectic melting. Eutectic phenomena are observed in D100, G10D90, and G30D70 in different degrees, which do not appear in G100 and G50D50 for the lack of eutectic reactants. The main eutectic reactants are gehlenite, magnetite, merwinite, and diopside. The FactSage simulation results show that the content discrepancy of merwinite and diopside in the ashes causes the inconsistent eutectic temperatures and eutectic degrees, in turn decrease the fusion temperature of the blended ash and then increase them with the blending ratio.

Graphical Abstract

1. Introduction

Coal-fired power plants have different requirements for ash fusibility. Solid-state slag-tap boilers generally require pulverized coal with a high ash fusion temperature to prevent slagging, whereas the liquid-state slag-tap boilers require a low ash fusion temperature [1]. Coal-fired power plants use the method of additive blending or coal blending to meet ash fusibility and other requirements, such as reducing slagging and ash deposition. However, additive blending is costly for plants, because additives consume coal heat and do not release heat. Coal blending has attracted significant attention because it does not increase ash content and oxygen demand, which are its obvious advantages compared with additive blending [2,3,4]. Therefore, it is worth further researching in understanding the ash melting mechanism of blended coal.
A number of studies have focused on coal ash fusibility [5,6,7,8]. Lolja found that oxide composition plays a more important role in fusibility than the mineral composition does, whereas Xu argued that analyzing ash fusibility only from the elements is irrational [5,9]. According to their diverse effects on ash fusibility, the minerals in coal ash are classified as refractory minerals such as quartz, metakaolin, mullite and rutile, or fluxing minerals gypsum, potash feldspar, fayalite, and almandine [10,11]. The behavior of minerals in coal ash plays a crucial role in fusibility [12,13,14,15]. Synthetic coal ash has been used to demonstrate the effect of silica-alumina ratio on ash fusibility. The ash fusion temperature increases with the silica-alumina ratio from 1.6 to 4.0 [16]. Dialing the appropriate additive can change the mineral composition in coal ash [17,18,19]. Ferrum-based flux has been added into coal ash, and the flow temperature falls to below 1350 °C. Ash deposition and slagging problems associated with coal burning can effectively solve with coal washing and additive blending [17]. Blends of biomass and coal also appear and become noticeable [20,21].
Research on the fusibility mechanism of coal blending has increased significantly because of the superiority of coal blending. The ASTM test, the TG and DTG methods, X-ray diffraction (XRD), FTIR, the ternary phase diagram system, and quantum chemistry calculation have been used to analyze the mineral melting behavior and mineral reaction mechanism of blended coal ash [15,22,23,24,25]. The ash fusion temperature can be higher or lower than that of individual raw coals, not change linearly with the blending ratios [23]. It is a valid approach to predict ash fusibility during the combustion of blended coal with thermodynamic modeling [2,26]. Moreover, the ash fusion temperature (AFT) of coal ash is observed lower than the predicted liquidus temperature [2]. The complicated interaction mechanism of minerals in blended coal ash at the molecular level has been investigated with the ab initio density functional calculation method [22]. FactSage is a computing system with a large integrated database, including large amounts of thermodynamic database on silicate and oxide. Combined with thermodynamic data, the equilibrium state of mixture can be calculated on the basis of Gibbs free energy under certain conditions, which are used in studying the thermal conversion process of minerals in coal ash [27,28,29,30]; some parameters, such as the liquidus temperature and the slag content of coal ash cannot be measured by experiment alone [30,31,32].
Generally, the way mineral matters behave in blended coal ash at high temperatures has yet to be fully understood. The mechanism of how coal blending affects ash fusibility requires further research. Moreover, the additive blending or coal blending can lower ash fusion temperature because a low-temperature eutectic mixture is generated [11,22,23,33]. On the contrary, the ash fusion temperature is expected to increase if a low-temperature eutectic mixture is not generated. However, limited studies explain the detailed mechanism of how the low-temperature eutectic mixture affects ash fusibility.
In this study, Zhungeer coal (high silicon aluminum) and Zhundong coal (high calcium) were chosen as the raw materials. The slag content produced during heating in coal ash was represented by the shrinkage of ash discs, which is also used to estimate the ash fusibility compared with AFT. The blended ash fusibility shows the observable characteristic of eutectic melting. The mineral transformations in coal ash with different blending ratio were analyzed with XRD and SEM/EDX. Moreover, eutectic processes were also simulated with FactSage and the eutectic temperatures were obtained. The simulation results were used to explain why the ash fusion temperatures initially decrease and then increase with the blending ratio.

2. Experimental Section

2.1. Coal and Ash Samples

Zhungeer coal (denoted as G coal) and Zhundong coal (denoted as D coal) served as the raw materials in this study. Both coal samples were primarily pulverized into fine particles with diameters less than 100 µm, and then combusted in a muffle furnace at 800 °C for 2 h. For temperatures lower than 800 °C, no chemical reactions other than decomposition occurred among the minerals of the coal ashes [34]. Therefore, the blended ashes were prepared by hand-mixing of the G coal ash with the D coal ash obtained at 800 °C at five blending ratios: G:D = 10:90 (G10D90), G:D= 20:80 (G20D80), G:D = 30:70 (G30D70), G:D = 40:60 (G40D60), and G:D = 50:50 (G50D50). For comparison, the G and D coal samples were also tested. The corresponding cases are denoted as G100 (100% G coal sample) and D100 (100% D coal sample). Table 1 shows that G coal belonging to high silicon aluminum coal, has high contents of SiO2 and Al2O3, both accounting for 90.34% in the total ash mass. D coal belonging to high calcium coal has high content of CaO at 39.06%. Moreover, the contents of Na2O and MgO in D100 are much higher than those in G100, reaching 4.08% and 9.58%, respectively.

2.2. AFT Tests

The AFTs of the samples in reducing atmosphere were calculated with an intelligence ash melting point apparatus according to GB1274–2007 standard. The ash samples were ground to 100 μm and put in a pyrometric cone, which were pushed into an ash fusion temperature auto-analyzer chamber close to a thermocouple. The heating rate was controlled at 15 to 20 °C/min under 900 °C and 5 °C/min above 900 °C in reducing atmosphere.
Table 1. Coal analysis (air-dried basis) and ash composition.
SamplesGD
Proximate Analysis (wt %, ad)
Moisture6.9313.43
Ash24.025.11
Volatile matter26.6227.01
Fixed carbon42.4354.39
Ultimate Analysis (wt %, ad)
C54.5864.47
H3.313.11
O9.4312.64
N1.130.69
S0.60.49
Ash Composition (wt %, normalized)
Na2O0.164.08
MgO1.249.58
Al2O337.829.46
SiO252.5216.78
SO30.5120.38
K2O0.110.65
CaO2.8139.06
Fe2O33.343.68

2.3. Heat Treatment Experiments

A high-temperature tube furnace was used in this study and its highest heating temperature was 1700 °C. To simulate the weak reducing atmosphere, a mixture of CO2 and CO was utilized at the blending ratio of 3:2 on a volume basis in the test. For each sample, about 0.5 g ash and the corresponding ash disc were prepared. Individual coal ashes and blended ashes were then heated at 900 °C, 1000 °C, 1100 °C, 1200 °C and 1300 °C. The heating rate was controlled at 10 °C/min under 900 °C and 5 °C/min above 900 °C. After they were heated at constant temperatures for 30 min, all samples were quenched with liquid nitrogen to avoid crystallinity changes. Under this process, the ash temperature can drop to below 300 °C in 2 s. The shrinkages of the discs were calculated with Equation (1) when the ash temperatures reached room temperature, which can represent the slag content in coal ash at high temperatures.
shrinkage = ( V ( T 0 ) V ( T i ) ) V ( T 0 ) × 100 %
where V(T0) is the disc volume before the heat treatment (mm3); Ti is the heat temperature °C; and V(Ti) is the disc volume after the heat treatment of Ti (mm3).

2.4. XRD and SEM/EDX Analysis

The mineral composition and type at each temperature interval were determined by B/Max IIIBX-ray diffractometer (Rigaku, Tokyo, Japan) with the use of Cu target, Ni ray filter, 30 mA tube current and 30 kV tube voltage. The Rietveld method was applied for semi-quantitative analysis to determine the mineral mass fraction in ash. The heat-treated samples were also analyzed with scanning electron microscopy (FEI Quanta FEG650, FEI, Hillsboro, OR, USA) with X-ray microanalysis (SEM/EDX, FEI, Hillsboro, OR, USA). Mineral structure and the changes were measured by SEM (FEI, Hillsboro, OR, USA), and weight and atomic percentages of the elements for each analyzed mineral particle were obtained from EDX analysis (FEI, Hillsboro, OR, USA).

2.5. Thermodynamic Calculation with FactSage

2.5.1. Ternary Phase Diagram and Liquidus Temperature Calculation

Si, Al and Ca were selected as the main elements to prepare a ternary phase diagram and calculate the liquids temperature diagram with FactSage (GTT, Aachen, Germany). The positions of G100, D100, G10D90, G30D70, and G50D50 were expressed in the ternary phase diagram. The primary crystal region and ash fusion temperature were analyzed. And the calculated results were utilized to compare with AFTs obtained by experiment.

2.5.2. Slag Content and Eutectic Analysis

According to XRD analysis results, the mineral relative contents were determined with semi-quantitative analysis based on the Rietveld method, which were used to simulate the eutectic process by FactSage and calculate the slag contents. The simulations were based on five elements, Si, Al, Ca, Fe and Mg.

3. Results and Discussion

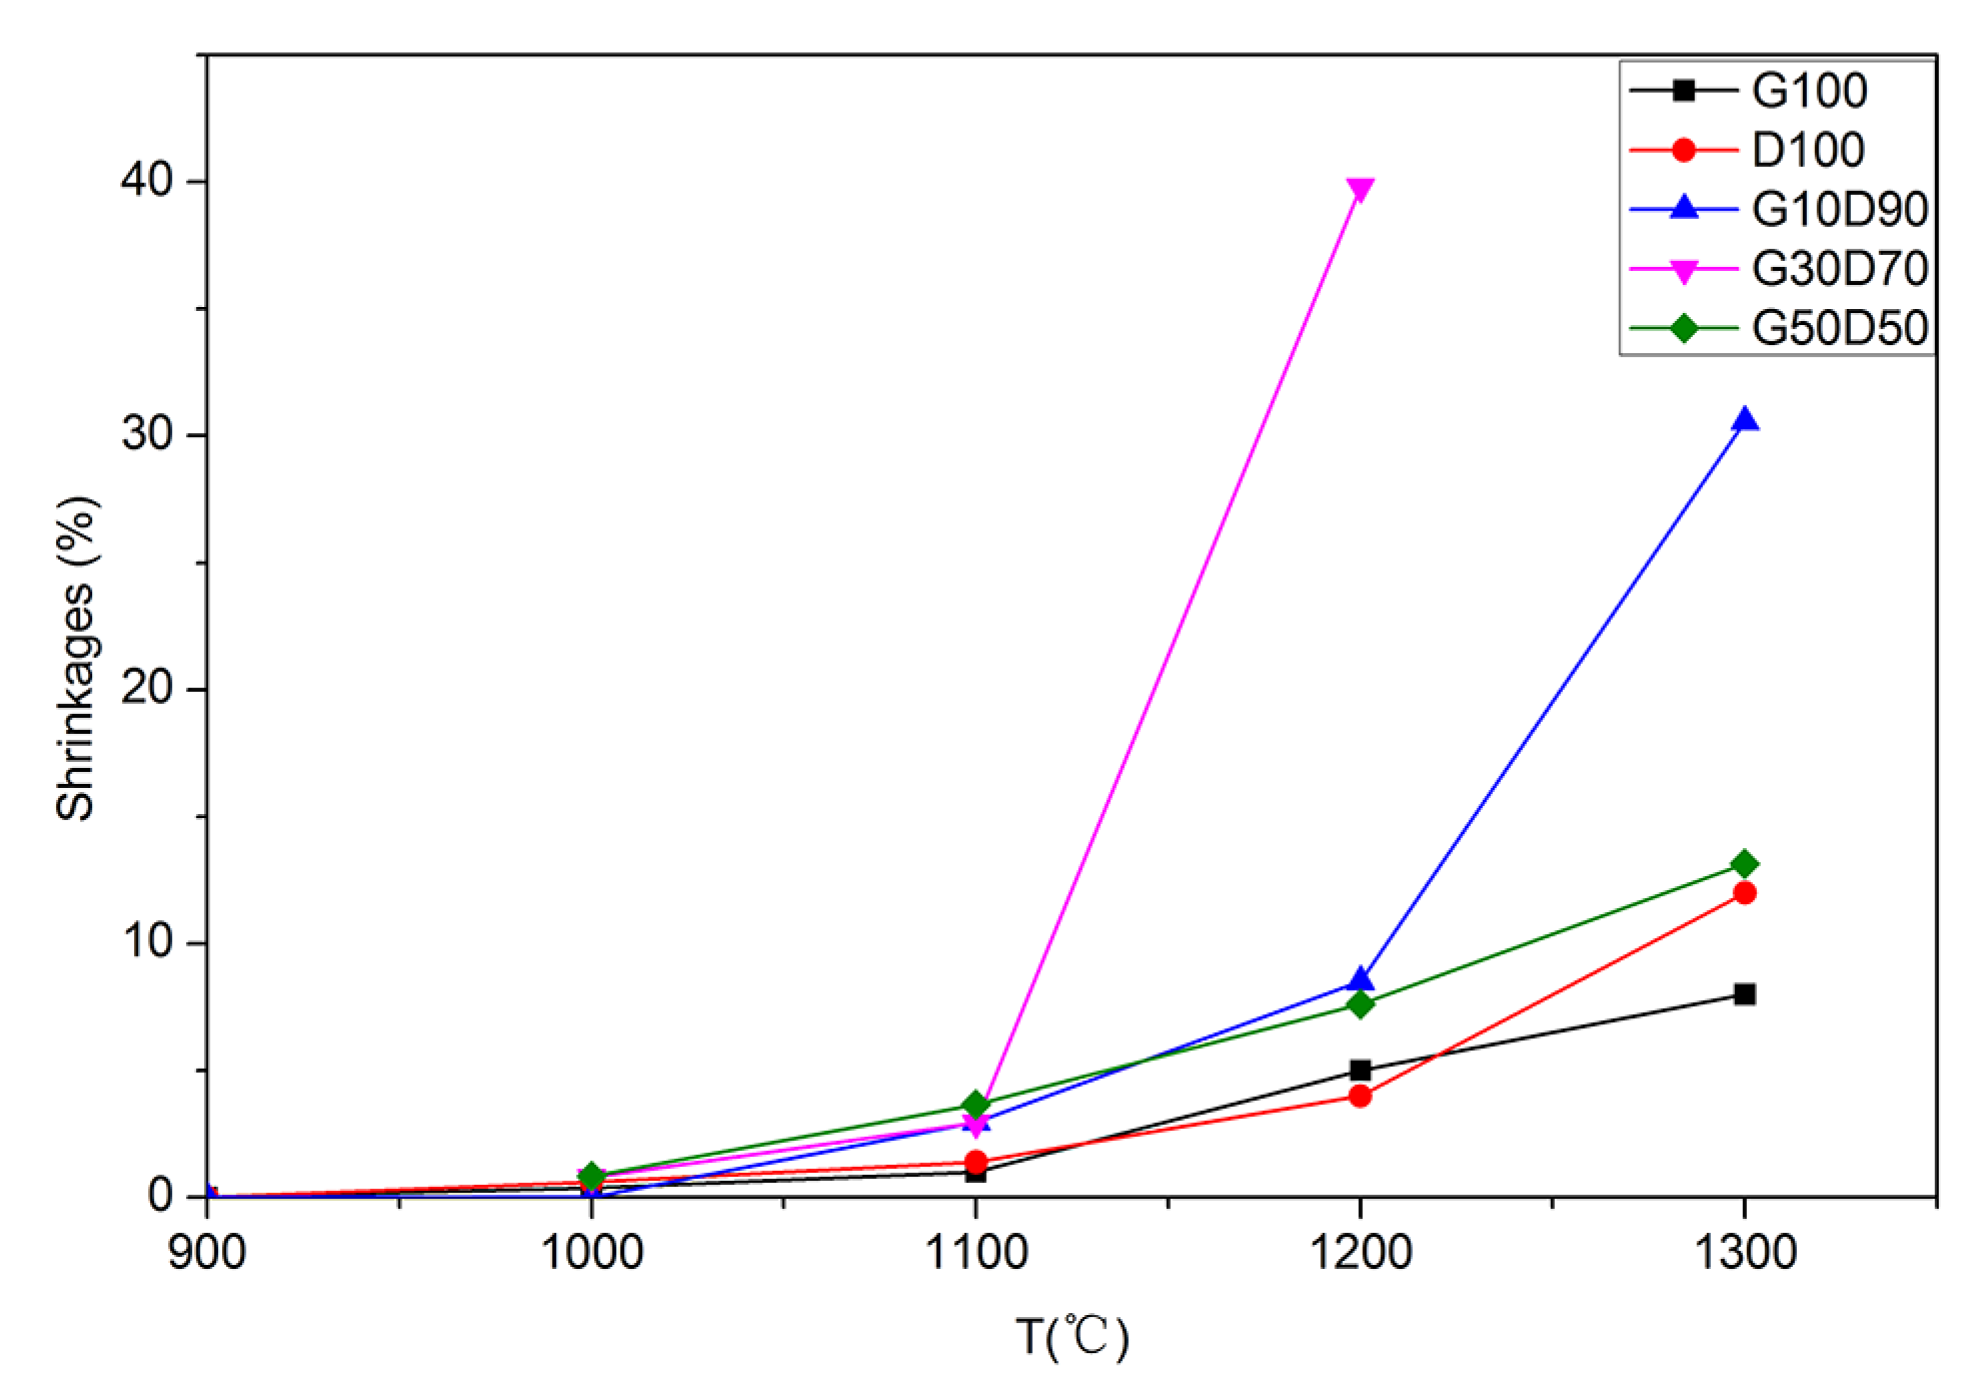
3.1. Ash Fusion Characteristics

The AFTs of the samples, including DT (deformation temperature), ST (softening temperature), HT (hemispherical temperature), and FT (flow temperature) are presented in Table 2. Both G coal and D coal belong to high ash fusion temperature coal, but the blended ashes fusion temperatures are lower than the temperature of each of the coals. The ash fusion temperatures initially decrease and then subsequently increase with the blending ratio (proportion of G100), before they reach the lowest temperatures in the vicinity of G30D70 (Figure 1). The ash fusion temperatures do not change linearly with bending ratios [23]. The fusibility of blended ashes as shown above is typically caused by eutectic melting.
Table 2. Fusion characteristic temperature of the samples °C.
SamplesDT (°C)ST (°C)HT (°C)FT (°C)
G1001490>1500>1500>1500
D1001322137113901437
G10D901243125812711291
G20D801211122512381257
G30D701167117311821194
G40D601230124212631276
G50D501302133113681391
Figure 1. Comparison of ash fusion temperatures and liquid temperatures: (a) AFTs; (b) liquidus temperature.
Energies 08 04735 g001
The shrinkages of ash discs vary with temperature as showed in Figure 2. The measurements of G30D70 at 1300 °C are excluded because the disc has completely melted and cannot maintain a fixed form. This result indicates that all curves of five samples are flat at low temperatures, and the shrinkages are low, or the slag content is low. When heated to 1100 °C, the curve of G30D70 sharply ascends, and the shrinkage considerably increases, reaches 39.9%, a result indicating that large amounts of slag are generated in G30D70. At 1200 °C, the curve of G10D90 suddenly increases, particularly the amounts of slag generated in G10D90, but less dramatically than the curve of G30D70. The shrinkage of G10D90 reaches 31.2% at 1200 °C. The curve growth rate of D100 also increases at 1200 °C to 1300 °C, a result indicating that more slag generates compared with other temperatures. Moreover, the curves of G100 and G50D50 are relatively flat in the entire process at 900 °C to 1300 °C, and this means that the slag content increases slowly.
Figure 2. Shrinkages of discs made of G100, D100, G10D90, G30D70, and G50D50.
Energies 08 04735 g002

3.2. Mineral Matter Transformations of Blended Ashes

3.2.1. G100

Figure 3a presents the XRD patterns of the G100 sample for individual ash. Figure 3b shows the mineral diffraction peak intensity values of G100. Table 3 presents the mineral crystals formed in ash samples at different temperatures. The results show that no obvious diffraction peak can be observed at 900 °C, and the background diffraction is strong, a result indicating that the main components of G100 are non-crystalline substances. The melt phase cannot abound in G100 at 900 °C, so the non-crystalline substances are determined to be amorphous minerals. G100 is rich in SiO2 and Al2O3 (Table 1), so the amorphous minerals are possibly clay minerals that are common in high silicon aluminum coal, such as kaolin (xSiO2yAl2O3). The main crystallized minerals in G100 are anhydrite and sodium silicate. The CaO and Na2O are negligible (Table 1) so the anhydrite and sodium silicate contents are low as well. When heated at 900 °C to 1000 °C, the anhydrite diffraction peaks gradually weaken, and the sodium silicate diffraction peaks disappear. Discernible sillimanite diffraction peaks (Al2O3∙SiO2) and mullite (3Al2O3∙2SiO2) diffraction peaks can also be observed (Figure 3a). The reactions between the minerals in G100 are as follows [17]:
xSiO2yAl2O3 → Al2O3∙2SiO2+ SiO2
2(Al2O3∙2SiO2) → Al2O3 (amorphous) + 3Al2O3∙2SiO2 (mullite)
Al2O3∙2SiO2 → Al2O3∙SiO2 (sillimanite) + SiO2
2SiO2 + Al2O3 → Al2O3∙2SiO2
CaSO4 → CaO+SO3
Table 3. Mineral crystals formed in ash samples at different temperatures.
SamplesG100D100G10D90G30D70G50D50
Mineral crystalsTemperature, °C
90010001100120013009001000110012001300900100011001200130090010001100120013009001000110012001300
Anhydrite
Sodiumsillicate
Mullite
Sillimanite
Cristobalite
Nepheline
Magnetite
Gehlenite
Periclase
Anorthite
Rankinite
Merwinite
Quartz
Hematite
Diopside
Hercynite
“√” means the corresponding mineral crystal is formed in the sample.
When heated at 1000 °C to 1100 °C, the above reactions continue. Anhydrite completely decomposes and the corresponding diffraction peaks disappear; the intensity of mullite diffraction peaks becomes stronger gradually. The SiO2 content continues to increase because of Reaction (2). Crystal recombination is observed in the high-temperature phase, and SiO2 is converted from an amorphous structure into a cristobalite crystal; this change leads to the appearance of cristobalite diffraction peaks at 1200 °C. Mullite diffraction peaks and sillimanite diffraction peaks also increase significantly. Because of their similar crystal structures, the sillimanite diffraction peaks are very close to the mullite diffraction peaks, phenomenon that results in peak overlapping, deformation, and smoothness. At the 1200 °C to 1300 °C temperature phase, Reaction (7) occurs, and sillimanite is converted into mullite completely.
Al2O3∙SiO2 (sillimanite) + 2Al2O3 + SiO2 → 3Al2O3∙2SiO2 (mullite)
Because of the disappearance of sillimanite, mullite diffraction peaks are expected to be sharp. Only mullite diffraction peaks and cristobalite diffraction peaks are observed in the diffraction pattern whose intensity is considerably increased at 1300 °C. Figure 4a shows the mullite crystal morphology found at 1300 °C in G100. For mullite and cristobalite with a high fusion temperature generated, the G100 ash fusion temperature is higher than that of the other ash samples.

3.2.2. D100

Figure 3c shows the XRD patterns of the D100 sample and Figure 3d presents the mineral diffraction peak intensity values of D100. The results show obvious nepheline (Na2O·Al2O3·2SiO2) diffraction peaks and periclase diffraction peaks at 900 °C, a result that is consistent with D100 being rich in Na and Mg elements (Table 1). When heated at 900 °C to 1100 °C, nepheline gradually decomposes until it disappears at 1100 °C. The most noticeable diffraction peaks are anhydrite, gehlenite and magnetite, and this observation is directly related to the high Ca element content up to 39% in D coal ash (Table 1). Amounts of anhydrite crystal were found in D100 at 900 °C, as shown in Figure 4b. In the high-temperature evolution process of abnormal calcium coal ash, the calcium minerals play a decisive role in mineral matter transformation.
The decomposition temperature of anhydrite is 900 °C to 1000 °C and the decomposition product CaO can directly react with other minerals in the coal ash [22].
2CaO + SiO2 → 2CaO∙2CaO∙2SiO2
2CaO + SiO2 + Al2O3 → 2CaO∙Al2O3∙SiO2 (gehlenite)
3CaO + SiO2 + MgO → 3CaO∙MgO∙2SiO2 (merwinite)
Al2O3∙2SiO2 + 2CaO → 2CaO∙Al2O3∙SiO2 (gehlenite) + SiO2
Al2O3∙2SiO2 + CaO → CaO∙Al2O3∙2SiO2 (anorthite)
Al2O3∙2SiO2 + 2CaO → 2CaO∙Al2O3∙2SiO2
Because of Reactions (9) and (11), the gehlenite diffraction peaks increase gradually. Compared with the case at 900 °C, quartz diffraction peaks considerably decrease at 1000 °C when the merwinite (3CaO·MgO·2SiO2) diffraction peaks appear for the first time and constantly increase because of Reaction (10). When heated at 1200 °C to 1300 °C, the gehlenite diffraction peaks decrease, whereas the merwinite diffraction peaks and the magnetite diffraction peaks simultaneously decrease sharply and disappear at 1300 °C. The fusion temperatures of gehlenite, merwinite and magnetite are all higher than 1200 °C, so these three kinds of minerals, namely, gehlenite, merwinite, and magnetite, react and form a low-melting eutectic mixture. Finally, only gehlenite diffraction peaks and periclase diffraction peaks can be observed at 1300 °C in the XRD patterns. Both fusion temperatures of gehlenite and periclase are high, so D100 also has a high ash fusion temperature.

3.2.3. G10D90

Figure 3e presents the XRD patterns of the G10D90 sample for the blended ash. Figure 3f presents the mineral diffraction peak intensity values of G10D90. At 900 °C, the main minerals in both ashes such as nepheline, periclase, gehlenite, anhydrite, merwinite, and magnetite are similar. The introduction of G100 causes the main mineral contents in G10D90 to be lower than those in D100. It also introduces silica-alumina-abundant minerals, such as xSiO2yAl2O3 minerals mentioned in the previous section, into G10D90; these minerals are similar in chemical property. The sufficient SiO2 is favorable to the formation of merwinite in Reaction (10). Moreover, the xSiO2yAl2O3 minerals react readily with the CaO generated by anhydrite and produce xSiO2∙yAl2O3∙zCaO minerals, such as gehlenite, and anorthite, as shown in Reactions (9)–(12) [22].
At 900 °C to 1000 °C, the main mineral changes also include the decomposition of anhydrite and the generation of gehlenite as D100. The most significant difference between G10D90 and D100 is that gehlenite, magnetite and merwinite diffraction peaks disappear simultaneously, result indicating rapid and complete melting and conversion into a glassy state at 1200 °C to 1300 °C, so the slag content in coal ash increases noticeably (Figure 2). The fusion temperatures of gehlenite, merwinite and magnetite are all higher than 1200 °C, so gehlenite, merwinite and magnetite form a low-melting eutectic mixture, which results in gehlenite melting. The crystal morphologies of merwinite and magnetite found in G10D90 at 1200 °C are shown in Figure 4c and d. Although the G10D90 involves the same eutectic reactants with D100, the eutectic process is significantly different and thus accounts for the discrepancy in reactant content. The merwinite diffraction intensity of G10D90 increases considerably compared with that of D100. The content advantage results in a more violent eutectic process, which is the cause of the lower ash fusion of G10D90 than that of D100.

3.2.4. G30D70

Figure 3g presents the XRD patterns of the G30D70 sample. Figure 3h presents the mineral diffraction peak intensity values of G30D70. As more G100 is introduced, the quartz diffraction peaks considerably increase, and the main diffraction peak reaches 803 cps at 900 °C (Figure 3h); the main diffraction peak of G10D90 only reaches 438 cps (Figure 3f). Amounts of SiO2 react with periclase and generate diopside, as shown in Reaction (14), so weak periclase diffraction peaks appear at 900 °C.
At 900 °C to 1100 °C, the anhydrite decomposes into CaO, which reacts to generate gehlenite and consume amounts of SiO2. Because of overlapping with the nepheline and magnetite diffraction peaks, the diopside (CaO·MgO·2SiO2) diffraction peaks do not appear until nepheline decomposes and decreases. Figure 3g shows that nepheline has three diffraction peaks, and two of them decrease synchronously with the temperature, whereas the rest remains the same. The increase in the diopside peaks makes up for the loss of the nepheline peaks.
2SiO2 + CaO + MgO → CaO∙MgO∙2SiO2 (diopside)
Also a result of overlapping, the nepheline diffraction peaks and the magnetite diffraction peaks become flat with the increase in diopside content. At 900 °C to 1100 °C, no main mineral disappears in G30D70, so no large amount of slag is produced in this phase, as shown in Figure 2. Only gehlenite, magnetite, and diopside diffraction peaks can be observed at 1100 °C. Amounts of diopside crystals are found in G30D70 at 1100 °C (Figure 4e). With heating at 1200 °C, no diffraction peaks in the XRD patterns are observed, so the crystallized minerals have all melted into vitresence. The high fusion temperature minerals of gehlenite, diopside and magnetite melt simultaneously, a result indicating that the minerals have formed a low-melting eutectic mixture. The eutectic mixture morphology is shown in Figure 4f. Compared with G10D90, the eutectic process obviously changes. The diopside is a substitute for merwinite as a reactant and shows an obvious advantage in terms of content. Consequently, G30D70 has the lowest ash fusion temperature among all the samples.

3.2.5. G50D50

Figure 3i presents the XRD patterns of the G50D50 sample. Figure 3j presents the mineral diffraction peak intensity values of G50D50. Compared with G30D70, more G100 is introduced to G50D50, so the proportion of the original mineral mass of D100 in G50D50, such as anhydrite, periclase, and magnetite, in the total G50D50 decreases. With the decrease in anhydrite, the CaO decomposed by anhydrite also decreases. SiO2 and Al2O3 are abundant, so they inhibit Reaction (15), narrow the gehlenite and accumulate anorthite. When heated at 900 °C to 1100 °C, hematite and magnetite show no apparent change, and no new mineral is generated. When heated at 1100 °C to 1200 °C, hematite and magnetite transform into iozite (FeO), which reacts with anorthite in Reaction (16) and generates hercynite and fayalite [22]. However, fayalite melts immediately because of its low fusion temperature. Therefore, compared with the case at 1100 °C, the hematite and magnetite diffraction peaks decrease significantly at 1200 °C in the XRD patterns.
CaO∙Al2O3∙2SiO2 (anorthite) + CaO → 2CaO∙Al2O3∙2SiO2 (gehlenite)
CaO∙Al2O3∙2SiO2 (gehlenite) + FeO → 2FeO∙SiO2+ FeAl2O4
The minerals in G50D50 at 1200 °C are not evidently different from those in G50D50 at 1300 °C, and the slag content also changes very negligibly (Figure 2). In the entire temperature range, G50D50 has not shown an obvious eutectic phenomenon, probably because of the lack of periclase, and anhydrite, as well as the excess of Al2O3 and SiO2. The anhydrite crystal morphology at 1300 °C in G50D50 is shown in Figure 4g. Therefore, G50D50 is given a relatively high ash fusion temperature.
Figure 3. X-ray diffraction (XRD) patterns and intensity-temperature curves at different temperatures: (a) and (b), G100; (c) and (d), D100; (e) and (f), G10D90; (g) and (h), G30D70; and (i) and (j), G50D50. A, anhydrite; Ss, sodium silicate; Mu, mullite; S, sillimanite; Cr, cristobalite; G, gehlenite; N, nepheline; Q, quartz; P, periclase; R, rankinite; M, magnetite; W, merwinite; H, hematite; D, diopside; Hr, hercynite; Ar, anorthite and Hr, hercynite.
Energies 08 04735 g003
Figure 4. Scanning Electron Microscopy (SEM) and Energy Dispersive X-Ray (EDX) spectra of the mineral phases found in the ash samples: (a) crystal of mullite in G100 at 1300 °C; (b) crystal of anhydrite in D100 at 900 °C; (c) crystal of magnetite in D10G90 at 1200 °C; (d) morphology of merwinite in G10D90 at 1200 °C; (e) crystal of diopside in G30D70 at 900 °C; (f) morphology of the eutectic mixture in G30D70; and (g) crystal of anorthite in G50D50 at 1300 °C.
Energies 08 04735 g004

3.3. Thermodynamic Calculations with FactSage

3.3.1. Ternary Phase Diagram and Liquidus Analysis

Figure 5 shows the ternary phase diagram of SiO2–Al2O3–CaO. Line G100–D100 stands for the chemical composition range of the investigated blended ashes. The mineral matter in the primary crystal region including point G100 is mullite, and that in the primary crystal region including point G50D50 is anorthite. It is consistent with the experimental results from Figure 3a,i. The liquidus temperature of G100 is higher than G50D50 and it is also consistent with the results of AFTs (Figure 1). However, Mineral matter in the primary crystal region including point D100 and G10D90 is α-Ca2SiO4 against gehlenite obtained from XRD analysis, and the liquidus temperature of D100 is higher than G100, against the AFTs results as well. Moreover, the ash sample with lowest liquidus temperature is G40D60 rather than G30D70, a sample with the lowest AFT. The reason for the inconformity between ternary phase diagram analysis and experiment results is that some important elements (such as Mg, Fe) have not been considered in the ternary phase diagram analysis. The minerals containing these elements react and form low-temperature eutectic mixtures, which significantly affect ash fusibility. Therefore, with less other elements, the ternary phase analysis result of G100 and G50D50 shows better consistency with experimental results.
Figure 5. SiO2–Al2O3–CaO ternary phase diagram.
Energies 08 04735 g005

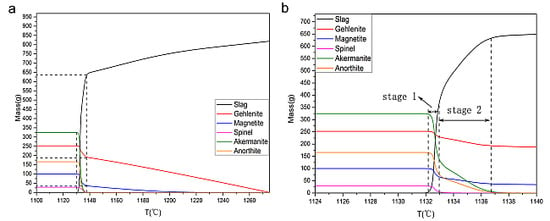
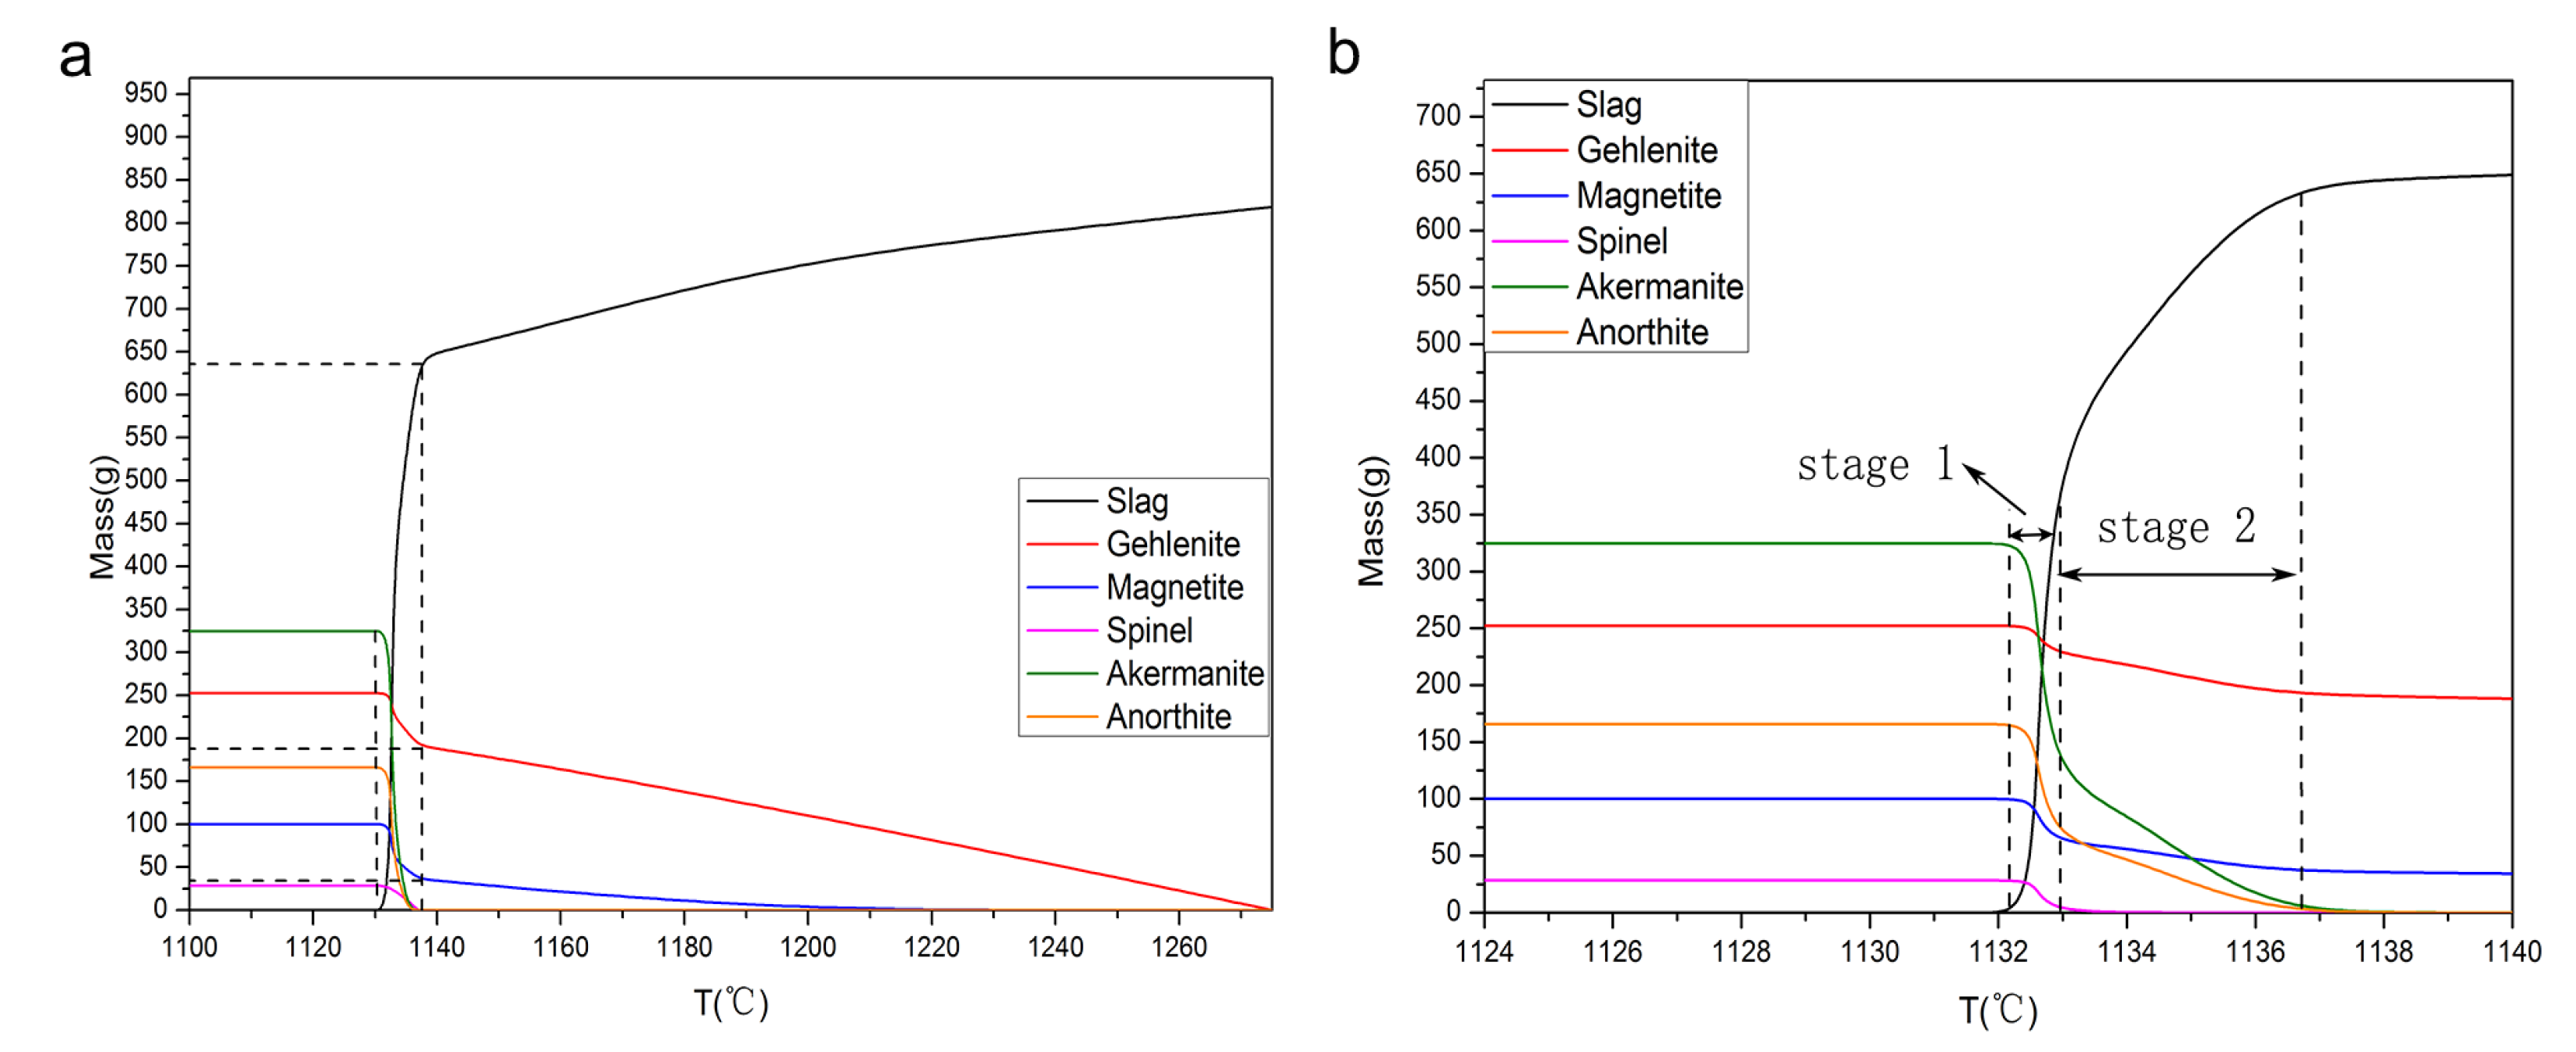
3.3.2. Eutectic Processes Simulated with FactSage

The eutectic processes in D100, G10D90, and G30D70 were simulated with FactSage based on five elements, Si, Al, Ca, Fe and Mg, and the fusibility was analyzed according to the simulation result, which makes up for the limitation of ternary phase diagram analysis.

3.3.2.1. D100

The thermodynamic equilibrium state of gehlenite, merwinite and magnetite was calculated with FactSage at 1200 °C to 1550 °C, as shown in Figure 6a. The mineral relative mass content was obtained by semi-quantitative analysis according to the XRD analysis results (Table 4). The results indicate that when heated at 1225 °C to 1250 °C, the mass curves of merwinite, magnetite, and gehlenite descend simultaneously and sharply. The descending rates of the three mass curves at 1225 °C to 1250 °C are significantly different from those of the other temperatures, a result indicating that the descent of the mass of the three minerals has a definite correlation, namely, the emergence of the eutectic melting of the three minerals rather than individual melting or eutectic melting by twos. When the merwinite is exhausted, the eutectic process is ended. The magnetite content decreases from 100.0 g to 48.7 g and the gehlenite content decrease from 340.0 g to 316.4 g, a result indicating that just a small amount of reactants was converted into slag. The mass fraction of slag only reaches 13%, as shown in Figure 7. At 1550 °C, the coal ash has completely melted into slag. Figure 6b presents the further accurate calculation of the thermodynamic equilibrium state at 1230 °C to 1240 °C. The calculation shows that the accurate eutectic temperature of the three minerals is about 1232 °C. An accurate eutectic temperature is the characteristic of a eutectic phenomenon. The gehlenite content decreases slightly in the entire eutectic process because the merwinite content is too little to consume it. Therefore, the slag produced by the eutectic is also negligible, so the ash fusion temperature of D100 is still high.
Table 4. Relative mass content of the eutectic reactants (mass of Magnetite: 100 g).
SamplesReactantsMass Content (%)Mass (g)
D100Magnetite21.4%100.0
Gehlenite69.4%343.0
Merwinite9.2%45.3
G10D90Magnetite20.9%100.0
Gehlenite61.2%293.1
Merwinite17.9%85.5
G30D70Magnetite7.9%100.0
Gehlenite54.2%470.1
Diopside37.9%297.0
Figure 6. Mass of gehlenite, merwinite, magnetite, and slag at each thermodynamic equilibrium state (D100): (a) 1200 °C to 1575 °C; (b) 1230 °C to 1240 °C.
Energies 08 04735 g006
Figure 7. Comparison of the slag mass contents at each thermodynamic equilibrium state of the three blended ashes.
Energies 08 04735 g007

3.3.2.2. G10D90

The eutectic process that occurs in G10D90 is similar to the one occurs in D100, as shown above. The reactants are merwinite, magnetite and gehlenite, and the eutectic temperature is 1232 °C as well. The difference is that the mass merwinite content in G10D90 is 17.9%, which is significantly more than 9.2% in D100 (Table 4). The gehlenite content decreases from 293.1 g to 197.8 g and the magnetite decreases from 100.0 g to10.8 g (Figure 8). It means that large amounts of reactants convert into slag and the slag content reaches 55% far more than 13% in D100 during the eutectic process (Figure 7). At 1450 °C, the coal ash has completely melted into slag. Therefore, the ash fusion temperature of G10D90 is lower than that of D100.
Figure 8. Masses of gehlenite, merwinite, magnetite, and slag at each thermodynamic equilibrium state (G10D90).
Energies 08 04735 g008

3.3.2.3. G30D70

Figure 9a shows the thermodynamic equilibrium state of gehlenite, diopside and magnetite at 1100 °C to 1275 °C as calculated with FactSage. As shown in Table 4, the diopside mass fraction has reached 37.9%, much higher than of merwinite in G10D90. The diopside is not directed involved in the eutectic process, but it firstly reacts with gehlenite to generate akermanite, spinel and anorthite, which consume amounts of gehlenite. Gehlenite is consumed in two ways: through reacting with diopside and though eutectic melting. When heated at 1130 °C to 1140 °C, the mass curves of gehlenite, magnetite, akermanite, spinel and anorthite decrease concurrently, a result indicating the emergence of a eutectic process. The content of gehlenite whose initial mass is 470.1 g, reaches 185.8 g after the eutectic process, a result indicating that large amounts of gehlenite were consumed and converted in slag. Figure 9b presents the further accurate calculation of the thermodynamic equilibrium state at 1124 °C to 1140 °C. The results show that the eutectic process is divided into two stages, with the disappearance of the spinel as the boundary. The first stage starts at 1132 °C, and the low-melting eutectic mixture of Ca2MgSi2O7–MgAl2O4–CaAl2Si2O8–Ca2Al2SiO7–Fe3O4 is formed until MgAl2O4 completely melts at 1133 °C. In the second stage, the low-melting eutectic mixture of Ca2MgSi2O7–CaAl2Si2O8–Ca2Al2SiO7–Fe3O4 is formed at 1133 °C to 1137 °C. Obviously, the mass curve of the first phase is much steeper than that of second phase. Hence, the melting performance of the former eutectic mixture is stronger than that of the latter. After the two eutectic processes, the gehlenite continue melting gradually until it completely disappears at 1275 °C. Although the eutectic phenomena also occur and reduce the gehlenite in D100 and G10D90, the eutectic temperature of G30D70 is lower about 100 °C than those of D100 and G10D90. Moreover, G30D70 has a major advantage in terms of diopside content; it can consume much more gehlenite. The slag content reaches up to 73.4% after the eutectic process (Figure 7). As a result, the fusion temperature of G30D70 is lower than those of D100 and G10D90.
Figure 9. Masses of gehlenite, merwinite, magnetite, spinel, akermanite, anorthite, and slag at each thermodynamic equilibrium state (G30D70): (a) 1100 °C to 1275 °C; (b) 1124 °C to 1140 °C.
Energies 08 04735 g009

4. Conclusions

The ash fusion temperature of G + D blended ashes initially decreases and then increases with the blending radio, a trend that is typical of eutectic melting. The shrinkage shows a strong correlation with slag content in coal ash, and is certainly feasible to be used to represent the slag content produced during heating. Moreover, the AFTs variation tendency is not completely consistent with the results obtained by the ternary phase diagram analysis for neglecting the influence of some important elements, such as Mg and Fe.
Obvious eutectic phenomena in D100, G10D90 and G30D70 in different degrees are observed by analyzing XRD patterns and disc shrinkages, which do not appear in G100 and G50D50 because of the lack of eutectic reactants, such as merwinite and diopside. And the eutectic phenomenon is the main reason that the lower blended ash fusion temperatures than those of individual coal ash. G100 has a high ash fusion temperature because of the generation of mullite and cristobalite. The G50D50 has a relatively high ash fusion temperature because of the accumulation of anorthite. The ash fusion temperature difference between D100 and G10D90 is caused by the difference in merwinite content. Moreover, the G30D70 sample not only has a significant advantage in terms of diopside content, but the eutectic temperature of the eutectic mixture in G30D70 is also lower that of D100 and G10D90; G30D70 has the lowest ash fusion temperature among all samples.

Acknowledgments

This work was supported by the National Basic Research Program of China (2012CB214906). The authors also acknowledge the project members and may people relevant to this project.

Author Contributions

The authors Mingke Shen and Kunzan Qiu designed the research, completed the experiment and simulation, wrote and edited the paper. Long Zhang and Zhenyu Huang provided some ideas on the paper. Zhihua Wang contributed to the data collection and analysis. Jianzhong Liu checked the results and the entire manuscript.

Conflicts of Interest

The authors declare no conflict of interest.

References

  1. Wang, P.; Massoudi, M. Slag Behavior in Gasifiers. Part I: Influence of Coal Properties and Gasification Conditions. Energies 2013, 6, 784–806. [Google Scholar] [CrossRef]
  2. Bryant, G.W.; Browning, G.J.; Emanuel, H.; Gupta, S.K.; Gupta, R.P.; Lucas, J.A.; Wall, T.F. The fusibility of blended coal ash. Energy Fuels 2000, 14, 316–325. [Google Scholar] [CrossRef]
  3. Sarkar, P.; Mukherjee, A.; Sahu, S.G.; Choudhury, A.; Adak, A.K.; Kumar, M.; Choudhury, N.; Biswas, S. Evaluation of combustion characteristics in thermogravimetric analyzer and drop tube furnace for Indian coal blends. Appl. Therm. Eng. 2013, 60, 145–151. [Google Scholar] [CrossRef]
  4. Zhang, X.M.; Liu, Y.H.; Wang, C.A.; Che, D.F. Experimental study on interaction and kinetic characteristics during combustion of blended coals. J. Therm. Anal. Calorim. 2012, 107, 935–942. [Google Scholar] [CrossRef]
  5. Lolja, S.A.; Haxhi, H.; Dhimitri, R.; Drushku, S.; Malja, A. Correlation between ash fusion temperatures and chemical composition in Albanian coal ashes. Fuel 2002, 81, 2257–2261. [Google Scholar] [CrossRef]
  6. Van Dyk, J.C. Understanding the influence of acidic components (Si, Al, and Ti) on ash flow temperature of South African coal sources. Miner. Eng. 2006, 19, 280–286. [Google Scholar] [CrossRef]
  7. Liu, B.; He, Q.H.; Jiang, Z.H.; Xu, R.F.; Hu, B.X. Relationship between coal ash composition and ash fusion temperatures. Fuel 2013, 105, 293–300. [Google Scholar] [CrossRef]
  8. Song, W.J.; Tang, L.H.; Zhu, X.D.; Wu, Y.Q.; Rong, Y.Q.; Zhu, Z.B.; Koyama, S. Fusibility and flow properties of coal ash and slag. Fuel 2009, 88, 297–304. [Google Scholar] [CrossRef]
  9. Xu, J.; Liu, X.; Zhao, F.; Wang, F.C.; Guo, Q.H.; Yu, G.S. Study on Fusibility and Flow Behavior of High-Calcium Coal Ash. J. Chem. Eng. Jpn. 2014, 47, 711–716. [Google Scholar] [CrossRef]
  10. Gupta, S.; Dubikova, M.; French, D.; Sahajwalla, V. Characterization of the origin and distribution of the minerals and phases in metallurgical cokes. Energy Fuels 2007, 21, 303–313. [Google Scholar] [CrossRef]
  11. Vassileva, C.G.; Vassilev, S.V. Behaviour of inorganic matter during heating of Bulgarian coals: 2. Subbituminous and bituminous coals. Fuel Process Technol 2006, 87, 1095–1116. [Google Scholar] [CrossRef]
  12. Rodrigues, S.; Marques, M.; Ward, C.R.; Suarez-Ruiz, I.; Flores, D. Mineral transformations during high temperature treatment of anthracite. Int. J. Coal Geol. 2012, 94, 191–200. [Google Scholar] [CrossRef]
  13. Chakravarty, S.; Mohanty, A.; Banerjee, A.; Tripathy, R.; Mandal, G.K.; Basariya, M.R.; Sharma, M. Composition, mineral matter characteristics and ash fusion behavior of some Indian coals. Fuel 2015, 150, 96–101. [Google Scholar] [CrossRef]
  14. Saikia, B.K.; Wang, P.P.; Saikia, A.; Song, H.J.; Liu, J.J.; Wei, J.P.; Gupta, U.N. Mineralogical and Elemental Analysis of Some High-Sulfur Indian Paleogene Coals: A Statistical Approach. Energy Fuels 2015, 29, 1407–1420. [Google Scholar] [CrossRef]
  15. Li, F.H.; Huang, J.J.; Fang, Y.T.; Liu, Q.R. Fusibility Characteristics of Residual Ash from Lignite Fluidized-Bed Gasification to Understand Its Formation. Energy Fuels 2012, 26, 5020–5027. [Google Scholar] [CrossRef]
  16. Song, W.J.; Tang, L.H.; Zhu, X.D.; Wu, Y.Q.; Zhu, Z.B.; Koyama, S. Prediction of Chinese Coal Ash Fusion Temperatures in Ar and H2 Atmospheres. Energy Fuels 2009, 23, 1990–1997. [Google Scholar] [CrossRef]
  17. Huang, Z.Y.; Li, Y.; Lu, D.; Zhou, Z.J.; Wang, Z.H.; Zhou, J.H.; Cen, K.F. Improvement of the Coal Ash Slagging Tendency by Coal Washing and Additive Blending with Mullite Generation. Energy Fuels 2013, 27, 2049–2056. [Google Scholar] [CrossRef]
  18. Folgueras, M.B.; Alonso, M.; Folgueras, J.R. Modification of lignite ash fusion temperatures by the addition of different types of sewage sludge. Fuel Process. Technol. 2015, 131, 348–355. [Google Scholar] [CrossRef]
  19. Nel, M.V.; Strydorn, C.A.; Schobert, H.H.; Beukes, J.P.; Bunt, J.R. Reducing atmosphere ash fusion temperatures of a mixture of coal-associated minerals—The effect of inorganic additives and ashing temperature. Fuel Process. Technol. 2014, 124, 78–86. [Google Scholar] [CrossRef]
  20. Vamvuka, D.; Kakaras, E. Ash properties and environmental impact of various biomass and coal fuels and their blends. Fuel Process. Technol. 2011, 92, 570–581. [Google Scholar] [CrossRef]
  21. Kocabas-Atakli, Z.O.; Okyay-Oner, F.; Yurum, Y. Combustion characteristics of Turkish hazelnut shell biomass, lignite coal, and their respective blends via thermogravimetric analysis. J. Therm. Anal. Calorim. 2015, 119, 1723–1729. [Google Scholar] [CrossRef]
  22. Wu, X.J.; Zhang, Z.X.; Chen, Y.S.; Zhou, T.; Fan, J.J.; Piao, G.L.; Kobayashi, N.; Mori, S.; Itaya, Y. Main mineral melting behavior and mineral reaction mechanism at molecular level of blended coal ash under gasification condition. Fuel Process. Technol. 2010, 91, 1591–1600. [Google Scholar] [CrossRef]
  23. Qiu, J.R.; Li, F.; Zheng, Y.; Zheng, C.G.; Zhou, H.C. The influences of mineral behaviour on blended coal ash fusion characteristics. Fuel 1999, 78, 963–969. [Google Scholar] [CrossRef]
  24. Bai, J.; Li, W.; Li, B.Q. Characterization of low-temperature coal ash behaviors at high temperatures under reducing atmosphere. Fuel 2008, 87, 583–591. [Google Scholar] [CrossRef]
  25. Wang, C.A.; Liu, Y.H.; Zhang, X.M.; Che, D.F. A Study on Coal Properties and Combustion Characteristics of Blended Coals in Northwestern China. Energy Fuels 2011, 25, 3634–3645. [Google Scholar] [CrossRef]
  26. Djordjevic, D.; Stojkovic, D.; Djordjevic, N.; Smelcerovic, M. Thermodynamics of Reactive Dye Adsorption from Aqueous Solution on the Ashes from City Heating Station. Ecol. Chem. Eng. S. 2011, 18, 527–536. [Google Scholar]
  27. Song, W.J.; Sun, Y.M.; Wu, Y.Q.; Zhu, Z.B.; Koyama, S. Measurement and Simulation of Flow Properties of Coal Ash Slag in Coal Gasification. AICHE J. 2011, 57, 801–818. [Google Scholar] [CrossRef]
  28. Kong, L.X.; Bai, J.; Bai, Z.Q.; Guo, Z.X.; Li, W. Effects of CaCO3 on slag flow properties at high temperatures. Fuel 2013, 109, 76–85. [Google Scholar] [CrossRef]
  29. Zhang, G.J.; Reinmoller, M.; Klinger, M.; Meyer, B. Ash melting behavior and slag infiltration into alumina refractory simulating co-gasification of coal and biomass. Fuel 2015, 139, 457–465. [Google Scholar] [CrossRef]
  30. Ilyushechkin, A.Y.; Hla, S.S. Viscosity of High-Iron Slags from Australian Coals. Energy Fuels 2013, 27, 3736–3742. [Google Scholar] [CrossRef]
  31. Van Dyk, J.C.; Keyser, M.J. Influence of discard mineral matter on slag-liquid formation and ash melting properties of coal—A FACTSAGE (TM) simulation study. Fuel 2014, 116, 834–840. [Google Scholar] [CrossRef]
  32. Yuan, H.P.; Liang, Q.F.; Gong, X. Crystallization of Coal Ash Slags at High Temperatures and Effects on the Viscosity. Energy Fuels 2012, 26, 3717–3722. [Google Scholar] [CrossRef]
  33. Zhu, Y.J.; Piotrowska, P.; van Eyk, P.J.; Bostrom, D.; Kwong, C.W.; Wang, D.B.; Cole, A.J.; de Nys, R.; Gentili, F.G.; Ashman, P.J. Cogasification of Australian Brown Coal with Algae in a Fluidized Bed Reactor. Energy Fuels 2015, 29, 1686–1700. [Google Scholar] [CrossRef]
  34. Srinivasachar, S.; Helble, J.J.; Boni, A.A. Mineral Behavior during Coal Combustion 1. Pyrite Transformations. Prog. Energy Combust. 1990, 16, 281–292. [Google Scholar] [CrossRef]

