Article

Effect of Construction Land Expansion on Energy-Related Carbon Emissions: Empirical Analysis of China and Its Provinces from 2001 to 2011

1
School of Resource and Environmental Sciences, Wuhan University, Wuhan 430079, China
2
Institute for Interdisciplinary Research, Jianghan University, Wuhan 430056, China
*
Author to whom correspondence should be addressed.
Energies 2015, 8(6), 5516-5537; https://doi.org/10.3390/en8065516
Submission received: 21 January 2015 / Revised: 18 May 2015 / Accepted: 1 June 2015 / Published: 8 June 2015
(This article belongs to the Special Issue Large Scale LUCC, Ecosystem Service, Water Balance and Energy Use)

Abstract

:
Construction land expansion significantly affects energy-related carbon emissions. This paper analyzed the effect of construction land expansion on energy-related carbon emissions in China and its provinces from 2001 to 2011 by using the logarithmic mean Divisia index method. We divided the study into two intervals (2001–2006 and 2006–2011) and categorized the 30 provinces of China into eight zones. Results indicated that construction land expansion exerted the second largest positive effect on carbon emission growth in China and in the 30 provinces from 2001 to 2011. The north, east, and south coastal regions as well as the middle Yellow River region, were the highly affected regions in the same period. Between the two study intervals, the effect of construction land expansion on carbon emissions decreased in China and in the coastal regions, but increased in inland regions. The Hebei, Shandong, Jiangsu, Zhejiang, Fujian, Guangdong, Yunnan, Chongqing, Ningxia, and Xinjiang provinces, which are concentrated in the north, east, and south coastal regions, were selected for the reduction of carbon emissions by controlling construction land expansion.

1. Introduction

Land use and land cover change have been considered among the largest sources of carbon emissions [1]. Both come second to fossil energy combustion, which accounts for more than 90% of all carbon sources [2,3,4]. As a common type of land-use and land-cover change, construction land expansion significantly affects carbon emissions. Analysis of the effect of construction land expansion on carbon emissions from the perspective of the carbon cycle in terrestrial ecosystems has shown that construction land expansion typically encroaches on farmlands and forests, which have a high carbon sink capacity and play a key role in the carbon sequestration of all types of land use [5]. Carbon emissions from fossil energy combustion are primarily caused by human consumption activities, such as those related to construction land, which includes urban lands, transportation lands, industrial lands, and other types of land use. Construction land comprises population, construction, transportation, industry, and logistics. At the present stage of the accelerated urbanization and industrialization of China [6], construction land is one of the major carriers of human activities, including energy consumption. Therefore, construction land expansion could induce changes in fossil energy consumption, causing further variations in carbon emissions. Thus, the energy consumption level determines the overall level of regional carbon emissions. If a corresponding relationship exists between carbon sources and land-use types, energy-related carbon emissions could also establish a corresponding relationship with construction land [7,8,9]. Studying the effect of construction land expansion on energy-related carbon emissions could provide a basis for efforts to reduce regional carbon emissions in relation to land-use regulation, and could expand the research scope of measures for reducing carbon emissions.
Numerous reports on the effects of land-use and land-cover change on carbon emissions have continuously appeared in recent years. The effects discussed in these studies can be divided into two aspects. The first aspect is the direct effect, wherein land-use and land cover-change can produce carbon emissions or carbon flux in the terrestrial ecosystem. Two types of calculation models according to different research scales are available. The larger research scale uses a bookkeeping model [10] and various inversion models of remote sensing [11]. The smaller research scale focuses on changes in soil carbon or carbon flux between soil and the atmosphere. Scientists have developed a series of calculation models for analyzing the physical and chemical characteristics of soil, such as the CENTURY model [12] and the DeNitrification–DeComposition model [13,14]. The second aspect, the indirect effect, is the contribution to carbon emissions of human activities that occur because of land-use and land-cover change. Research in this aspect primarily focuses on the carbon footprint and the relationship between carbon emissions and land-use or land-cover change. Carbon footprint measures regional ecological carrying capacity by considering the carbon sink capacity of forestland [15,16]. Relationship research principally investigates dynamic evolution [17] and causality between carbon emissions and land-use or land-cover change [18]. The lack of long-term observational and experimental data in China has prompted most researchers to examine the second aspect (indirect effect). The rapid development of the Chinese economy has been accompanied by a sharp increase in energy consumption [19]. In the quest to determine the basis for academic research and the formulation of appropriate policies for reducing energy-related carbon emissions, quantitative analyses on the factors that influence energy-related carbon emissions have become popular. Index decomposition analysis (IDA) has become a practical and widely used tool for quantifying these carbon emission-driving factors. IDA was first extended from energy consumption studies to energy-related carbon emission studies in 1991 [20]. In the literature that covers IDA on carbon emission, the IDA methods used may be grouped into six types, namely, Laspeyres (LASP) [21], arithmetic mean Divisia index (AMDI) [22], adaptive weighting Divisia (AWD) [23], Shapley/Sun (S/S) [24], logarithmic mean Divisia index (LMDI) [25] and other decomposition methods. As research continues, IDA identifies that have more factors and require more data, which provides more refined decomposition results. An increase in the number of factors in the IDA identify has an impact on the choice of decomposition method. The LMDI, which is easy to apply regardless of the number of factors, was preferred over other methods. Research trend indicates a strong preference for LMDI when the number of factors exceeds five [26]. The effects of various calculated factors on energy-related carbon emissions provide useful implications for the establishment of energy conservation policies for different industries and regions [27,28,29,30]. Most studies on carbon emissions focus on several factors, including economic development level, economic structure, energy intensity, energy consumption structure [31,32], population size, and population composition [33]. The growing demand for construction land in China is increased by infrastructure construction and economic development. The construction land expansion specifically discussed in the present paper refers to the sharp increase in the construction land area, which is a quantitative form of land-use and land- cover change. Construction land expansion is one of the important factors that influence carbon emissions in China and its provinces. Yang [34] suggested that non-agriculturalization and development of land use can increase carbon emissions. Du [35] showed that the elastic coefficient of China’s construction land-use change on carbon emission effect is 0.436–0.529. Su and Zhang [36] demonstrated that in Shannxi Province, a positive correlation existed between construction land and carbon emission from 1989 to 2008. Shan et al. [37] suggested that a high degree of correlation exists between the increase in industrial land in the Shanghai Zhangjiang Hi-Tech Park and the increase in carbon emissions in Shanghai. Mao et al. [38] verified the positive effect of Chinese construction land expansion on carbon emissions from 1996 to 2007. Similar to the aforementioned studies, the present paper focuses on the indirect effect of construction land on carbon emissions. To the best of our knowledge, only a few studies have analyzed the effects of construction land expansion on energy-related carbon emissions, and those studies merely established the correlation [39] and relationship between construction land and energy-related carbon emissions. Furthermore, the existing one or two articles that discuss the effects of construction land expansion on carbon emissions focused on the effects of construction land expansion on the whole country without consideration for the differences among provinces. None of these articles quantified the effects of construction land expansion on carbon emissions [40], and the study periods these articles covered are now too distant from the present. The current paper quantifies the analyses of the effects of construction land expansion on energy-related carbon emissions in provincial-level regions of China and in the country as a whole from 2001 to 2011. As a result, this paper provides policy makers with basic information on carbon emission reduction via controlling construction land expansion.
This paper is organized as follows: Section 2 briefly describes the research methodology, study area, and data sources. Methodology therein includes the estimation method for energy-related carbon emissions and the decomposition analysis model based on the LMDI method. Section 3 presents the analysis of the change characteristics of energy-related carbon emissions and area of construction land, along with the quantification of the effects of construction land expansion on carbon emissions and the selection of provinces that could achieve high carbon emission reduction by controlling construction land expansion. Finally, Section 4 provides the conclusions and policy implications.

2. Methodology and Data

2.1. Estimation of Energy-Related Carbon Emissions

Energy-related carbon emissions are calculated according to the Intergovernmental Panel on Climate Change (IPCC) method [19,41]. The principle that the IPCC method adheres to in determining energy-related carbon emissions is based on fossil fuel combustion heat value and carbon content. Based on this principle, as well as the ton of standard coal equivalent (TCE) calorific value and types of fossil energy conversion of calorific value per ton, scholars have obtained the TCE conversion coefficient and the carbon emission coefficient of several major fossil energies [42,43,44]. In accordance with the IPCC method, the energy-related carbon emissions can be estimated on the basis of the physical quantity of energy consumption, conversion coefficient of standard coal, and coefficient of carbon emissions. Carbon emissions in one province and the entire country can be estimated using the following equations:
C j = i e i j t c e i c f i
C = j C j = i j e i j t c e i c f i
where C j denotes the carbon emissions of province j (million tons, Mt); e i j denotes the consumption of energy type i in province j (t, m3 for natural gas); t c e i denotes the TCE conversion coefficient of energy type i (TCE/t, TCE/m3 for natural gas); and c f i denotes the carbon emission coefficient of energy type i (tC/TCE). C denotes the total carbon emissions of the entire country (Mt), which is the sum of carbon emissions of every province. Table 1 shows the parameters for calculating the carbon emissions of major types of fossil energy. Four decimal places were used for calculation accuracy.
Table 1. Parameters for calculating carbon emissions.
EnergyConversion coefficient of standard coalCarbon emission coefficient
Raw coal0.71430.7559
Coke0.97140.8550
Crude oil1.42860.5857
Gasoline1.47140.5538
Kerosene1.47140.5714
Diesel1.45710.5921
Fuel oil1.42860.6185
Natural gas13.3000.4483

2.2. Decomposition Model of Effect on Carbon Emissions

The starting point for our analysis is the Kaya identity, which expresses carbon emissions as the product of three factors [45], namely, economy, energy, and population [46]. The change in carbon emissions can be expressed as the integration effect of income, technology, and population, which could be further decomposed into effects caused by the gross domestic product (GDP), and an intensity effect caused by energy intensity and population size [30,47]. We extended the Kaya framework in the analysis of carbon emissions in China by considering six factors, namely, emissions coefficient, structure, intensity, income, density, and expansion effects. The construction land expansion factor characterized by construction land area, as extended by the Kaya identity, is shown in the following equation:
C = i j [ ( C i j / E i j ) × ( E i j / E j ) × ( E j / O j ) × ( O j / P j ) × ( P j / S j ) × S j ]     = i j [ C O E i j S T R i j I N T j I N C j D E N j E X P j ]
where C i j denotes the carbon emissions of energy type i in province j (Mt); E i j denotes the standard coal consumption of energy type i in province j (Mt); E j denotes the total standard coal consumption of all energy types in province j (Mt); O j denotes the income of province j (CNY); P j denotes the population of province j; and S j denotes the construction land area of province j (km2). C O E i j denotes the carbon emissions coefficient of energy type i in province j; S T R i j denotes the proportion of total energy consumption by province j as accounted for by consumption of energy type I; I N T j denotes the energy intensity of province j (t/CNY); I N C j denotes the per capita economic income of province j (CNY per capita); D E N j denotes the population per unit area of construction land in province j (people per km2); and E X P j denotes the area of construction land in province j (km2). Consequently, carbon emissions could be expressed by the multiplication of carbon emissions coefficient COE, energy consumption structure STR, energy intensity INT, per capita income INC, population density DEN, and construction land expansion EXP. These six factors influence carbon emissions.
The change in carbon emissions from the base year (year 0) to the target year (year t) can be expressed as follows:
Δ C = C t C 0 = Δ C c o e + Δ C s t r + Δ C i n t + Δ C i n c + Δ C d e n + Δ C e x p + Δ C r s d
where Δ C t o t denotes the changes in carbon emissions from year 0 to year t (Mt); C t denotes the carbon emissions of the entire country in year t (Mt); and C 0 denotes the carbon emissions of the entire country in year 0 (Mt). Moreover, Δ C could be expressed as the sum of the effects of the preceding six factors and the remainder term from year 0 to year t; and Δ C c o e , Δ C s t r , Δ C i n t , Δ C i n c , Δ C d e n , and Δ C e x p refer to the effects of coefficient, structure, intensity, income, density, and expansion on changes in carbon emissions (Mt), respectively. Δ C r s d denotes the reminder term in decomposition (Mt).
In the aforementioned IDA methods; the LASP method encounters the same problem as the AMDI in that it also leaves a residual term. The AWD method poses a more complex calculation than the LMDI when many factors are being considered. The S/S method; which is a refinement of the LASP method to a certain extent; reallocates the residual terms in the LASP method to the various effects [48]. With this refinement; the original advantage of the LASP method as a natural match for the conventional concept of spatial comparison no longer exists. LMDI has also been widely adopted in temporal decomposition analysis [49]. To calculate the direction and magnitude of the effect of each factor; we adopted the LMDI decomposition method; which was proposed and optimized by Ang [50,51]. This method has an extensive application value in the field of resources and environmental economics [52]. The additive decomposition of LMDI can be carried out as follows [53]:
Δ C c o e = i j C i j t C i j 0 ln C i j t ln C i j 0 ln C O E i j t C O E i j 0
Δ C s t r = i j C i j t C i j 0 ln C i j t ln C i j 0 ln S T R i j t S T R i j 0
Δ C i n t = i j C i j t C i j 0 ln C i j t ln C i j 0 ln I N T j t I N T j 0
Δ C i n c = i j C i j t C i j 0 ln C i j t ln C i j 0 ln I N C j t I N C j 0
Δ C d e n = i j C i j t C i j 0 ln C i j t ln C i j 0 ln D E N j t D E N j 0
Δ C e x p = i j C i j t C i j 0 ln C i j t ln C i j 0 ln E X P j t E X P j 0
We divided C/E (C denotes carbon emissions, E denotes energy consumption) into two factors, namely, coefficient effect (COE, Cij/Eij) and structure effect (STR, Eij/Ej), which can directly reflect the effect of the energy consumption structure. The changing mix of energy (fuel) can make C/E change in time but Cij/Eij will be time-invariant. Given that the carbon emission coefficients of each type of energy will remain constant (i.e., the carbon content of each type of energy does not change); thus, we disregarded the effect of COE on carbon emissions. Therefore, Δ C c o e = 0. Thus, the changes in carbon emissions are thus decided by the other five factors as well as the remainder term. On the basis of the articles by Ang, we determined that this method did not produce the remainder term, Δ C r s d = 0:
Δ C r s d = Δ C ( Δ C c o e + Δ C s t r + Δ C i n t + Δ C i n c + Δ C d e n + Δ C e x p )            = Δ C i j C i j t C i j 0 ln C i j t ln C i j 0 ( ln C O E i j t × S T R i j t × I N T j t × I N C j t × D E N j t × E X P j t C O E i j 0 × S T R i j 0 × I N T j 0 × I N C j 0 × D E N j 0 × E X P j 0 )            = Δ C i j C i j t C i j 0 ln C i j t ln C i j 0 ( ln C i j t ln C i j 0 ) = 0
The change in carbon emissions would be completely decomposed into the preceding five factors. To measure and compare the carbon effects induced by each factor among the provinces in the study area, the normalized contribution rate of EXP was defined, as shown in the following equation. The equations for the normalized contribution rate of the other four factors are similar to the preceding equation:
N R exp = Δ C e x p | Δ C s t r | + | Δ C i n t | + | Δ C i n c | + | Δ C d e n | + | Δ C e x p | 100 %

2.3. Study Area

Mainland China consists of 31 provincial administrative regions, which we refer to in the present paper as “provinces.” Given the lack of data on Tibet, we decided to focus on the remaining 30 provinces. To summarize the distribution and spatial variation of empirical results, we employed the latest data on the eight major economic zones in China, namely, Northeast China (Liaoning, Jilin, and Heilongjiang); the north coast (Beijing, Tianjin, Hebei, and Shandong); the east coast (Shanghai, Jiangsu, and Zhejiang); the south coast (Fujian, Guangdong, and Hainan); the middle Yellow River (Shannxi, Shanxi, Henan, and Inner Mongolia); the middle Yangtze River (Hubei, Hunan, Jiangxi, and Anhui); Southwest China (Yunnan, Guizhou, Sichuan, Chongqing, and Guangxi); and Northwest China (Gansu, Qinghai, Ningxia, Tibet, and Xinjiang) (Figure 1). This division is the latest official regional classification by the Chinese government.
Figure 1. Division of the eight zones in China.
Energies 08 05516 g001

2.4. Data Collection and Description

We obtained energy consumption and socioeconomic data on the 30 provinces of China from 2001 to 2011. We categorized the obtained data as follows: (1) Energy consumption data for each province were obtained from issues of the China Energy Statistical Yearbook from 2002 to 2012 [54,55,56,57,58,59,60,61,62], which contained data on the period from 2001 to 2011. The data covered eight types of energy consumption, namely, raw coal, coke, crude oil, gasoline, kerosene, diesel oil, fuel oil, and natural gas. (2) The socioeconomic data obtained included the GDP of each province; income of agriculture, animal husbandry, and fishery; population; population urbanization level; and construction land area, which were obtained from issues of the China Statistical Yearbook from 2002 to 2012 [63,64,65,66,67,68,69,70,71,72,73]. Given that the object of the present study is the effect of construction land expansion on carbon emissions, data collection and processing corresponded to construction land, which could facilitate the explanation for each factor. Income, as used in this paper, is equal to the total GDP minus the income of agriculture, animal husbandry, and fishery; this result was subsequently converted to the constant prices of the base year, 2000. Similarly, population, as used in this paper, is equal to the total population multiplied by the population urbanization level. In the calculation process, several types of energy consumption that had zero or null values were substituted by a minimal value, as supported by the LMDI method [74,75] because these values do not affect the convergence results [76].

3. Results and Discussion

We selected 2006 as the piecewise time point for expressing and analyzing results. By using the LMDI method, we decomposed the changes in energy-related carbon emissions in the 30 provinces and regions of China in the following periods: from 2001 to 2011, from 2001 to 2006, and from 2006 to 2011.

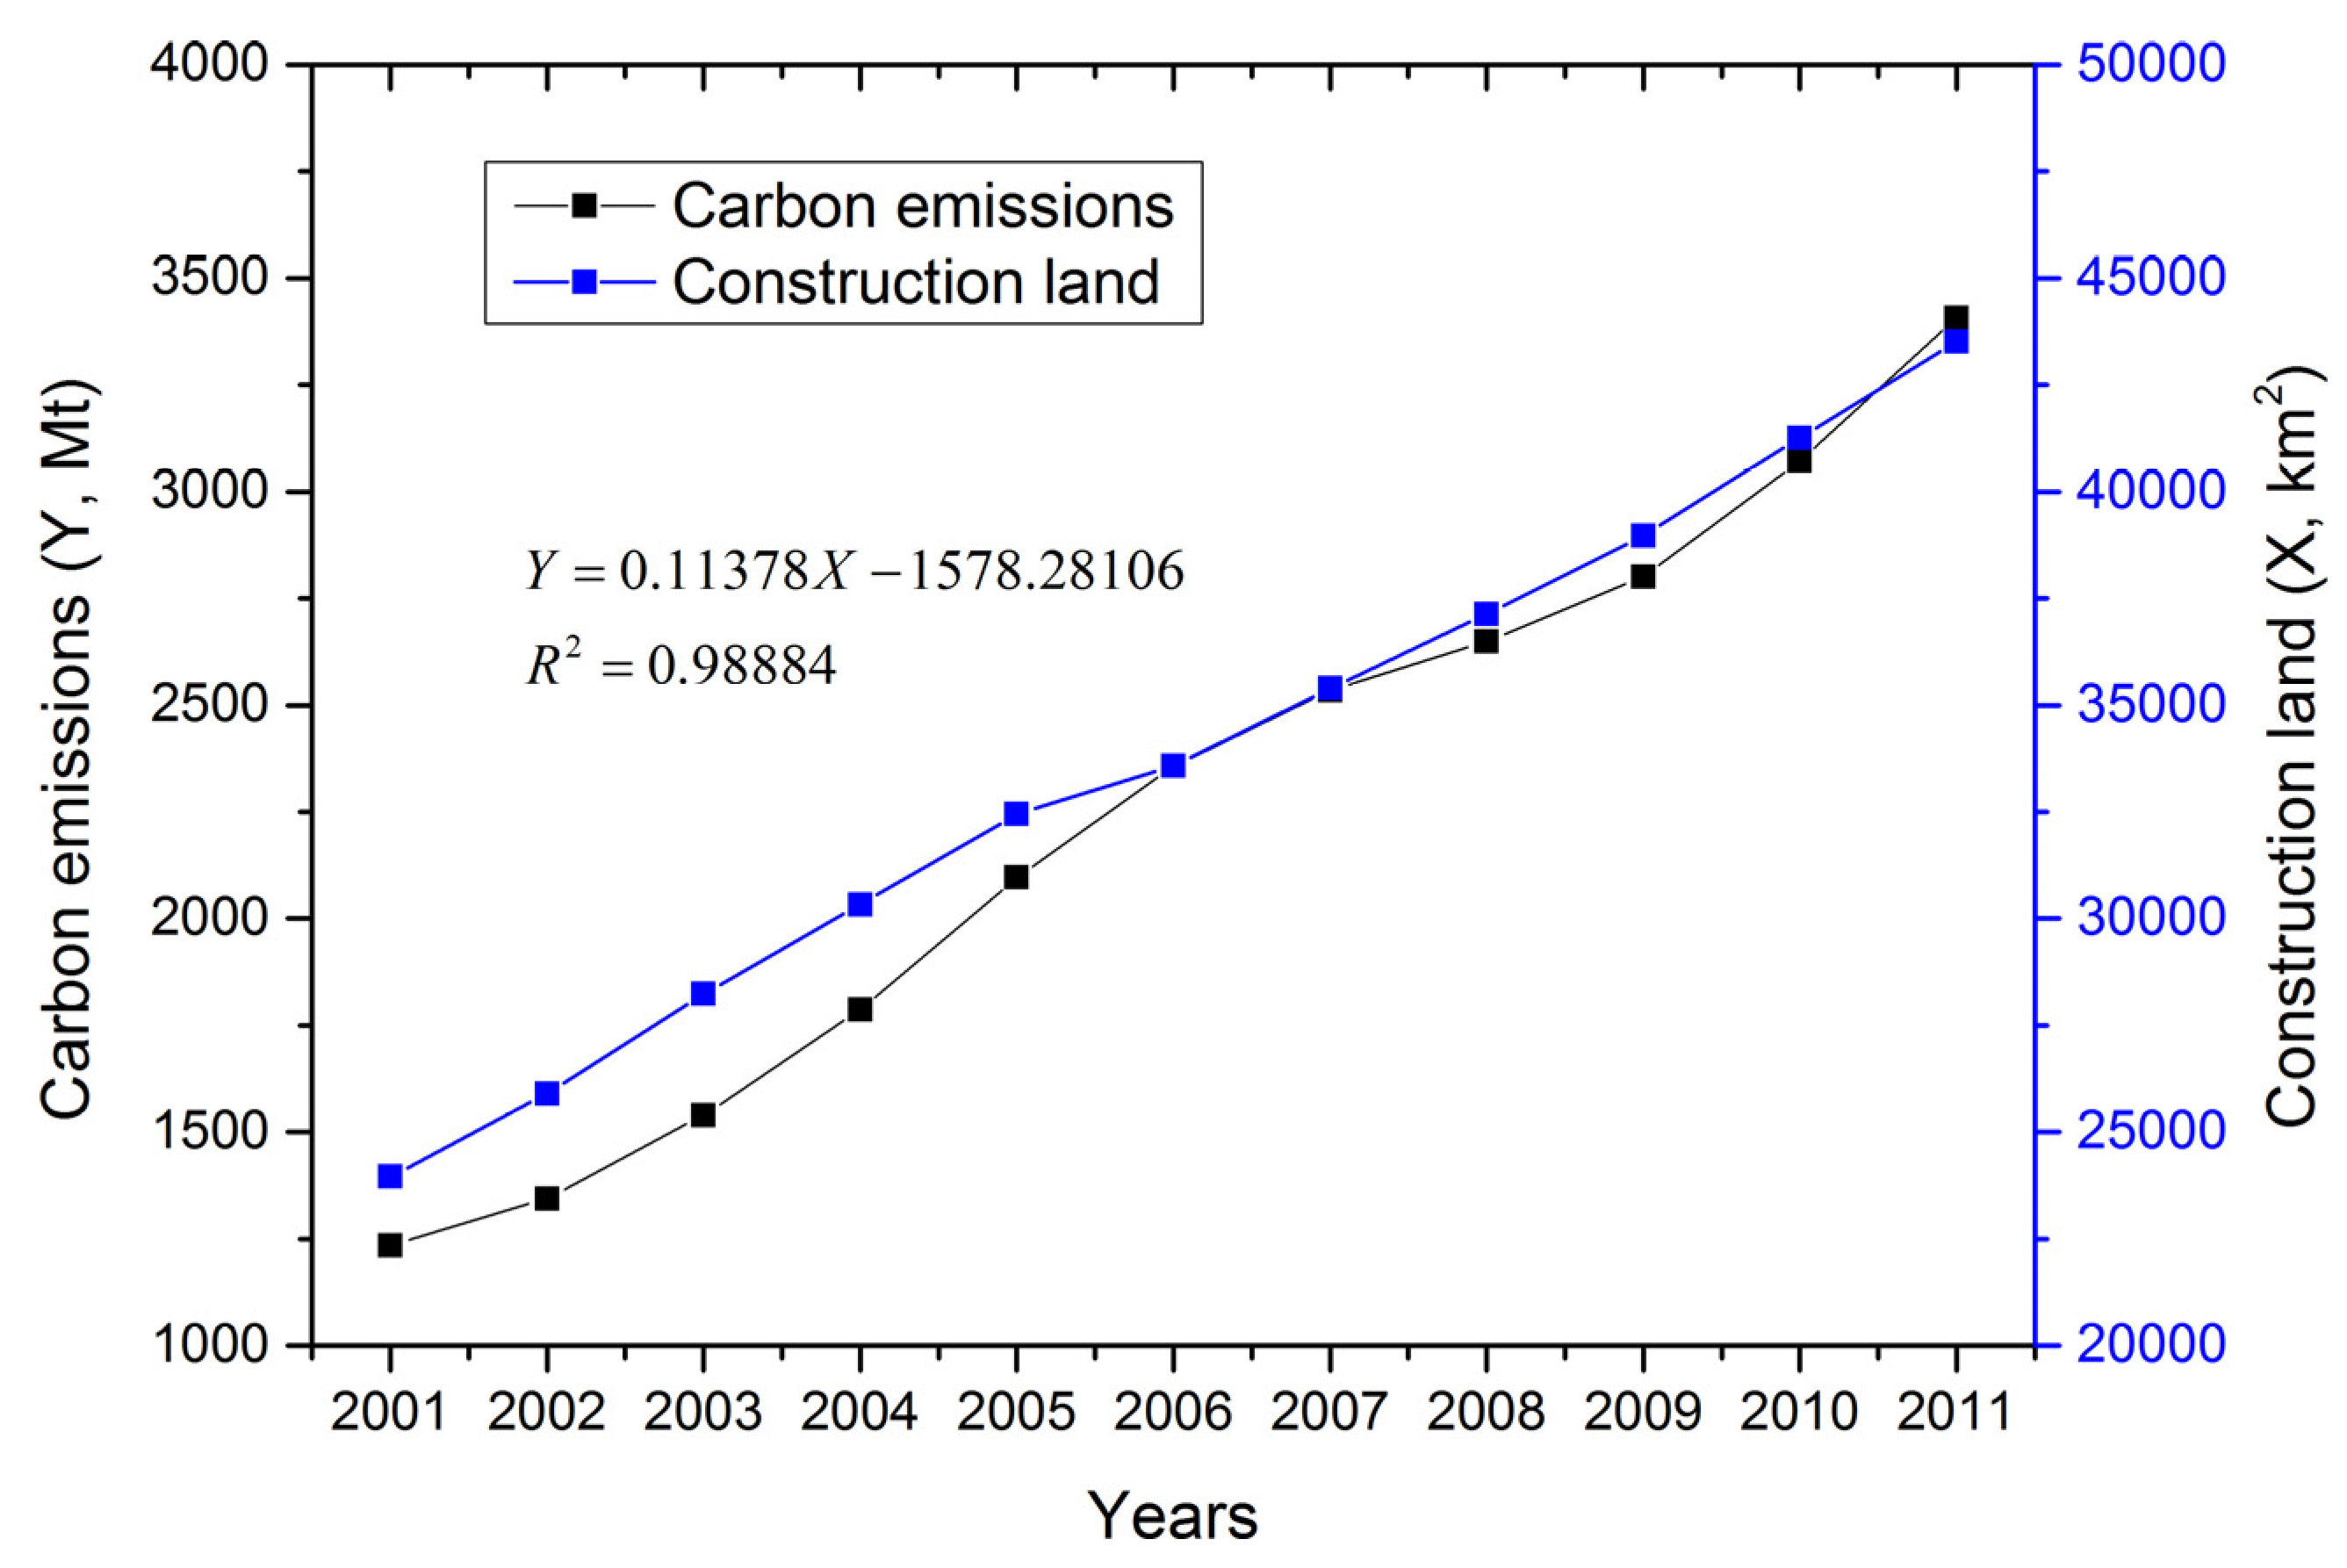
3.1. Analysis of Change Characteristics and Correlation of Carbon Emissions and Construction Land in China

Carbon emissions in China are equal to the sum of the emissions in the internal provinces; the same principle applies to construction land area. We discuss the estimated carbon emissions of the entire country. The change characteristics and correlation of carbon emissions and construction land are shown in Figure 2. The national carbon emissions increased from 1235.05 Mt in 2001 to 3405.98 Mt in 2011, with an annual growth rate of 10.68%. The national area of construction land increased from 23,954.66 km2 in 2001 to 43,513.70 km2 in 2011, with an annual growth rate of 6.15%. As shown in Figure 2, carbon emissions and construction land area were increasing from year to year.
Figure 2. Change characteristics of carbon emissions and construction land in China.
Energies 08 05516 g002
The scatter diagram of carbon emissions and construction land area shows a strong linear correlation between carbon emissions and construction land area in the entire country, resulting in the maximum correlation coefficient of 0.9888. This finding proved that in the study period, the carbon emissions and construction land area in China were highly correlated. Construction land expansion positively affected carbon emissions in China from 2001 to 2011. The increase in energy consumption and construction land area was caused by the growing demand for rapid economic development and infrastructure construction, which resulted in intensive energy consumption and expansion of construction land. Data on results of provincial carbon emissions and construction land area from 2001 to 2011 were taken and shown in Figure 3a.
Figure 3. Change characteristics of provincial carbon emissions and construction land from 2001 to 2011. (a) Emissions and construction land area; (b) Annual growth rate.
Energies 08 05516 g003
Carbon emissions and construction land area gradually increased from 2001 to 2011 in all provinces, which is consistent with those at the national level. The order of provinces in terms of carbon emission levels changed between 2001 and 2011. In 2001, Shanxi accounted for the maximum emissions of 100.18 Mt, whereas Hainan accounted for the minimum emissions of 3.30 Mt. In 2011, Shandong accounted for the maximum emissions of 323.81 Mt, whereas, Qinghai accounted for the minimum emissions of 13.78 Mt. The order of provinces in terms of construction land area slightly changed between 2001 and 2011. In both 2001 and 2011, Guangdong and Qinghai accounted for the maximum and minimum emissions, respectively. According to the zoning rules of the study area, the north, east, and south coastal regions, as well as the middle Yellow River were the regions with high emissions. Moreover, these four regions were characterized by a large construction land area. The order of provinces in terms of carbon emissions did not precisely correspond to the order of provinces in terms of construction land area. The non-correspondence was caused by the differences in the land-use intensity among the provinces; thus, the investment on construction land was different as well. The annual growth rates of carbon emissions and construction land area were different among the provinces, as illustrated in the scatter center diagram in Figure 3b. Inner Mongolia accounted for the maximum growth rate in carbon emissions (18.52%), whereas Beijing accounted for the minimum growth rate in carbon emissions (2.34%). The growth rate of construction land area in Chongqing was the highest (12.15%), whereas that of Hubei was the minimum growth rate (2.18%). As shown in Figure 3b, 3/5 of the provinces belonged to the first and third quadrants, wherein the growth rate of carbon emissions increased at the same pace as that of the growth rate of construction land. By contrast, 2/5 of the provinces belonged to the second and fourth quadrants, wherein carbon emissions and construction land area exhibited asynchronous growth. Although both carbon emissions and construction land showed growth, the effect of construction land expansion on carbon emissions was different for each province.

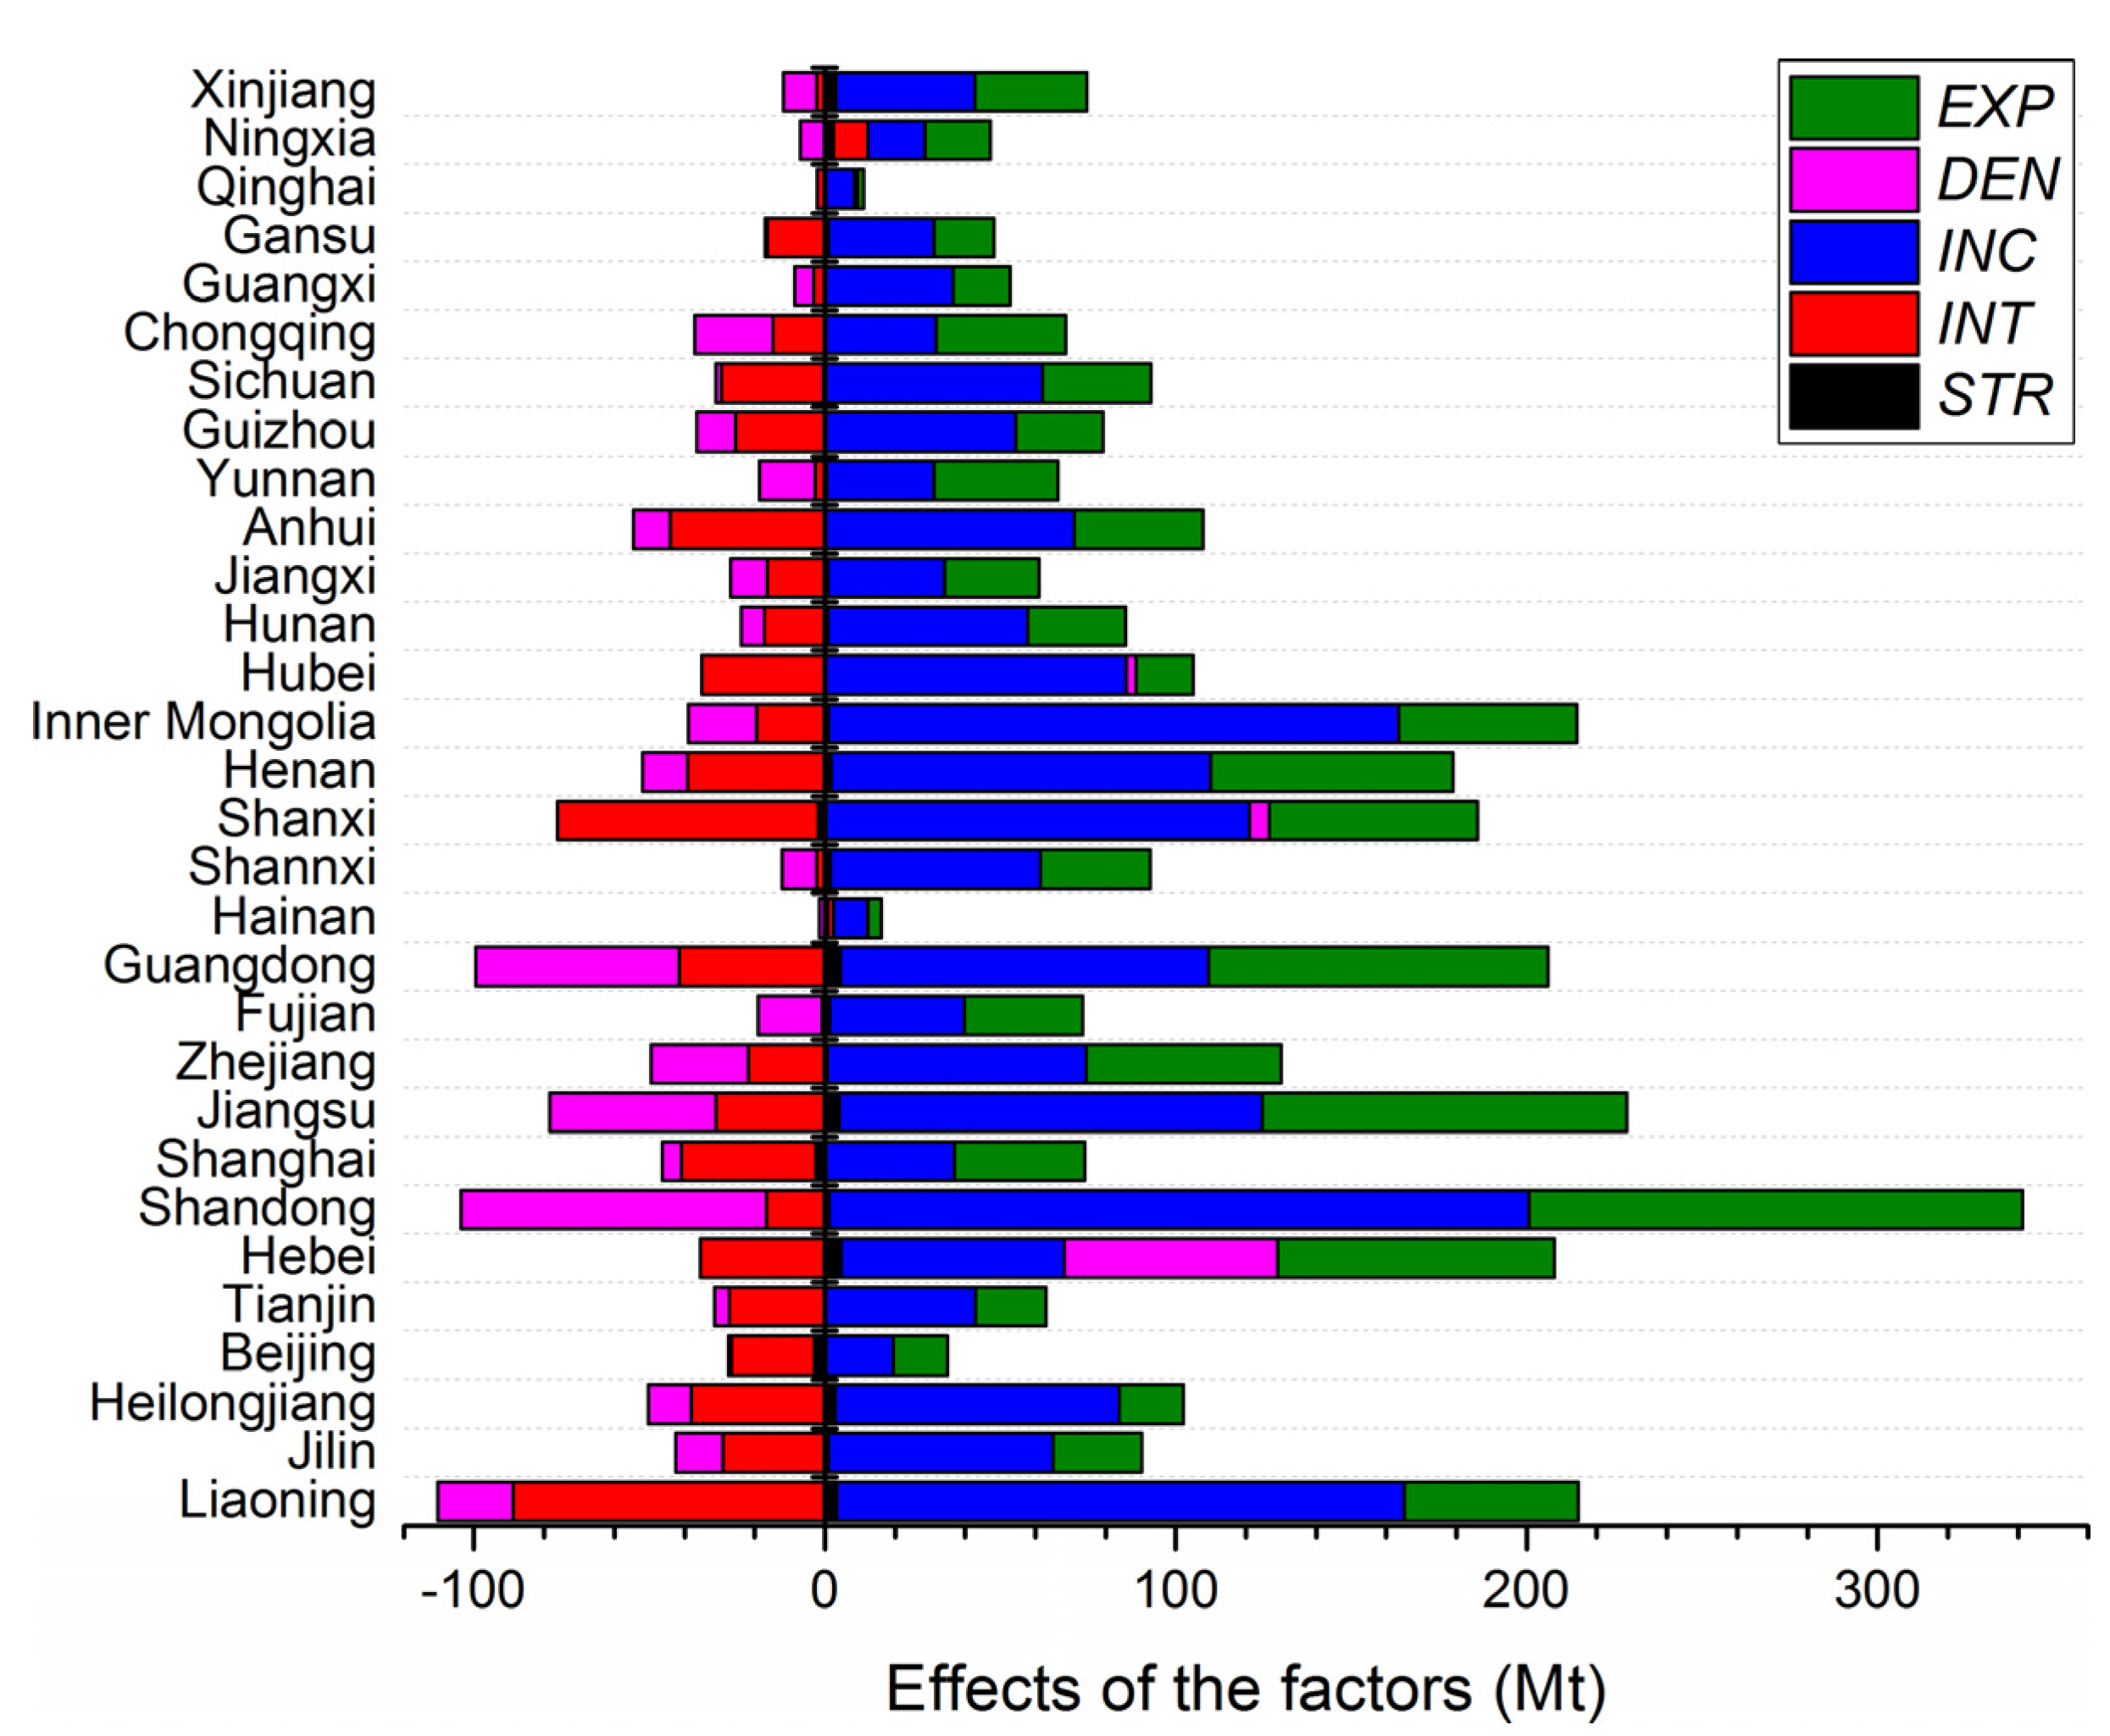
3.2. Effect of Construction Land Expansion on Carbon Emissions

In this section, we discuss the decomposed effects of the six factors on carbon emissions in China from 2001 to 2011. The effects encompassed their magnitudes and directions compared with the change in carbon emissions. Results are shown in Figure 4. STR, INC, and EXP were the positive factors for carbon emission growth whereas INT and DEN were the negative factors for carbon emissions growth. The largest positive factor was INC, and the largest negative factor was INT. The effect of INC was significantly higher than those of the other factors, confirming that “economic growth is the significant driving factor of carbon emissions change” [30]. The effects of STR and DEN were relatively weak. According to the aforementioned section of methodology, the effect of COE was zero by calculating. EXP was the second largest positive factor for carbon emissions growth. The change in carbon emissions in the entire country was 2170.93 Mt from 2001 to 2011, and the effect of EXP had a value of 1211.21 Mt. The intuitive rate of the effect of EXP on emissions change was 55.79%, and the normalized contribution rate was 27.78%. Construction land expansion exerted a strong positive effect on carbon emissions.
Figure 4. Effects of the factors on carbon emissions in China from 2001 to 2011.
Energies 08 05516 g004
Decomposition results for carbon emission change in each province from 2001 to 2011 are shown in Figure 5, which explains therein that the effects of the five factors (as the effect of COE = 0) encompassed their magnitudes and directions.
Figure 5. Effects of the factors on all of the provinces from 2001 to 2011.
Energies 08 05516 g005
As shown in Figure 5, INC had the largest positive effect in all provinces, with EXP as the second largest positive effect. The results indicated that EXP played a key role in carbon emission growth, given that the effect direction of EXP was the same in all provinces. However, the effect magnitude of EXP on carbon emissions among provinces showed huge differences. Shandong accounted for the maximum emissions of 140.61 Mt, whereas Hainan accounted for the minimum emissions of 1.86 Mt. Larger magnitudes of the effect of EXP were distributed among the north, east, and south coastal region provinces, and the middle Yellow River provinces. Areas with high emissions were found in these provinces as well. A larger magnitude of the effect of EXP corresponded to a larger magnitude of the effect of INC effect, which can be verified by the decomposition results for Shandong, Jiangsu, Guangdong, Hebei, Henan, Shanxi, Zhejiang, Inner Mongolia, and Liaoning. Moreover, the GDPs of these provinces are among the highest in China. Overall, INC had the highest normalized contribution rate among the five factors in all provinces. The normalized contribution rates of INC in most provinces were more than 50%; Inner Mongolia showed the highest rate (64.20%), whereas Hebei showed the lowest rate (26.11%). By contrast, the normalized contribution rates of STR and DEN were relatively low. The normalized contribution rates of STR in most provinces were not more than 5%, and that of DEN did not reach 10%. Therefore, the differences in the effects on carbon emissions among provinces were mainly caused by the factors, INC, EXP, and INT. The normalized contribution rates of EXP exhibited large differences among the 30 provinces from 2001 to 2011. Yunnan showed the highest normalized contribution rate (41.65%), whereas Hubei demonstrated the lowest rate (11.71%). In Xinjiang, Fujian, and Chongqing, the normalized contribution rates were higher than 35%, followed by Shannxi, Henan, Jiangxi, and Shanghai, where the rates were approximately 30%. By contrast, the normalized contribution rates in Hubei, Heilongjiang, and Qinghai were lower than 15%. The resulting normalized contribution rate in all of the provinces showed that EXP significantly affected carbon emissions. We used Jenks natural breaks optimization to divide the normalized contribution rates of EXP in the 30 provinces from 2001 to 2011 into three groups (high, medium, and low), as shown in Figure 6.
Figure 6. Distribution of normalized contribution rates from 2001 to 2011.
Energies 08 05516 g006
Jenks natural breaks optimization is a natural classification method; its principle is the realization of the minimum variance in groups and the largest variance between groups, which is a common method for hierarchical mapping in geographic information systems [77]. The north, east, and south coastal regions, as well as the middle Yellow River region exhibited a higher normalized contribution rate than the other regions and had a concentrated distribution. Other provinces that had high normalized contribution rates were scattered in other regions (i.e., Yunnan and Chongqing in the Southwest region, as well as Jiangxi, Ningxia, and Xinjiang). Therefore, the distribution of the normalized contribution of construction land expansion on carbon emissions exhibited a circular structure. Relatively high-value provinces in the normalized contribution rates, which formed the external portion of the circle, were concentrated in the north, east, and south coasts, as well as in Yunnan and Xinxiang.
In terms of the actual developments in China, after the reform and opening up to the outside world, the coastal regions gained advantages in transportation cost, information circulation, and other conditions over the central and west inland regions because of the closely interrelated developed economic area of the coastal regions. Hence, the coastal regions were the first to achieve rapid development. The urgent need for development space was caused by the rapid development of industry and the concentration of population. Coastal provinces, especially Shanghai, Jiangsu, Zhejiang, Shandong, Guangdong, and Fujian, transformed a large number of agricultural lands into construction land, a situation that will continue for some time at least. Moreover, the differences in topography, rainfall, sunlight, soil, and other factors form non-balanced geographical conditions. In the coastal regions, the terrain is relatively flat, and water and heat are sufficient. The northwest region is lacking in water, and the southwest region is lacking in flat terrain. Being rational as they are, people generally choose to live and produce in regions with flat terrains, abundant water, and convenient traffic conditions, rather than in regions of rugged topography, serious soil erosion, and drought. Hence, given its high suitability to development, eastern China (especially the coastal regions) has become the first choice for habitation and production. These reasons created the regional differences in construction land expansion, subsequently affecting energy-related carbon emissions.
The study was divided into two intervals (2001–2001 and 2006–2011) to analyze the temporal and spatial variations in the normalized contribution rate of EXP. Temporal and spatial variations of the normalized contribution rate are shown in Figure 7. The normalized contribution rates of the entire country in these two intervals were 33.61% and 24.26%, respectively. The effect of EXP on carbon emissions decreased at the national level. As shown in Figure 7, the normalized contribution rates in most provinces decreased between the two intervals. Among the 30 provinces, Beijing and Hebei showed the largest decrease in the normalized contribution rate (more than 20%). However, the normalized contribution rates in 10 provinces increased between the two intervals; Hubei exhibited the highest increase of more than 10%, whereas other provinces showed an increase of roughly 5%. Nonetheless, the decrease was larger than the increase among the provinces; thus, the normalized contribution rate decreased at the national level. In the calculation process, we found that the normalized contribution rate in Hubei showed a negative value from 2001 to 2006. Beijing also exhibited a negative value from 2006 to 2011. From 2001 to 2006, the normalized contribution rates in the north coast, east coast, south coast, Henan, Jiangxi, Chongqing, Yunnan, Ningxia, and Xinjiang were relatively high, whereas the normalized contribution rates in Liaoning, Heilongjiang, Inner Mongolia, Shanxi, Anhui, Hubei, and Qinghai were relatively low. From 2006 to 2011, the east and south coast regions also demonstrated relatively high normalized contribution rates. Chongqing, Yunnan, Ningxia, and Xinjiang showed relatively high normalized contribution rates from 2006 to 2011. In terms of the spatial variations between the two intervals, the north coast decreased to the medium level of the normalized contribution rate. Moreover, the spatial variations of some provinces that were in the high-rate group in the 2001–2006 interval decreased to the medium level in the 2006–2011 interval (i.e., Henan and Jiangxi). From the common distribution features of the normalized contribution rates in both intervals, the distribution of the normalized contribution rates was higher in the coastal regions (north, east, and south coast) than in the inland regions (Northeast, middle Yellow River, middle Yangtze River, Southwest and Northwest) regions. In terms of the temporal variations, the normalized contribution rate in coastal regions tended to decrease, whereas that in the inland regions increased from interval 2001–2006 to 2006–2011. As industry development was restricted by the growing cost in the coastal regions, the industrial structures were optimized according to the advanced development and rationalization. The primary industry was transferred to other regions, which could promote the growth of construction land in the central and west inland regions. For this reason, the effect of EXP on carbon emissions in inland regions was relatively pronounced in the second interval.
Figure 7. Distribution of the normalized contribution rates in the two intervals. (a) 2001–2006; (b) 2006–2011.
Energies 08 05516 g007

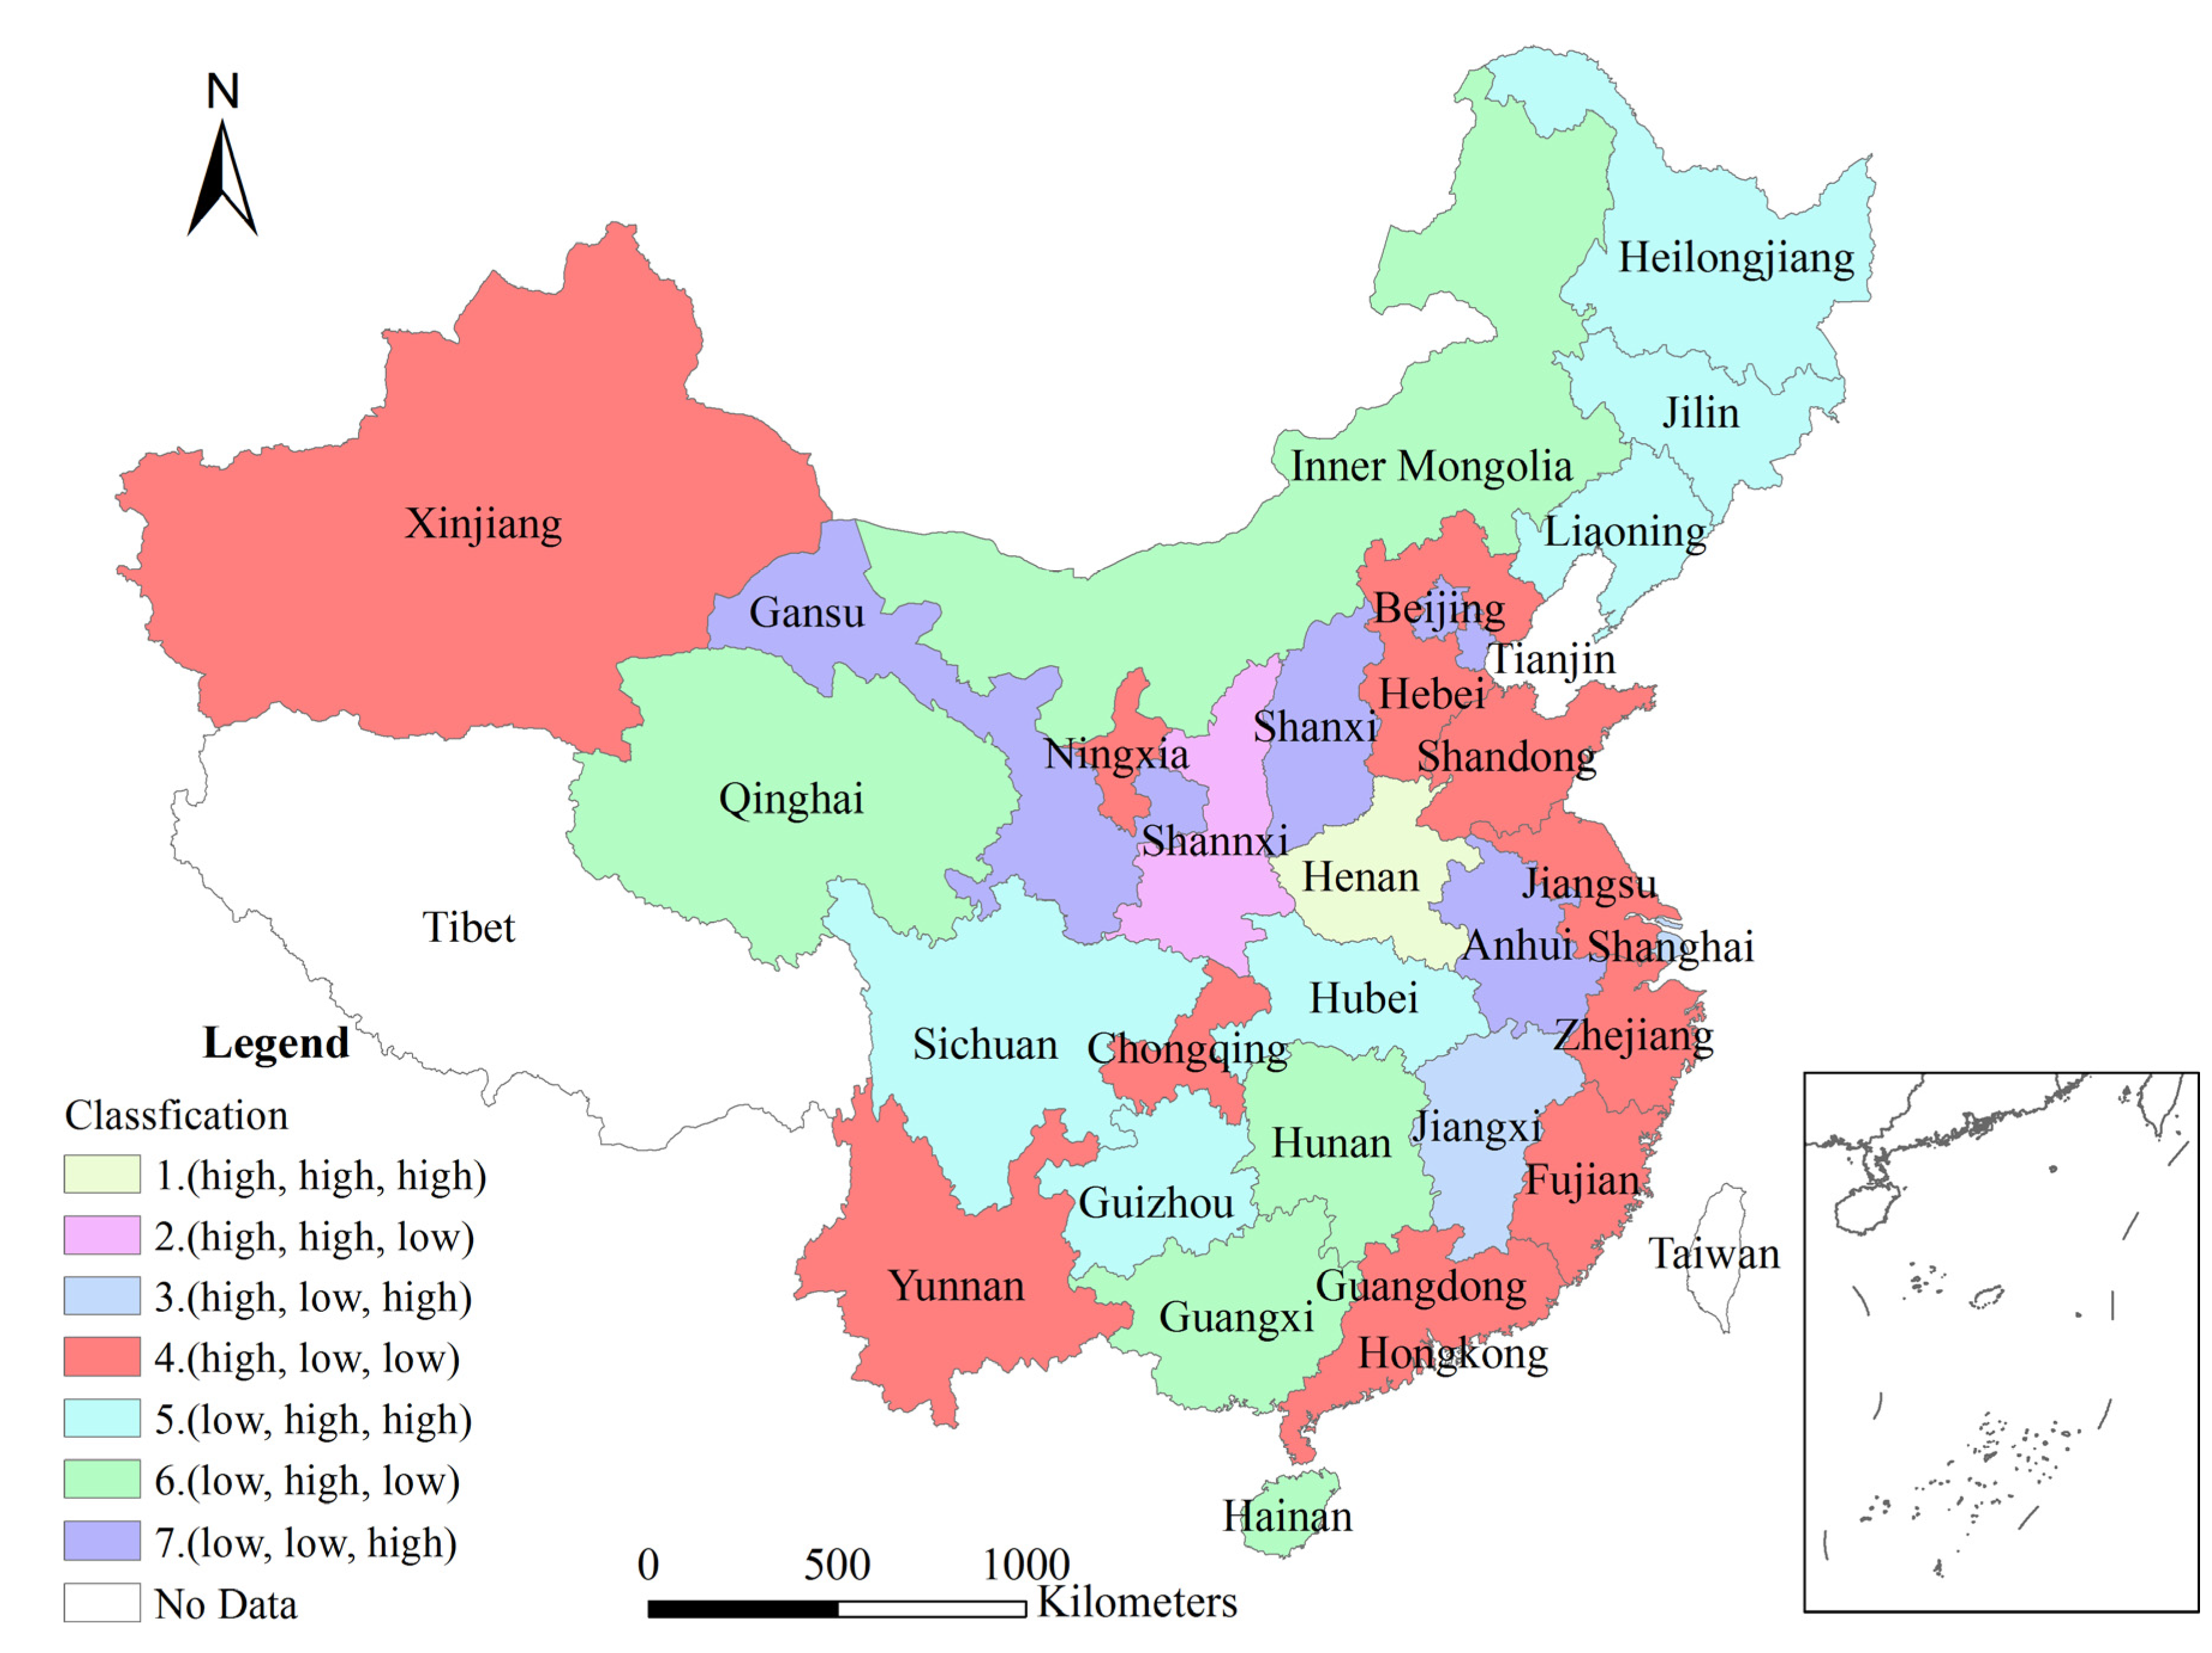
3.3. Carbon Reduction by Controlling Construction Land Expansion

Construction land expansion positively influenced the growth of energy-related carbon emissions; thus, controlling construction land expansion is an effective means of conserving energy and reducing carbon emissions. The most appropriate provinces in terms of carbon emission reduction should be selected by controlling EXP. With regard to the effects of the major factors, we focused on EXP, INC, and INT, which had the strongest effects on carbon emissions as indicated in the preceding sections. The provinces were divided into high and low groups on the basis of the normalized contribution rate of the entire country from 2001 to 2011. We divided the provinces according to their respective normalized contribution rates of EXP, INC, and INT. Provinces with a normalized contribution rate higher than the national level were classified into the high group, whereas those with rates below the national level were classified into the low group. For each factor of these high and low groups, EXP, INC, and INT, were integrated to form eight composite groups (Table 2).
Table 2. Classification of provinces based on the normalized contribution rates of EXP, INC, and INT from 2001 to 2011.
Composite Group No.Classification RuleProvinces
1(high, high, high)Henan
2(high, high, low)Shannxi
3(high, low, high)Shanghai, Jiangxi
4(high, low, low)Hebei, Shandong, Jiangsu, Zhejiang, Fujian, Guangdong, Yunnan, Chongqing, Ningxia, Xinjiang
5(low, high, high)Liaoning, Jilin, Heilongjiang, Hubei, Guizhou, Sichuan
6(low, high, low)Hainan, Inner Mongolia, Hunan, Guangxi, Qinghai
7(low, low, high)Beijing, Tianjin, Shanxi, Anhui, Gansu
8(low, low, low)-
In the first four composite groups, the effect of EXP on carbon emissions was high; thus, the provinces in these groups should be selected for the reduction of carbon emissions by controlling EXP. INT, which was the strongest negative factor for carbon emission growth, was low in the second and fourth groups. Therefore, the provinces in these groups were selected. INC, which was the strongest positive factor for carbon emission growth, was low in the fourth group. EXP in the provinces of this group was the most important factor for carbon emission growth. Among all the provinces, Hebei, Shandong, Jiangsu, Zhejiang, Fujian, Guangdong, Yunnan, Chongqing, Ningxia, and Xinjiang were the provinces most appropriate for the reduction of carbon emissions by controlling EXP. The distribution of provinces among the different composite groups is shown in Figure 8. The distribution of the fourth group is concentrated in the north, east, and south coastal regions.
Figure 8. Distribution of provinces among different composite groups.
Energies 08 05516 g008

4. Conclusions and Policy Implications

In this paper, the IPCC estimation method for carbon emission was used to measure the energy-related carbon emissions. Based on demonstration of the relationship between construction land and carbon emissions, we introduced the factor of construction land expansion into the Kaya identity and used the LMDI method to analyze the effect of construction land expansion on energy-related carbon emissions in China and in its 30 provinces from 2001 to 2011. On the basis of the decomposition results and spatio-temporal variations, we analyzed the effect of construction land expansion on carbon emissions and suggested the most appropriate provinces for the reduction of carbon emissions by controlling construction land expansion. The following conclusions were achieved.
Given the growing demand of infrastructure construction and economic development, energy-related carbon emissions and construction land area increased in the whole study period both in China and its provinces, and construction land expansion therein was pronounced. A strong positive linear correlation was found between the energy-related carbon emissions and construction land area in China. However, the growth rates of carbon emissions and construction land area in the provinces were inconsistent. The proximate reason for this inconsistency was the different in level of investment on construction land among the 30 provinces. In addition to the income factor, construction land expansion had the second largest positive effect on carbon emission growth of China as well as each of the 30 provinces during the study period. Energy intensity factor had the strongest negative effect on carbon emission growth. The normalized contribution rate of the effect of construction land expansion on carbon emission growth was 27.78% at the national level from 2001 to 2011. Moreover, the effect of construction land expansion on carbon emissions exhibited large differences among the 30 provinces. The north, east, and south coastal regions, as well as the middle Yellow River region showed large-magnitude effects from 2001 to 2011. The normalized contribution rates of construction land expansion in the study period ranged from 11.71% to 41.65%, indicating a strong effect of construction land expansion on carbon emissions in the 30 provinces in the same period. The higher normalized contribution rates among the provinces were concentrated in the distribution on the north, east, and south coastal regions and some provinces in the other regions. The reason for the regional differences in the effect of construction land expansion on carbon emissions was the difference in economic, geographic location and natural conditions. The national normalized contribution rate of the effect of construction land expansion decreased between the two intervals (2001–2006 and 2006–2011). The effect of construction land expansion on energy-related carbon emissions decreased at the national level. The normalized contribution rate in most provinces also decreased between the two intervals. A variation emerged between the two intervals, characterized by the decrease in the normalized contribution rate in the coastal regions and the increase in the rate in the inland regions. Thus, the effect of construction land expansion on carbon emissions in the coastal regions decreased but increased in the inland regions between the two intervals. The reason for this variation was the transfer of the primary industry from the coastal regions to the inland regions, which could have promoted the growth of construction land. We classified provinces by combining the effects of three major factors. Moreover, we selected Hebei, Shandong, Jiangsu, Zhejiang, Fujian, Guangdong, Yunnan, Chongqing, Ningxia, and Xinjiang as provinces suited for the reduction of carbon emissions by controlling construction land expansion. These provinces are concentrated in the north, east, and south coastal regions.
Controlling construction land expansion is one of the effective means to reduce carbon emissions. Such an approach prevents the use of other types of land with carbon sequestration capacity. Moreover, this approach can avoid unnecessary production and construction activities. Therefore, we recommend the strict control of the use of agricultural land for construction land expansion and the reasonable planning of urban development. Based on the results of the decomposition analysis, energy intensity is the most useful in impeding carbon emission growth among the factors considered. Thus, the continuous improvement of the output of energy consumption per unit is recommended because it is the most effective way to control energy-related carbon emissions. The effects of controlling construction land expansion to impede carbon emission growth were different among regions. Therefore, carbon reduction policy makers should consider regional differences and maximize the control of construction land expansion to reduce carbon emissions effectively. Industrial structures have a significant influence on the energy intensity of construction land. The secondary industrial land use (industry and mining land) consumes a larger amount of energy compared with the tertiary industrial land use. Therefore, we recommend that local governments intensify industrial restructuring efforts and strive to develop tertiary industries as part of their energy-saving and emission-reduction plans. The effects of structure and spatial distribution in land-use and land-cover change on carbon emissions could be the subject of further study to achieve the objectives of obtaining more accurate data on land use and energy consumption, determining the effect of construction land expansion in a long time sequence, and providing a reference for land-use planning in the context of climate change.

Acknowledgments

This work is supported in part by Special Fund for Surveying & Mapping and Geoinformation Research in the Public Interest (Grant NO. 201412023), National Administration of Surveying, Mapping and Geoinformation of China.

Author Contributions

Xuankai Deng drafted the paper and contributed to data collection and calculation; Yanhua Yu contributed to data analysis; Yanfang Liu conceived and designed the research.

Conflicts of Interest

The authors declare no conflict of interests.

References

  1. Houghton, R.A.; Boone, R.D.; Fruci, J.R.; Hobbie, J.E.; Melillo, J.M.; Palm, C.A.; Peterson, B.J.; Shaver, G.R.; Woodwell, G.M.; Moore, B.; et al. The flux of carbon from terrestrial ecosystems to the atmosphere in 1980 due to changes in land use: Geographic distribution of the global flux. Tellus B 1987, 39, 122–139. [Google Scholar] [CrossRef]
  2. Ge, Q.; Dai, J.; He, F.; Pan, Y.; Wang, M. Land use changes and their relations with carbon cycles over the past 300 a in China. Sci. China Ser. D Earth Sci. 2008, 51, 871–884. [Google Scholar] [CrossRef]
  3. Houghton, R.A. The annual net flux of carbon to the atmosphere from changes in land use 1850–1990. Tellus B 1999, 51, 298–313. [Google Scholar] [CrossRef]
  4. Pachauri, R.K.; Reisinger, A. Climate Change 2007 Synthesis Report: Summary for Policymakers; IPCC Secretariat: Geneva, Switzerland, 2007. [Google Scholar]
  5. Caspersen, J.P. Contributions of land-use history to carbon accumulation in U.S. forests. Science 2000, 290, 1148–1151. [Google Scholar] [CrossRef] [PubMed]
  6. Gu, C.; Tan, Z.; Liu, W.; Yu, T.; Han, Q.; Liu, H.; Dai, Y.; Liu, Z.; Zheng, S. A Study on Climate Change, Carbon Emissions and Low-carbon City Planning. Urban Plan. Forum 2009, 5, 38–45. [Google Scholar]
  7. Han, Z.; Meng, Y.; Liu, L.; Liu, N.; Zhou, Z. Modified method of energy carbon footprint and application based on regional land use change. Trans. Chin. Soc. Agric. Eng. 2012, 28, 190–195. (In Chinese) [Google Scholar]
  8. Zhao, R.; Huang, X. Carbon emission and carbon footprint of different land use types based on energy consumption of Jiangsu Province. Geogr. Res. 2010, 29, 1639–1649. (In Chinese) [Google Scholar]
  9. Ali, G.; Nitivattananon, V. Exercising multidisciplinary approach to assess interrelationship between energy use, carbon emission and land use change in a metropolitan city of Pakistan. Renew. Sustain. Energy Rev. 2012, 16, 775–786. [Google Scholar] [CrossRef]
  10. Houghton, R.A. The U.S. Carbon Budget: Contributions from land-use change. Science 1999, 285, 574–578. [Google Scholar] [CrossRef] [PubMed]
  11. Cao, M.; Prince, S.D.; Small, J.; Goetz, S.J. Remotely sensed interannual variations and trends in terrestrial net primary productivity 1981–2000. Ecosystems 2004, 7, 233–242. [Google Scholar] [CrossRef]
  12. Ardö, J.; Olsson, L. Assessment of soil organic carbon in semi-arid Sudan using GIS and the CENTURY model. J. Arid Environ. 2003, 54, 633–651. [Google Scholar] [CrossRef]
  13. Zhang, L.; Yu, D.; Shi, X.; Weindorf, D.C.; Zhao, L.; Ding, W.; Wang, H.; Pan, J.; Li, C. Simulation of global warming potential (GWP) from rice fields in the Tai-Lake region, China by coupling 1:50,000 soil database with DNDC model. Atmos. Environ. 2009, 43, 2737–2746. [Google Scholar] [CrossRef]
  14. Giltrap, D.L.; Li, C.; Saggar, S. DNDC: A process-based model of greenhouse gas fluxes from agricultural soils. Agric. Ecosyst. Environ. 2010, 136, 292–300. [Google Scholar] [CrossRef]
  15. Weidema, B.P.; Thrane, M.; Christensen, P.; Schmidt, J.; Løkke, S. Carbon footprint. J. Ind. Ecol. 2008, 12, 3–6. [Google Scholar] [CrossRef]
  16. Fang, K.; Shen, W.; Dong, D. Modification and prediction of energy ecological footprint: A case study of Jilin Province. Geogr. Res. 2011, 30, 1835–1846. (In Chinese) [Google Scholar]
  17. Zhao, R.; Huang, X.; Zhong, T. Research on carbon emission intensity and carbon footprint of different industrial spaces in China. Acta Geogr. Sin. 2010, 65, 1048–1057. (In Chinese) [Google Scholar]
  18. Zhang, R.; Pu, L.; Wen, J.; Xu, Y. Hypothesis and validation on the Kuznets curve of construction land expansion and carbon emission effect. J. Nat. Res. 2012, 27, 723–733. (In Chinese) [Google Scholar]
  19. Geng, Y.; Tian, M.; Zhu, Q.; Zhang, J.; Peng, C. Quantification of provincial-level carbon emissions from energy consumption in China. Renew. Sustain. Energy Rev. 2011, 15, 3658–3668. [Google Scholar] [CrossRef]
  20. Xu, X.Y.; Ang, B.W. Index decomposition analysis applied to CO2 emission studies. Ecol. Econ. 2013, 93, 313–329. [Google Scholar] [CrossRef]
  21. Steenhof, P.A.; Weber, C.J. An assessment of factors impacting Canada’s electricity sector’s GHG emissions. Energy Policy 2011, 39, 4089–4096. [Google Scholar] [CrossRef]
  22. Tol, R.S.J.; Pacala, S.W.; Socolow, R.H. Understanding Long-Term Energy Use and Carbon Dioxide Emissions in the USA. J. Policy Model. 2009, 31, 425–445. [Google Scholar] [CrossRef]
  23. Fan, Y.; Liu, L.; Wu, G.; Tsai, H.; Wei, Y. Changes in carbon intensity in China: Empirical findings from 1980–2003. Ecol. Econ. 2007, 62, 683–691. [Google Scholar] [CrossRef]
  24. Kumbaroğlu, G. A sectoral decomposition analysis of Turkish CO2 emissions over 1990–2007. Energy 2011, 36, 2419–2433. [Google Scholar] [CrossRef]
  25. Zhang, M.; Liu, X.; Wang, W.; Zhou, M. Decomposition analysis of CO2 emissions from electricity generation in China. Energy Policy 2013, 52, 159–165. [Google Scholar] [CrossRef]
  26. Ang, B.W.; Huang, H.C.; Mu, A.R. Properties and linkages of some index decomposition analysis methods. Energy Policy 2009, 37, 4624–4632. [Google Scholar] [CrossRef]
  27. Wang, W.W.; Zhang, M.; Zhou, M. Using LMDI method to analyze transport sector CO2 emissions in China. Energy 2011, 36, 5909–5915. [Google Scholar] [CrossRef]
  28. Liu, Z.; Geng, Y.; Lindner, S.; Guan, D. Uncovering China’s greenhouse gas emission from regional and sectoral perspectives. Energy 2012, 45, 1059–1068. [Google Scholar] [CrossRef]
  29. Tan, Z.; Li, L.; Wang, J.; Wang, J. Examining the driving forces for improving China’s CO2 emission intensity using the decomposing method. Appl. Energ. 2011, 88, 4496–4504. [Google Scholar] [CrossRef]
  30. Zhang, M.; Mu, H.; Ning, Y.; Song, Y. Decomposition of energy-related CO2 emission over 1991–2006 in China. Ecol. Econ. 2009, 68, 2122–2128. [Google Scholar] [CrossRef]
  31. Liu, L.; Fan, Y.; Wu, G.; Wei, Y. Using LMDI method to analyze the change of China’s industrial CO2 emissions from final fuel use: An empirical analysis. Energy Policy 2007, 35, 5892–5900. [Google Scholar] [CrossRef]
  32. Liu, Z.; Liang, S.; Geng, Y.; Xue, B.; Xi, F.; Pan, Y.; Zhang, T.; Fujita, T. Features, trajectories and driving forces for energy-related GHG emissions from Chinese mega cites: The case of Beijing, Tianjin, Shanghai and Chongqing. Energy 2012, 37, 245–254. [Google Scholar] [CrossRef]
  33. Donglan, Z.; Dequn, Z.; Peng, Z. Driving forces of residential CO2 emissions in urban and rural China: An index decomposition analysis. Energy Policy 2010, 38, 3377–3383. [Google Scholar] [CrossRef]
  34. Yang, Q.Y. Land use changes and the carbon cycling. China Land Sci. 2010, 24, 7–12. (In Chinese) [Google Scholar]
  35. Du, G. Research on influences of construction land on carbon emission. China Land Sci. 2010, 24, 32–36. (In Chinese) [Google Scholar]
  36. Su, Y.L.; Zhang, Y.F. Study on effects of carbon emission by land use patterns of Shannxi Province. J. Soil Water Conserv. 2011, 25, 152–156. (In Chinese) [Google Scholar]
  37. Shan, F.Z.; Yu, J.; Zhao, J.; Qian, G.R. Land use change in the suburb area and its impacts on carbon emissions in the process of industrialization: A case study of Zhangjiang Hi-tech Park, Shanghai. Resour. Sci. 2011, 33, 1600–1607. (In Chinese) [Google Scholar]
  38. Mao, X.; Lin, J.; Meng, J. Effects of construction land expansion on carbon dioxide emissions in China. China Popul. Resour. Environ. 2011, 21, 34–40. (In Chinese) [Google Scholar]
  39. You, H.; Wu, C.; Shen, P. Correlation degree measurement and characteristic explanation between land use structure and carbon emission from energy consumption. China Land Sci. 2010, 24, 4–9. (In Chinese) [Google Scholar]
  40. Zhang, L.; Chen, S.; Wang, W.; Xu, X. Measurement and trend analysis of carbon emissions from construction land changes in Anhui in the recent 15 years—Based on STIRPAT model. Acta Sci. Circumstantiae 2013, 33, 950–958. (In Chinese) [Google Scholar]
  41. Zhang, Y.; Zhang, J.; Yang, Z.; Li, S. Regional differences in the factors that influence China’s energy-related carbon emissions, and potential mitigation strategies. Energy Policy 2011, 39, 7712–7718. [Google Scholar] [CrossRef]
  42. Song, J. Factor Decomposition of carbon emissions from energy consumption of Shandong province based on LMDI. Resour. Sci. 2012, 34, 35–41. (In Chinese) [Google Scholar]
  43. Xu, S.; Xi, R.; He, F. Influential factors and policy implications of carbon emissions for energy consumption in China. Resour. Sci. 2012, 34, 2–12. (In Chinese) [Google Scholar]
  44. Shu, Y. Spatiotemporal characteristics of carbon emissions from energy consumption in China. Acta Ecol. Sin. 2012, 32, 4950–4960. (In Chinese) [Google Scholar]
  45. Baldwin, J.G.; Wing, I.S. The spatiotemporal evolution of U.S. carbon dioxide emissions: Stylized facts and implications for climate policy. J. Reg. Sci. 2013, 53, 672–689. [Google Scholar] [CrossRef]
  46. Kaya, Y. Impact of carbon dioxide emission control on GNP growth: Interpretation of proposed scenarios. In Paper Presented to the IPCC Energy and Industry Subgroup, Response Strategies Working Group, Paris, France; 1990. [Google Scholar]
  47. Wang, C.; Chen, J.; Zou, J. Decomposition of energy-related CO2 emission in China: 1957–2000. Energy 2005, 30, 73–83. [Google Scholar] [CrossRef]
  48. Ang, B.W.; Xu, X.Y.; Su, B. Multi-country comparisons of energy performance: The index decomposition analysis approach. Energy Econ. 2015, 47, 68–76. [Google Scholar] [CrossRef]
  49. Gingrich, S.; Kušková, P.; Steinberger, J.K. Long-term changes in CO2 emissions in Austria and Czechoslovakia—Identifying the drivers of environmental pressures. Energy Policy 2011, 39, 535–543. [Google Scholar] [CrossRef] [PubMed]
  50. Ang, B.W.; Liu, F.L. A new energy decomposition method: Perfect in decomposition and consistent in aggregation. Energy 2001, 26, 537–548. [Google Scholar] [CrossRef]
  51. Su, B.; Ang, B.W. Structural decomposition analysis applied to energy and emissions: Some methodological developments. Energy Econ. 2012, 34, 177–188. [Google Scholar] [CrossRef]
  52. Lei, H.; Xia, X.; Li, C.; Xi, B. Decomposition analysis of wastewater pollutant discharges in industrial sectors of China (2001–2009) using the LMDI I method. Int. J. Environ. Res. Public Health 2012, 9, 2226–2240. [Google Scholar] [CrossRef] [PubMed]
  53. Ang, B.W. The LMDI approach to decomposition analysis: a practical guide. Energy Policy 2005, 33, 867–871. [Google Scholar] [CrossRef]
  54. National Bureau of Statistics of People’s Republic of China. China Energy Statistical Yearbook 2000–2002; China Statistics Press: Beijing, China, 2004.
  55. National Bureau of Statistics of People’s Republic of China. China Energy Statistical Yearbook 2004; China Statistics Press: Beijing, China, 2005.
  56. National Bureau of Statistics of People’s Republic of China. China Energy Statistical Yearbook 2005; China Statistics Press: Beijing, China, 2006.
  57. National Bureau of Statistics of People’s Republic of China. China Energy Statistical Yearbook 2006; China Statistics Press: Beijing, China, 2007.
  58. National Bureau of Statistics of People’s Republic of China. China Energy Statistical Yearbook 2007; China Statistics Press: Beijing, China, 2008.
  59. National Bureau of Statistics of People’s Republic of China. China Energy Statistical Yearbook 2008; China Statistics Press: Beijing, China, 2009.
  60. National Bureau of Statistics of People’s Republic of China. China Energy Statistical Yearbook 2009; China Statistics Press: Beijing, China, 2010.
  61. National Bureau of Statistics of People’s Republic of China. China Energy Statistical Yearbook 2010; China Statistics Press: Beijing, China, 2011.
  62. National Bureau of Statistics of People’s Republic of China. China Energy Statistical Yearbook 2011; China Statistics Press: Beijing, China, 2012.
  63. National Bureau of Statistics of People’s Republic of China. China Statistical Yearbook 2002; China Statistics Press: Beijing, China, 2002.
  64. National Bureau of Statistics of People’s Republic of China. China Statistical Yearbook 2003; China Statistics Press: Beijing, China, 2003.
  65. National Bureau of Statistics of People’s Republic of China. China Statistical Yearbook 2004; China Statistics Press: Beijing, China, 2004.
  66. National Bureau of Statistics of People’s Republic of China. China Statistical Yearbook 2005; China Statistics Press: Beijing, China, 2005.
  67. National Bureau of Statistics of People’s Republic of China. China Statistical Yearbook 2006; China Statistics Press: Beijing, China, 2006.
  68. National Bureau of Statistics of People’s Republic of China. China Statistical Yearbook 2007; China Statistics Press: Beijing, China, 2007.
  69. National Bureau of Statistics of People’s Republic of China. China Statistical Yearbook 2008; China Statistics Press: Beijing, China, 2008.
  70. National Bureau of Statistics of People’s Republic of China. China Statistical Yearbook 2009; China Statistics Press: Beijing, China, 2009.
  71. National Bureau of Statistics of People’s Republic of China. China Statistical Yearbook 2010; China Statistics Press: Beijing, China, 2010.
  72. National Bureau of Statistics of People’s Republic of China. China Statistical Yearbook 2011; China Statistics Press: Beijing, China, 2011.
  73. National Bureau of Statistics of People’s Republic of China. China Statistical Yearbook 2012; China Statistics Press: Beijing, China, 2012.
  74. Ang, B.W.; Liu, N. Handling zero values in the logarithmic mean Divisia index decomposition approach. Energy Policy 2007, 35, 238–246. [Google Scholar] [CrossRef]
  75. Wood, R.; Lenzen, M. Zero-value problems of the logarithmic mean Divisia index decomposition method. Energy Policy 2006, 34, 1326–1331. [Google Scholar] [CrossRef]
  76. Ang, B.W. Decomposition analysis for policymaking in energy: Which is the preferred method? Energy Policy 2004, 32, 1131–1139. [Google Scholar] [CrossRef]
  77. Jenks, G.F. Optimal Data Classification for Choropleth Maps; Department of Geography, University Of Kansas: Lawrence, KS, USA, 1977. [Google Scholar]

