1. Introduction
The rapid development of a global economy and an increase in population and living standards has imposed a great burden on energy resources and the environment. Interest in renewable energy sources has gained momentum in the past decades due to the reduction of fossil fuel reserves and rising concern about carbon emissions. Biomass, in particular, is an important renewable energy source because it is readily available and can reduce carbon emissions. Extensive research has been conducted to develop crop residues and energy crops to meet the rapidly increasing demand for liquid biofuels. China is one of the largest energy consumers in the world and intends to blend 10 million metric tons of bioethanol annually by 2020 [
1]. In China, large quantities (
i.e., 774 million metric tons) of agricultural residues are available with a potential energy production of 14.7 EJ [
2]. Corn stover is the most abundant agricultural residue in China and could be a potential feedstock for bioethanol production. Additionally, China has 100 million hectares of marginal land that could be suitable for cultivation of energy crops such as sweet sorghum stalks [
1]. The Chinese government is currently researching the development and utilization of biomass to meet growing energy needs [
2,
3]. In the current system, biomass, such as corn stover and sweet sorghum stalks, is used inefficiently in China because it is geographically dispersed with low energy density. The main barrier to using biomass as a source of biofuel or biopower is a logistical challenge rather than a technology one [
4]. The main reason for unfavorable economics is the high logistics cost, which includes harvesting, baling, collecting, and transportation.
Compared to the US, China faces very different challenges to implementing biomass as an energy source. For example, labor rates and fuel prices are drastically different in the two countries. Additionally, China has not developed the highly networked, high-volume biomass logistics systems and infrastructure that the US utilizes. Moreover, the biomass logistics system in China is less mechanized. This paper models the current supply chain of corn stover and sweet sorghum stalks in China and quantifies the logistics cost of delivering this biomass. The model of the Chinese feedstock supply chain was developed using Idaho National Laboratory’s (INL’s) Biomass Logistics Model (BLM) framework [
5] and is referred to as BLM Sino-Feedstock Supply (FS). The BLM Sino-FS is adapted from the BLM by incorporating commonly used Chinese equipment, agricultural methods, and data to analyze biomass logistics from the point of harvest to the conversion infeed. In a previous analysis, Xing
et al. [
6] reported that the logistics cost in China would be $30.69 per dry metric ton if biomass was collected at a rate of 5,000 tons per year up to 30 km away from the refinery. The sensitivity analysis shows that transportation cost and feedstock price play an important role in logistics cost [
6]. Yayun
et al. [
7] found that the collection, storage, and transportation of corn stover in eastern China cost from $19.52 to 58.56 per dry metric ton. Fang
et al. [
8] analyzed a wheat straw logistics model in collaboration with INL and the China Agricultural University. The results showed that the logistics cost for the wheat straw model varies between $36.11 and 48.47 per dry metric ton and that the farmer’s labor price and manual collection wage play an important role. Previous work in feedstock supply system modeling involved mathematical programming approaches, including linear programming/mixed integer programming to develop optimization models that are relevant to a variety of cases in the US [
9,
10,
11,
12,
13,
14]. Additionally, simulation models have also been developed using object-oriented programming and discrete event simulation [
15,
16,
17]. This work contributes to the existing literature by quantifying the logistics cost of biomass in China according to U.S. concepts of logistical unit operations (e.g., harvest and collection, storage, transportation, preprocessing, and handling and queuing). Moreover, this article explores the biomass logistics infrastructure differences between the US and China, and provides a relative analysis of logistics cost between the US and China. This paper aims to: (1) quantify the logistics cost of corn stover and sweet sorghum stalks in China by modeling case studies; (2) performing a sensitivity analysis; and (3) comparing the corn stover-based logistics cost variations between the US and China.
2. Methodology
2.1. Modeling China’s Biomass Supply Chain Operations
The Chinese feedstock supply chain is modeled using the INL BLM framework [
5]. The BLM was developed by INL to estimate delivered feedstock cost and energy consumed for biomass feedstock supply systems. The BLM incorporates information from a collection of databases that provide: (1) engineering performance data for hundreds of equipment systems; (2) spatially explicit labor cost datasets; and (3) local tax and regulation data. BLM’s analytic engine is built into the system’s dynamics Powersim
TM software package (Powersim studio 10, Powersim Software AS, Nyborg, Norway, 2015). A detailed description of BLM can be found at Cafferty
et al. [
5]. One of the major tasks for developing BLM Sino-FS was to identify China-specific supply chain operations. U.S.-based R&D has organized typical feedstock logistics systems into five unit operations: (1) harvesting and collection; (2) preprocessing; (3) transportation; (4) preprocessing; and (5) handling and queuing. These five unit operations encompass all potential activities involved in biomass feedstock logistics, from the biomass in the field to the infeed system at the conversion facility. The modeled feedstock supply system reflects the Chinese infrastructure, agronomic practices, and prevalent existing supply systems, organized within BLM’s five unit operations. The modeled Chinese feedstock supply chain operations (
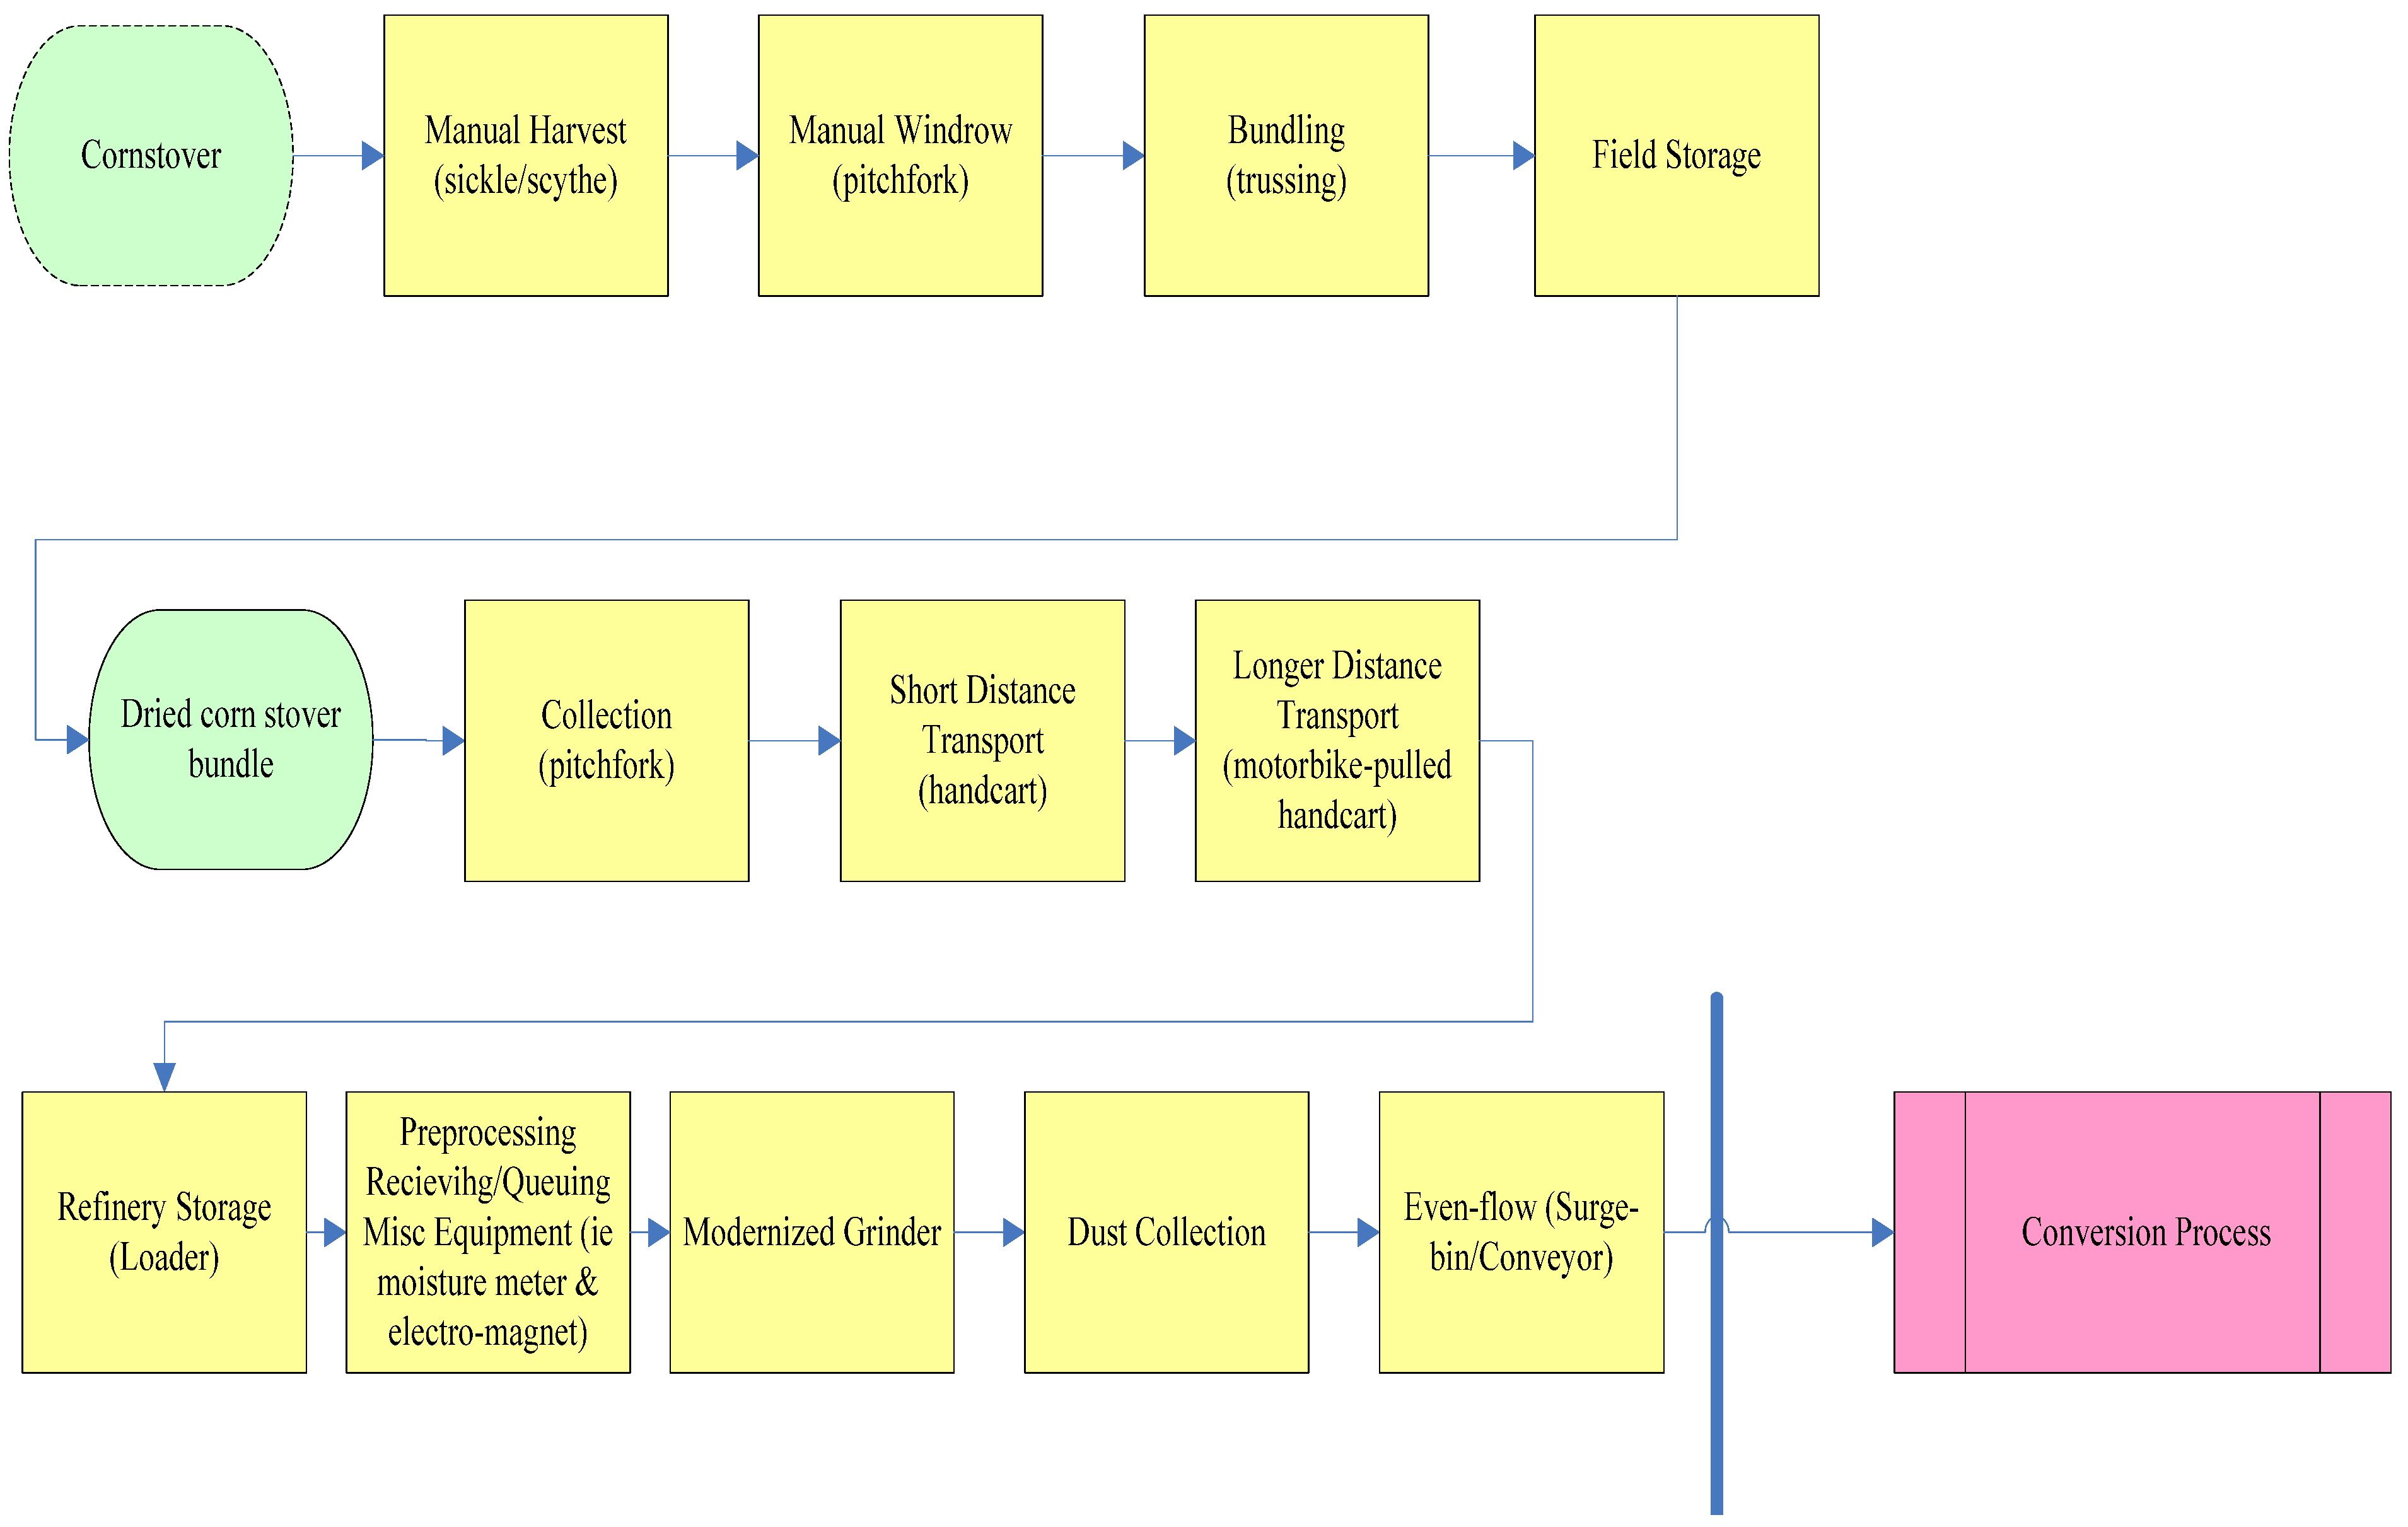
Figure 1) are described in the following sections.
Figure 1.
BLM–SinoFS process flow assumptions based on existing agricultural systems that are common throughout much of rural China. Cases 1, 2 and 3 describe scenarios at increasing mechanized operation.
Figure 1.
BLM–SinoFS process flow assumptions based on existing agricultural systems that are common throughout much of rural China. Cases 1, 2 and 3 describe scenarios at increasing mechanized operation.
2.1.1. Harvest and Collection
The harvest and collection operation encompasses all activities required to gather and remove feedstock from the place of production. The current state of technology in the U.S. uses a mechanized multi-pass harvest system. This system typically involves cutting the feedstock, gathering the material into a windrow, and baling the windrowed material. For corn stover, cutting may or may not be done at the time of corn harvest, which impacts material quality and removal yields. In contrast, the harvesting method in China relies on a manual harvest system using sickle/scythe, manual windrowing, and manual bundling. Collection in U.S. involves moving harvested biomass to a centralized location, such as a field side stack or a landing deck. In China, typical collection equipment includes pitchforks.
2.1.2. Preprocessing
Preprocessing includes any physical or chemical activity that imposes a change to the material, such as chipping, grinding, drying, and densification. Preprocessing may also include any necessary auxiliary operations, such as dust collection and conveyors. In general, the goal of preprocessing is to increase the quality and uniformity of the biomass in order to decrease both transportation and handling and conversion costs later in the supply chain. The current state of technology in U.S. biomass preprocessing includes size reduction and drying. The objective of the preprocessing systems is to take biomass from its as-received condition (i.e., baled, log, or coarse shredded) to the final particle size specification required by the end user. In China, typical preprocessing includes size reduction by sickle, followed by manual bending. Additional moisture is reduced by drying the feedstock in the sun. Preprocessing also includes baling the feedstock material with a baler.
2.1.3. Storage
Storage involves stockpiling material to: (1) provide an adequate lead time and improve efficiencies in the more expensive processes downstream, particularly conversion; (2) accumulate appropriate quantities to make moving the biomass from the field to the biorefinery; or (3) minimize the footprint and storage infrastructure at the biorefinery. In the U.S., storage operations seek to preserve valuable feedstock components until it can be fully utilized within the conversion process. Valuable qualities of feedstock in storage are identified by measuring the relationship between dry matter and convertibility [
18]. Storage systems in China are mainly comprised of short-term field storage and refinery storage. Typically, firms store loose feedstock that does not require baling. Sometimes a group of brokers will store corn stover remotely and wait for a future price increase. When the price increases, those brokers sell it to a biorefinery or end user.
2.1.4. Transportation
Transportation includes all processes involved in the movement of material from the distributed production locations to a centralized location, such as a depot or a biorefinery. Currently, a truck is typically used to deliver biomass in the US. In China, a handcart is used for short distance transportation and a motor-bike pulling a handcart is used for longer distance transportation.
2.1.5. Handling and Queuing
Handling and queuing involves the processes required to move biomass material from a local storage location to the conversion facilities. In the US, surge bins, conveyors, dust collection equipment, and miscellaneous equipment (e.g., twine remover, moisture meter, electro magnet, baler rejecter, etc.) are typically used in handling operations. In China, wagon balance, conveyors, and a catch truck are used in the handling and queuing operation.
2.2. Data Collection
This work includes two case studies that examine the cost structure and logistics for two different locations and two different feedstocks in China: (1) Zhaodong city in Heilongjiang (corn stover) and (2) Wuyuan County in Inner Mongolia (sweet sorghum stalks). We collected the data through face-to-face interviews from Zhaodong city in Heilongjiang province in October 2011 and Wuyuan County in Inner Mongolia in October 2012. We surveyed corn stover at Zhaodong city in Heilongjiang province based on the China National Cereals, Oils, and Foodstuffs Corporation (COFCO) in October 2011. We also surveyed sweet sorghum stalk production at Wuyuan County in Inner Mongolia in October, 2012, which has significant marginal land available for producing sweet sorghum.
Figure 2.
BLM-SinoFS process flow assumptions based on existing corn stover agricultural systems that are common throughout much of rural northeastern China. Cases 1, 2 and 3 describe scenarios at increasing mechanized operation.
Figure 2.
BLM-SinoFS process flow assumptions based on existing corn stover agricultural systems that are common throughout much of rural northeastern China. Cases 1, 2 and 3 describe scenarios at increasing mechanized operation.
Figure 3.
BLM-SinoFS process flow assumptions based on existing sweet sorghum stalks agricultural systems that are common throughout much of rural Inner Mongolia China.
Figure 3.
BLM-SinoFS process flow assumptions based on existing sweet sorghum stalks agricultural systems that are common throughout much of rural Inner Mongolia China.
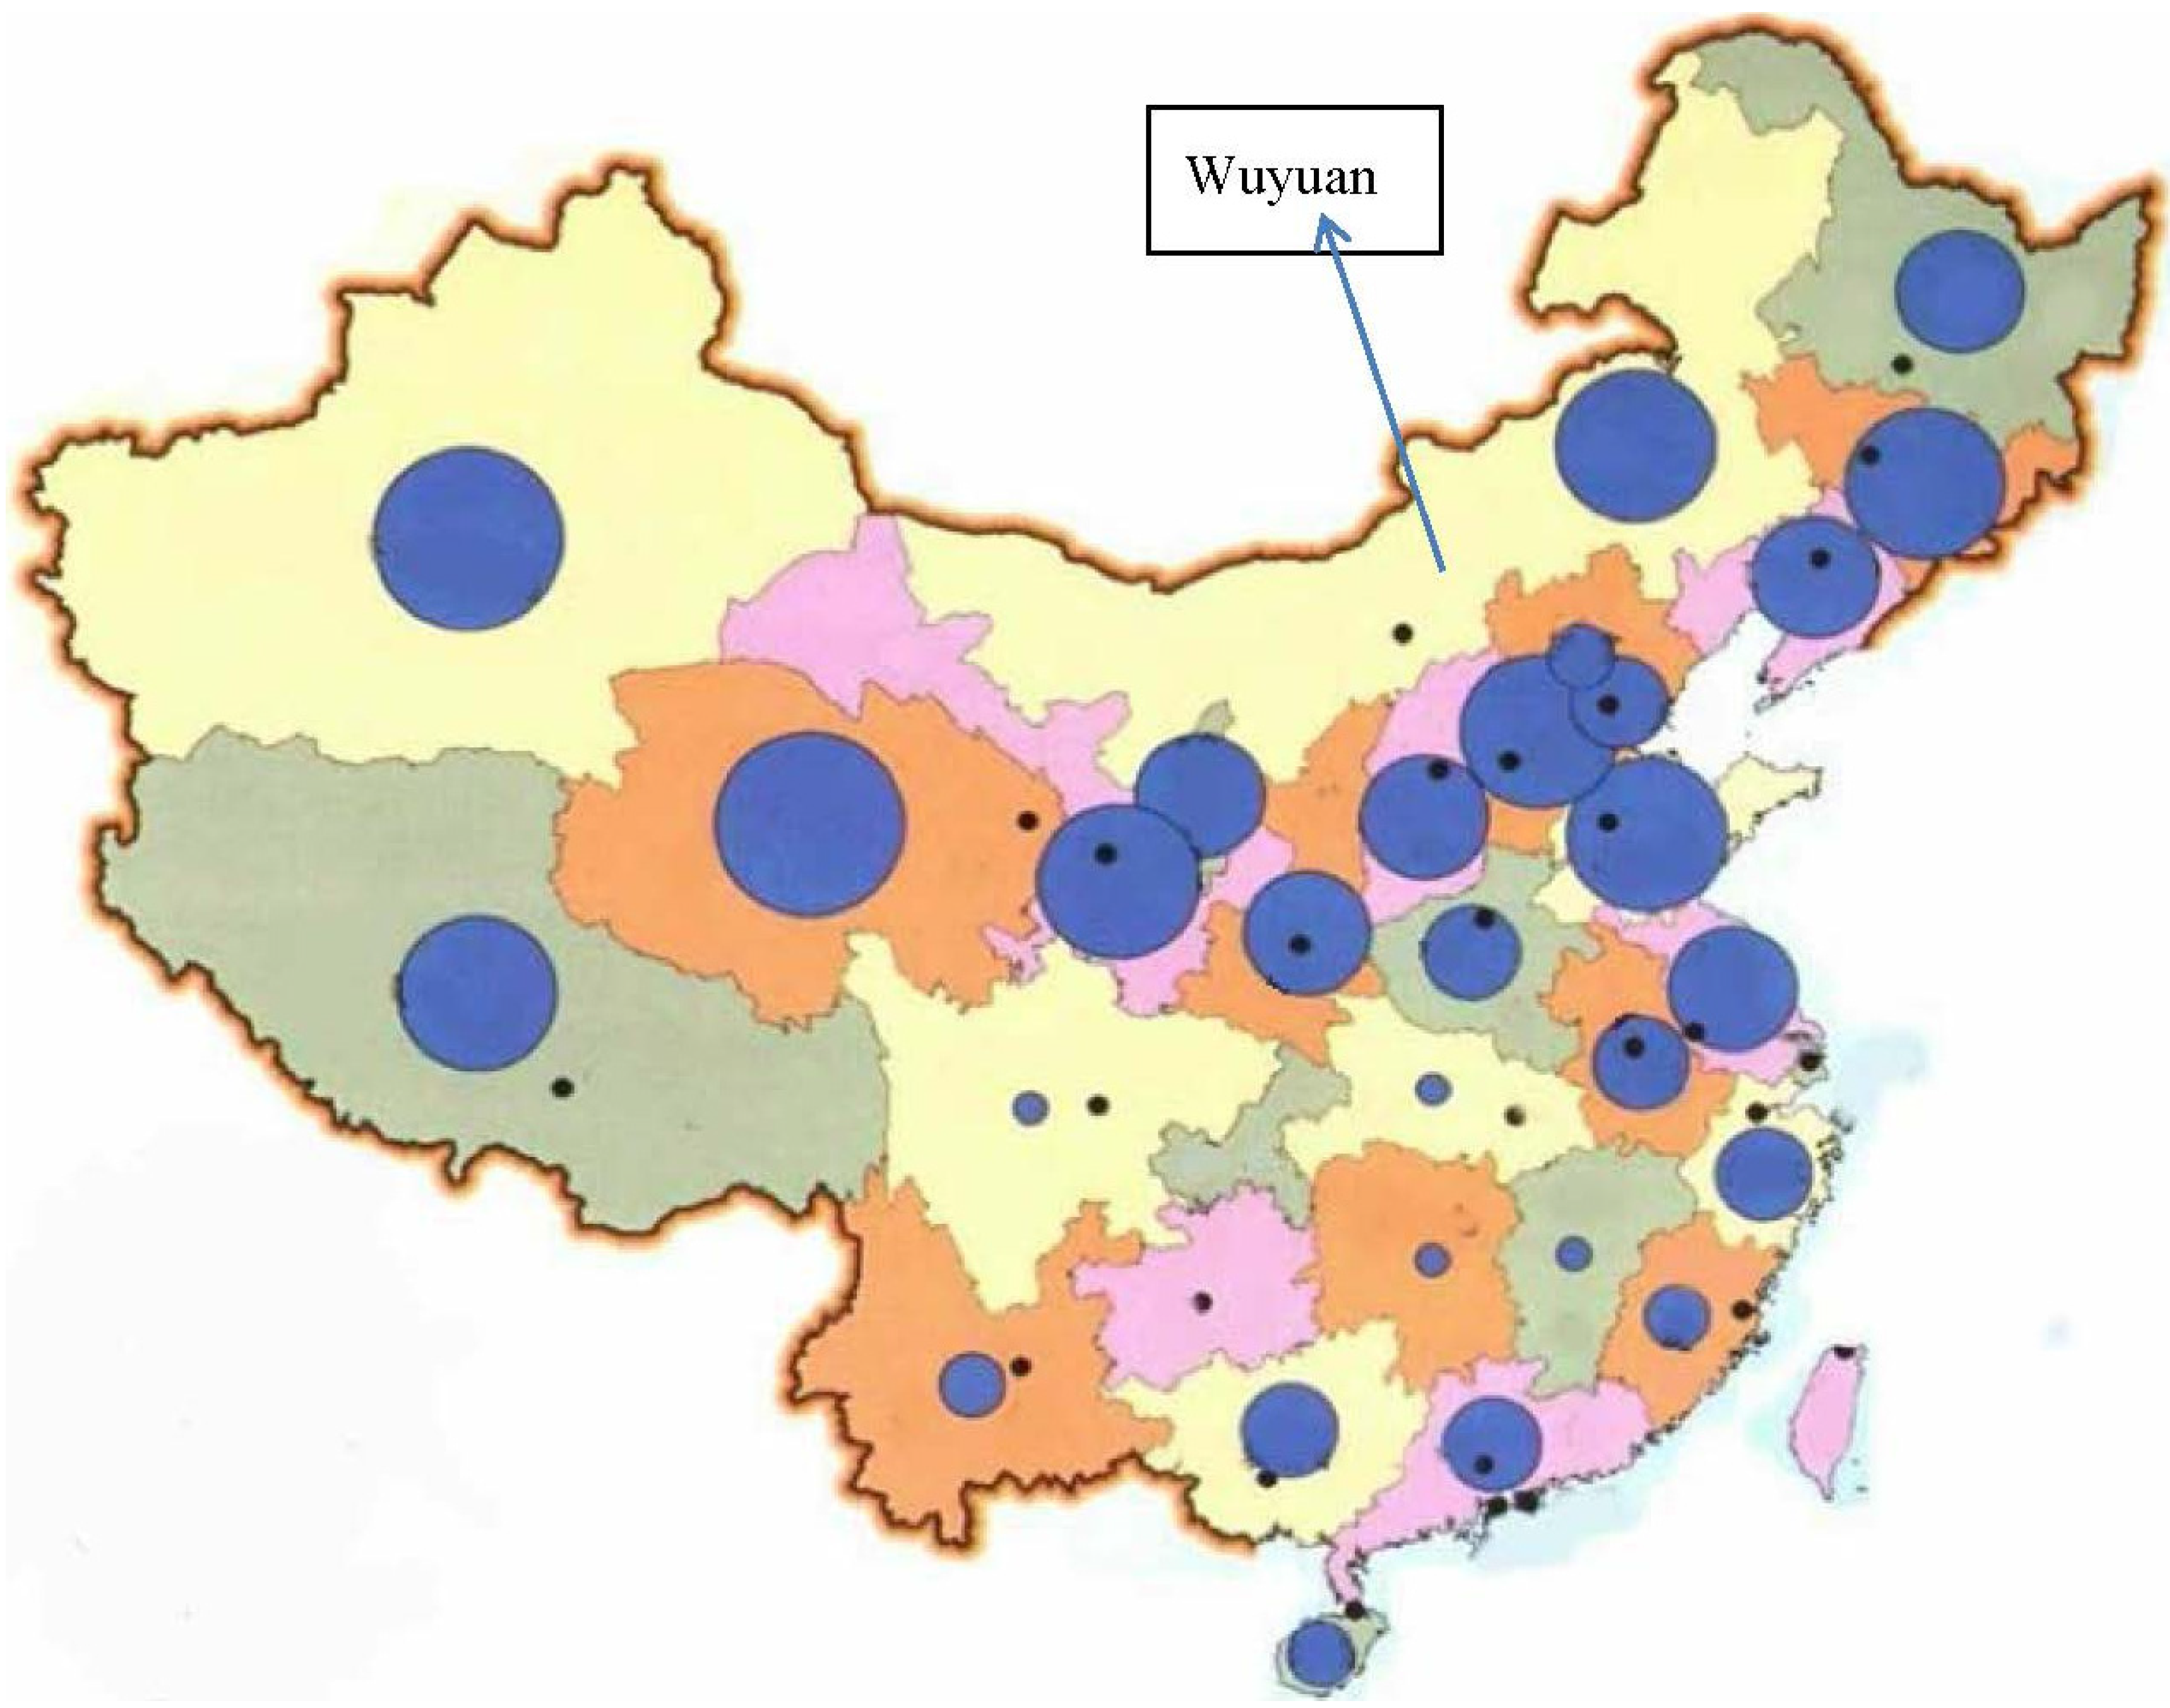
Figure 4.
China’s crop residue distribution in kilo tonne.
Figure 4.
China’s crop residue distribution in kilo tonne.
Figure 5.
China’s saline and sodic land.
Figure 5.
China’s saline and sodic land.
Based on surveys in the Heilongjiang province, it was found that corn stover is harvested by sickle at the speed 0.1584 metric ton per hour. Detailed data and assumptions for harvesting, collection, transportation, preprocessing, and storage are provided for corn stover and sweet sorghum in
Appendix A and
Appendix B, respectively. Costs were calculated based on U.S. dollar (2011), and labor rates were assigned as reported in the 2011 China Statistical Yearbook. An exchange rate of one Chinese Yuan to 0.1570 U.S. dollars was used to report the costs [
19]. Fuel prices were updated to reflect current market value [
20] and average Chinese crop yields were used after being reduced by a factor of two to represent rural values [
21].
2.3. Case Studies
The case studies investigated the supply chain operation of corn stover and sweet sorghum stalks in China. Three cases were modeled for each feedstock. The corn stover supply chain operation’s assumptions for Cases 1 through 3 are shown in
Figure 2. Cases 1, 2, and 3 differ by manual and mechanized operation of the process. Case 1 assumes manual harvest with sickle/scythe, manual baling, and a manual collection process. Case 2 assumes mechanical harvest with a combine, manual baling, and manual collection. Case 3 assumes mechanical harvest with a combine, mechanical bailing with a baler, and mechanical collection with a catch truck.
Figure 3 shows the assumptions used in the sweet sorghum stalk supply chain operation for Cases 1 through 3. Similar to corn stover, Cases 1, 2, and 3 for sweet sorghum stalks differ by the mechanized and manual operations of the various processes.
Zhaodong city (
Figure 4) in Heilongjiang Province was selected for the case study because this area has abundant corn stover and it is just 50 km away from a major metropolitan area and therefore a good representation of rural China. Moreover, COFCO, a Chinese corn ethanol producer has many corn fields around Zhaodong city, so the area has industrial relevance. Wuyuan County in the Inner Mongolia Province (
Figure 5) was selected for the case study because the area has many saline and sodic lands that can be converted to sweet sorghum without competing with food crop production. Moreover, Wuyuan County was selected by ZTE Corporation, a Chinese multinational telecommunications equipment and systems company, for siting and construction of a sweet sorghum-based ethanol production plant.
3. Results
Table 1 summarizes the cost and energy consumed for the corn stover case study. The table show that the logistics cost in Case 1 is higher than in Case 2 and Case 3. This is because Case 2 uses mechanized harvester equipment for harvesting, and Case 3 uses mechanized harvester equipment, mechanized baler equipment, and mechanized preprocessing equipment. The total cost in Case 2 and Case 3 is 14% and 32% less than Case 1, respectively. The results show that mechanization in feedstock logistics could reduce logistic cost by 14% and 32%. The results also show that mechanization will increase energy consumption by 16.3% to 18.3%. Case 2 and Case 3 both have higher energy consumption because they require more machinery than Case 1. Because Case 3 uses more efficient machinery, its energy consumption per dry metric ton is less than the energy consumption for Case 2 (
Table 1).
Table 1.
2011 logistics costs for corn stover in Heilongjiang China.
Table 1.
2011 logistics costs for corn stover in Heilongjiang China.
| Case number | Total cost ($/dry) | Harvest cost ($/dry metric ton) | Baling cost ($/dry metric ton) | Collect ($/dry metric ton) | Preprocess ($/dry metric ton) | Transportation ($/dry metric ton) | Storage ($/dry metric ton) | Energy consumed (Gigajoule(GJ)/dry metric ton) | Used man power (labor hour/dry metric ton) |
|---|
| 1 | 52.95 | 11.61 | 6.88 | 0.61 | 23.04 | 6.92 | 3.88 | 249.84 | 16.95 |
| 2 | 45.58 | 4.16 | 6.88 | 0.61 | 22.96 | 8.08 | 2.89 | 295.49 | 7.09 |
| 3 | 36.01 | 3.94 | 1.64 | 0 | 22.87 | 5.48 | 2.09 | 290.62 | 1.35 |
Table 2.
2012 logistics costs for sweet sorghum stalks in Inner Mongolia province China.
Table 2.
2012 logistics costs for sweet sorghum stalks in Inner Mongolia province China.
| Case number | Total cost ($/dry metric ton) | Harvest cost ($/dry metric ton) | Baling cost ($/dry metric ton) | Preprocess cost ($/dry metric ton) | Storage ($/dry metric ton) | Transportation cost ($/dry metric ton) | Energy consumed (gj/dry metric ton) | Used man power (labor hour/dry metric ton) |
|---|
| 1 | 52.64 | 9.88 | 4.07 | 3.51 | 5.13 | 30.04 | 471.01 | 10.53 |
| 2 | 39.54 | 1.1 | 4.07 | 3.51 | 3.85 | 27.00 | 523.895 | 4.81 |
| 3 | 35.76 | 1.1 | 4.07 | 3.51 | 3.49 | 23.59 | 562.96 | 2.73 |
Table 2 summarizes the cost and energy consumed for the sweet sorghum stalks case study.
Table 2 shows that the logistics cost for Case 1 is higher than for Case 2 and Case 3. This is because Case 2 uses mechanized harvesting equipment, and Case 3 uses mechanized harvesting equipment and a big truck for transportation. Total costs in Case 2 and Case 3 are 24.9 and 32.0% less than Case 1, respectively. The results show that mechanization in feedstock logistics could reduce logistics cost by 24.9% to 32%. The results also show that mechanization will increase energy consumption by 11.2% to 19.5% (
Table 2). Although the moisture content for corn stover and sweet sorghum stalks is assumed to be 20% and 70%, respectively, the total cost in Case 1 for corn stover and sweet sorghum stalks is $52.64/dry metric ton and $52.95/dry metric ton, respectively, because all logistics operations for Case 1 rely on manual labor. We can also see that energy consumption for sweet sorghum stalks is higher than for corn stover. This is because the initial moisture content in sweet sorghum stalks is higher than in corn stover. As a result, it will require extra energy to remove moisture from the sweet sorghum stalks.
To give perspective of the Chinese logistics system we compare it to the 2013 US State of Technology (SOT), which is prepared by INL for the US Department of Energy. The costs reported for the 2013 represent an industry relevant supply system meaning that cost representation are outside of high yielding areas and includes non-ideal conditions. INL quantified the logistics cost of corn stover in a moderate yield area in Kansas, U.S. based on 2013 state of technology (SOT) [
22]. INL also performed biomass feedstock supply system design and logistics cost analysis [
23,
24] for the US Department of Energy. Including cost of procuring feedstock, logistics, and quality, the total delivered feedstock cost for the 2013 SOT is $154/dry metric ton. China’s logistics cost estimated based on Case 1 is $72.13/dry metric ton. These costs include the cost of procuring material. Cost of procuring material for corn stover in China is estimated as $11.51/dry metric ton at 40% moisture [
6].
The major cost difference is due to: (1) the cost of feedstock, (2) conversion-specific preprocessing, and (3) quality control applied at different steps of the logistics operation in the US. The logistics cost in the US includes biomass preprocessing such as size reduction and drying. Size reduction equipment (such as a bale grinder or hammer mill) is used for grinding, and drying equipment (such as rotary dryer) is used for drying. The quality control costs in the U.S. logistics cost was assessed by a dockage fee. Dockage is a penalty assumed by the feedstock supply chain for failure to meet a feedstock specification (Kenney et al., 2013). A dockage fee typically consists of moisture dockage, ash dockage, and convertibility dockage. Moisture dockage assesses a penalty fee due to grinding and drying cost. Ash dockage consists of replacement cost, disposal cost, and cost of other effects such as chemical pretreatment to reduce ash. Convertibility dockage assesses a penalty fee due to reduced convertibility associated with storage degradation/losses.
A sensitivity analysis was performed using Monte Carlo sampling methods with triangular distribution for selected variables. Parameters were chosen for sensitivity analysis due to their uniqueness to rural Chinese supply chain design and their associated level of uncertainty (see
Table 3 and
Table 4).
Table 3.
Parameters and distribution variables chosen for sensitivity analysis of corn stover.
Table 3.
Parameters and distribution variables chosen for sensitivity analysis of corn stover.
| Parameter | Case 1 | Case 2 | Case 3 |
|---|
| Element | Min | Max | Peak | Min | Max | Peak | Min | Max | Peak |
|---|
| Biorefinery annual demand (ton/year) | 10,000 | 350,000 | 70,000 | 10,000 | 350,000 | 70,000 | 10,000 | 350,000 | 70,000 |
| Sustainable removable yield (tons/acre) | 2.07 | 4.28 | 3.21 | 2.07 | 4.28 | 3.21 | 2.07 | 4.28 | 3.21 |
| Diesel price ($/gal) | 4.46 | 6 | 5 | 4.46 | 6 | 5 | 4.46 | 6 | 5 |
| Electricity price ($/(kWhr)) | 0.0848 | 0.15 | 0.1 | 0.0848 | 0.15 | 0.1 | 0.0848 | 0.15 | 0.1 |
| Natural gas price ($/MMBTU) | 5.29 | 7 | 6 | 5.29 | 7 | 6 | 5.29 | 7 | 6 |
| Interest (%) | 0.06 | 0.12 | 0.1 | 0.06 | 0.12 | 0.1 | 0.06 | 0.12 | 0.1 |
| Harvest rate (tons/h) | 0.12 | 0.2 | 0.1584 | 5 | 9 | 7.39 | 5 | 9 | 7.39 |
| Bale rate (bales/h) | 20 | 40 | 30 | 20 | 40 | 30 | 40 | 80 | 60 |
| Transportation distance from field side (miles) | 4 | 20 | 10 | 4 | 20 | 10 | 4 | 20 | 10 |
| Transportation distance from depot (miles) | 40 | 100 | 50 | 40 | 100 | 50 | 40 | 100 | 50 |
| Farmer labor price ($/h) | 1 | 3 | 1.5 | 1 | 3 | 1.5 | 1 | 3 | 1.5 |
| Technical labor price ($/h) | 1.5 | 10 | 3.11 | 1.5 | 10 | 3.11 | 1.5 | 10 | 3.11 |
| Depot capacity (ton/year) | 60 | 10,000 | 80 | 60 | 10,000 | 80 | 60 | 10,000 | 80 |
| Moisture before bales (%) | 30 | 50 | 40 | 30 | 50 | 40 | 30 | 50 | 40 |
| Moisture after baled (%) | 12 | 25 | 20 | 12 | 25 | 20 | 12 | 25 | 20 |
| Transport density field side (lb/ft3) | 2 | 12 | 2 | 2 | 12 | 2 | 2 | 12 | 12 |
| Transport density from depot (lb/ft3) | 6 | 12 | 12 | 6 | 12 | 12 | 6 | 12 | 12 |
Table 4.
Parameters and distribution variables chosen for sensitivity analysis of sweet sorghum.
Table 4.
Parameters and distribution variables chosen for sensitivity analysis of sweet sorghum.
| Parameter | Case 1 | Case 2 | Case 3 |
|---|
| Element | Min | Max | Peak | Min | Max | Peak | Min | Max | Peak |
|---|
| Biorefinery annual demand (ton/year) | 100,000 | 400,000 | 250,000 | 100,000 | 25 | 80,000 | 100,000 | 400,000 | 250,000 |
| Sustainable removable yield (tons/acre) | 2 | 8 | 5.69 | 2 | 8 | 5.69 | 2 | 8 | 5.69 |
| Diesel price ($/gal) | 4.46 | 6 | 5 | 4.46 | 6 | 5 | 4.46 | 6 | 5 |
| Electricity price ($/(kWhr)) | 0.0848 | 0.15 | 0.1 | 0.0848 | 0.15 | 0.1 | 0.0848 | 0.15 | 0.1 |
| Natural gas price ($/MMBTU) | 5.29 | 7 | 6 | 5.29 | 7 | 6 | 5.29 | 7 | 6 |
| Interest (%) | 0.06 | 0.12 | 0.1 | 0.06 | 0.12 | 0.1 | 0.06 | 0.12 | 0.1 |
| Harvest rate (tons/h) | 0.2 | 0.5 | 0.3715 | 0.2 | 0.5 | 0.3715 | 8 | 15 | 11.2 |
| Bale rate (bales/h) | 10 | 20 | 15 | 20 | 40 | 35 | 20 | 40 | 35 |
| Transportation distance from field side (miles) | 4 | 20 | 10 | 4 | 20 | 10 | 4 | 20 | 10 |
| Transportation distance from depot (miles) | 40 | 100 | 50 | 40 | 100 | 50 | 40 | 100 | 50 |
| Farmer labor price ($/h) | 1 | 3 | 1.5 | 1 | 3 | 1.5 | 1 | 3 | 1.5 |
| Technical labor price ($/h) | 1.5 | 10 | 3.11 | 1.5 | 10 | 3.11 | 1.5 | 10 | 3.11 |
| Depot capacity (ton/year) | 60 | 10,000 | 80 | 60 | 10,000 | 80 | 60 | 10,000 | 80 |
| Moisture before bales (%) | 50 | 80 | 75 | 50 | 80 | 75 | 50 | 80 | 75 |
| Moisture after baled (%) | 45 | 70 | 65 | 45 | 70 | 65 | 45 | 70 | 65 |
| Density when transportation from field side (lb/ft3) | 6 | 12 | 8 | 6 | 12 | 8 | 6 | 12 | 8 |
| Density when transportation from depot (lb/ft3) | 8 | 12 | 10 | 8 | 12 | 10 | 8 | 12 | 10 |
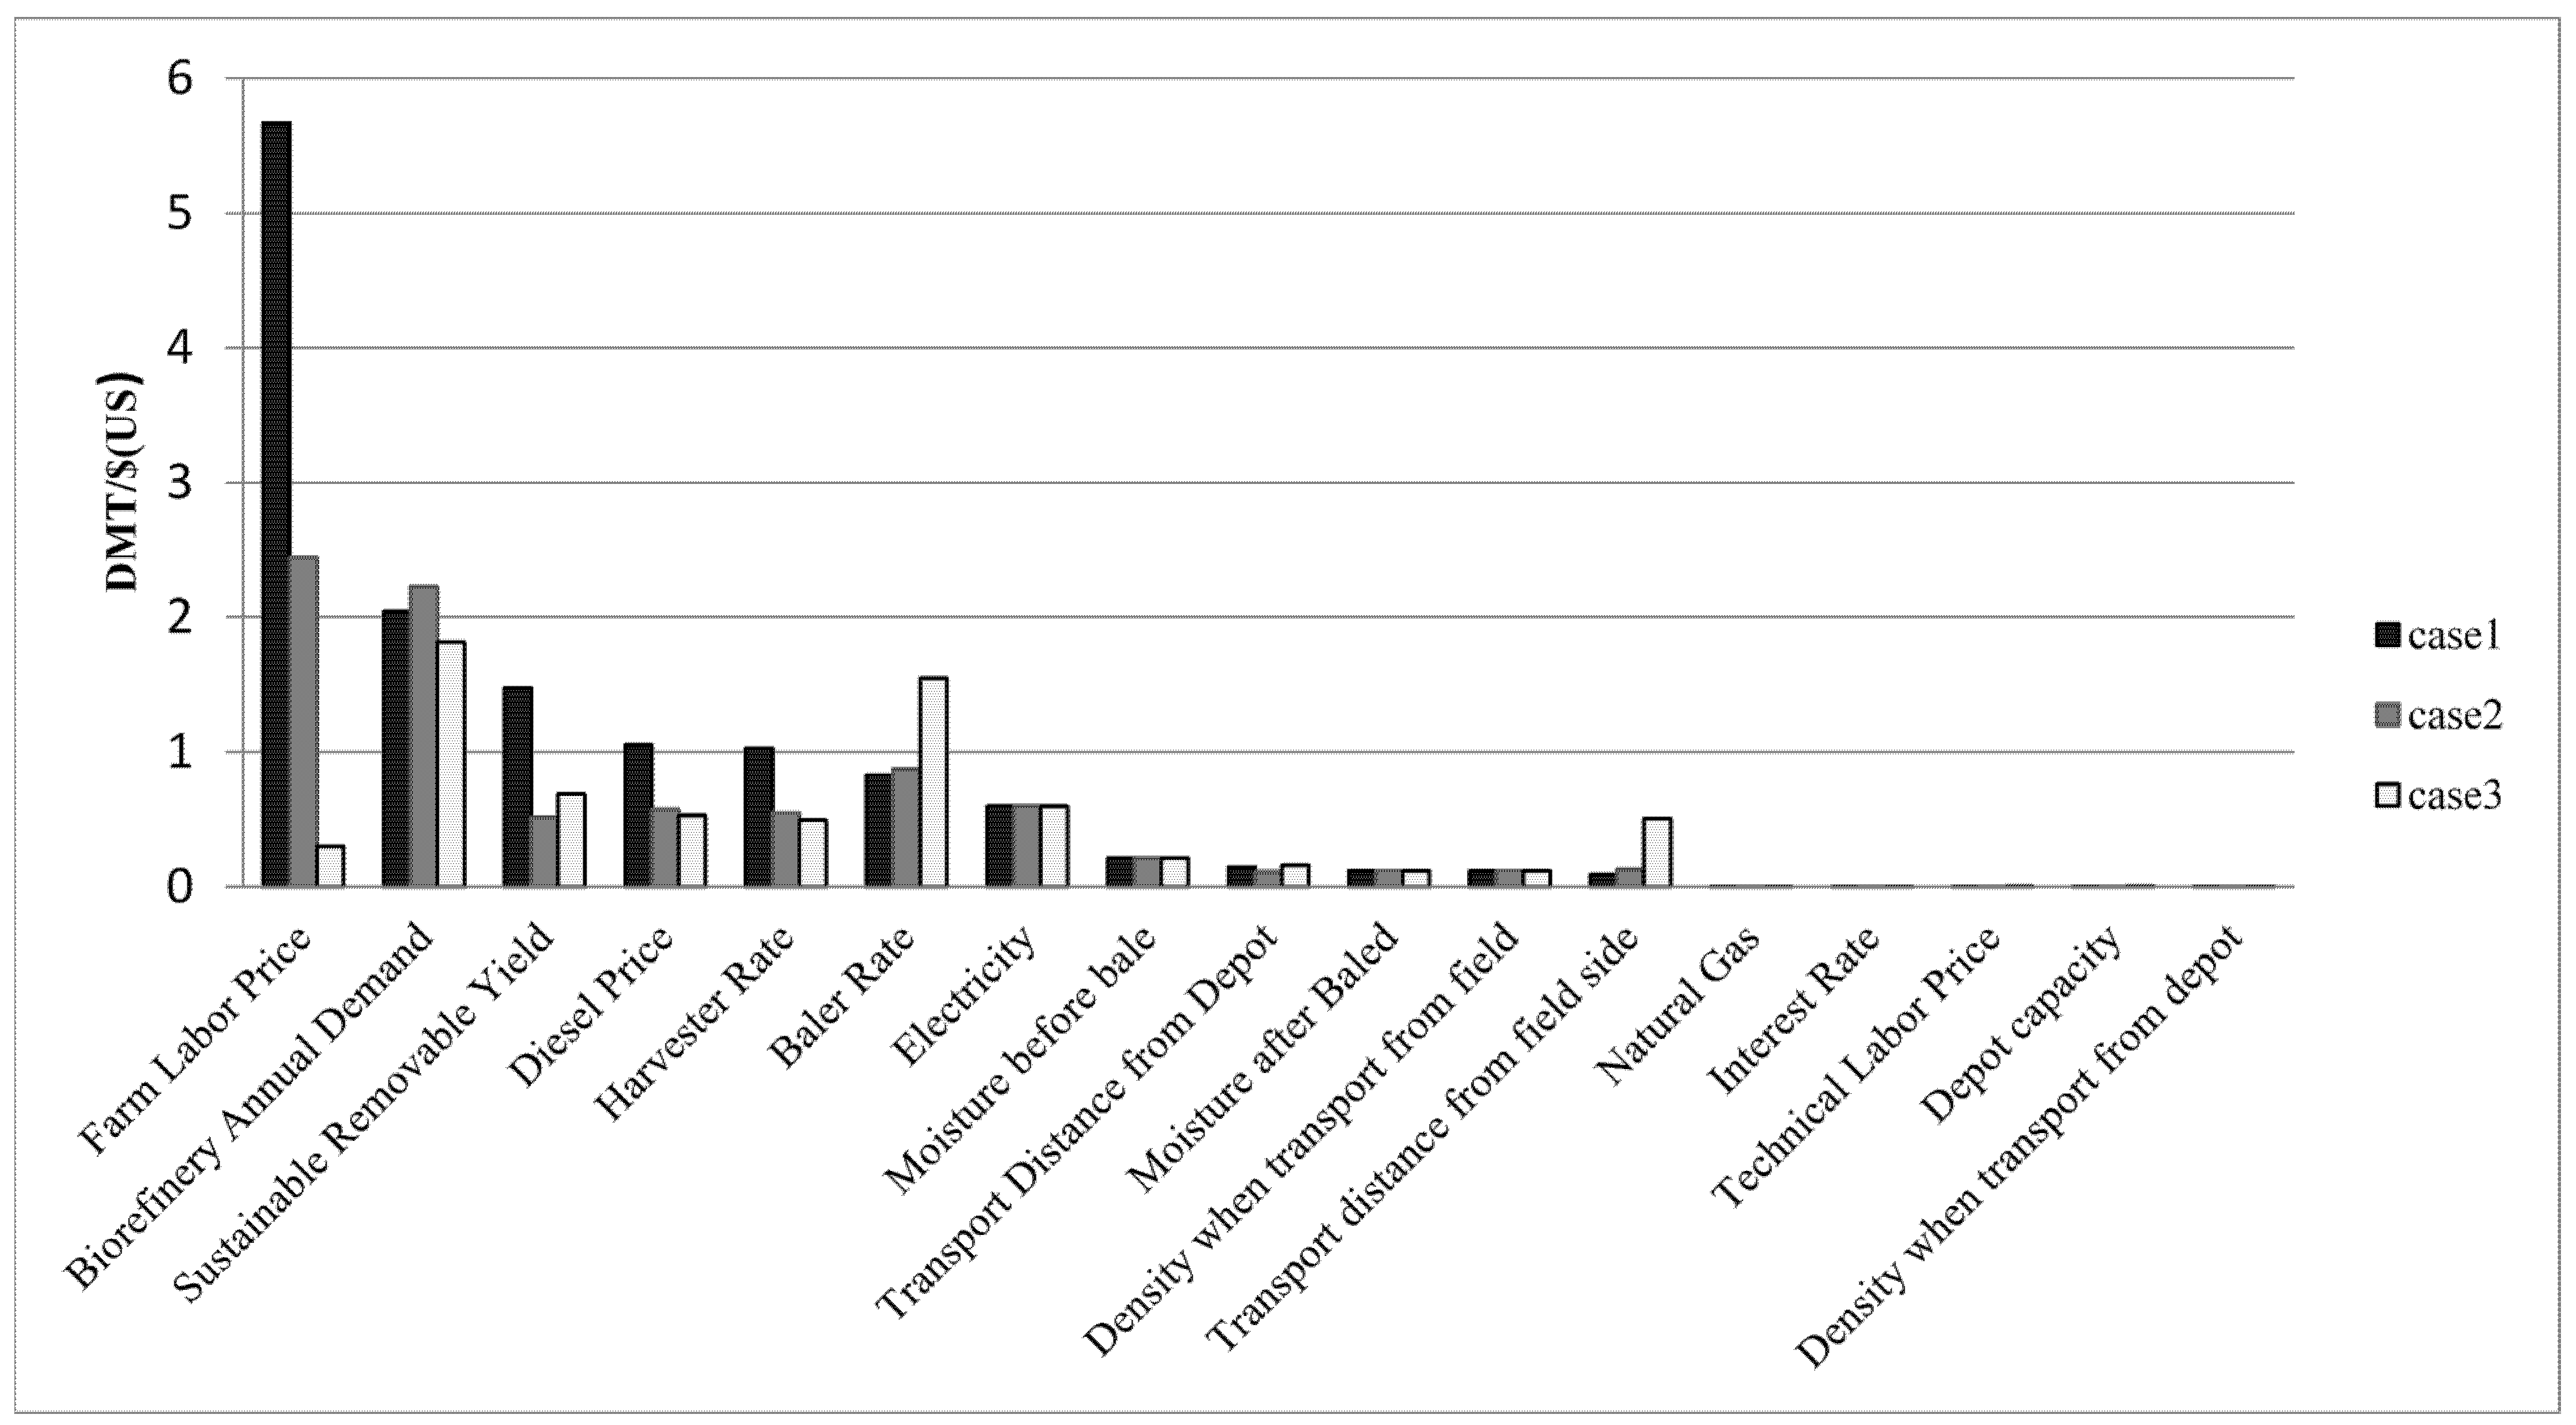
Figure 6.
Pareto chart of BLM-Sino FS parameters by associated contribution to total cost for corn stover in northeastern China.
Figure 6.
Pareto chart of BLM-Sino FS parameters by associated contribution to total cost for corn stover in northeastern China.
Figure 7.
Pareto chart of BLM-Sino FS parameters by associated Contribution to total cost for sweet sorghum stalks in northeastern China.
Figure 7.
Pareto chart of BLM-Sino FS parameters by associated Contribution to total cost for sweet sorghum stalks in northeastern China.
Seventeen parameters were investigated during the sensitivity analysis. Impacts were assessed based on the influence each Chinese supply chain had on total cost ($/ Dry metric ton).
Figure 6 and
Figure 7 rank each variable in order of contribution. Farm labor price and biorefinery annual demand are shown to have the most influence and cause the most variability in cost. Sustainable removable yield, diesel price, harvester rate, baler rate, electricity, moisture content before baling, transportation distance from depot, moisture content after baling, mass density during transportation, and transport distance from the production field all influence cost (
Figure 6). Case 3 for corn stover also is influenced by the biorefinery’s annual demand and bale rate. In
Figure 7, we can see that the farm labor price and transportation distance from the field will have the highest influence on Case 1 for the sweet sorghum stalks scenario. However, the biorefinery’s annual demand is the most influential factor in Case 3.
4. Discussion
We performed a regional and cursory exploration using surveyed and published information about current rural Chinese biomass supply systems for the Chinese biopower industry, therefore the results may change drastically with more specific Chinese data and from region to region. For example, the amount of manual labor versus mechanized equipment varies greatly between provinces, which would alter the results significantly.
However, for the assumed feedstock supply system, corn stover logistics cost varies from $36.01 to 52.95 per dry metric ton, and energy consumption cost varies from $236.80 to 280.07/MBTU per dry metric ton, depending on the level of manual versus mechanization of the various operations. Similarly, sweet sorghum stalks logistics costs varies from $35.76 to 52.64 per dry metric ton, and energy consumption varies from 446.43 to 533.58/MBTU per dry metric ton, depending on the level of manual versus mechanization of the various operations.
The sensitivity analysis for corn stover relying on manual operations shows that although 17 parameters were selected for sensitivity analysis, two parameters influence cost variations of $2 to $6 per dry metric ton. The two parameters are farm labor price and biorefinery annual demand. The rest of the parameters will influence cost variations of less than $2 per dry metric ton. Similarly, the sensitivity analysis for sweet sorghum stalks relying manual operations shows that four parameters influence cost variations of $4 to $15 per dry metric ton. The four parameters are farm labor price, biorefinery annual demand, transport distance from field, and transport distance from depot. The rest of the parameters will influence cost variations less than $4 per dry metric ton. We can see that factors influencing cost of corn are different to those from Sweet Sorghmum case studies for manual based supply system. Compare to corn stover, two additional factors that determine cost variations in sweet sorghum case studies are: transportation from field and transportation from depot. This is due to the physical characteristics of sweet sorghum stalks. Sweet Sorghum can’t be baled due to its high moisture content, which affects the transportation efficiency.
Sensitivity analysis shows that the parameters that determine the cost variations in mechanized logistics operations are different than manual operations. Mechanization reduces the cost variations in corn stover Case Studies (
Figure 6). This is due to the fact that mechanization reduces cost variations originated from farm labor price variations. If the corn stover logistics are mechanized, baler rate and biorefinery’s annual demand seems to be the most important cost factors resulting a cost variation up to $2 per dry metric ton. Mechanization increases the cost variations in sweet sorghum Case Studies (
Figure 7).Sensitivity analysis shows that mechanization in sweet sorghum logistics operations could increase the cost variations upto $15 per dry metric ton. If the sweet sorghum stalk’s logistics operation is mechanized, biorefinery’s annual demand is identified to be most importation cost factor of variations. This is due to the underlying relation between increased demand of sweet sorghum stalk and less utilized equipment. Mechanization in sweet sorghum logistics required dedicated equipments which can’t be used for other purpose when equipments are idle; As a result, when the annual demand increases, the number of less utilized equipments increase. Therefore, logistics cost is sensitive to biorefinery’s annual demand. If the sweet sorghum stalk’s logistics operation is mechanized, other factors which will determine the cost variations are: transport distance from depot, diesel price, transport distance from field side and baler rate.
When the cost of feedstock logistics for China were calculated, no consideration was given to the impact of ash content and preprocessing on feedstock quality. The U.S. corn stover logistics cost assumes that the feedstock supply chain will be held accountable for feedstock specifications and quality specifications required by the targeted conversion pathway. Therefore, the corn stover logistics cost for China is less than for the US when cost of quality is included.
5. Conclusions
This work analyzes the rural Chinese biomass supply system and the model of supply chain operations according to U.S. concepts of logistical unit operations: harvest and collection, storage, transportation, preprocessing, and handling and queuing. The logistics cost of corn stover and sweet sorghum stalks was quantified for different scenarios in China. The case studies show that the logistics cost of corn stover and sweet sorghum stalk will be $52.95 per dry metric and $52.64 per dry metric ton, respectively, for the current labor-based biomass logistics system. However, if the feedstock logistics are mechanized, the cost of corn stover and sweet sorghum stalk will be down to $36.01 per metric ton and $35.76 per metric ton, respectively. The sensitivity analysis shows that labor price has the most influence on the logistics cost of corn stover and sweet sorghum stalk, resulting in a variation of $6 to 12 per metric ton. The logistics cost differences between the US and China are primarily due to: (1) the biomass purchasing costs are higher in the U.S. than in China and (2) the U.S. has additional costs for preprocessing and quality control applied at different steps of the logistics operation to meet feedstock specifications required by the end user.
This analysis was a regional and cursory exploration using surveyed and published information about the current rural Chinese biomass supply systems for their biopower industry. The results may change with more specific Chinese data and from region to region. Additionally, this analysis did not include any environmental considerations that are typical of U.S. supply systems. The environmental metrics include greenhouse gas emissions and water footprints for blue, green, and grey water. Future work could include incorporating modeled environmental impacts to current biomass supply systems and modeling using additional site-specific data from other areas in China.
Acknowledgments
Support for this research was provided by the Bioenergy Technology Office within the Energy Efficiency and Renewable Energy Office of the U.S. Department of Energy. We are grateful to the following people from the Energy Efficiency and Renewable Energy Office of the U.S. Department of Energy for this analysis: Brian Holuj, Senior Advisor, International; Alison Goss Eng, Chief Operations Officer, Bioenergy Technologies Office; and Kristen Johnson, Technology Manager, Bioenergy Technologies Office.
Author Contributions
The concept of this research was conceived by Chris Wright and Leslie Ovard. Field data was collected by Lantian Ren and Guannghui Xi. The BLM-SinoFS model was developed from BLM by Kara Cafferty with input from Lantian Ren. The feedstock logistics were developed by Kara Cafferty and Lantian Ren and reviewed by Mohammad Roni and Jacob Jacobson. Manuscript preparation and data interpretation was completed by Lantian Ren, Kara Cafferty, and Mohamad Roni. All authors contributed to the editing and reviewing of this document.
Conflicts of Interest
This work is supported by the US Department of Energy under Department of Energy Idaho Operations Office Contract No. DE-AC07-05ID14517. The U.S. Government retains and the publisher, by accepting the article for publication, acknowledges that the U.S. Government retains a nonexclusive, paid-up, irrevocable, worldwide license to publish or reproduce the published form of this manuscript, or allow others to do so, for US Government purposes. The authors have no other relevant affiliations or financial involvement with any organization or entity with a financial interest in or financial conflict with the subject matter or materials discussed in the manuscript apart from those disclosed. No writing assistance was utilized in the production of this manuscript.
Disclaimer
This information was prepared as an account of work sponsored by an agency of the US Government. Neither the U.S. Government nor any agency thereof, nor any of their employees, makes any warranty, express or implied, or assumes any legal liability or responsibility for the accuracy, completeness, or usefulness of any information, apparatus, product, or process disclosed, or represents that its use would not infringe privately owned rights. References herein to any specific commercial product, process, or service by trade name, trademark, manufacturer, or otherwise, does not necessarily constitute or imply its endorsement, recommendation, or favoring by the U.S. Government or any agency thereof. The views and opinions of authors expressed herein do not necessarily state or reflect those of the U.S. Government or any agency thereof.
Appendix A
Table A1.
Equipment and other elements used during harvesting and collection.
Table A1.
Equipment and other elements used during harvesting and collection.
| Item | Case 1 | Case 2 | Case 3 |
|---|
| Biorefinery annual demand (dry metric ton/year) | 350,000 | 350,000 | 350,000 |
| Sustainable removable yield (dry metric ton/acre) | 3.2051 | 3.2051 | 3.2051 |
| Interest (%) | 6 | 6 | 6 |
| Diesel price (USD/gal) | 4.46 | 4.46 | 4.46 |
| Electricity (USD/kWhr) | 0.0848 | 0.0848 | 0.0848 |
| Harvester | Sickle | China harvester-160HP | China harvester-160HP |
| Harvester % cost | 100 | 100 | 100 |
| Field efficiency | 90 | 70 | 70 |
| Collection efficiency | 90 | 80 | 80 |
| Rate capacity (metric ton /hour) | 0.158 | 7.392 | 7.392 |
| Baler | Manual | Manual | Baler in field-3t |
| Collection | Pitchfork | Pitchfork | NA |
| Loader | Pitchfork | Pitchfork | Loader-130HP |
| Dryer | Sunshine | Sunshine | Sunshine |
Table A2.
Equipment and other elements used during transportation.
Table A2.
Equipment and other elements used during transportation.
| Item | Case 1 | Case 2 | Case 3 |
|---|
| Loader in field side | Pitchfork | Pitchfork | Loader |
| Truck from field side | Tractor | Tractor | Big truck |
| Transportation weeks per year | 12 | 12 | 42 |
| Transportation days per week | 6 | 6 | 6 |
| Transportation hours per day | 10 | 10 | 10 |
| Transportation speed from field side (miles/h) | 9.1 | 9.1 | 12.5 |
| Transportation truck from depot | Truck-240HP | Truck-240HP | Truck-240HP |
| Loader | Loader-130HP | Loader-130HP | Loader-130HP |
| Transportation speed from depot (miles/h) | 31 | 31 | 31 |
Table A3.
Equipment and other elements used during storage.
Table A3.
Equipment and other elements used during storage.
| Item | Case 1 | Case 2 | Case 3 |
|---|
| Loader in field side | Pitchfork | Pitchfork | Loader |
| Rental cost | Free | Free | Free |
| Insurance | 0 | 0 | 0 |
| Rental fee in depot (USD/acre) | 20 | 20 | 20 |
| DM loss | 5 | 5 | 5 |
| Cover | NA | NA | NA |
| Wrap | NA | NA | NA |
Table A4.
Equipment and other elements used in preprocessing.
Table A4.
Equipment and other elements used in preprocessing.
| Item | Case 1 | Case 2 | Case 3 |
|---|
| Dryer | Sunshine | Sunshine | Sunshine |
| Grinder | NA | NA | Grinder-24.8 |
| Unloader | Graber and transfer | Graber and transfer | Graber and transfer |
| Baler | Big baler -70HP | Big baler -70HP | Big baler -70HP |
| Loader | Graber and transfer | Graber and transfer | Graber and transfer |
Appendix B
Table B1.
Equipment and other elements used during harvesting and collection.
Table B1.
Equipment and other elements used during harvesting and collection.
| Item | Case 1 | Case 2 | Case 3 |
|---|
| Biorefinery annual demand (dry metric ton/Y) | 400,000 | 400,000 | 400,000 |
| Sustainable removable yield (dry metric ton/Acre) | 5.6683 | 5.6683 | 5.6683 |
| Interest (%) | 6 | 6 | 6 |
| Diesel price (USD/Gal) | 4.46 | 4.46 | 4.46 |
| Electricity (USD/kWhr) | 0.0848 | 0.0848 | 0.0848 |
| Harvester | Reaping hook | China sweet sorghum harvester | China sweet sorghum harvester |
| Harvester % cost | 100 | 100 | 100 |
| Field efficiency | 90 | 80 | 80 |
| Collection efficiency | 90 | 80 | 80 |
| Rate capacity (metric ton /h) | 0.3715 | 11.2052 | 11.2052 |
| Baler | Manual | Manual | Manual |
| Collection | Manual | Manual | Manual |
| Loader | Forklift | Forklift | Forklift |
| Dryer | NA | NA | NA |
Table B2.
Equipment and other elements used during transportation.
Table B2.
Equipment and other elements used during transportation.
| Item | Case 1 | Case 2 | Case 3 |
|---|
| Loader in field side | Forklift | Forklift | Forklift |
| Truck from field side | Tricycle | Tractor | Big truck |
| Transportation weeks per year | 24 | 24 | 42 |
| Transportation days per week | 7 | 7 | 6 |
| Transportation hours per day | 10 | 10 | 10 |
| Transportation Speed from field side (miles/h) | 8 | 12.5 | 13.6 |
| Transportation truck from depot | Truck-240HP | Truck-240HP | Truck-240HP |
| Loader | Transfer machine | Transfer machine | Transfer machine |
| Transportation speed from depot (miles/h) | 31 | 31 | 31 |
Table B3.
Equipment and other elements used during storage.
Table B3.
Equipment and other elements used during storage.
| Item | Case 1 | Case 2 | Case 3 |
|---|
| Loader in field side | Forklift | Forklift | Forklift |
| Rental cost | Free | Free | Free |
| Insurance | 0 | 0 | 0 |
| Rental fee in depot (USD/Acre) | 20 | 20 | 20 |
| DM loss | 5 | 5 | 5 |
| Cover | NA | NA | NA |
| Wrap | NA | NA | NA |
Table B4.
Equipment and other elements used in preprocessing.
Table B4.
Equipment and other elements used in preprocessing.
| Item | Case 1 | Case 2 | Case 3 |
|---|
| Dryer | NA | NA | NA |
| Grinder | NA | NA | NA |
| Unloader | Catch truck | Catch truck | Catch truck |
| Baler | NA | NA | NA |
| Loader | Catch truck | Catch truck | Catch truck |
References
- Sang, T.; Zhu, W. China’s bioenergy potential. GCB Bioenergy 2011, 3, 79–90. [Google Scholar] [CrossRef]
- Xie, G.; Wang, X.Y.; Ren, L.T. China’s crop residues resources evaluation. Chin. J. Biotechnol. 2010, 26, 855–863. [Google Scholar]
- De Vries, S.C.; van de Ven, G.W.J.; van Ittersum, M.K.; Giller, K.E. Resource use efficiency and environmental performance of nine major biofuel crops, processed by first-generation conversion techniques. Biomass Bioenergy 2010, 34, 588–601. [Google Scholar] [CrossRef]
- Li, Z.; Wang, G.C.; Liang, D.; Liu, G. The supply of straw used to assess the area coefficient gasification station. Rural Energy 2001, 2, 17–19. [Google Scholar]
- Cafferty, K.; Muth, D.; Jacobson, J.; Bryden, K. Model based biomass system design of feedstock supply systems for bioenergy production. In Proceedings of the ASME 2013 International Design Engineering Technical Conferences and Computers and Information in Engineering Conference, Portland, OR, USA, 4–7 August 2013.
- Xing, A.-H.; Liu, G.; Wang, Y.; Wei, F.; Jin, Y. Economic, energy and environment analysis on biomass collection process. Chin. Process. Eng. 2008, 8, 305–313. [Google Scholar]
- Xu, Y.; Tian, Y.; Zhao, L. Comparison on cost and energy consumption with different straw’s collection-store-transportation modes. Trans. Chin. Soc. Agric. Eng. 2014, 30, 259–267. (In Chinese) [Google Scholar]
- Fang, Y.R.; Liao, S.H.; Wang, L.F.; Ren, L.T.; Xie, G.H. Model establishment and cost analysis on wheat straw logistic system. J. Chin. Agric. Univ. 2014, 19, 28–35. [Google Scholar]
- Cundiff, J.S.; Dias, N.; Sherali, H.D. A linear programming approach for designing a herbaceous biomass delivery system. Bioresour. Technol. 1997, 59, 47–55. [Google Scholar] [CrossRef]
- Mapemba, L.D.; Epplin, F.M.; Huhnke, R.L.; Taliaferro, C.M. Herbaceous plant biomass harvest and delivery cost with harvest segmented by month and number of harvest machines endogenously determined. Biomass Bioenergy 2008, 32, 1016–1027. [Google Scholar] [CrossRef]
- Shastri, Y.; Hansen, A.; Rodriguez, L.; Ting, K.C. Development and application of BioFeed model for optimization of herbaceous biomass feedstock production. Biomass Bioenergy 2011, 35, 2961–2974. [Google Scholar] [CrossRef]
- Roni, M.S.; Eksioglu, S.D.; Searcy, E.; Jha, K. A supply chain network design model for biomass co-firing in coal-fired power plants. Transp. Res. Part E Logist. Transp. Rev. 2014, 61, 115–134. [Google Scholar] [CrossRef]
- Roni, M.S. Analyzing the Impact of a Hub and Spoke Supply Chain Design for Long-Haul, High-Volume Transportation of Densified Biomass. Ph.D. Dissertation, Mississippi State University, Starkville, MS, USA, 14 December 2013. [Google Scholar]
- Roni, M.; Eksioglu, S.D.; Cafferty, K.G. A Multi-Objective, Hub-and-Spoke Supply Chain Design Model for Densified Biomass. In Proceedings of the Institute of Industrial Engineer (IIE) Annual Conference, Montreal, QC, Canada, 31 May–3 June 2014.
- Cook, D.E.; Shinners, K.J. Economics of Alternative Corn Stover Logistics Systems; American Society of Agricultural and Biological Engineers: St. Joseph, MI, USA, 2011. [Google Scholar]
- Kumar, A.; Sokhansanj, S. Switchgrass (Panicum vigratum, L.) delivery to a biorefinery using integrated biomass supply analysis and logistics (IBSAL) model. Bioresour. Technol. 2007, 98, 1033–1044. [Google Scholar] [CrossRef] [PubMed]
- Sokhansonj, S.; Kumar, A.; Turhollow, A. Development and implementation of integrated biomass supply analysis and logistics model (IBSAL). Biomass Bioenergy 2006, 30, 838–847. [Google Scholar] [CrossRef]
- Kenney, K.L.; Smith, W.A.; Gresham, G.L.; Westover, T.L. Understanding biomass feedstock variability. Biofuels 2013, 4, 111–127. [Google Scholar] [CrossRef]
- Forex Capital Markets, FXCM. Available online: http://www.forex.com (accessed on 3 July 2012).
- Bai, J.; Chen, A. China to increase fuel prices 6–7 percent. Reuters: Beijing, China. Available online: http//uk.reuters.com (accessed on 3 March 2012).
- Mundi. Index Mundi: Country Facts. Available online: http://www.indexmundi.com (accessed on 3 June 2012).
- Cafferty, K.; Jacobson, J.; Kenny, K. Herbaceous/Biochem Feedstock 2013 State of Technology Report; Idaho National Laboratory: Idaho Falls, ID, USA, 2013. [Google Scholar]
- Searcy, E.; Hess, J.R. Uniform-Format Feedstock Supply System Design for Lignocellulosic Biomass: A Commodity-Scale Design to Produce an Infrastructure-Compatible Biocrude from Lignocellulosic Biomass; Idaho National Laboratory: Idaho Falls, ID, USA, 2009. [Google Scholar]
- Jacobson, J.J.; Roni, M.S.; Cafferty, K.; Kenney, K.; Searcy, E.; Hansen, J.K. Biomass Feedstock Supply System Design and Analysis; Idaho National Laboratory: Idaho Falls, ID, USA, 2014. [Google Scholar]
© 2015 by the authors; licensee MDPI, Basel, Switzerland. This article is an open access article distributed under the terms and conditions of the Creative Commons Attribution license (http://creativecommons.org/licenses/by/4.0/).


