
Analysis of Medium-Scale Solar Thermal Systems and Their Potential in Lithuania

Abstract
:
1. Introduction


| Size of installed solar collector array | Annual heat energy production | Cost of heat energy | |
|---|---|---|---|
| m² | MW | MWh | €/kWh, FOB |
| 500 | 0.35 | 250 | 0.09 |
| 1000 | 0.70 | 500 | 0.07 |
| 5000 | 3.50 | 2500 | 0.05 |
| 10000 | 7.00 | 5000 | 0.03 |
| 20000 | 14.00 | 10000 | 0.02 |
2. Results
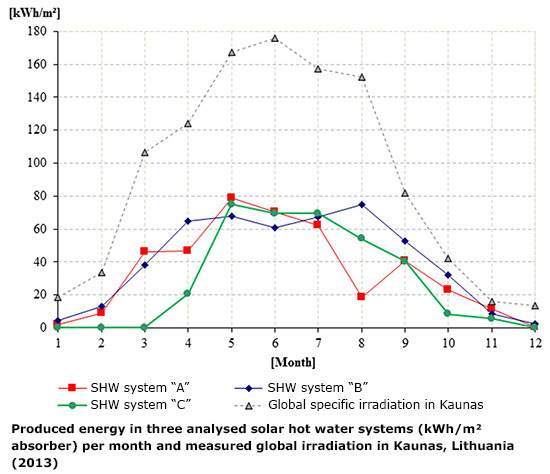
2.1. Energy Production Data
| SHW system | Measured annual energy production (2013) | Theoretical annual energy production (T*SOL Pro 5.0, standard year) | ||
|---|---|---|---|---|
| kWh | kWh/m2 absorber | kWh | kWh/m2 absorber | |
| “A” | 63630 | 411 * | 68621 | 443 |
| “B” | 51680 | 488 | 46568 | 439 |
| “C” | 24700 | 343 | 25335 | 352 |

2.2. Financial Analysis of the Projects
- C0—initial investment, €;
- Ci—cash flow, €;
- r—discount rate, %;
- T—time period, years.
- ra—lower discount rate chosen (approximated), %;
- rb—higher discount rate chosen (approximated), %;
- NPVa—NPV at ra value [€];
- NPVb—NPV at rb value [€].
| SHW system | “A” | “B” |
|---|---|---|
| Project lifetime, year | 20 | 20 |
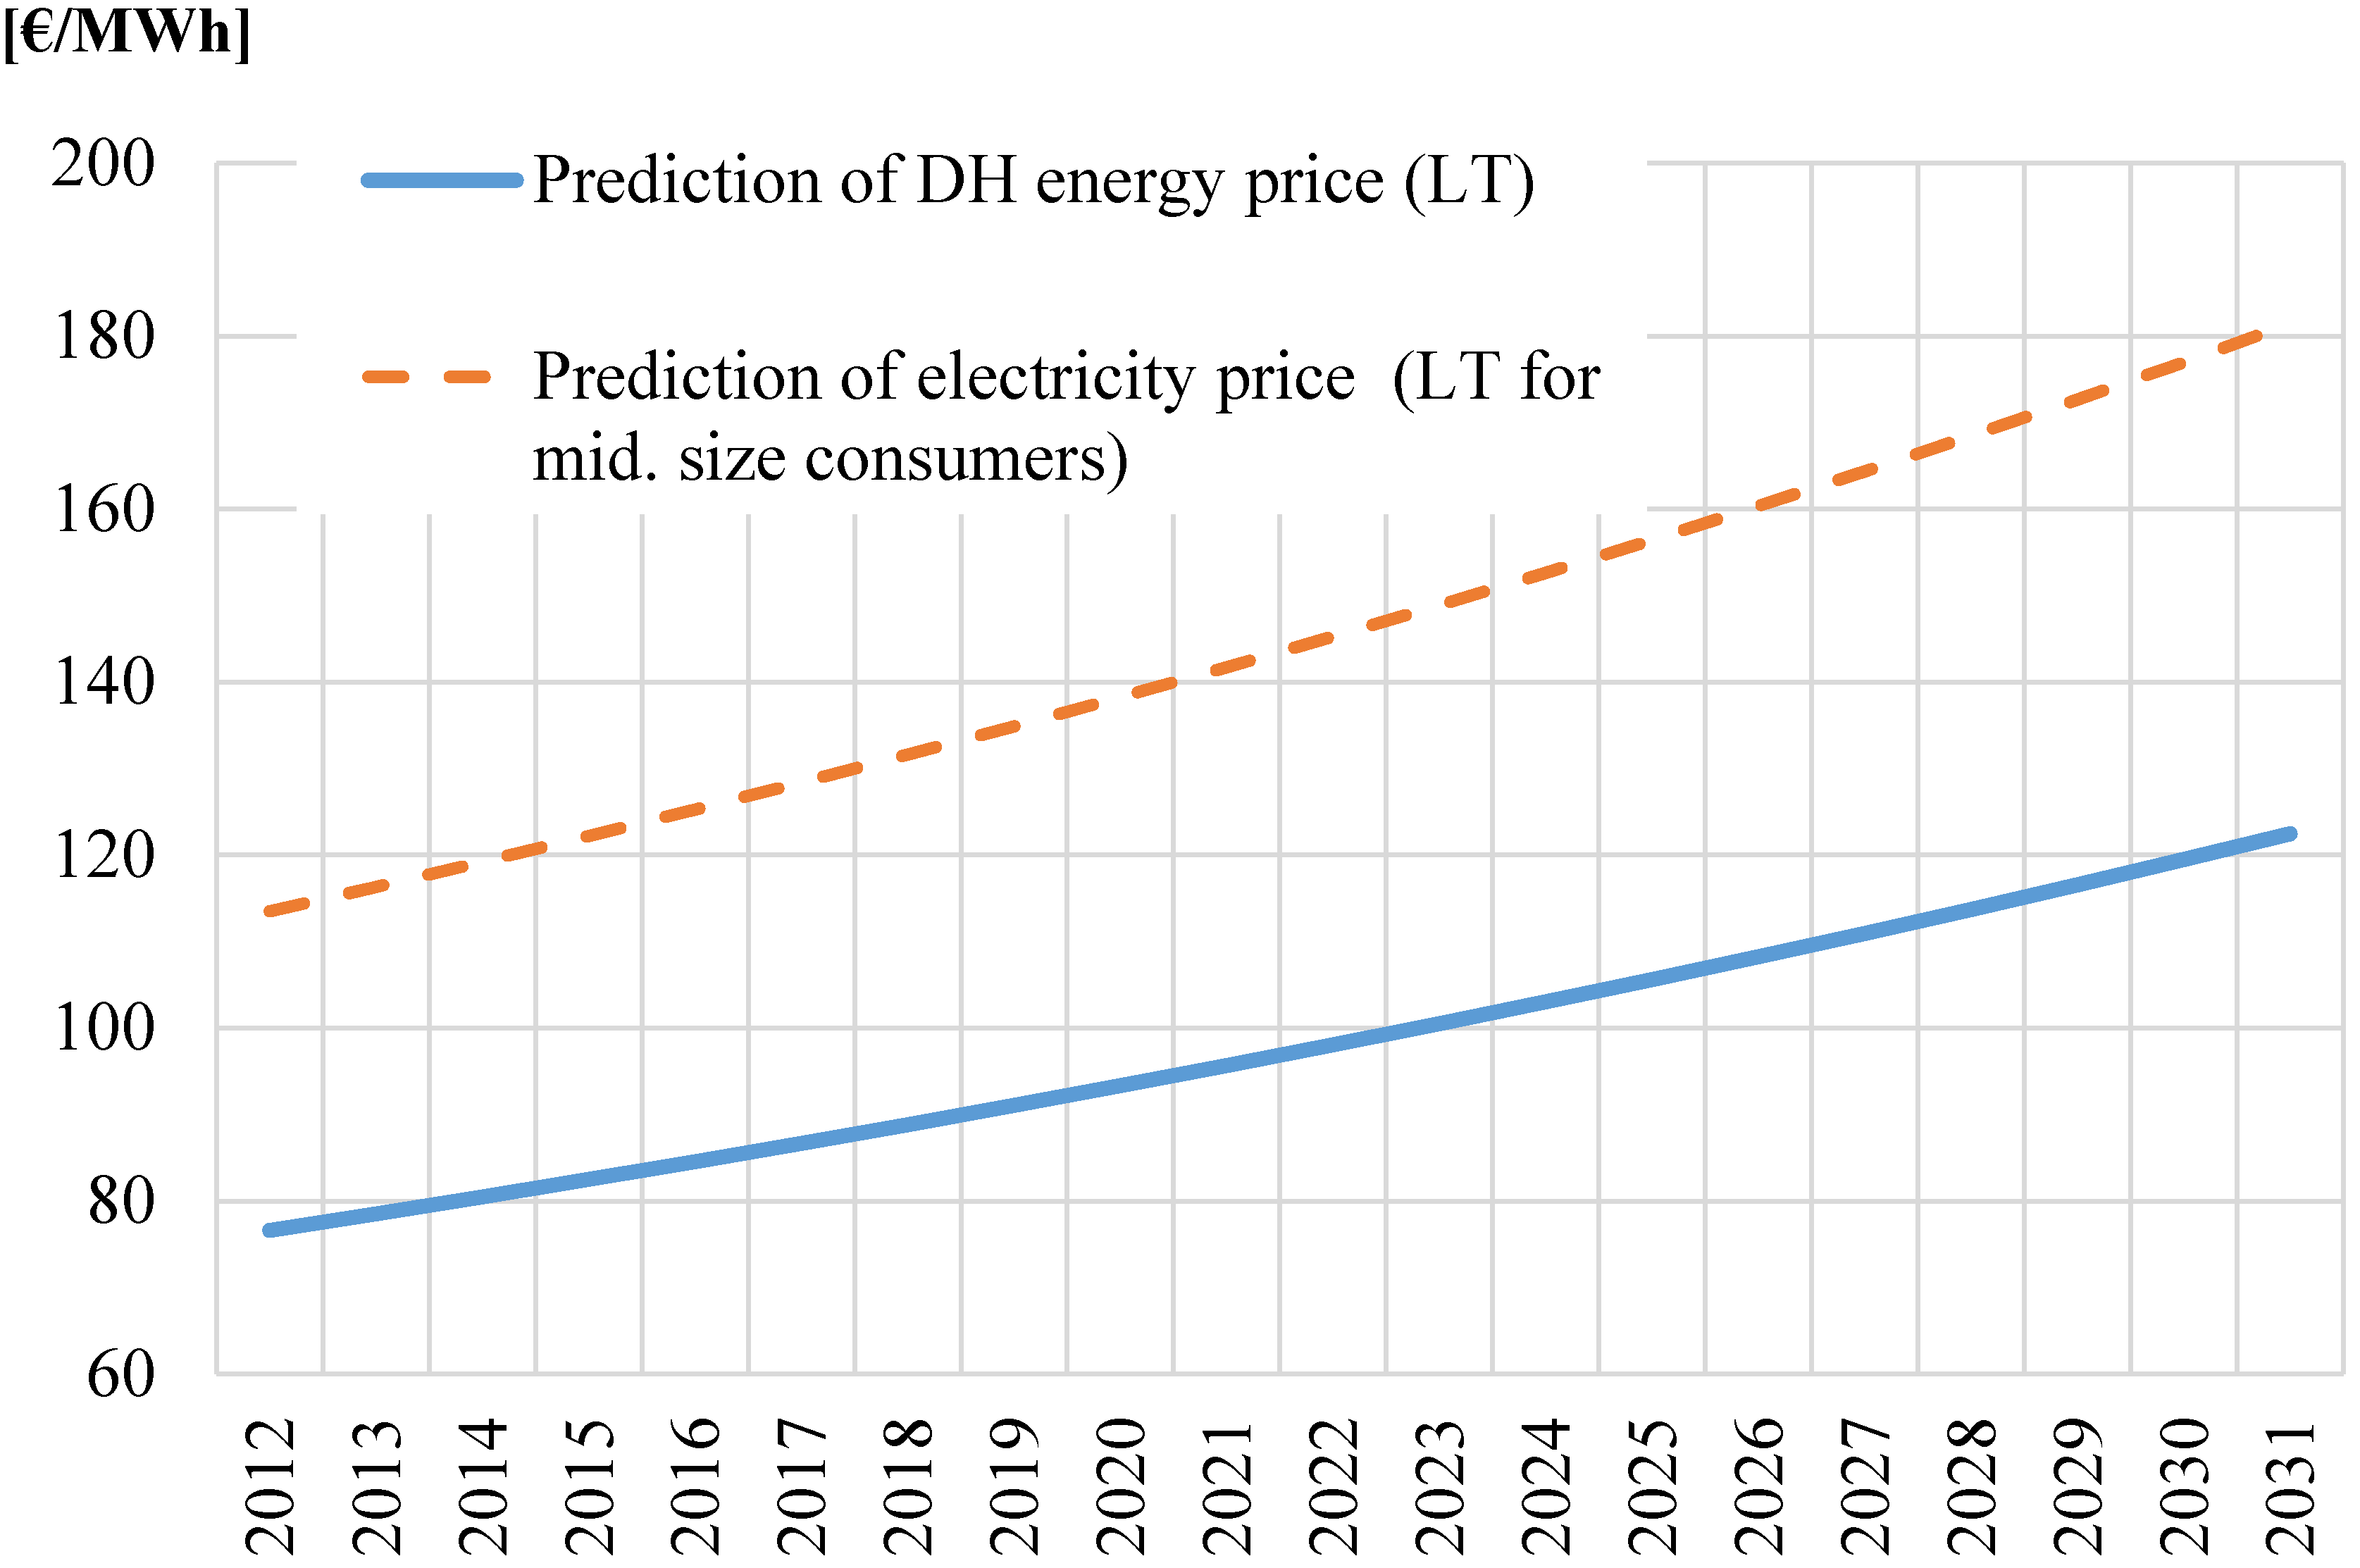
| Index for energy prices, %/year | 2.5 | 2.5 |
| Discount rate, % | 5.0 | 5.0 |
| Energy production, MWh/20 years | 1372 | 931 |
| Costs of propylenglycol replacement, €/20 years | 1600 | 960 |
| Costs of electricity for pumping, €/20 years | 5737 | 3893 |
| Loan (annuity), thousand €/20 years | 12.43 | 54.78 |
| Interest of loan (3% for long-term projects), thousand €/20 years | 42.81 | 18.86 |
| Financial indicator | Financial values in competition with DH energy | Financial values in competition with electrical energy | ||
|---|---|---|---|---|
| System “A” | System “B” | System “A” | System “B” | |
| Investment, €/m2 | 749 | 516 | 749 | 516 |
| NPV, € | 45559 | 30473 | 84290 | 52814 |
| IRR, % | −2.8 | 0.0 | 1.5 | 4.6 |

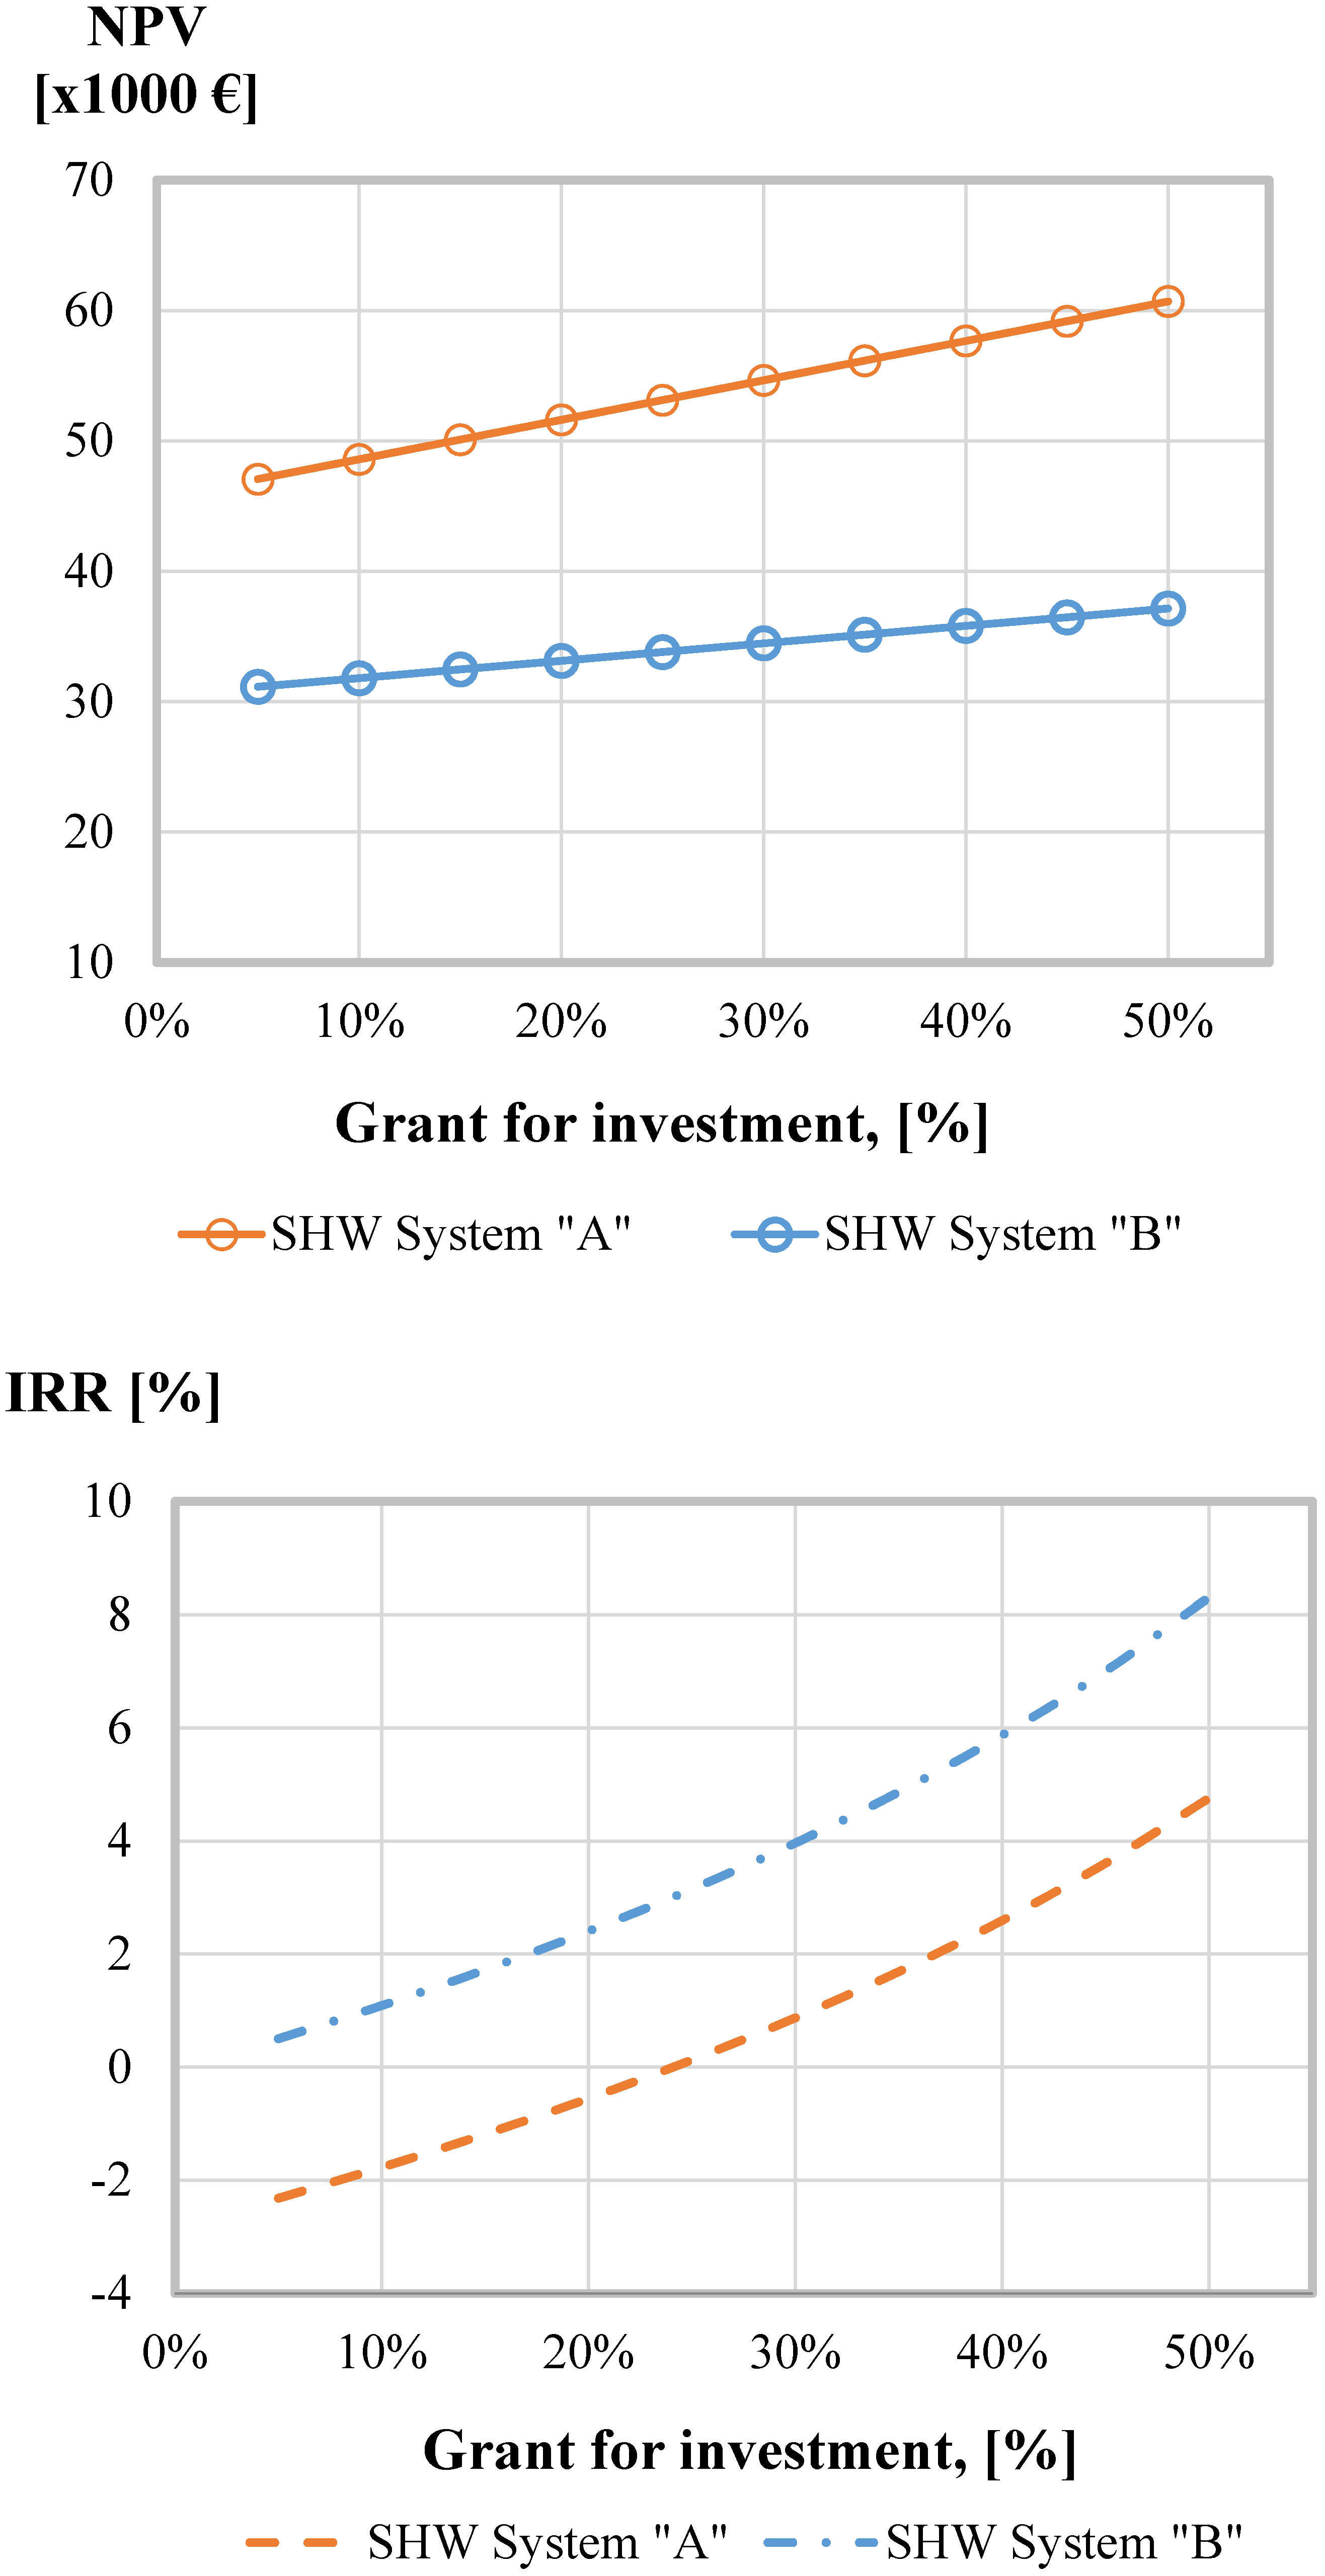
2.3. Grant Requirement for Solar Thermal Systems Profitability

3. Methodology
- System “A” is installed in the swimming pool building in Anykščiai (55°32'0" N/25°6'0"E) and the solar energy is used for hot water heating as well as swimming pool heating. The system consists of 65 flat type solar collectors (155 m2) with 45° inclination angle to the horizon and 10° angle to the East. The heat is stored in five hot storage tanks of 1 m3 and the power of the heat exchanger used for the swimming pool of 600 m3 is 297 kW. Daily hot water consumption in this building varies in the range of 4 m3 ± 10%.
- System “B” is installed in the Kruonis Pumped Storage Plant office building (54°45'18.5"N/24°14'5.12"E) and was designed for DHW heating. The system consists of 40 flat type solar collectors (106 m2) with 45° inclination angle to the horizon, orientated directly to the South. Hot water is stored in three storage tanks of 4.1 m3. Daily hot water consumption in this building varies in the range of 5 m3 ± 20% during work days and around 2 m3 during weekends.
- System “C” is installed as a part of the district heating system in Dūkštas (54°50'0" N/24°58'0" E) and was initially used for hot water heating. The system was rebuilt in 2012 and is currently used for preheating the return water in the district heating network. The system consists of 36 “U-pipe” evacuated tube collectors (82 m2) with 45° inclination angle to horizon, orientated directly to the South. Primary investments were 100.8 thousand €, however, the system was upgraded few times due to improper operation and the total investment is unknown.
| SHW system | “A” | “B” | “C” |
|---|---|---|---|
| Type of solar collectors | Flat plate | Flat plate | Evacuated tube |
| Total absorber area—Aabsorber, m2 | 155 | 106 | 72 |
| Total gross area—Agross, m2 | 166 | 114 | 82 |
| Optical efficiency of collector—η0 | 0.80 | 0.78 | 0.64 |
| Linear heat transfer coefficient—k1,W/m2·K2 | 3.872 | 3.545 | 0.885 |
| Square heat transfer coefficient—k2,W/m2·K2 | 0.014 | 0.011 | 0.001 |
| Total investment—Itotal, thousand € | 124.3 | 54.8 | n/a |
| Investment per 1 m2 absorber area—Iper m² absorber, € | 749 | 516 | n/a |
4. Conclusions and Discussion
- The results of the analysis presented in this study showed that medium scale SHW systems with solar flat plate and evacuated tube collectors can produce from 343 to 488 kWh/m2 heat energy in the case when the efficiency of these systems varies in the range of 24 to 44%. Considering solar gain of 343 kWh/m2 per year and efficiency of 24%, the district heating system from return pipe into a return pipe proved to be less effective compared to local SHW applications.
- SHW systems with evacuated tube collectors does not reach the additional expected energy yield. In general, both collector types are suitable for SHW systems in Central European Climates. Moreover, it was estimated that the large SHW systems can produce from 323 to 465 kWh/m2 annually even at Nordic climate conditions.
- The gap between measured and modelled data of heat energy produced by SHW systems was approx. 11% in the analysed cases. It can either be caused by differences in actual solar irradiation compared to the standard average data, or some peculiarities of the design and maintenance of the SHW systems.
- The economic analysis showed that the IRR for analysed projects varies from −7.1% to 4.6%. Grant of 35% investment makes the system “B” fully profitable (IRR = 5.0%).
Author Contributions
Conflicts of Interest
References
- Renewables Global Status Report. 2014. Available online: http://www.ren21.net/gsr (accessed on 5 February 2015).
- Solar Thermal Markets in Europe—Trends and Market Statistics 2013. Available online: http://www.estif.org/statistics (accessed on 6 February 2015).
- Caouris, Y.G.; Rocco, P.; Zucchetti, M. Situation and perspectives for solar energy in Europe and a comparison with nuclear energy, after fukushima. Fresenius Environ. Bull. 2012, 21, 3301–3311. [Google Scholar]
- Ayompe, L.M.; Duffy, A. Analysis of the thermal performance of a solar water heating system with flat plate collectors in a temperate climate. Appl. Thermal Eng. 2013, 58, 447–454. [Google Scholar] [CrossRef]
- Sakhrieh, A.; Al-Ghandoor, A. Experimental investigation of the performance of five types of solar collectors. Energy Convers. Manag. 2013, 65, 715–720. [Google Scholar] [CrossRef]
- Koroneos, C.J.; Nanaki, E.A. Life cycle environmental impact assessment of a solar water heater. J. Clean. Prod. 2012, 37, 154–161. [Google Scholar] [CrossRef]
- Hugo, A.; Zmeureanu, R. Residential solar-based seasonal thermal storage systems in cold climates: Building envelope and thermal storage. Energies 2012, 5, 3972–3985. [Google Scholar] [CrossRef]
- Hassine, I.B.; Eicker, U. Impact of load structure variation and solar thermal energy integration on an existing district heating network. Appl. Thermal Eng. 2013, 50, 1437–1446. [Google Scholar] [CrossRef]
- Lauterbach, C.; Schmitt, B.; Jordan, U.; Vajen, K. The potential of solar heat for industrial processes in Germany. Renew. Sustain. Energy Rev. 2012, 16, 5121–5130. [Google Scholar] [CrossRef]
- Augsten, E. Norway: Solar Collectors Support District Heating. Available online: http://solarthermalworld.org/content/norway-solar-collectors-support-district-heating (accessed on 10 December 2014).
- International Energy Agency. Country Report—Sweden: Status of Solar Heating/Cooling and Solar Buildings—2014. Available online: http://www.iea-shc.org/country-report-sweden (accessed on 10 December 2014).
- Solar Local district heating. Success Factors in Solar Districk Heating. Available online: http://www.solar-district-heating.eu/Portals/0/SDH-WP2-D2-1-SuccessFactors-Jan2011.pdf (accessed on 17 December 2014).
- Denmark: Dronninglund Inaugurates 26 MWth Solar District Heating Plant. Available online: http://solarthermalworld.org/content/denmark-dronninglund-inaugurates-26-mwth-solar-district-heating-plant (accessed on 5 February 2015).
- New Solar Technology Holds Big Potential. Available online: http://www.niras.com/ current-events/news/2014/new-solar-technology-holds-big-potential.aspx (accessed on 5 February 2015).
- Perednis, E.; Kavaliauskas, A.; Plikšienė, V. Karšto vandens ruošimo naudojant saulės kolektorius efektyvumo tyrimai. Energetika 2007, 1, 34–38. [Google Scholar]
- Jonynas, R.; Valančius, R. The Comparison of Two Different Solar Collectors Systems. In Proceedings of the EuroSun 2010 the International Conference on Solar Heating, Cooling and Buildings, Graz, Austria, 28 September–1 October, 2010; pp. 1–8.
- Adomavičius, V. Atsinaujinančiųjų energijos išteklių naudojimo galimybės daugiabučiuose namuose. Lietuvos Taikomųjų Mokslų Akademijos Mokslo Darbai: Tarptautinis Inovacinis Taikomųjų Mokslo Darbų Žurnalas = Off. J. Lithuanian Appl. Sci. Acad. 2010, 6, 107–122. Available online: http://gjstudija.net/ltma/ltma-darbai/Str-VA-Daugiabuciai.pdf (accessed on 8 June 2015). [Google Scholar]
- Trinkl, C.; Zörner, W.; Alt, C.; Stadler, C. Performance of Vacuum Tube and Flat Plate Collectors Concerning Domestic Hot Water Preparation and Room Heating. In Proceedings of the 2nd European Solar Thermal Energy Conference, Freiburg, Germany, 21–22 June 2005.
- Ambrulevičius, R. Exploitation Peculiarities of Sun Collectors Systems; LŽŪU ŽŪI Instituto ir LŽŪ Universiteto Mokslo Darbai: Raudondvaris, Lithuania, 2005; Volume 37, pp. 54–69. [Google Scholar]
- Jonynas, R.; Valančius, R.; Šuksteris, V.; Perednis, E.; Mekas, G. Study of medium scale solar water heating plants in Lithuania. In Proceedings of the SES Solar World Congress, Kassel, Germany, 28 August–2 September, 2011; pp. 921–927.
- Andrews, D. Background Report on EU-27 District Heating and Cooling Potentials, Barriers, Best Practice and Measures of Promotion. EC Joint Research Centre; Publications Office of the European Union: Luxembourg, Luxembourg, 2012; Available online: https://setis.ec.europa.eu/system/files/JRCDistrictheatingandcooling.pdf (accessed on 8 February 2015).
- Olivier, D.; Simmonds, A. Less Is More: Energy Security after Oil. Available online: http://www.sustainabilitywestmidlands.org.uk/wp-content/uploads/LessIsMoreEnergySecurityAfterOil.pdf (accessed on 8 February 2015).
- Katinas, V.; Karbauskaitė, J.; Perednis, E.; Valančius, R. Efficiency analysis of combined biomass and solar energy in Lithuania. Clean Technol. Environ. Policy 2013, 15, 667–676. [Google Scholar] [CrossRef]
- Karbauskaitė, J.; Perednis, E. Kačerginės vaikų sanatorijos šilumos energijos vartojimo mažinimo galimybės. Energetika 2011, 57, 20–25. [Google Scholar] [CrossRef]
© 2015 by the authors; licensee MDPI, Basel, Switzerland. This article is an open access article distributed under the terms and conditions of the Creative Commons Attribution license (http://creativecommons.org/licenses/by/4.0/).
Share and Cite
Valančius, R.; Jurelionis, A.; Jonynas, R.; Katinas, V.; Perednis, E. Analysis of Medium-Scale Solar Thermal Systems and Their Potential in Lithuania. Energies 2015, 8, 5725-5737. https://doi.org/10.3390/en8065725
Valančius R, Jurelionis A, Jonynas R, Katinas V, Perednis E. Analysis of Medium-Scale Solar Thermal Systems and Their Potential in Lithuania. Energies. 2015; 8(6):5725-5737. https://doi.org/10.3390/en8065725
Chicago/Turabian StyleValančius, Rokas, Andrius Jurelionis, Rolandas Jonynas, Vladislovas Katinas, and Eugenijus Perednis. 2015. "Analysis of Medium-Scale Solar Thermal Systems and Their Potential in Lithuania" Energies 8, no. 6: 5725-5737. https://doi.org/10.3390/en8065725