1. Introduction
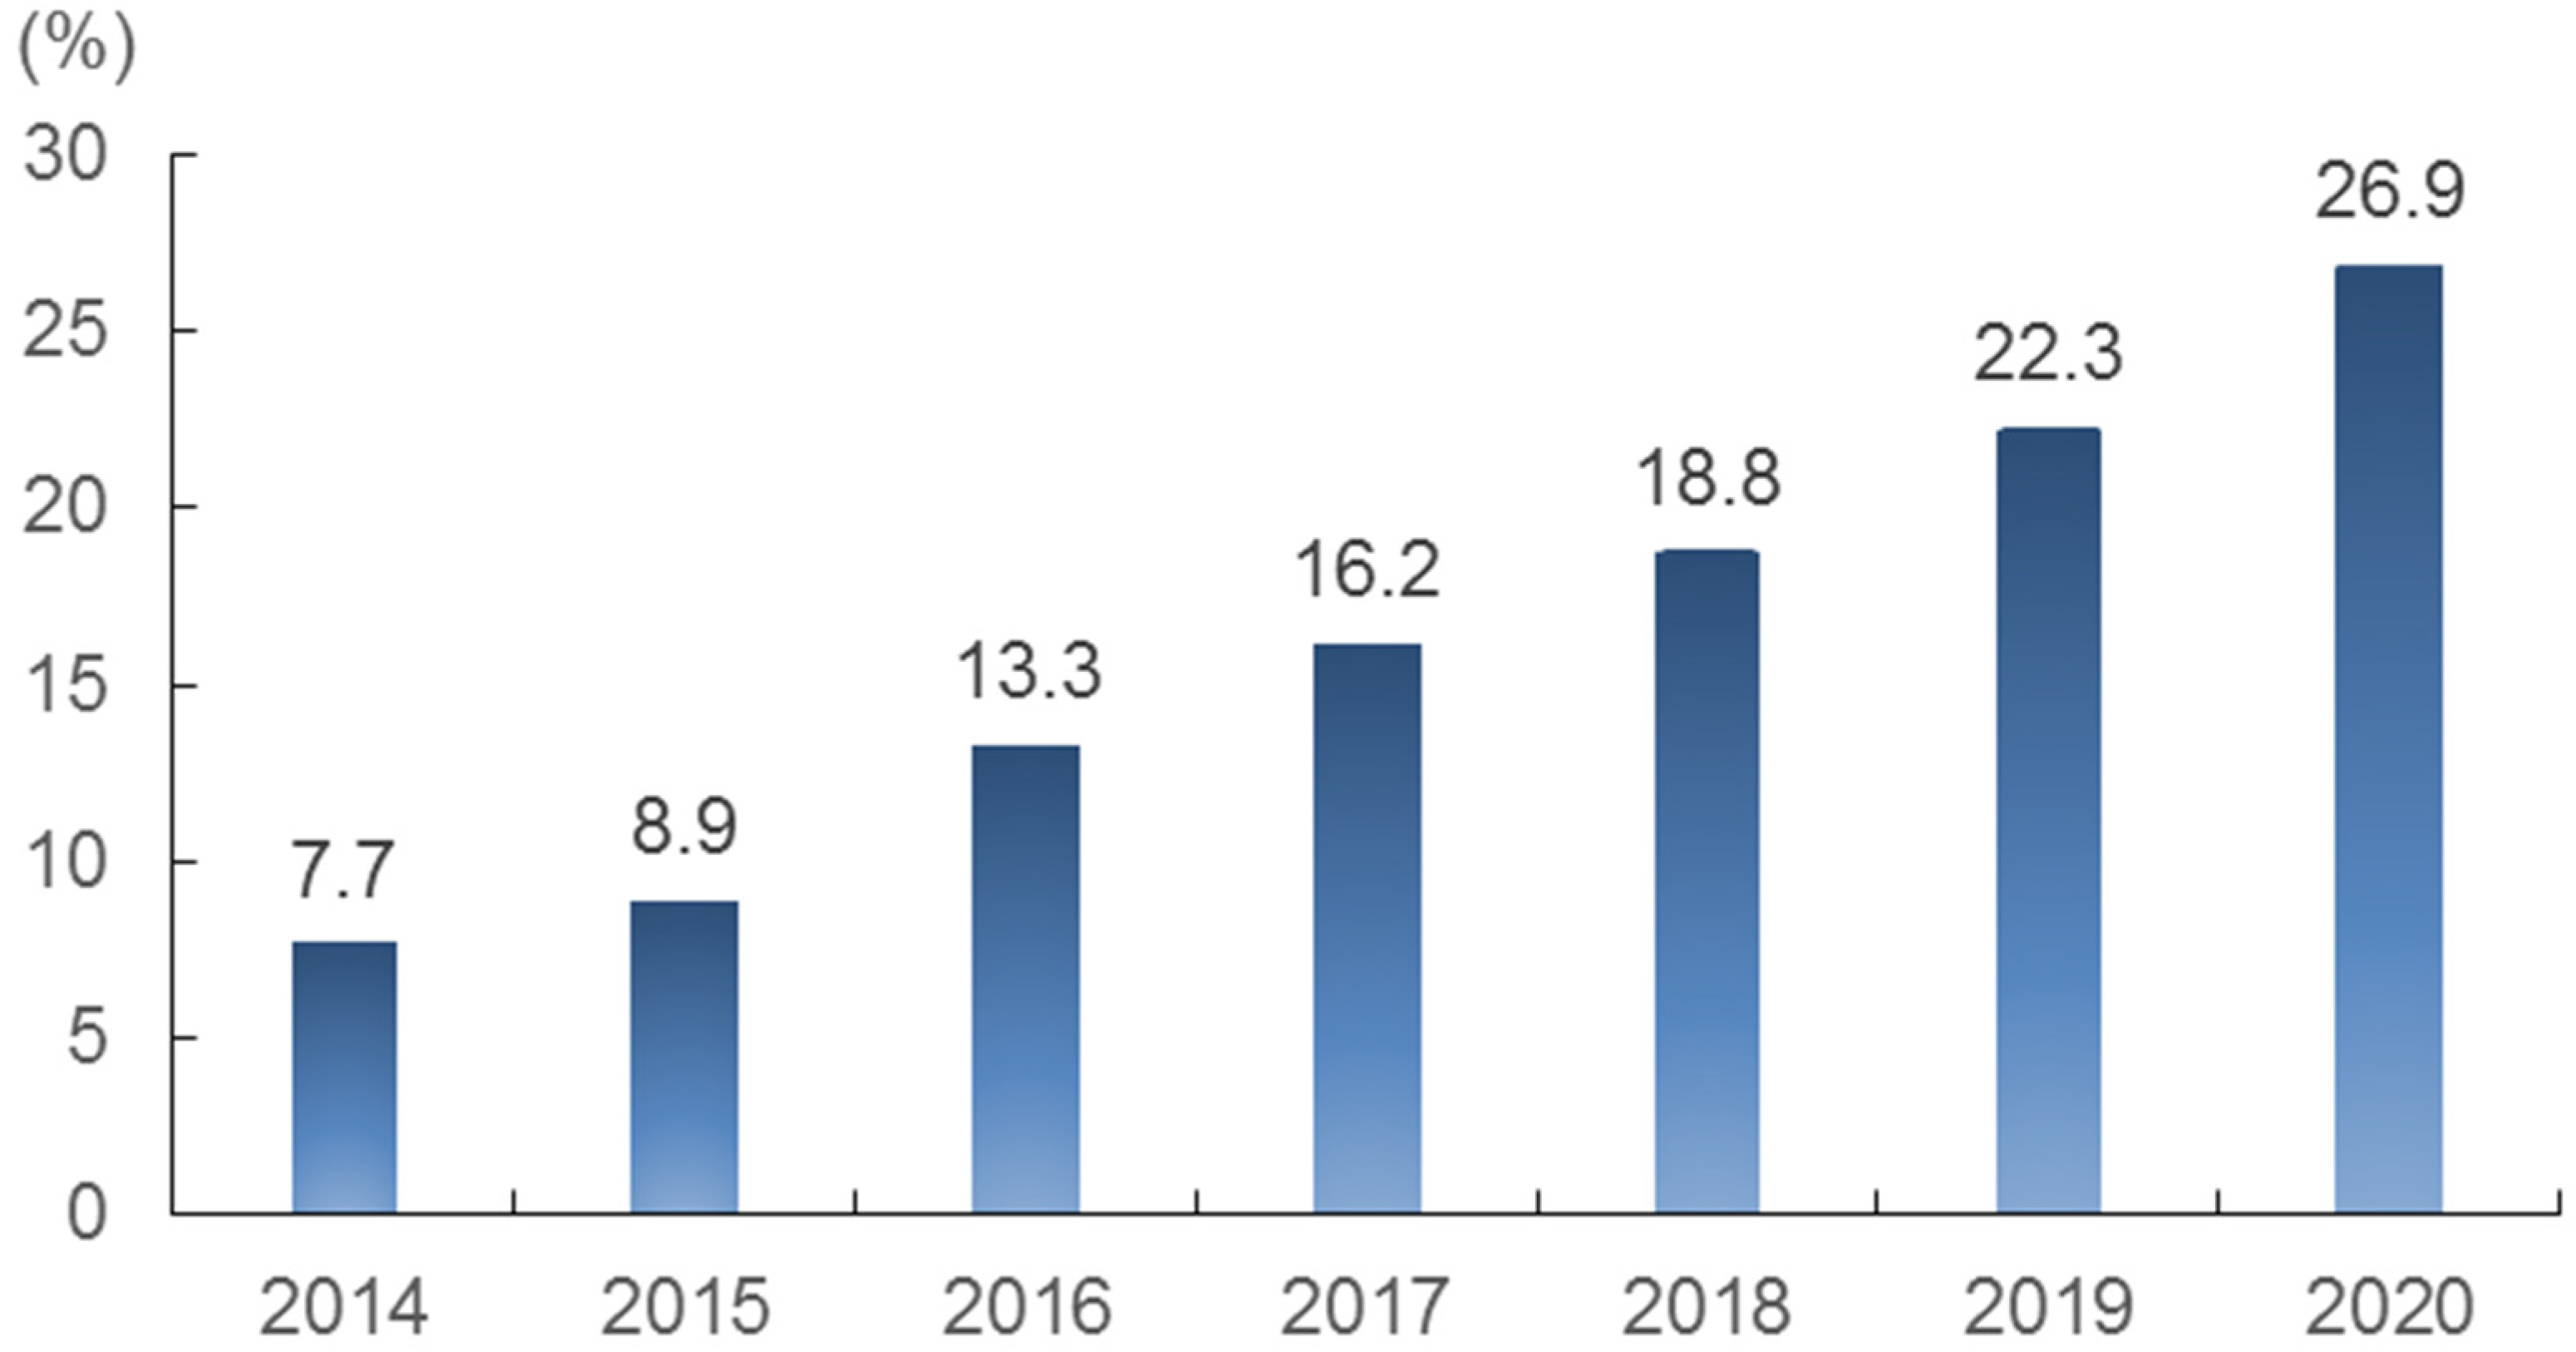
In response to the climate change crisis, and keeping pace with international trends, South Korea passed and amended in 2013 the Low Carbon Green Growth Basic Act and its subordinate acts, specifying the goal of reducing national greenhouse gas by 30% from the 2020 business-as-usual (BAU) level. As part of this goal, South Korea set a goal to reduce greenhouse gas by 26.9% in the building sector by 2020 relative to the BAU level (
Figure 1), including active pursuits to raise standards in insulation, high-efficiency heat source equipment, light emitting diode (LED) lighting distribution, and renewable energy distribution [
1].
Figure 1.
Greenhouse gas reduction goal in building sector (relative to 2020 BAU level).
Figure 1.
Greenhouse gas reduction goal in building sector (relative to 2020 BAU level).
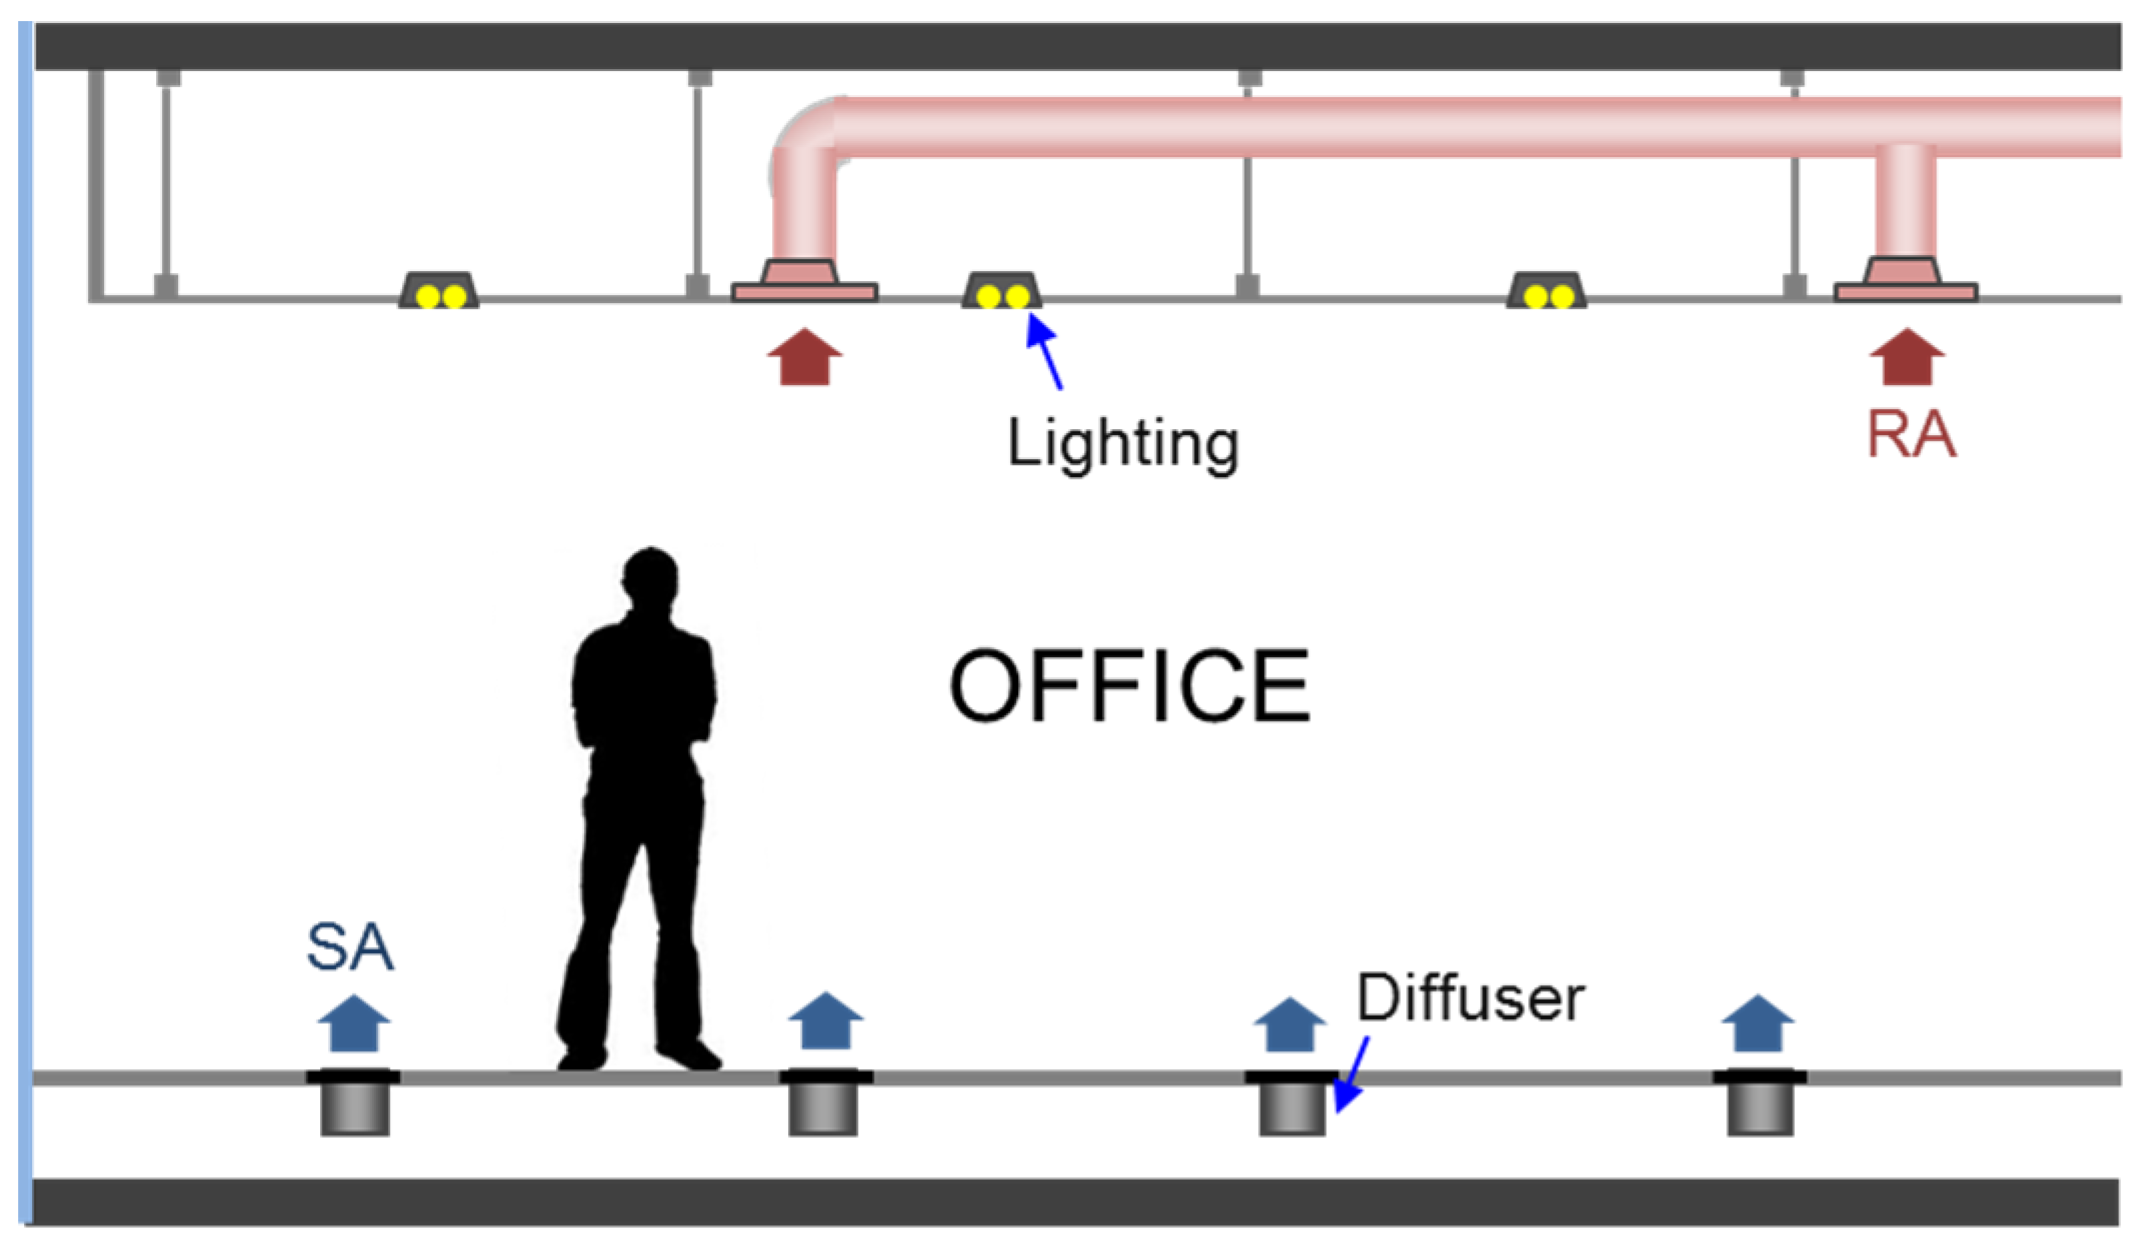
Lately, among the diverse technologies being applied to increase buildings’ energy efficiency, there has been an increasing trend in the application of floor air supply systems as occupied-zone air conditioning systems. While a ceiling-based air distribution system (CBAD,
Figure 2), a conventional air conditioning system, targets whole indoor spaces for air conditioning, an under-floor air distribution system (UFAD,
Figure 3) targets only portions of occupied spaces to a height of approximately 1.8 m above the floor. Thus, UFADs have relatively smaller heating and cooling loads compared with CBADs, and thus have less load for air supply flow or air supply temperature, saving energy and providing comfort; UFADs are also known to be advantageous in terms of flexible space use [
2,
3,
4].
In the field of UFAD studies, energy reduction efficiency and indoor thermal comfort are the areas of primary focus. Lee
et al. showed in their study that, when UFAD was applied, setting the supply air temperature higher decreased the cold draft in the occupied area, but the energy consumption of the blower fan and heating coil increased, thus increasing the overall energy consumption [
5]. Ali Alajmi
et al. showed that when UFAD was applied, the higher the ceiling height and the lower the supply air temperature, the better the building performed in terms of energy efficiency relative to CBAD [
6].
Figure 2.
Ceiling-based air distribution system concept.
Figure 2.
Ceiling-based air distribution system concept.
Figure 3.
Under-floor air distribution system concept.
Figure 3.
Under-floor air distribution system concept.
Also, many reports have been made on the influence of various factors upon thermal comfort: the types and layouts of floor air supply diffusers, supply air temperature and air flow,
etc. Josephine Lau
et al. showed, through a study on the diverse factors that influence the indoor thermal environment, that the ventilation efficiency increases with floor-supply displacement ventilation in the occupied area, compared with mixing systems, but that it might cause discomfort around the diffuser area due to temperature stratification [
7]. Bos
et al. reported, through an investigation combining field measurement and a questionnaire on UFAD-conditioned office spaces, that 90% or more occupants were satisfied in terms of thermal comfort and that only 15% wanted it cooler [
8].
Chenvidyakarn
et al. divided the internal heating load conditions into localized heat sources and distributed heat sources in the occupied areas. This supplied the optimum air flow according to such load ratios, thereby providing the potential to ensure the correct indoor ventilation amount and keep thermal comfort [
9]. In other words, they proved that the internal heating load and layout directly influences the occupants’ thermal comfort.
On the other hand, our team confirmed in previous studies the result that energy consumption did not vary with UFAD and CBAD for changes of cooling loads in an occupied area. However, in unoccupied areas with varying cooling loads from lighting equipment, with UFAD, energy consumption was reduced by a maximum of 17.7% relative to CBAD [
10]. In other words, by considering the placement of cooling loads of occupied areas and unoccupied areas, more reasonable air conditioning (A/C) systems could be appointed in terms of their energy savings.
The purpose of this study is to provide quantitative and foundational resource to refer to when appointing air handling systems, allowing a determination of whether UFAD or CBAD is more appropriate given expected load characteristics. In this study we compare and analyze CBAD and UFAD systems, specifically studying the effects of supply air flow changes and of heat emission from lighting equipment in the unoccupied area upon indoor thermal comfort.
2. Experimental Setup and Procedure
To compare the effects of CBAD and UFAD upon thermal comfort according for various conditions of internal thermal load, an experimental chamber was used. The specifications of the chamber are listed in
Table 1. The exterior wall for the experimental chamber comprised sandwich panels filled with 100 mm-thick urethane foam insulation material, with separate heating, ventilating, air conditioning (HVAC) equipment installed in the surrounding office, minimizing the influence of weather.
Figure 4 and
Figure 5 show plan and section views of the chamber installed in the office, respectively.
Table 1.
Specifications of the chamber.
Table 1.
Specifications of the chamber.
| Item | Specification |
|---|
| Size (width × length × height) | 3.6 m × 3.6 m × 2.7 m |
| Depth of underfloor plenum | 0.5 m |
| Number of ceiling diffusers | 2 supply and 2 return |
| Number of underfloor diffusers | 2 supply |
Figure 4.
Plan of the experimental chamber (unit: mm).
Figure 4.
Plan of the experimental chamber (unit: mm).
Figure 5.
Section of the experimental chamber (unit: mm).
Figure 5.
Section of the experimental chamber (unit: mm).
Figure 6 shows the layout of the lighting equipment and A/C diffusers installed in the chamber’s ceiling. Each set of lighting equipment comprised three 36 W, three-wave florescent lamps equipped with dimmers and watt-hour meters, controlling the heat from the lighting. The A/C diffusers used comprised two each of supply-air (SA) and return-air (RA) inlets, each one 600 mm square, Anemostat-type diffusers were installed on each inlet.
Figure 6.
Layout of ceiling equipment (unit: mm).
Figure 6.
Layout of ceiling equipment (unit: mm).
Figure 7 shows the positions of the incandescent lights and the floor-installed air supply diffusers. Incandescent lights are applied in this experiment as the loads generated by the equipment and humans in the occupied area. The installation layout was made by assuming the center position of a seated person with a height of 60 cm off the chamber floor, and by placing six lights total in the center of the chamber.
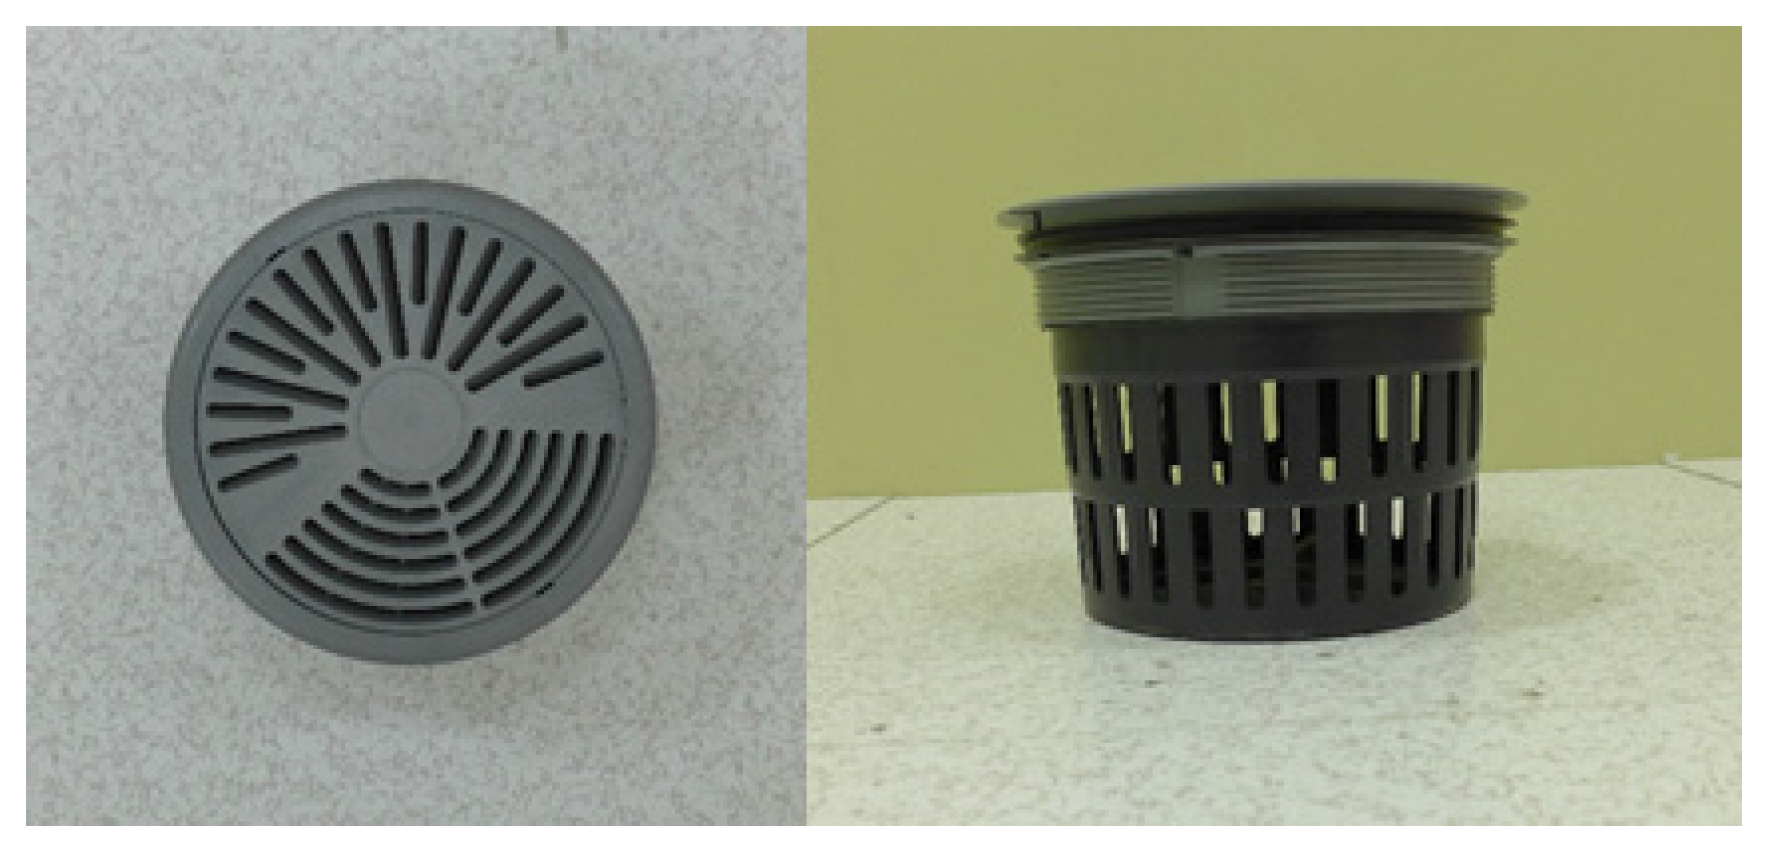
Figure 8 shows the interior chamber layout installed with the ceiling lighting, interior-use incandescent light, measuring equipment. Two rotary floor twist-outlet-type air supply diffusers were installed, as shown in
Figure 9, each with an inner diameter of 200 mm and height of 220 mm. Thus the under-floor plenum space was used as an air supply path (pressurized air supply system). The floor diffusers were located directly below the ceiling air supply diffusers and the distance between the centers of each diffuser was 2.1 m.
Figure 7.
Layout of floor equipment (unit: mm).
Figure 7.
Layout of floor equipment (unit: mm).
Figure 8.
Interior of experimental chamber.
Figure 8.
Interior of experimental chamber.
Figure 9.
Air supply diffuser (rotary floor twist outlet type).
Figure 9.
Air supply diffuser (rotary floor twist outlet type).
Figure 10 and
Table 2 show the composition and specification, respectively of the A/C system installed in the chamber. The supply air from the A/C equipment passed through two branch ducts to reach the ceiling supply diffusers and floor plenum. Each SA duct had motorized dampers installed in the middle to control whether CBAD or UFAD was used. The exhaust route was always through the RA diffusers and ducts installed in the ceiling plenum, regardless of the air supply system. The fans of the A/C system were used to control the airflow rate of SA and RA in the range of 50–350 cubic meter per hour (CMH), and the water flow rate was controlled automatically to maintain a constant supply air temperature.
Table 3 shows the types and specifications of the equipment used for each measuring item, and
Figure 11 and
Figure 12 show the installation locations. Measurements were taken at crossing points by designating two coordinates on the X axis (X1, X2), three coordinates on the Y axis (Y1, Y2, Y3), and eight coordinates on the Z axis (0.1, 0.3, 0.6, 1.2, 1.6, 2.0, 2.3, 2.6 m). Among the measured items, dry bulb temperature, black bulb thermometer, relative humidity, and air flow rate were recorded every 30s with a data logger. The airflow rate of SA and RA diffusers were measured both at the beginning and end of experiments in each condition to confirm that the set airflow rate was maintained.
Figure 10.
Diagram of chamber’s HVAC system.
Figure 10.
Diagram of chamber’s HVAC system.
Table 2.
Information on the air handling unit.
Table 2.
Information on the air handling unit.
| Item | Description |
|---|
| Cooling system | Air-cooled chiller (6.5 kW) |
| Heating system | Electric heater (2 kW) |
| Humidifier | Bar-type electrode (8 kg/h, 3 kW) |
| Fans | Supply fan (0.75 kW), exhaust fan (0.4 kW) |
| Pump | Cooled water pump (0.58 kW) |
| Air supply system | CBAD/UFAD |
| Air exhaust system | Ceiling-based air exhaust |
| Floor diffuser | Rotary floor twist outlet type (200 Φ), 2 each |
Table 3.
Itemized equipment and specifications.
Table 3.
Itemized equipment and specifications.
| Item | Equipment | Specification |
|---|
| Dry bulb temperature | Thermocouple | T type |
| Black bulb temperature | Black bulb, thermocouple | T type |
| Relative humidity | Thermo-hygrometer (THT-B121, THP-B4T) | −10–80 °C (±0.5 °C), 20%–95% (±3%) |
| Air flow speed | Hot-wire anemometer(6332D, 0964-02) | 0.1–50 m/s (0.01 m/s) |
| Diffuser air flow | Air flow meter (8375) | 42–4250 CMH (±3%) |
| Data | Data logger (3497A) | 60 channels (0.0003%) |
Figure 11.
Location of measuring points (plan) (unit: mm).
Figure 11.
Location of measuring points (plan) (unit: mm).
Table 4 shows the experimental conditions set to compare the use of CBAD and UFAD in the indoor thermal environment; the other experimental variables were the supply air flow and the heat gain by the ceiling lighting. The supply airflow rate refers to the airflow rate for one diffuser on the ceiling or floor; three conditions of supply airflow rate were used (100, 125, 150 CMH). Lighting power density is the power of the lighting equipment installed in the ceiling, divided by the chamber floor area; five conditions of lighting power density were used (0, 10, 20, 30, 40 W/m
2) considering the cases of various type of commercial buildings, including office (10 W/m
2) and department store (40 W/m
2). Then, we conducted an experiment for the 30 cases varying the A/C system, supply air flow, and lighting power density. The internal load was set to 43.2 W/m
2 to represent the cooling load from equipment (20 W/m
2) and occupancy (15–30 W/m
2) along with the heat from incandescent lighting. Supply air temperature means the discharge temperature of the supply diffuser; it was kept at 18 °C for both CBAD and UFAD by controlling the cold water flow rate of the A/C equipment. Also, the experiment was conducted on the assumption that all air was circulated without any fresh air intake from outside.
Figure 12.
Location of measuring points (section) (unit: mm).
Figure 12.
Location of measuring points (section) (unit: mm).
Table 4.
Experimental conditions.
Table 4.
Experimental conditions.
| Air distribution system | Case No. | Supply airflow rate (CMH) | Lighting power density (W/m2) | Heat load in occupied area (W/m2) | Supply air temperature (°C) |
|---|
| Ceiling-based air distribution system | CBAD-1 | 100 | 0, 10, 20, 30, 40 | 43.2 | 18 |
| CBAD-2 | 125 |
| CBAD-3 | 150 |
| Under-floor air distribution system | UFAD-1 | 100 |
| UFAD-2 | 125 |
| UFAD-3 | 150 |
3. Results and Discussion
3.1. Indoor Vertical Temperature Distribution
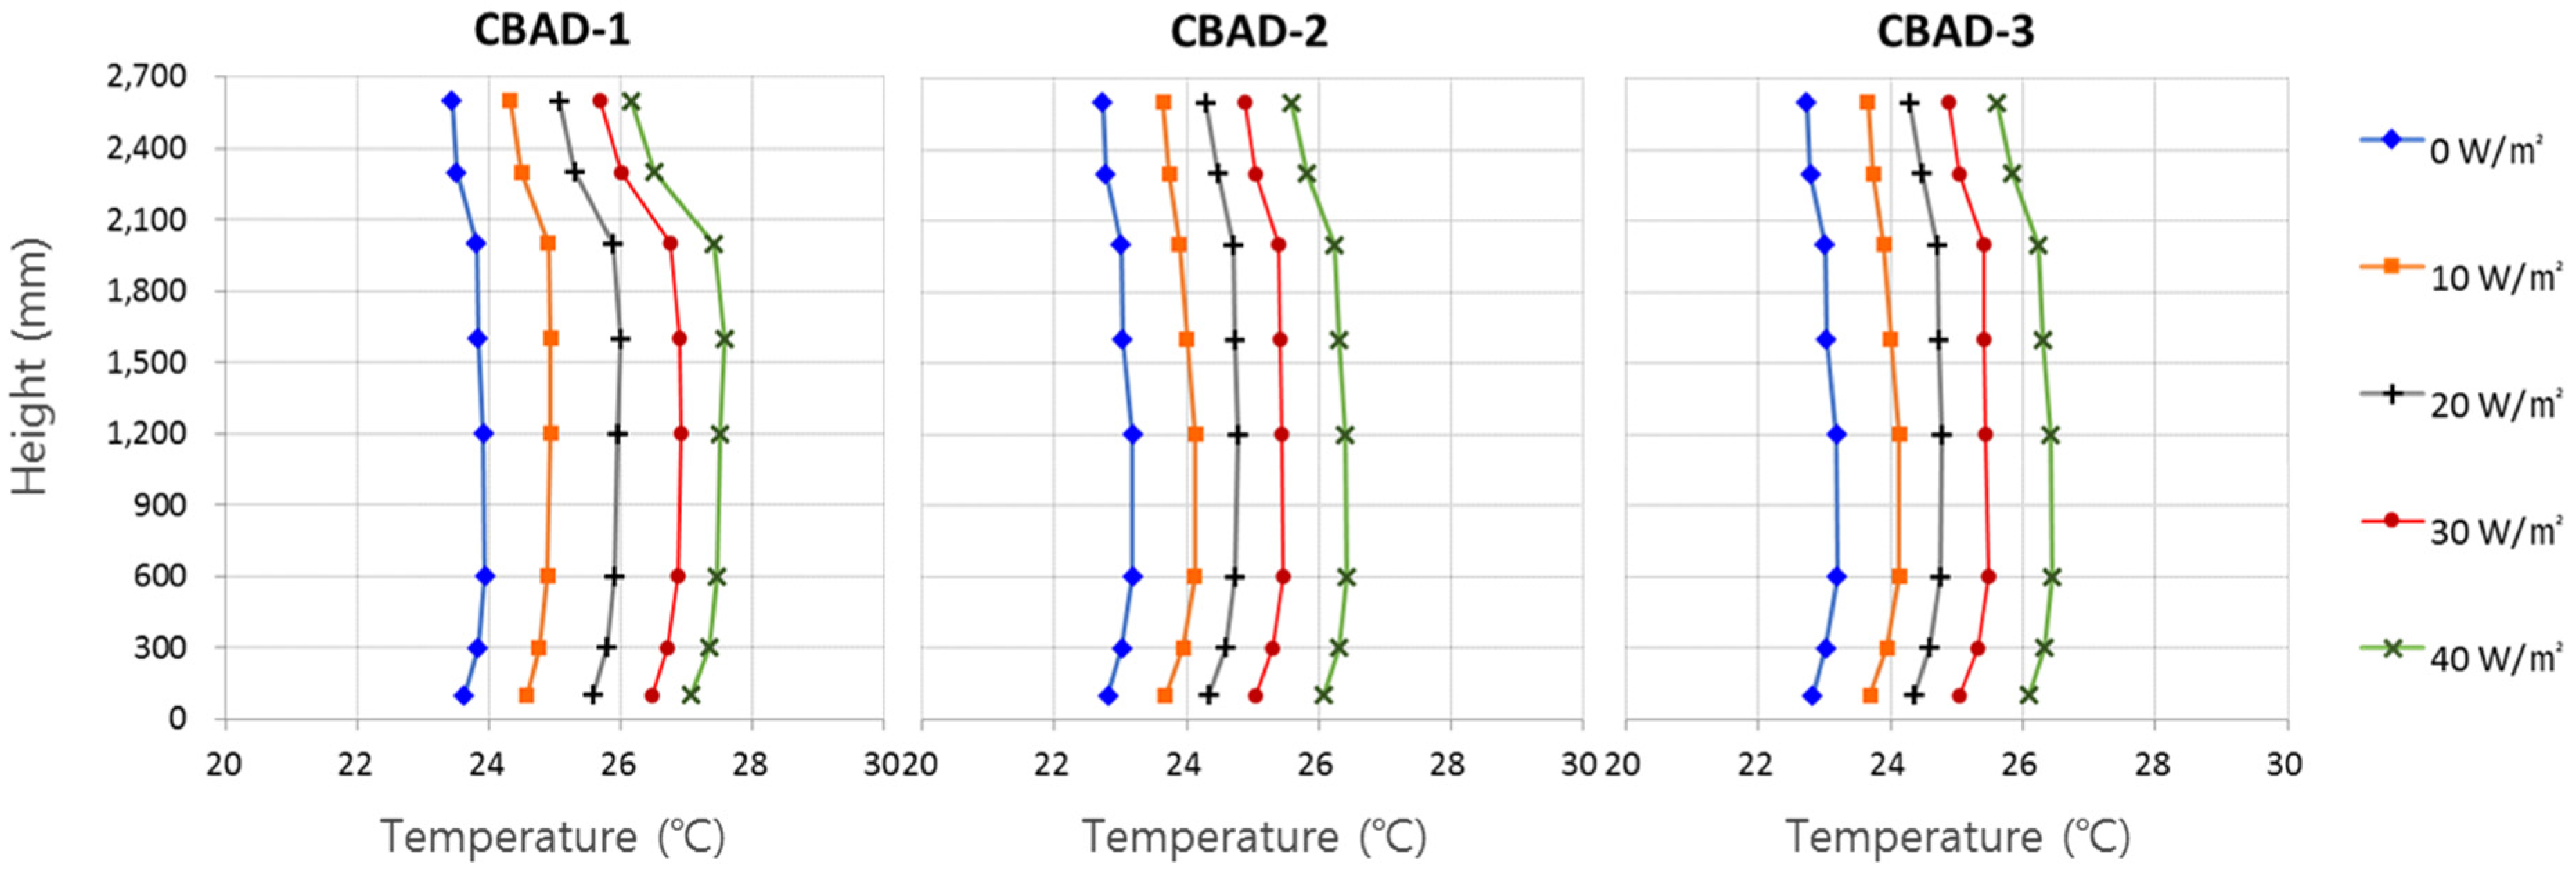
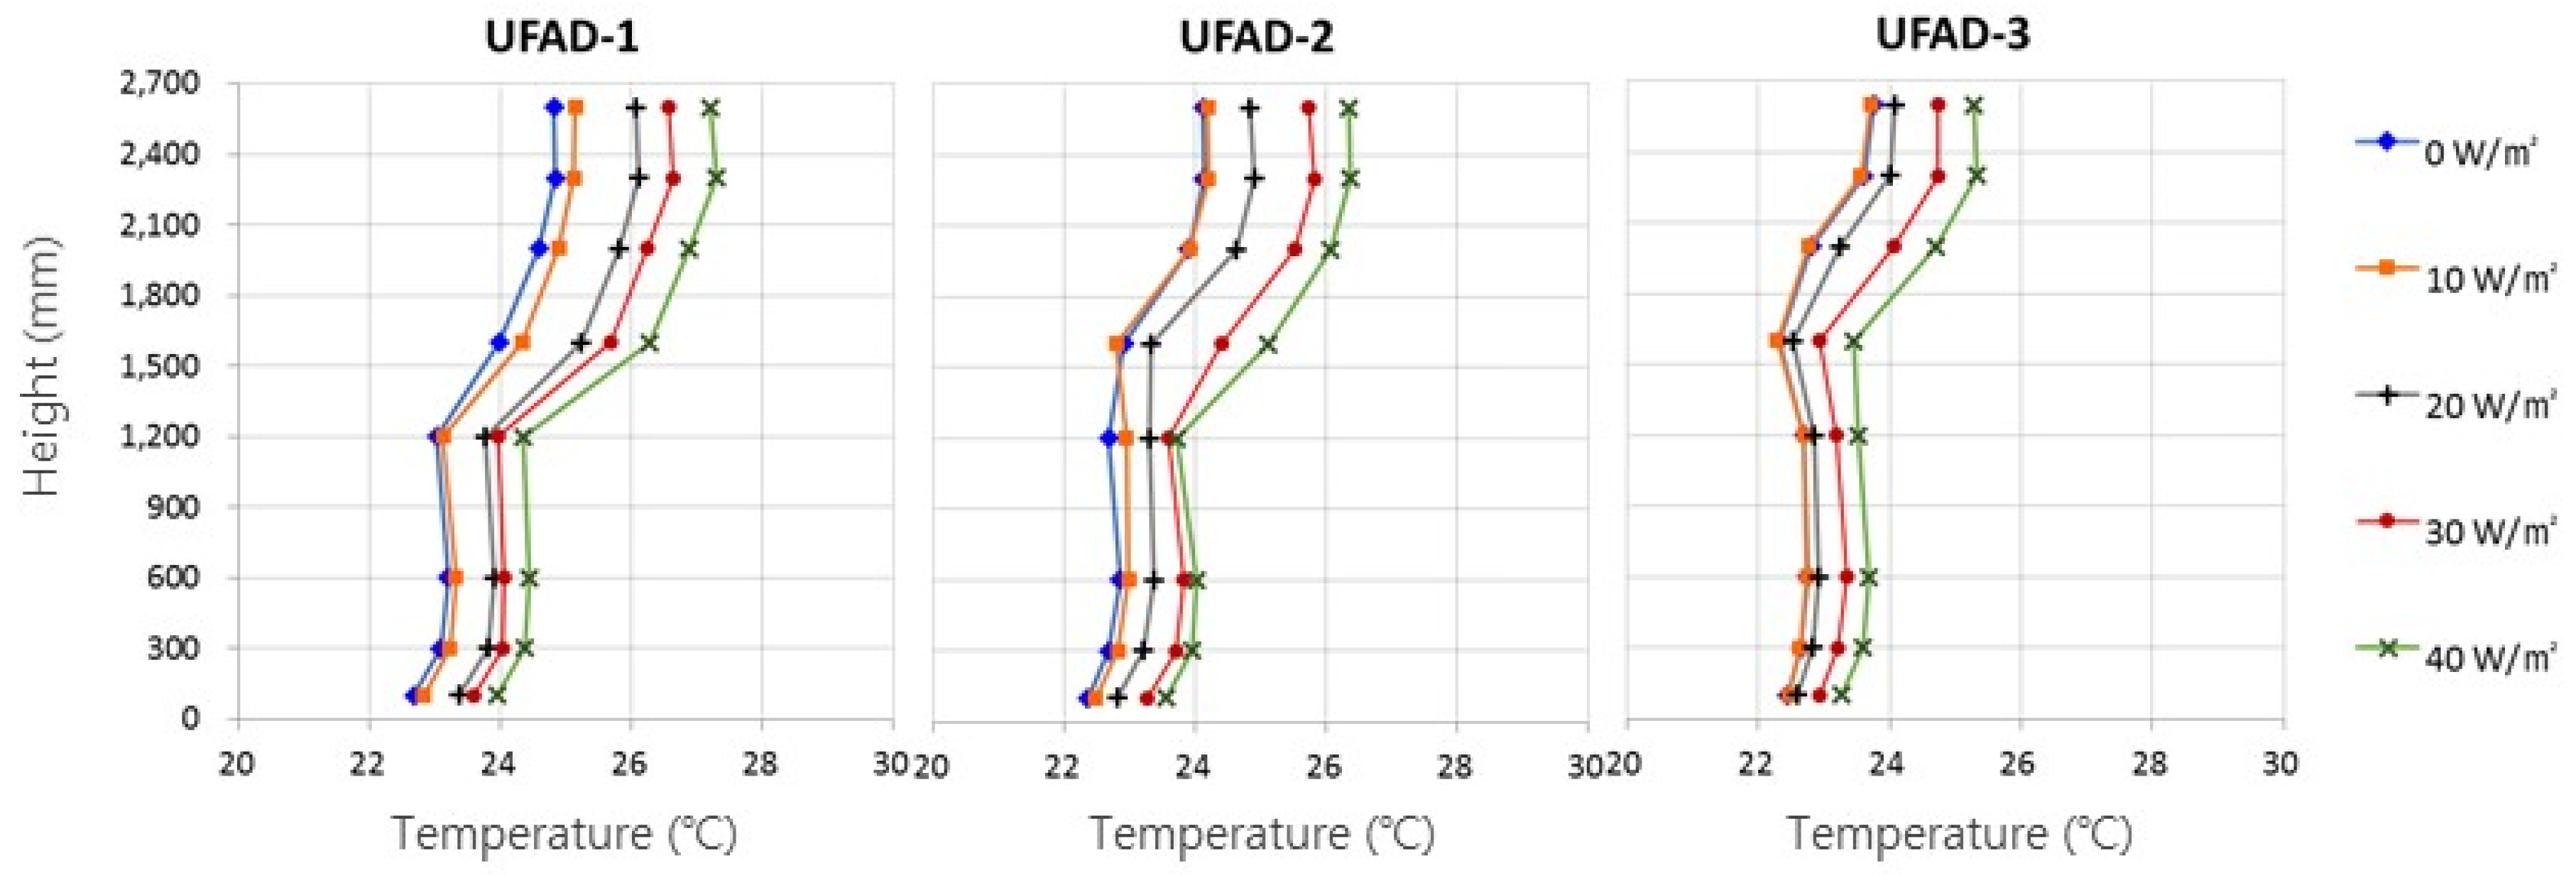
Figure 13 and
Figure 14 show the measured results of the vertical temperature distribution at point (X1, Y2) in the middle of the room, for CBAD and UFAD respectively. With CBAD, there was no temperature stratification, but an overall uniform temperature distribution, with a considerable temperature increase as the lighting power density was increased. On the other hand, with UFAD, there was temperature stratification around 1.5 m above the floor; the temperature around the occupied area was recorded to be 22–24 °C in all cases.
Figure 13.
Vertical temperature distribution at (X1, Y2), CBAD.
Figure 13.
Vertical temperature distribution at (X1, Y2), CBAD.
Figure 14.
Vertical temperature distribution at (X1, Y2), UFAD.
Figure 14.
Vertical temperature distribution at (X1, Y2), UFAD.
Also, the temperature increases arising from increased lighting power density were relatively smaller for UFAD than for CBAD, confirming that UFAD provides advantages over CBAD in conditions of greater lighting load, helping to reduce the cooling load and maintain thermal comfort.
Figure 15 shows the vertical temperature distribution for CBAD at point (X1, Y1) right below the ceiling supply air inlets; the temperature taken around the ceiling area was somewhat lower than in the room center, but overall the air temperature did not differ much throughout the height of the room.
Figure 16 shows the corresponding vertical temperature distribution for UFAD; temperature stratification was observed, with occupied area temperatures 2–3 °C lower than when the ceiling A/C system was used.
Figure 15.
Vertical temperature distribution at (X1, Y1), CBAD.
Figure 15.
Vertical temperature distribution at (X1, Y1), CBAD.
Figure 17 and
Figure 18 show the vertical temperature distributions at point (X1, Y3), right below the ceiling exhaust air outlets; the temperature taken above 2.1 m height was, in general, higher when UFAD was used instead of CBAD. We assume that this is due to the fact that, under CBAD, the heat generated by lighting had mixing losses directly by the air provided from near air inlet on the ceiling, whereas under UFAD, the heat generated by lighting has less mixing losses than the former as the air was provided from air inlet on the floor.
Figure 16.
Vertical temperature distribution at (X1, Y1), UFAD.
Figure 16.
Vertical temperature distribution at (X1, Y1), UFAD.
Figure 17.
Vertical temperature distribution at (X1, Y3), CBAD.
Figure 17.
Vertical temperature distribution at (X1, Y3), CBAD.
Figure 18.
Vertical Temperature Distribution at (X1, Y3), UFAD.
Figure 18.
Vertical Temperature Distribution at (X1, Y3), UFAD.
Figure 19 and
Figure 20 show percentage dissatisfied (PD) metered results at points (X1, Y1), (X1, Y2), (X1, Y3), calculated based on the temperature difference between head and ankles as provided in ISO 7730 [
11]. PD values were drawn from formula (1); the Δ
th values reflected the temperature differences between points 0.1 m and 1.6 m above the floor. When CBAD was used, the PD values were below 0.5% in all conditions, whereas when UFAD was used, relatively high PD values were noted in the 100 CMH condition at point (X1, Y1), where the floor supply air inlets were installed. However the average value of PD under UFAD was still satisfactory with 2.3% PD value, and when the supply airflow rate was increased above 125 CMH, the PD values were decreased because the temperature difference between head and ankles was reduced:
Figure 19.
PD by temperature differential 0.1–1.6 m above the floor, CBAD.
Figure 19.
PD by temperature differential 0.1–1.6 m above the floor, CBAD.
Figure 20.
PD by temperature differential 0.1–1.6 m above the floor, UFAD.
Figure 20.
PD by temperature differential 0.1–1.6 m above the floor, UFAD.
3.2. Indoor Air Flow Rate Distribution
Figure 21 illustrates the vertical airflow velocity distribution under CBAD and UFAD at point (X1, Y2), which is in the center of the chamber, showing the mean values taken 0.3, 1.2, and 2.3 m above the floor, respectively. Under CBAD, the overall air flow velocity increases with decreasing height, which we assume is because the cold air draft from the ceiling forms a descending air current. Under UFAD, in the supply air flow range of 100–125 CMH, the airflow velocity decreased with increasing distance from the floor supply air inlets, and almost no currents were sensed 2.3 m above the floor. In the 150 CMH condition, the airflow was greater 1.2 m above the floor than at 0.3 m, which we assume is because the air discharged from the supply diffusers formed a strong ascending current.
Figure 21.
Air current velocity distributions at (X1, Y2): (left) CBAD, (right) UFAD.
Figure 21.
Air current velocity distributions at (X1, Y2): (left) CBAD, (right) UFAD.
3.3. Vertical Distribution of PMV and PPD
To evaluate indoor thermal comfort, the predicted mean vote (PMV) and predicted percentage of dissatisfied (PPD) provided by ISO 7730 were used. Mean radiant temperature (MRT) values were applied with modifying the measured black bulb temperature used in Equation (2) [
12], assuming constant values of 0.5 and 1.2 for the clothing insulation (CLO) and the metabolic rate (MET):
where
tr: mean radiant temperature (°C);
tg: globe temperature (°C);
ta: dry-bulb air temperature (°C).
Figure 22 and
Figure 23 show PMV results at the room center point (X1, Y2), 0.3, 1.2, and 2.3 m above the floor. Under CBAD, the PMV values 2.3 m above the floor, close to the supply air inlets, were lower than those in the occupied area; however, under UFAD, the PMV values in the occupied area at 0.3 and 1.2 m above the floor were both lower than in the unoccupied area.
Figure 22.
Vertical distribution of PMV at (X1, Y2), CBAD.
Figure 22.
Vertical distribution of PMV at (X1, Y2), CBAD.
Figure 23.
Vertical distribution of PMV at (X1, Y2), UFAD.
Figure 23.
Vertical distribution of PMV at (X1, Y2), UFAD.
Under CBAD there was also a definite PMV increase with increasing lighting power density in the supply air flow conditions of 100–125 CMH; when the lighting power density was 20 W/m2, the PMV in the occupied area exceeded 0.5, going outside the comfort range. On the other hand, under UFAD, the PMV increases fairly little with increasing lighting power density, and except for the supply airflow condition of 100 CMH, PMV in the occupied area was maintained in the comfort range (from −0.5 to 0.5) regardless of the lighting power density.
Figure 24.
Vertical distribution of PPD at (X1, Y2), CBAD.
Figure 24.
Vertical distribution of PPD at (X1, Y2), CBAD.
Figure 25.
Vertical distribution of PPD at (X1, Y2), UFAD.
Figure 25.
Vertical distribution of PPD at (X1, Y2), UFAD.
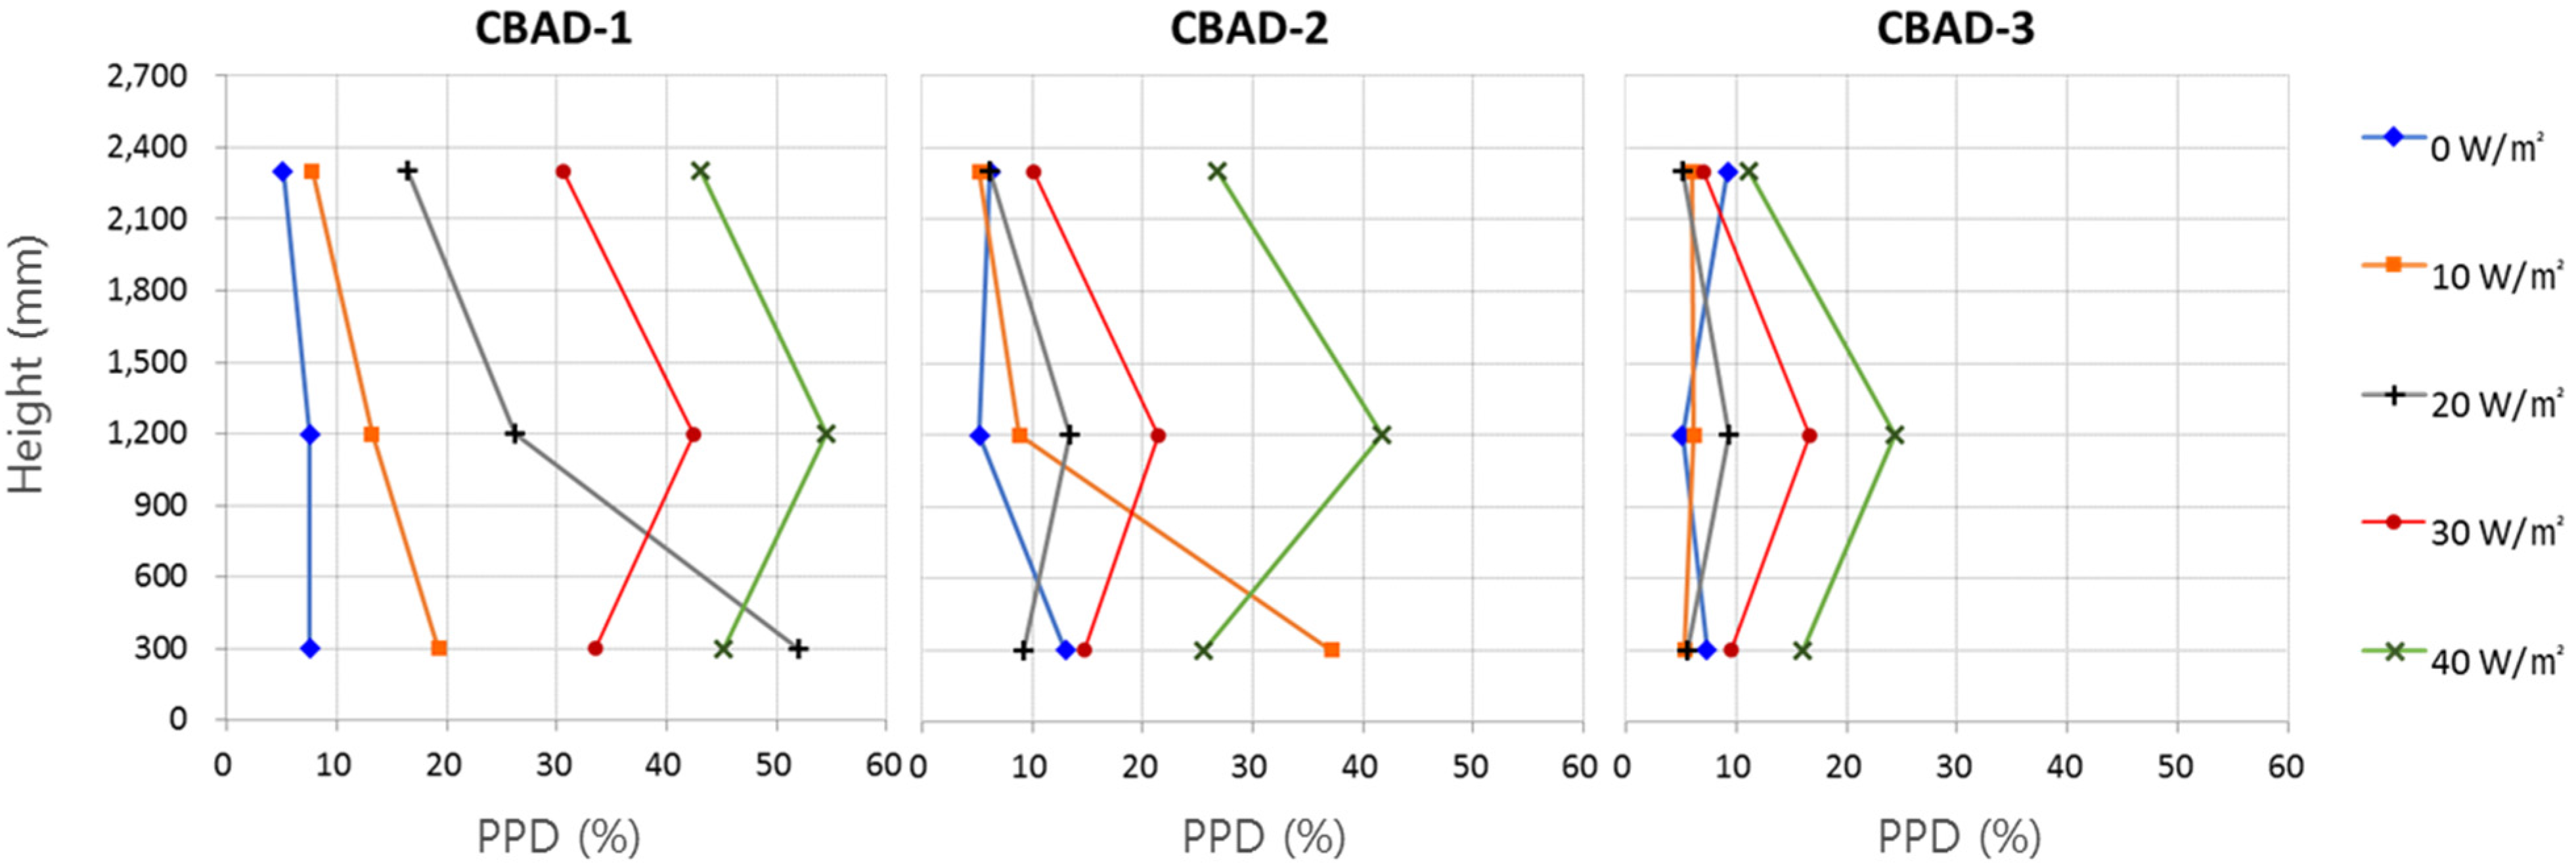
As shown in
Figure 24 and
Figure 25, the PPD output results taken at the room center point (X1, Y2) at the heights 0.3, 1.2, and 2.3 m above the floor were better for UFAD than for CBAD, similar to the PMV results.
3.4. Correlation between MRT and PPD
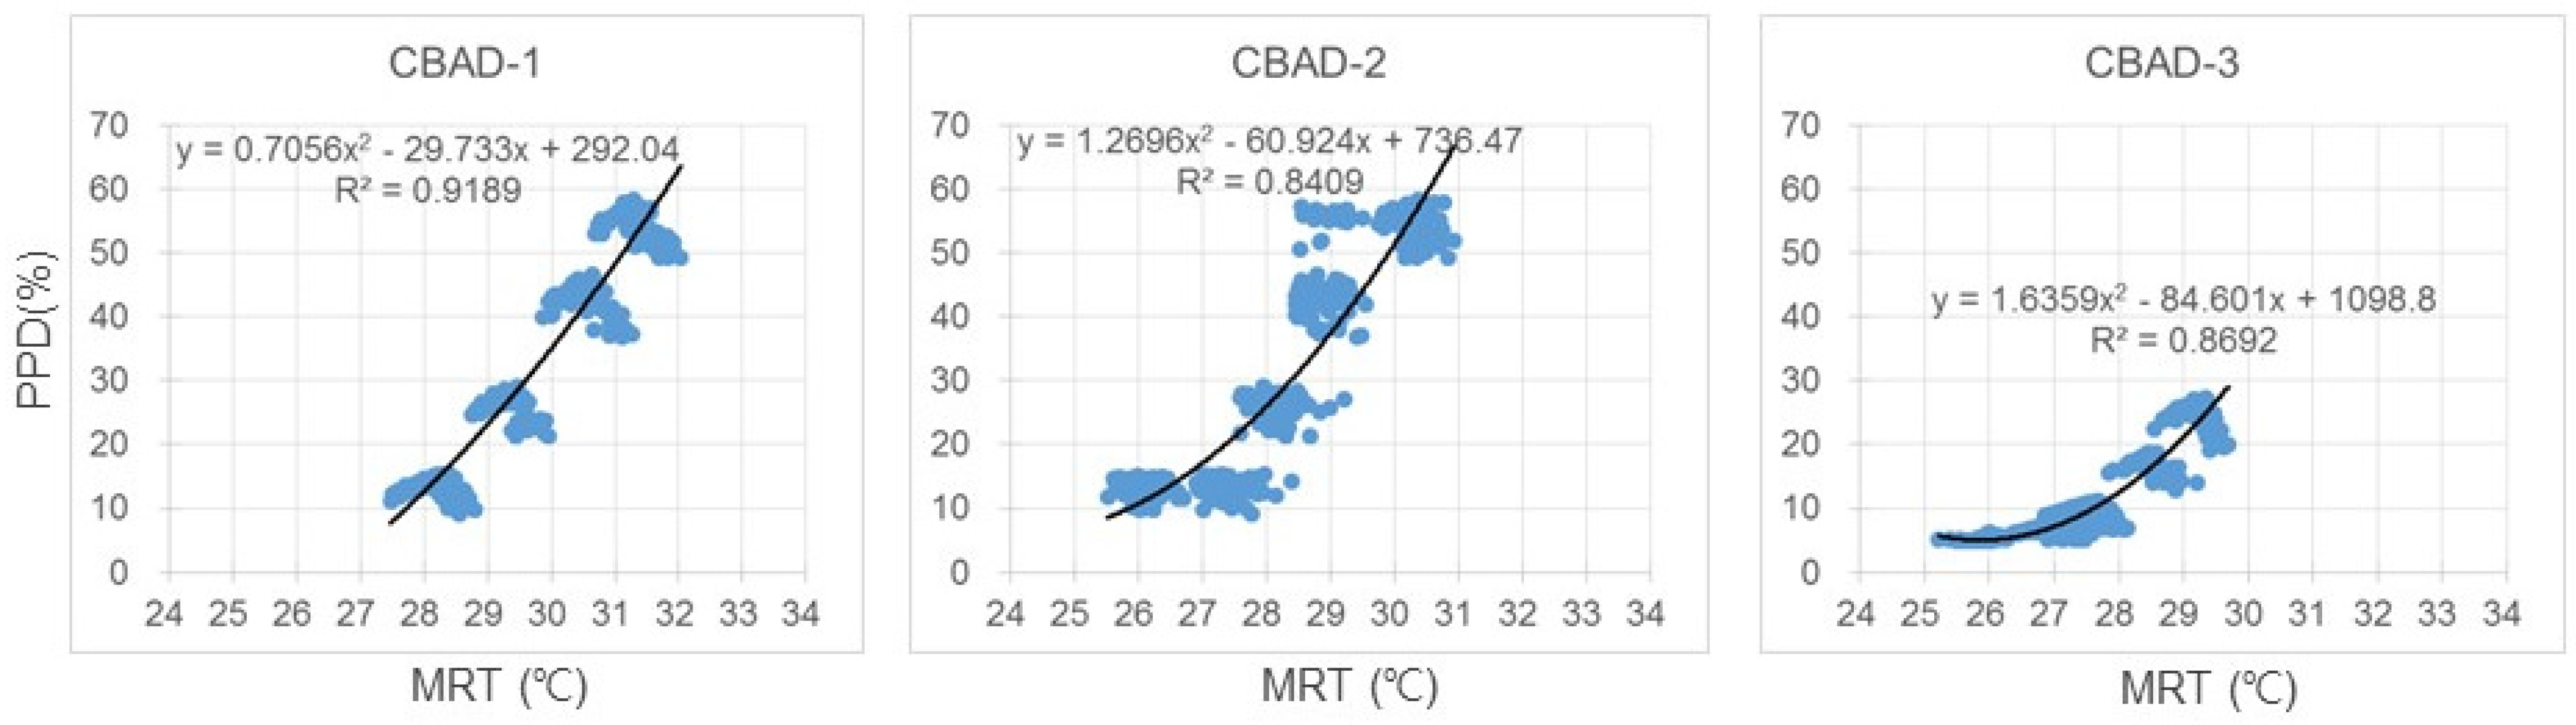
Figure 26 and
Figure 27 (except for UFAD-2 and UFAD-3 in
Figure 27) correlate MRT and PPD values taken at the room center point (X1, Y2) and 1.2 m above the floor. Both MRT and PPD were generally lower under UFAD than under CBAD, confirming UFAD’s ability to maintain thermal comfort even under conditions of low airflow rate.
Under CBAD, a clear tendency was observed of PPD rising proportionally to MRT, with a maximum PPD of 60% at the supply airflow of 100 CMH in particular. On the other hand, under UFAD, except for the supply airflow 100 CMH conditions, regardless of the variations in lighting power density or supply airflow, PPD values remained within 15%. In other words, the higher the lighting power density, the better UFAD performed than CBAD in terms of thermal comfort.
Figure 26.
Correlation between MRT and PPD for CBAD.
Figure 26.
Correlation between MRT and PPD for CBAD.
Figure 27.
Correlation between MRT and PPD for UFAD.
Figure 27.
Correlation between MRT and PPD for UFAD.
3.5. Correlation between Lighting Power Density and PPD
Figure 28 and
Figure 29 correlate lighting power density and PPD under CBAD and under UFAD, respectively, reflecting the PPD at the room center point (X1, Y2) and 1.2 m above the floor.
Figure 28.
Correlation between lighting power density and PPD for CBAD.
Figure 28.
Correlation between lighting power density and PPD for CBAD.
Figure 29.
Correlation between lighting power density and PPD for UFAD.
Figure 29.
Correlation between lighting power density and PPD for UFAD.
Under CBAD, PPD increased with increasing lighting power density, and the rate of PPD increase grew in inverse proportion to the supply airflow rate. Also, by using the formulas correlating lighting power density and PPD, it is possible to predict the levels of lighting power density that will satisfy arbitrarily given PPD conditions. For example, the maximum lighting power density conditions that would keep PPD below 15% (PMV −0.5 to +0.5) were confirmed to be 10.4, 22.3, and 29.0 W/m2, respectively, for the supply airflow rates of 100, 125, and 150 CMH.
Under UFAD, at the supply airflow rate of 100 CMH, lighting power density and PPD were proportionally related, but not at 125 CMH and at 150 CMH, and the correlation at 100 CMH was also much weaker than that for CBAD. Also, except for the conditions of supply airflow rate 100 CMH and lighting power density 40 W/m2, all measured PPD values in all conditions were below 15% (PMV −0.5 to +0.5) for UFAD, falling within comfort ranges.
Figure 30 shows the difference in PPD between UFAD and CBAD for various lighting power densities and various supply airflow rates. The values for the lighting power density of 40 W/m
2 did not correlate well and are not included in the figure.
In general, as the supply airflow rate was increased, PPD differences between the UFAD and CBAD systems decreased, and as the lighting power density was increased, PPD differences increased. In other words, the less supply airflow rate and the greater lighting power density, the more advantage can be achieved by applying UFAD instead of CBAD, in terms of ensuring a thermally comfortable indoor environment. By utilizing the correlation equations with lighting power density as the independent variable and PPD difference as the dependent variable, the impact of using UFAD instead of CBAD upon thermal comfort can be predicted quantitatively.
Figure 30.
Difference in PPD between UFAD and CBAD systems.
Figure 30.
Difference in PPD between UFAD and CBAD systems.
4. Conclusions
(1) Under UFAD, temperature stratification was achieved, with large temperature differences between the occupied and unoccupied areas of the experimental chamber relative to those under CBAD with the same conditions of supply air temperature and airflow rate, decreasing the occupied area temperature by 2–3 °C. Also, as lighting power density was increased, the indoor temperature increases at various points were smaller under UFAD than under CBAD.
(2) Under CBAD, as lighting power density was increased, PMV increased greatly, and in the low airflow rate conditions (100–125 CMH), lighting power density had to be kept below 20 W/m2 for PMV in the occupied area to stay within comfort ranges. Under UFAD, the PMV increased only somewhat in response to increasing lighting power density, satisfying comfort ranges for all lighting power density conditions studied except at the supply airflow rate of 100 CMH.
(3) A correlation of MRT and PPD taken in the room center in the occupied area showed that, under CBAD, PPD clearly rose in proportion to MRT, with a maximum PPD of 60%. Under UFAD, except for the supply airflow rate of 100 CMH, and regardless of lighting power density or supply airflow rate, PPD was kept within 15%.
(4) Under CBAD, PPD increased proportionally to lighting power density and in inverse proportion to supply airflow rate. Contrastingly, under UFAD, except for the condition in which the supply airflow rate was 100 CMH and the lighting power density was 40 W/m2, PPD remained below 15% in all conditions. In particular, within the lighting power density range of 0–30 W/m2, we could predict the level of lighting power density that would maintain the desired thermal comfort ranges by means of a correlation equation.
In conclusion, it was confirmed that the more heat was generated from the ceiling lighting and the greater variation a building had in lighting use, the more advantageous UFAD was relative to CBAD in providing stable indoor thermal comfort. In the future, regarding the application of UFAD to regulate the indoor thermal environment, we plan to conduct a study on the influences of varying supply air temperatures and occupied area loads.


