1. Introduction
Reverse osmosis (RO) has recently been recognized as one of the most promising desalination techniques that can be used to overcome water scarcity in countries in arid and semi-arid regions. These nations often have problems of population growth and limited natural water resources, and RO can result in improvements in techniques and reductions in costs. Moreover, due to limitations such as polarization, membrane fouling and hydraulic resistance to permeate flow, energy recovery can be a better choice to reduce energy consumption and economic costs [
1]. The desalination of seawater is one of the main sources of water in areas such as the Middle East and North Africa, with dependency on desalination reaching 90% in some of the Gulf Cooperation Council (GCC) countries [
2,
3].
Desalination technologies are classified by their separation mechanism into thermal and membrane based desalination. Thermal desalination separates salt from water by the evaporation and condensation process, whereas in membrane desalination, the water diffuses through a membrane permeable to water while most of the salt is retained [
4]. The most common forms of thermal desalination technology are Multi-Stage Flash (MSF), Multi-Effect Distillation (MED), and combined (MED) with Thermal Vapor Compression (MED-TVC). Membrane desalinations methods such as Reverse Osmosis (RO) and Electrolysis Desalination (ED) are considered the most common types [
5].
The predominant desalination processes in use today are based on RO and MSF, which constitute 53.0% and 25% of worldwide capacity, respectively (
Figure 1). The feasibility of each technology depends on specific conditions, such as energy price, water quality, and the technical resources of the region [
4].
Figure 1.
Desalination technologies distribution [
6].
Figure 1.
Desalination technologies distribution [
6].
In the 1950s, RO was initially used as a separation process, and since that time improvements in technology have increased its viability compared to other thermal desalination technologies. RO is now a leading technology in the desalination industry worldwide, both in small- and large-scale applications [
1,
5]. RO desalination has gained a reputation among companies supplying fresh water due to lower start up and delivery time, lower environmental impact, easier operation and maintenance, lower capital and operating costs, and a drastic drop in energy consumption due to the use of the latest energy recovery devices. On the other hand, RO technology is not generally favored for the desalination of highly saline water (more than 45,000 ppm) at high temperatures up to 40 °C, such as occurs in the Persian Gulf. Membrane fouling is also a problem, and pre-processing of the feed water is very important. Despite these drawbacks, the low energy requirements and low operating costs of membrane technologies make them attractive for seawater desalination as a first option, whether for new plants or hybridization in connection with present MSF plants [
1]. The main improvements made to RO desalination have focused on membrane technology in order to reduce fouling and increase its life, and on high pressure pumps to reduce electrical power consumption [
1,
4]. Macharg [
7] studied the advantages of the pressure exchanger (PX) and showed that its use is a clear improvement, reducing power consumption in an SWRO plant by 75%. The pressure exchanger was investigated using the theoretical and mathematical simulation of a desalination plant, and the results showed that the specific energy consumption per m
3 product water was reduced by about 35% compared with ERT [
8]. Power consumption and membrane replacement in seawater RO desalination plants have also been investigated, and energy consumption was found from range 3.02 kW/m
3 to 9.38 kW/m
3 [
9].
Thermal systems are traditionally analyzed using energy analysis. However, exergy analysis is now increasingly accepted as a useful tool in thermal system design, evaluation, optimization, and improvement [
10]. The efficiency of thermal systems such as desalination can be estimated using both the first and second laws of thermodynamics. Where the first law focuses on the quantity of energy and the second law (exergy analysis) considers quality as well as quantity. Exergy analysis allocates irreversibility in the system and suggests economical modifications and enhancements [
11,
12,
13,
14]. However, only a limited number of studies have analyzed seawater desalination exergy, due to the complexity of the determination of the seawater stream exergy.
Exergy analysis has been used to evaluate the performance of the Al-Hussein RO plant in Jordan. The RO desalination exergy efficiency was found to be only 4.1% only. The exergy destruction of unit components was mainly due to throttling valves, RO membranes, and pumps, accounted for 56.8%, 21%, and 19.6%, respectively [
5]. Thermo-economic analyses of some existing desalination technologies such as MSF, MEE-MVC, MEE, MEE-TVC, and RO, were investigated using Visual Design Software (VDS). The results showed that RO desalination and MEE-MVC were the most promising technologies [
15]. Mistry
et al. [
16] studied various desalination technologies: MSF, MED, RO, Mechanical Vapor Compression (MVC), Direct Contact Membrane (DCM), and Humidification–Dehumidification (HD). The study revealed that RO desalination had the best exergy efficiency, at 31.9%, while those of other technologies were much lower typically 2.9% (MSF), 5.9% (MED), 8.5% (MVC), 1% (DCM), and 2.4% (HD). Kempton
et al. 2010 [
17] analyzed exergy in reverse osmosis (RO), Multi-Effect (MED), and MSF desalination: They found typical exergy efficiencies of 30.10%, 14.27%, and 7.73%, respectively. All the above studies of desalination exergy analysis assumed that the seawater is an ideal mixture; however, in reality, it is a highly electrolytic substance Sharqawy
et al. [
18]. The considerable difference between the two assumptions was demonstrated by Sharqawy
et al. [
19] by comparing their results with those of Kahraman and Cengel for the same MSF desalination unit [
20]. Guirguis [
21] studied a seawater reverse osmosis desalination plant with an energy recovery turbine (ERT) using efficiency and economic study analysis with respect to the pressure exchanger (PX). He concluded that the PX achieved the best specific power consumption, whereas the ERT configuration was more economical.
Most research in the area of RO desalination optimization has focused on either improving membrane technology or reducing power consumption. The power consumption of RO desalination per m
3 varies between 2.5 and 7.9 kWh/m
3 [
22,
23,
24] and therefore reducing the energy consumption of the RO desalination technology by using an energy recovery device (ERD) could save from 1.5% to 27% of the total power consumed by high pressure pumps [
23]. The three common commercial ERDS are ERT, turbochargers and isobaric pressure exchange.
The present study, therefore, has two aims. Firstly, a detailed exergy analysis is conducted of an existing operational 127 m3/h two-pass RO desalination unit with the seawater treated as an actual mixture, and not an ideal mixture as assumed in previous studies. Secondly, investigates the effect of using ERT and PX on the energy and exergy efficiency of RO desalination and the minimum separation work and membrane area involved.
2. Exergy Analysis Methodology
Exergy is defined as the maximum obtainable useful work when a system is moved to equilibrium from the initial state to the environmental (dead) state [
11,
12,
13,
14]. The exergy for the three different techniques was studied using the following equations, where the total exergy (ET) of any stream is defined as:
where E
PH, E
CH, E
PO, and E
KE, are the total physical exergy, total chemical exergy, total potential exergy and total kinetic exergy, respectively. Specific exergy is the total exergy divided by the mass flow rate of the stream:
Therefore, the specific exergy is the sum of the specific exergies of the defined stream:
where e
PO and e
KE are considered to be negligible since the stream is assumed to be at rest relative to the environment [
12].
In the RO process, the streams are pure water and seawater. The physical and chemical exergy of the water and seawater streams is calculated by correlations suggested and validated (with a maximum deviation of ±1.5%) by Sharqawy
et al. [
18,
19]. The physical exergy (e
PH) of the fluid stream is:
where h
0, T
0, and s
0 are the enthalpy (kJ/kg), temperature (K), and entropy in (kJ/(kg K)) of the stream at the dead state, respectively. For water and seawater, the enthalpy is given by the following equations with constants presented
Table 1:
where the water enthalpy is:
The effect of the stream pressure on the enthalpy of the stream is then added:
For the water and seawater the entropy is given by:
where the pure water entropy is:
The chemical exergy of a pure water and seawater stream is produced when the stream has a salt concentration that is different from the dead state concentration. The chemical exergy is obtained by [
25]:
where
and
are the chemical potentials of the (i) component at
and
, respectively. In the case of a mixture of pure water and seawater, the chemical potential can be obtained by differentiating the Gibbs function as follows:
where g
sw is the specific Gibbs function at T (°C) given by:
Differentiation of the Gibbs function gives:
The partial derivatives of enthalpy and entropy with respect to the salt concentration are obtained from the following correlations (c, b constants listed in
Table 1):
The overall RO exergy efficiency is defined as the ratio of the minimum separation work required to the total input exergy [
19,
26]:
To understand the contribution to exergy destruction of each RO desalination component (
Ed,n) to total exergy destruction (
Ed,total), the exergy destruction ratio (Ψ) is obtained by Bejan
et al. [
11]:
Table 1.
Constants used to calculate the enthalpy and entropy of seawater [
19,
26].
Table 1.
Constants used to calculate the enthalpy and entropy of seawater [19,26].
| Equation (5) | Equation (5) | Equation (8) | Equation (8) |
|---|
| b1 = −2.348 × 10⁴ | b6 = −4.417 × 101 | c1 = −4.231 × 10² | c6 = −1.443 × 10⁻¹ |
| b2 = 3.152 × 10⁵ | b7 = 2.139 × 10⁻¹ | c2 = 1.463 × 10⁴ | c7 = 5.879 × 10⁻⁴ |
| b3 = 2.803 × 10⁶ | b8 = −1.991 × 10⁴ | c3 = −9.880 × 10⁴ | c8 = −6.111 × 101 |
| b4 = −1.446 × 10⁷ | b9 = 2.778 × 10⁴ | c4 = 3.095 × 10⁵ | c9 = 8.041 × 101 |
| b5 = 7.826 × 10³ | b10 = 9.728 × 101 | c5 = 2.562 × 101 | c10 = 3.035 × 10⁻¹ |
3. RO Plant System Description
The RO desalination of seawater could be classified based on the purpose of obtaining either better water quality or more product flow. For better product quality, two-pass RO is used, where the product from the seawater RO (SWRO) is filtered again in brackish water RO (BWRO). However, in the case of the two-stage RO, the rejected stream from the first stage (SWRO) is directed to the second stage to increase the amount of product.
This study compares a two-pass RO desalination standalone plant (
Figure 2) and the system with an Energy Recovery Device (ERT) (
Figure 3) or a pressure exchanger (PX) (
Figure 4) using the exergy analysis approach. The actual RO desalination unit was modeled using IPSEpro software [
27] and the model was validated with operational data a good agreement was found, with a maximum variation of 0.22% as shown in
Table 2, whereas
Table 3 shows the model results.
Table 2.
Comparison of operating data and model results.
Table 2.
Comparison of operating data and model results.
| SWRO Membrane |
|---|
| Parameters | Operation Data | Model Result | Unit | Variation (%) |
|---|
| Design flow | 327.6 | 327 | t/h | 0.18 |
| Permeate flow | 147.4 | 147.1 | t/h | 0.20 |
| Permeate salinity | less than 500 | 486 | mg/L | |
| Rejected flow | 180.2 | 179.8 | t/h | 0.22 |
| Rejected salinity | 65,100 | 65,060 | | 0.06 |
| Feed seawater pressure | 64 | 64 | bar | 0.00 |
| Rejected pressure | 62 | 62 | bar | 0.00 |
Table 3.
Characteristics of the actual RO unit studied.
Table 3.
Characteristics of the actual RO unit studied.
| Description | Data | Unit |
|---|
| Type of RO system | Two pass RO arrangement | - |
| Seawater temperature | 25 | °C |
| Seawater flow to SWRO | 327 | t/h |
| Seawater salinity | 36,000 | ppm |
| SWRO osmotic pressure | 30.6 | bar |
| SWRO feed pump discharge pressure | 65.0 | bar |
| SWRO recovery ratio | 45 | % |
| Salt rejection | 98.6 | % |
| Salt passage | 1.4 | % |
| Rejected brine flow from SWRO | 179 | t/h |
| Rejected seawater salinity from SWRO | 65,000 | ppm |
| Permeate water flow from SWRO | 147 | t/h |
| Permeate water salinity from SWRO | 486 | ppm |
| Brackish water flow to BWRO | 147 | t/h |
| Brackish water salinity before BWRO | 486 | ppm |
| BWRO osmotic pressure | 0.414 | bar |
| BWRO feed pump discharge pressure | 18 | bar |
| BWRO recovery ratio | 85 | % |
| Salt rejection | 99.7 | % |
| Salt passage | 0.314 | % |
| Rejected brine flow from BWRO | 127 | t/h |
| Rejected seawater salinity from BWRO | 10 | ppm |
Figure 2.
IPSEpro model for two-pass RO desalination without ERT.
Figure 2.
IPSEpro model for two-pass RO desalination without ERT.
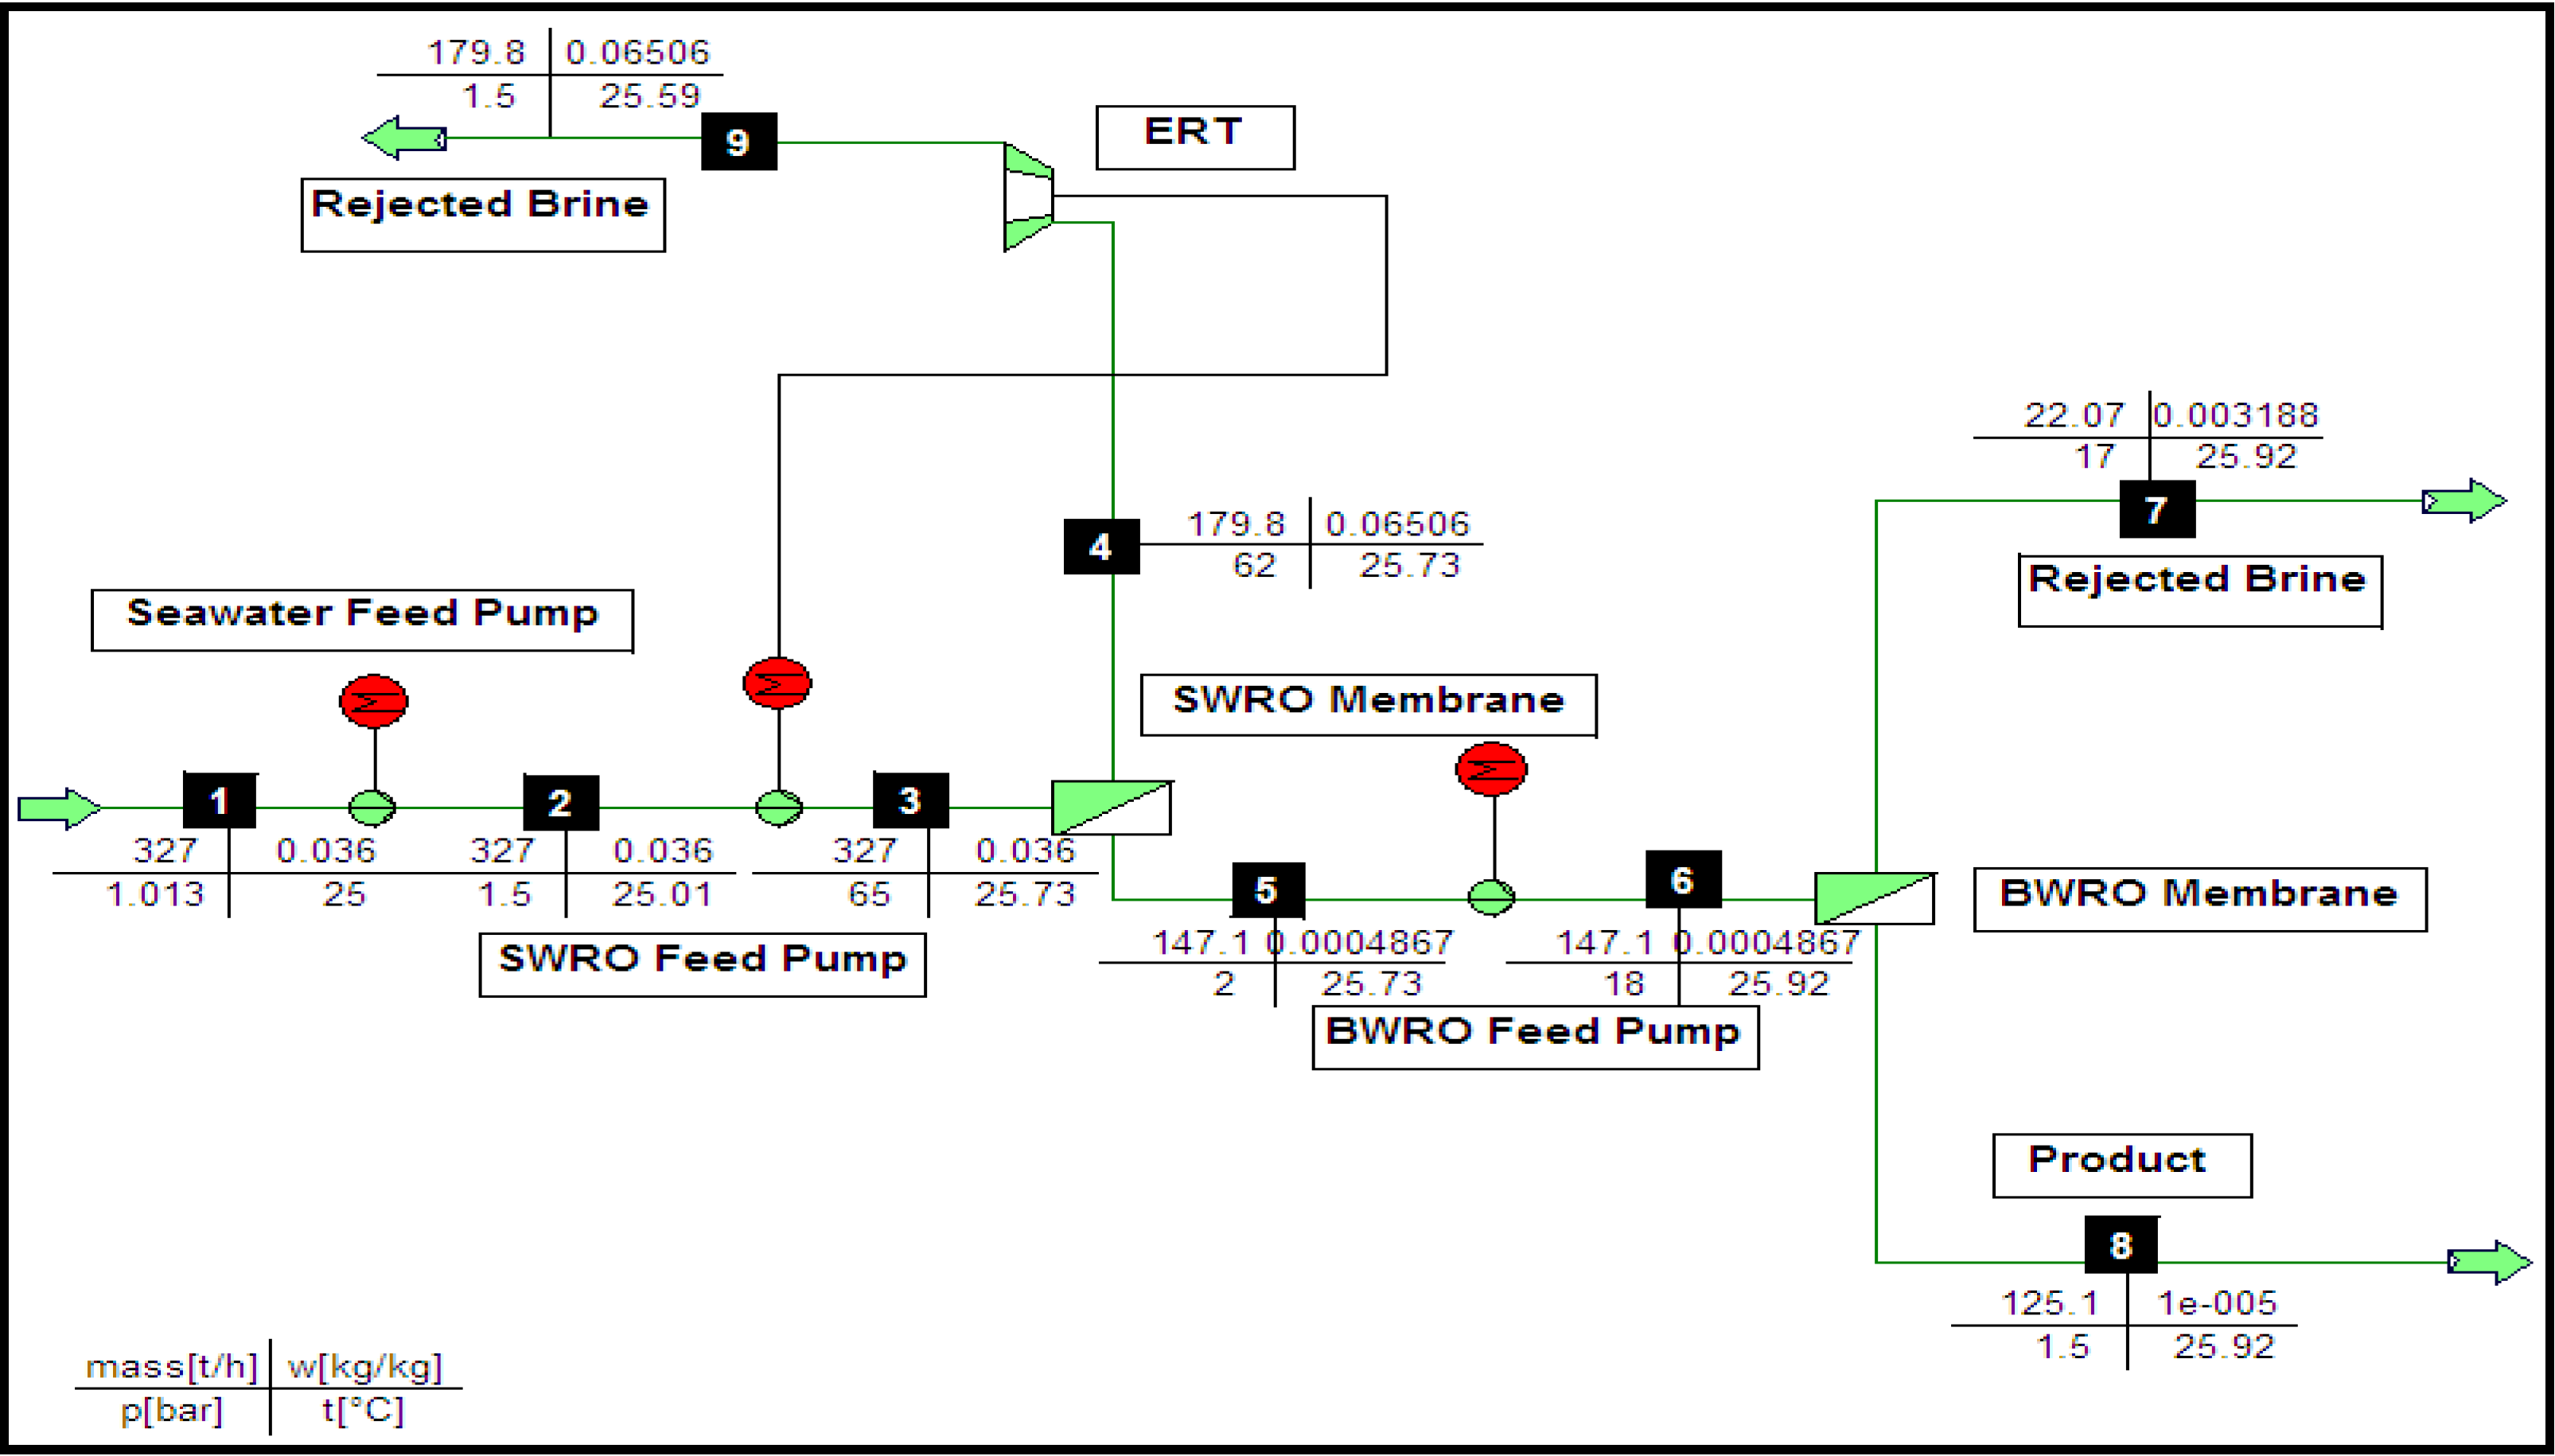
Figure 3.
IPSEpro model for two-pass RO desalination with ERT.
Figure 3.
IPSEpro model for two-pass RO desalination with ERT.
Figure 4.
IPSEpro model for two-pass RO desalination with pressure exchanger (PX).
Figure 4.
IPSEpro model for two-pass RO desalination with pressure exchanger (PX).
4. Results and Discussion
Table 4,
Table 5 and
Table 6 show the calculated thermodynamic properties for all of the numbered streams in
Figure 2,
Figure 3 and
Figure 4, respectively. It is worth mentioning that of all streams the exergy rates for RO models (standalone, with ERT and with PX) are positive since they are above the dead state condition; this result is in agreement with those of Sharqawy
et al. [
19]. On the other hand, these values could be end with negative values even though they are above the dead state condition if the seawater was assumed to be as an ideal mixture [
28,
29].
The simulation results show that the total power consumption of the standalone SWRO desalination plant, which was 1056 kW, was reduced to 742 kW and then to 532.3 kW when ERT and PX, respectively, were used. Moreover, using ERT and PX with RO desalination improved the specific power consumption per m
3 water from 7.2 kW/m
3 to 5.0 kW/m
3 and 3.6 kW/m
3. These results are in agreement with those of previously published studies [
21,
22,
23,
24]. However, it is necessary to link this improvement with the additional costs related to using the ERT in the unit to get a complete picture.
In the current exergy analysis, the dead state has been selected at P
0 = 101.3 kPa, w
s,0 = 0.036 kg/kg, and T
0 = 25 °C, which matches the seawater intake parameters. The last three streams (4-A, 7-A, and 8-A in
Table 4; 7-A, 8-A, and 9-A in
Table 5; and 11-A, 12-A, and 13-A in
Table 6) represent the residual exergy when they move to the dead state at (P
0, T
0) in order to calculate the minimum separation work (W
min).
Table 7,
Table 8 and
Table 9 summarize the exergy analysis. Equation (17) was applied to calculate the overall exergy efficiency of the unit. The input exergy to the unit is the pump work inputs where pump efficiency is assumed to be typically 75% [
19,
20]. The output minimum separation work for exergy efficiency is the sum of the discharged distillate and brine relative to the exergy of the cooling water entering the unit.
Table 4.
Simulation results of thermodynamic properties of the indicated streams (
Figure 2) for RO desalination without ERT.
Table 4.
Simulation results of thermodynamic properties of the indicated streams (Figure 2) for RO desalination without ERT.
| Stream No. | Mass (kg/s) | T (°C) | P (kPa) | w (g/kg) | Specific Exergy, eT (kJ/kg) | Total Exergy ET (kW) |
|---|
| 1 | 90.8 | 25.0 | 101.3 | 36.0 | 0.000 | 0.000 |
| 2 | 90.8 | 25.0 | 150.0 | 36.0 | 0.048 | 4.32 |
| 3 | 90.8 | 25.7 | 6500 | 36.0 | 6.247 | 567 |
| 4 | 50.0 | 25.7 | 6200 | 65.1 | 6.685 | 334 |
| 5 | 40.9 | 25.7 | 200.0 | 0.490 | 2.825 | 115 |
| 6 | 40.9 | 25.9 | 1800 | 0.490 | 4.432 | 181 |
| 7 | 6.13 | 25.9 | 1700 | 3.19 | 3.858 | 23.7 |
| 8 | 34.7 | 25.9 | 100.0 | 0.010 | 2.815 | 97.8 |
| 4-A | 50.0 | 25.0 | 101.3 | 65.1 | 0.859 | 42.9 |
| 7-A | 6.13 | 25.0 | 101.3 | 3.19 | 2.253 | 13.8 |
| 8-A | 34.7 | 25.0 | 101.3 | 0.010 | 2.811 | 97.7 |
Table 5.
Simulation results of thermodynamic properties of the indicated streams (
Figure 3) for RO desalination with ERT.
Table 5.
Simulation results of thermodynamic properties of the indicated streams (Figure 3) for RO desalination with ERT.
| Stream No. | Mass (kg/s) | T (°C) | P (kPa) | w (g/kg) | Specific Exergy, eT (kJ/kg) | Total Exergy ET (kW) |
|---|
| 1 | 90.8 | 25.0 | 101.3 | 36.0 | 0.000 | 0.000 |
| 2 | 90.8 | 25.0 | 150.0 | 36.0 | 0.048 | 4.32 |
| 3 | 90.8 | 25.7 | 6500 | 36.0 | 6.247 | 567 |
| 4 | 49.9 | 25.7 | 6200 | 65.1 | 6.685 | 334 |
| 5 | 40.9 | 25.7 | 200.0 | 0.487 | 2.824 | 115 |
| 6 | 40.9 | 25.9 | 1800 | 0.487 | 4.431 | 181 |
| 7 | 6.13 | 25.9 | 1700 | 3.19 | 3.858 | 23.7 |
| 8 | 34.7 | 25.9 | 100.0 | 0.010 | 2.815 | 97.8 |
| 9 | 49.9 | 25.5 | 110.0 | 65.1 | 0.864 | 43.2 |
| 7-A | 6.13 | 25.0 | 101.3 | 3.19 | 2.253 | 13.8 |
| 8-A | 34.7 | 25.0 | 101.3 | 0.010 | 2.811 | 97.7 |
| 9-A | 49.9 | 25.0 | 101.3 | 65.1 | 0.859 | 42.9 |
Table 6.
Simulation results of thermodynamic properties of the indicated streams (
Figure 4) for RO desalination with PX.
Table 6.
Simulation results of thermodynamic properties of the indicated streams (Figure 4) for RO desalination with PX.
| Stream No. | Mass | T | P | w | e Total | E (MW) |
|---|
| 1 | 90.8 | 25 | 101.3 | 36 | 0.000 | 0.000 |
| 2 | 90.8 | 25.0 | 150 | 36 | 0.048 | 4.3 |
| 3 | 48.8 | 25.0 | 150 | 36 | 0.048 | 2.3 |
| 4 | 41.9 | 25.0 | 150 | 36 | 0.048 | 1.9 |
| 5 | 41.9 | 25.7 | 6500 | 36 | 6.247 | 261.9 |
| 6 | 48.9 | 25.2 | 6500 | 36 | 6.246 | 305.5 |
| 7 | 90.8 | 25.4 | 6500 | 36 | 6.246 | 567.4 |
| 8 | 49.9 | 25.4 | 6200 | 66.51 | 6.685 | 333.9 |
| 9 | 40.8 | 25.4 | 200 | 0.487 | 2.822 | 115.3 |
| 10 | 40.8 | 25.6 | 1800 | 0.487 | 4.428 | 181 |
| 11 | 6.1 | 25.6 | 1700 | 3.188 | 3.855 | 23.6 |
| 12 | 34.7 | 25.6 | 150 | 0.01 | 2.862 | 99.4 |
| 13 | 49.8 | 25.4 | 147.4 | 65.1 | 0.902 | 44.9 |
| 14 | 48.9 | 25.1 | 5900 | 36 | 5.661 | 276.8 |
| 11-A | 6.13 | 25.0 | 101.3 | 3.189 | 2.253 | 13.8 |
| 12-A | 34.7 | 25.0 | 101.3 | 0.010 | 2.811 | 97.7 |
| 13-A | 49.8 | 25.0 | 101.3 | 65.1 | 0.861 | 42.9 |
Table 7.
Exergy analysis results for RO desalination without ERT.
Table 7.
Exergy analysis results for RO desalination without ERT.
| Equipment | Calculation Method | Result | Unit |
|---|
| Seawater pump exergy in | E2 – E1 | 4.32 | kW |
| SWRO feed pump exergy in | E3 – E2 | 563 | kW |
| BWRO feed pump exergy in | E6 – E5 | 65.7 | kW |
| Pumps input exergy in | Epp = (1/0.75) × (∑((E2 – E1) + (E3 – E2) + (E6 – E5))) | 844 | kW |
| Minimum separation work | Wmin = E(4-A) + E(7-A) + E(8-A) | 154 | kW |
| Exergy efficiency | Equation (17) | 18.3 | % |
| Total exergy destruction | Ed = Einput − Eoutput | 690 | kW |
| Exergy destroyed in pumps | Ed,pp = (1 − 0.75) × Epp | 211 | kW |
| Exergy destroyed in SWRO membrane | Ed,SWRO = E3 − E4 − E5 | 118 | kW |
| Exergy destroyed in BWRO membrane | Ed,BWRO = E6 – E7 – E8 | 59.7 | kW |
| Rejected seawater disposal | Ed,RSWD = (E4 − (E4-A)) | 291 | kW |
| Rejected brackish water disposal | Ed,RBWD = (E7 – (E7-A)) | 9.84 | kW |
| Product water disposal | Ed,PWD = (E8 − (E8-A)) | 0.191 | kW |
Table 8.
Exergy analysis results for RO with ERT.
Table 8.
Exergy analysis results for RO with ERT.
| Equipment | Calculation Method | Result | Unit |
|---|
| Seawater pump exergy in | E2 – E1 | 4.32 | kW |
| SWRO RO feed pump | E3 – E2 | 563 | kW |
| BWRO feed pump | E6 – E5 | 65.7 | kW |
| Pump input exergy before ERT | Epp = (1/0.75) × (∑((E2 – E1) + (E3 – E2) + (E6 – E5))) | 844 | kW |
| Exergy input from ERT | EERT = WERT | 279 | kW |
| Total exergy input | EPP − EERT | 565 | kW |
| Minimum separation work | Wmin = E(7−A) + E(8−A) + E(9−A)EERT = WERT | 154 | kW |
| Exergy efficiency | Equation (17) | 27.3 | % |
| Total exergy destruction | Ed = Einput − Eoutput | 411 | kW |
| Exergy destroyed in ERT | Ed,ERT = E4 − E9 − WERT | 11.6 | kW |
| Exergy destroyed in pumps | Ed,pp = (1 − 0.75) × Epp | 211 | kW |
| Exergy destroyed in SWRO membrane | Ed,SWRO = E3 − E4 − E5 | 118 | kW |
| Exergy destroyed in BWRO membrane | Ed,BWRO = E6 – E7 – E8 | 59.7 | kW |
| Rejected seawater disposal | Ed,RSWD = (E9 − (E9-A)) | 0.277 | kW |
| Rejected brackish water disposal | Ed,RBWD = (E7 – (E7-A)) | 9.84 | kW |
| Product water disposal | Ed,PWD = (E8 − (E8-A)) | 0.191 | kW |
Table 9.
Exergy analysis results for RO with PX.
Table 9.
Exergy analysis results for RO with PX.
| Equipment | Calculation Method | Result | Unit |
|---|
| Seawater pump exergy in | E2 – E1 | 4.31 | kW |
| SWRO RO feed pump | E3 – E2 | 259.9 | kW |
| BWRO feed pump | E6 – E5 | 65.6 | kW |
| Pump input exergy before | Epp = (1/0.75) × (∑((E2 – E1) + (E3 – E2) + (E6 – E5))) | 844 | kW |
| Exergy input from PX | EPX = EPX | 28.6 | kW |
| Total exergy input | EPP − EPX | 358.5 | kW |
| Minimum separation work | Wmin = E(11-A) + E(12-A) + E(13-A) | 154.4 | kW |
| Exergy efficiency | Equation (17) | 32.3 | % |
| Total exergy destruction | Ed = Einput − Eoutput | 323.6 | kW |
| Exergy destroyed in PX | Ed,PX = E8 – E14− E13 − WPX | 14.5 | kW |
| Exergy destroyed in pumps | Ed,PP = (1 – 0.75) × Epp | 119.4 | kW |
| Exergy destroyed in SWRO membrane | Ed,SWRO = (E7 – E8 – E9) | 118 | kW |
| Exergy destroyed in BWRO membrane | Ed,BWRO = E10 – E11 – E12 | 58 | kW |
| Rejected seawater disposal | Ed,RSWD = (E13 – (E13-A)) | 2 | kW |
| Rejected brackish water disposal | Ed,RBWD = ( E11 – (E11-A)) | 9.8 | kW |
| Product water disposal | Ed,PWD = (E12 – (E12-A) | 1.7 | kW |
The exergy analysis of the two-pass RO desalination reveals that using the ERT and PX enhanced the exergy efficiency by 49% and 77% due to the drop in the SWRO feed pump power consumption, which was (18.2%) for the standalone, (27.3%) with the ERT, and (32%) with PX. This reduction was due to recovering the waste pressure energy from the seawater rejected from the SWRO through the ERT and PX as shown in
Figure 5.
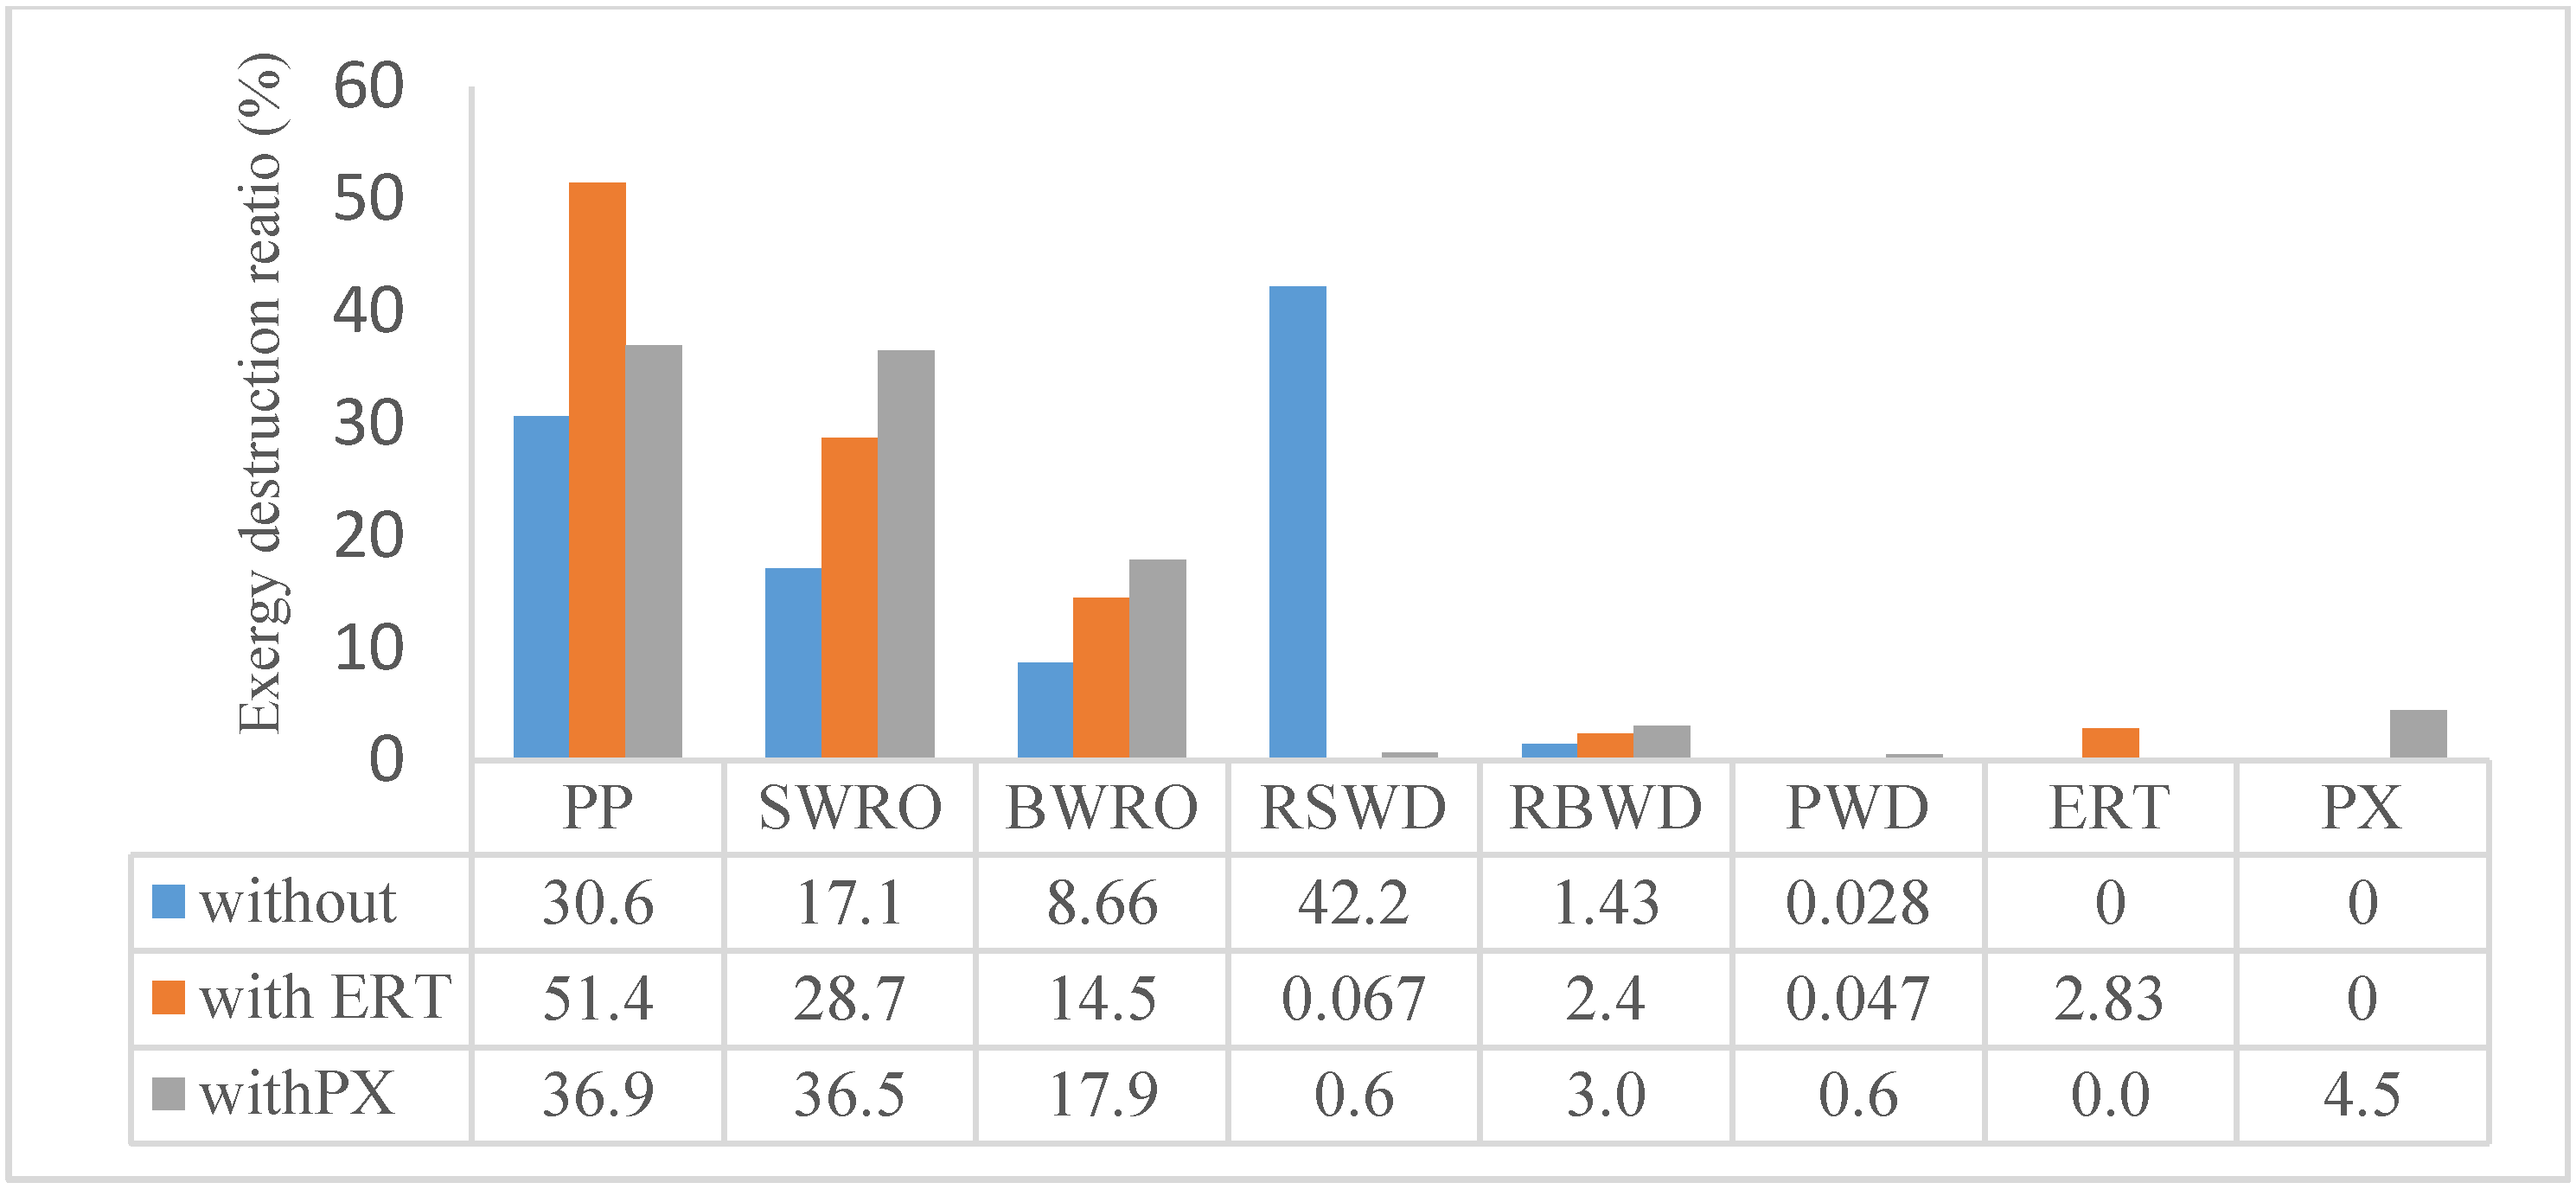
Figure 6 shows a comparison between the exergy destruction ratios of the components of the RO desalination as standalone and with ERT and PX. The results shown that the exergy destruction ratio of the RO desalination standalone were found to be 30.6%, 17.1%, 8.66%, 42.2%, 1.43%, and 0.028% for the pumps (PP), seawater membrane (SWRO), brackish water membrane (BWRO), rejected seawater disposal (RSWD), rejected brackish water disposal (RBWD), and product water disposal (PWD), respectively. Whereas the percentages for the plant with ERT were 51.4%, 28.7%, 14.5%, 0.07%, 2.4%, 0.05%, and 2.8% for PP, SWRO, BWRO, RSWD, RBWD, PWD, and ERT, respectively. Meanwhile the percentages when PX was used were, 36.9%, 36.5%, 17.9%, 0.6%, 3.0%, 0.6%, and 4.5%, for PP, SWRO, BWRO, RSWD, RBWD, PWD, and PX, respectively. The results show that the total SWRO exergy destruction of 690 kW in the case of RO desalination without ERT is reduced to 411 kW with ERT and to only 324 kW with PX, as explained in
Figure 6. The exergy destruction ratio of the rejected seawater disposal (RSWD) dropped from 42% (291 kW) to only 0.07% (0.277 kW) with ERT and 0.064% (2.07 kW) with PX. Whereas, the exergy destruction ratio of the pumps with the PX in use was less than ERT by about 40%.
Figure 7 compares the membrane areas with PX, ERT, and in the standalone, and the results indicate that the membrane area with PX and ERT is reduced by about 0.078% and 0.018%, respectively. Moreover, the minimum separation work (W
min) with the PX was higher than the standalone by about 0.0044%, while with the ERT it was only 0.0011%, as shown in
Figure 8.
Figure 5.
Comparison of the three SWRO configurations membrane.
Figure 5.
Comparison of the three SWRO configurations membrane.
Figure 6.
Comparison between exergy destruction ratio of RO desalination with/without ERT (PP: Pumps; SWRO: Seawater membrane; BWRO: Brackish water membrane; RSWD: Rejected seawater disposal; RBWD: Rejected brackish water disposal; PWD: Product water disposal; and ERT: Energy recovery turbine).
Figure 6.
Comparison between exergy destruction ratio of RO desalination with/without ERT (PP: Pumps; SWRO: Seawater membrane; BWRO: Brackish water membrane; RSWD: Rejected seawater disposal; RBWD: Rejected brackish water disposal; PWD: Product water disposal; and ERT: Energy recovery turbine).
Figure 7.
Comparison of SWRO membrane areas indifferent configurations.
Figure 7.
Comparison of SWRO membrane areas indifferent configurations.
Figure 8.
Comparison of minimum separation different configurations work.
Figure 8.
Comparison of minimum separation different configurations work.
5. Conclusions
An actual two-pass RO desalination plant was modeled using IPSEpro software. The simulation results were used to compare the RO desalination unit with and without the energy recovery turbine (ERT) and pressure exchanger (PX) using the exergy analysis method. In this analysis, the chemical exergy of the seawater was incorporated into the calculation as a real mixture, and not an ideal mixture, as in previous studies. The results show that using the ERT and PX reduced the total power consumption by 30% and 50%, and power consumption per m3 water to 5.0 kW/m3 and 3.6 kW/m3, respectively, from 7.2 kW/m3 in the standalone. Moreover, the exergy efficiency of the RO desalination improved by 49% and 77%, resulting from the usage of the ERT and PX (27.3% and 32%), respectively. For the RO desalination system studied, the total exergy destruction was reduced from 690 kW in the standalone to 411 kW with ERT and 324 kW with PX. The results also show that, when the ERT and PX were not in use, rejected seawater represented around 42% of total exergy destruction, whereas the corresponding percentages were 0.07% and 0.64% with ERT and PX, respectively. It is clear that the PX gives low power consumption, low exergy destruction and high exergy efficiency. In addition, RO with the PX involves higher minimum separation work and the smallest area compared to the other two configurations.


