Article

Investigation of the Promotion of Wind Power Consumption Using the Thermal-Electric Decoupling Techniques

Department of Electrical Engineering, Harbin Institute of Technology, Harbin 150001, China
*
Author to whom correspondence should be addressed.
Energies 2015, 8(8), 8613-8629; https://doi.org/10.3390/en8088613
Submission received: 5 June 2015 / Revised: 5 July 2015 / Accepted: 6 August 2015 / Published: 13 August 2015
(This article belongs to the Special Issue Thermoelectric Energy Harvesting)

Abstract

:
In the provinces of north China, combined heat and electric power generations (CHP) are widely utilized to provide both heating source and electricity. While, due to the constraint of thermal-electric coupling within CHP, a mass of wind turbines have to offline operate during heating season to maintain the power grid stability. This paper proposes a thermal-electric decoupling (TED) approach to release the energy waste. Within the thermal-electric decoupling system, heat storage and electric boiler/heat pump are introduced to provide an auxiliary thermal source during hard peak shaving period, thus relying on the participation of an outside heat source, the artificial electric power output change interval could be widened to adopt more wind power and reduce wind power curtailment. Both mathematic models and methods are proposed to calculate the evaluation indexes to weight the effect of TED, by using the Monte Carlo simulation technique. Numerical simulations have been conducted to demonstrate the effectiveness of the proposed methods, and the results show that the proposed approach could relieve up to approximately 90% of wind power curtailment and the ability of power system to accommodate wind power could be promoted about 32%; moreover, the heating source is extended, about 300 GJ heat could be supplied by TED during the whole heating season, which accounts for about 18% of the total heat need.

1. Introduction

With the increasing of wind power penetration, more and more people could enjoy this clean and inexhaustible energy. While, due to intermittency, volatility and difficulty of prediction, the consumption of wind energy is a severe task for the power grid [1,2], especially for the areas that require a heat supply. Taking the Jilin Province China, for instance, in order to guarantee the stability of power grid and the sufficiency of heat supply, the whole electric power system’s total minimum forced electric power output is close minimum electric load. As a result, the gross wind power curtailment rate is about 23% in recent years and approximately 80% occurring during the heating season in this province [3]. Such a high wind power curtailment rate is not only unacceptable in economic terms but discouraging the positivity of renewable energy development.
At present, types of energy storage techniques, such as pumped energy storage, compressed-air energy storage, flywheels and batteries, plug-in vehicles are widely discussed to avoid wind power curtailment [4,5,6,7,8,9,10,11,12,13]. While such kinds of energy storage technologies are all working on the charging-saving-discharging of electricity, and they transform electricity into other forms of energy when the system generation is in excess, and back into electricity when the system load could not be supplied adequately. Thus, a mass of energy is wasted during the two times of energy transformation process.
The concept of heat storage was introduced in [14] for wind power integration. After that, a variety of heat storage techniques have been discussed, especially in Nordic countries. Reference [15] analyzed the economic value of using electric heat boilers and heat pumps as wind power integration measures relieving the link between the heat and power production in combined heat and electric power (CHP). In [16,17,18,19,20,21,22,23], the performance of electric boilers and heat pumps were further discussed. The thermal-electric decoupling technique, as a relatively energy-saving way, was introduced in [18] to increase the peak-shaving ability of power systems to accommodate wind power. This technique transforms electricity into thermal energy, as an outside heating source, to provide services for heating load directly. Thus, CHPs could decrease their heating outputs to release more peak load regulating capacity to take part in the system dispatch.
Since energy transformation is only one time, the heat storage techniques, as a promising measure, have been beginning to receive some attention for wind power integration. However, how to evaluate the effects of adding heat storage on wind power curtailment, still needs further investigation. This paper proposes a thermal-electric decoupling approach to decrease the wind power curtailment. Firstly, the tie of thermal-electric coupling of CHP is described. Then, a decoupling scheme is presented and its functional mechanism is analyzed. The calculating method and procedures are given for the calculation of wind power curtailment in Section 3. Finally, case studies are conducted to verify the effectiveness of the proposed method. In this section, the Monte Carlo simulation technique is employed to sample the wind power uncertainties and other system operating conditions.

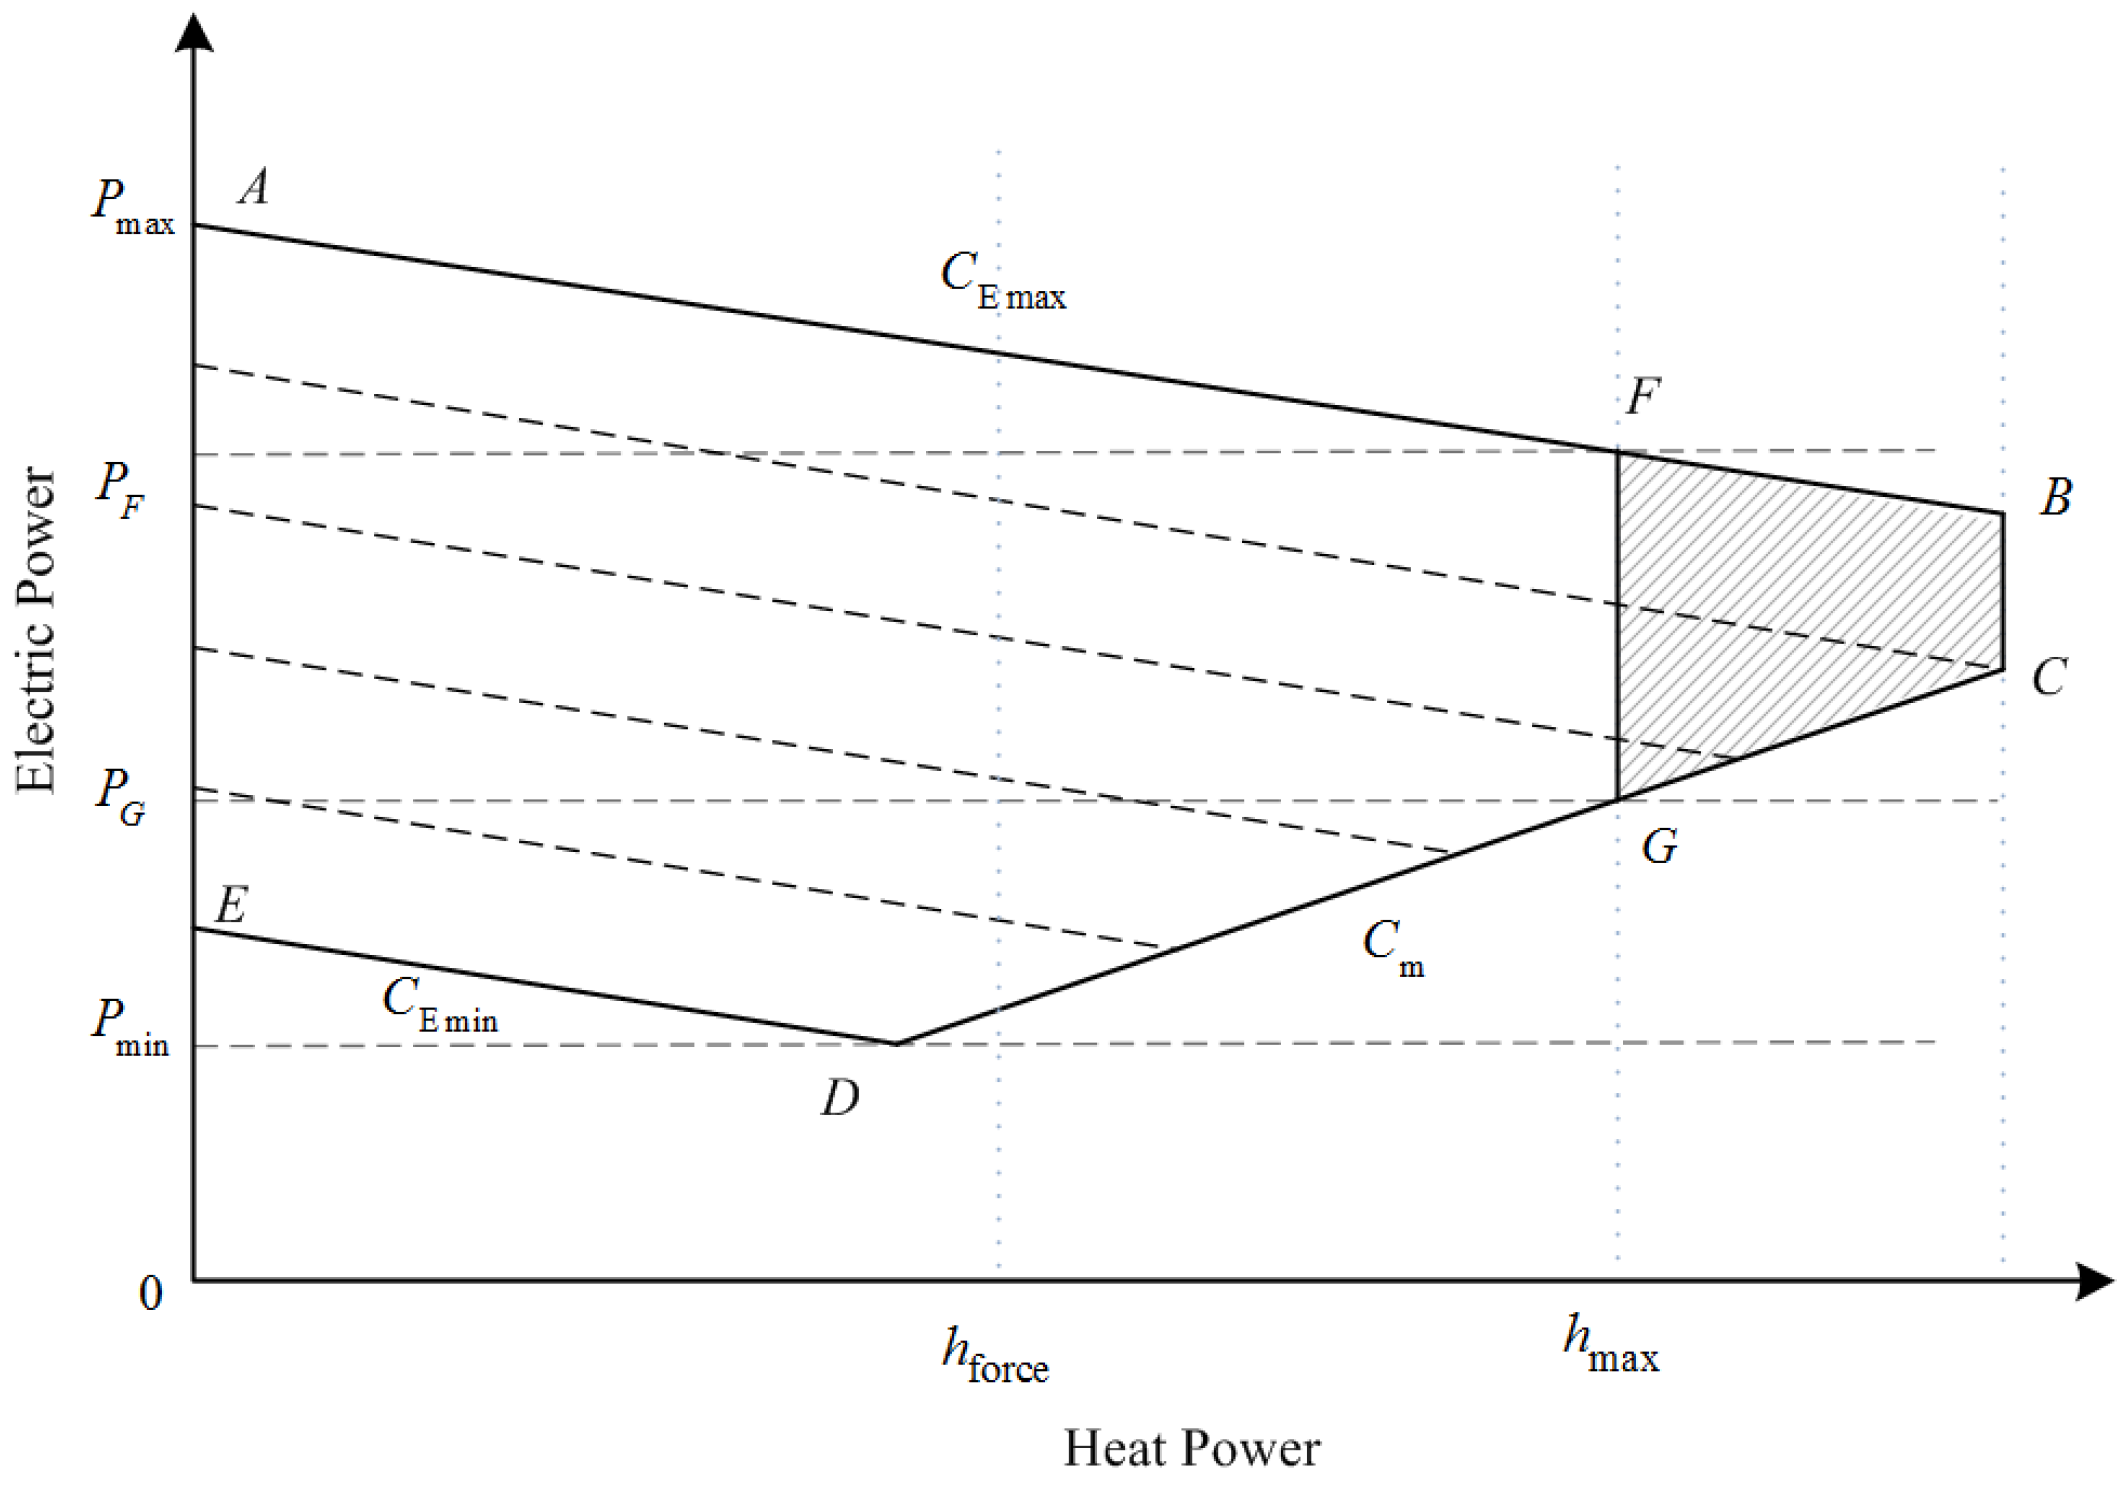
2. Problem Statement (Concept of the Thermal-Electric Coupling of CHPs)

In China’s north provinces, the combined heat and electric power generations, especially extraction of turbo-generator units, are widely utilized to satisfy the thermal needs during heating season. As shown in Figure 1, the operating zone of a typical extraction turbo-generator unit is illustrated [24] where, Pmax and Pmin and are the maximum and minimum electric power output, respectively. In addition, the heat power output could be interval adjustable control range from 0 to hmax When the unit operating on the line AE, it could be treated as a straight condensing turbo-generator unit, whereas, as a back pressure turbo-generator unit when operating on the line of DC. By adjusting the heat extraction volume from the turbine, the typical extraction turbo-generator unit could work between straight condensing mode and back pressure mode, which means the unit could be operated within the area ACBDE. As the policy of “Ordering Power by Heat”, a forced minimum heat power output hforce is regulated to guarantee the thermal needs during heating season, PF and PG are the maximum and minimum electric power output by the policy, respectively. Indeed, the extraction turbo-generator unit only works within the trapezoid area BCGF, during heating season. Because of the narrow of electric power output adjusting interval, the peak-shaving capability of the CHP unit is limited in the heating season to participate wind power consumption.
Figure 1. Thermal-electric coupling relationships of extraction turbo-generator unit.
Energies 08 08613 g001
Regarding the characteristics of wind, the output of wind power presents strong randomness, intermittency, anti-regulatory and volatility. As is shown in Figure 2, the integration of mass wind power expands the difference of traditional energy power output between peak and valley load period. The anti-regulatory characteristics of wind power leads to a larger requirement of system peak shaping capacity. Moreover, the thermal-electric coupling of CHPs and continuous heating demand restrict the co-generators’ power output adjustable interval. Thus, compared with non-heat-season, the occurrence probability of wind power curtailment markedly increases.
Figure 2. A sketch map of reverse peak regulation characteristics of wind power.
Energies 08 08613 g002
where
P r , min = i = 1 K P r min , i
P TE, t = P demand , t P WF, t
and PTE,t is the traditional energy power output demand at moment t, which means the difference between system electric load demand Pdemand,t and wind farm power output PWF,t, Prmin,i is the minimum power output of traditional energy generator i during heat season Pr,min is the traditional energy power output changing interval lower boundaries, respectively.

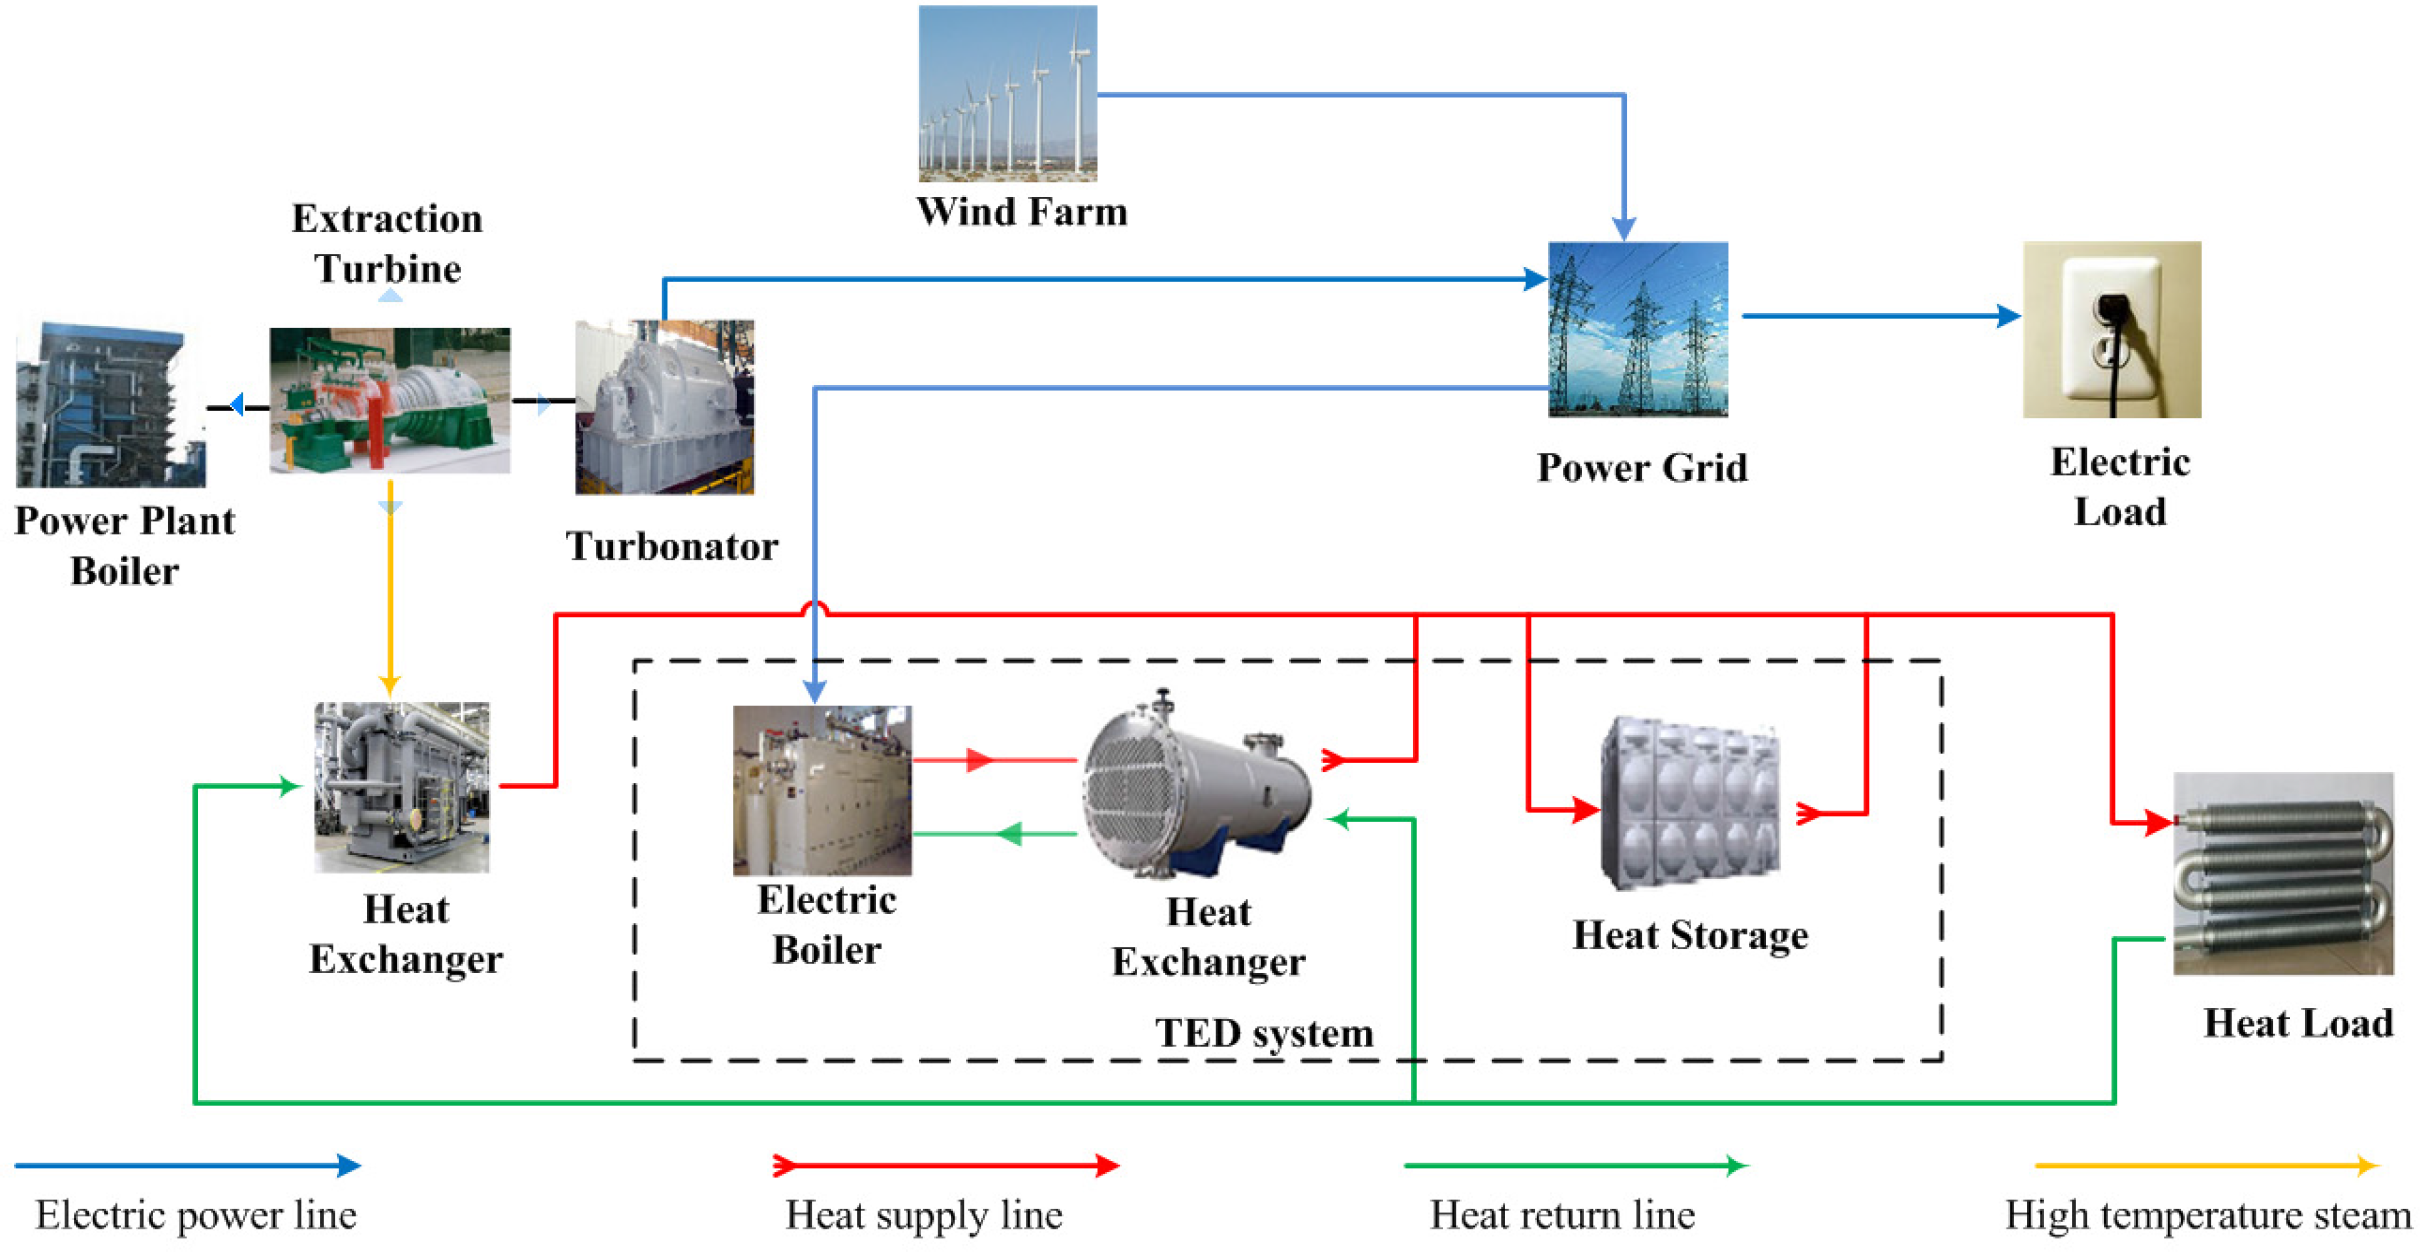
3. Proposed Schemes to Reduce the Thermal-Electric Coupling of CHPs

3.1. Principle of Thermal-Electric Decoupling

During the valley-load period in heating season, because of the heating supply constraint, the CHP units are restricted to a relative high working condition comparatively. Due to the thermal-electric coupling of the CHP unit, the electric power output are also compelled in a relatively high interval, and it shrinks the space acceptance for wind power. Thus, there are two ways that could be adopted to enhance the capacity of wind power integration: one is to reduce CHP unts’ minimum required electric power outputs by introducing an outside heating resource to compensate the reduced heating power output of CHPs, and the other way is to accrete additional electric load to boost the electric load level during valley-load period and superfluous wind power directly.
Figure 3 illustrates the schematic diagram of the scheme of the thermal-electric decoupling. The heat storage plays a role as an outside heat resource. The heat storage connected with heat supply pipeline in parallel, it absorbs heat medium during peak and ordinary load periods and saves it in insulated tanks, while then feeding it back to the heat supply pipeline to compensate the reduce heating power output of CHP. The electric boiler plays the both roles of outside heating resource and additional electric load. The electric boiler connects with power grid and transforms superfluous electric energy into heating energy. Due to the difference of the heat mediums of the electric boiler and heating system, a heat exchanger is necessary. The heat exchange increases the temperature of heat medium absorbed from the heat return line by the heat generated from the electric boiler, and feeds the high temperature heat medium back to the heat supply line for the heating system.
Figure 3. Schematic diagram of the thermal-electric decoupling scheme.
Energies 08 08613 g003

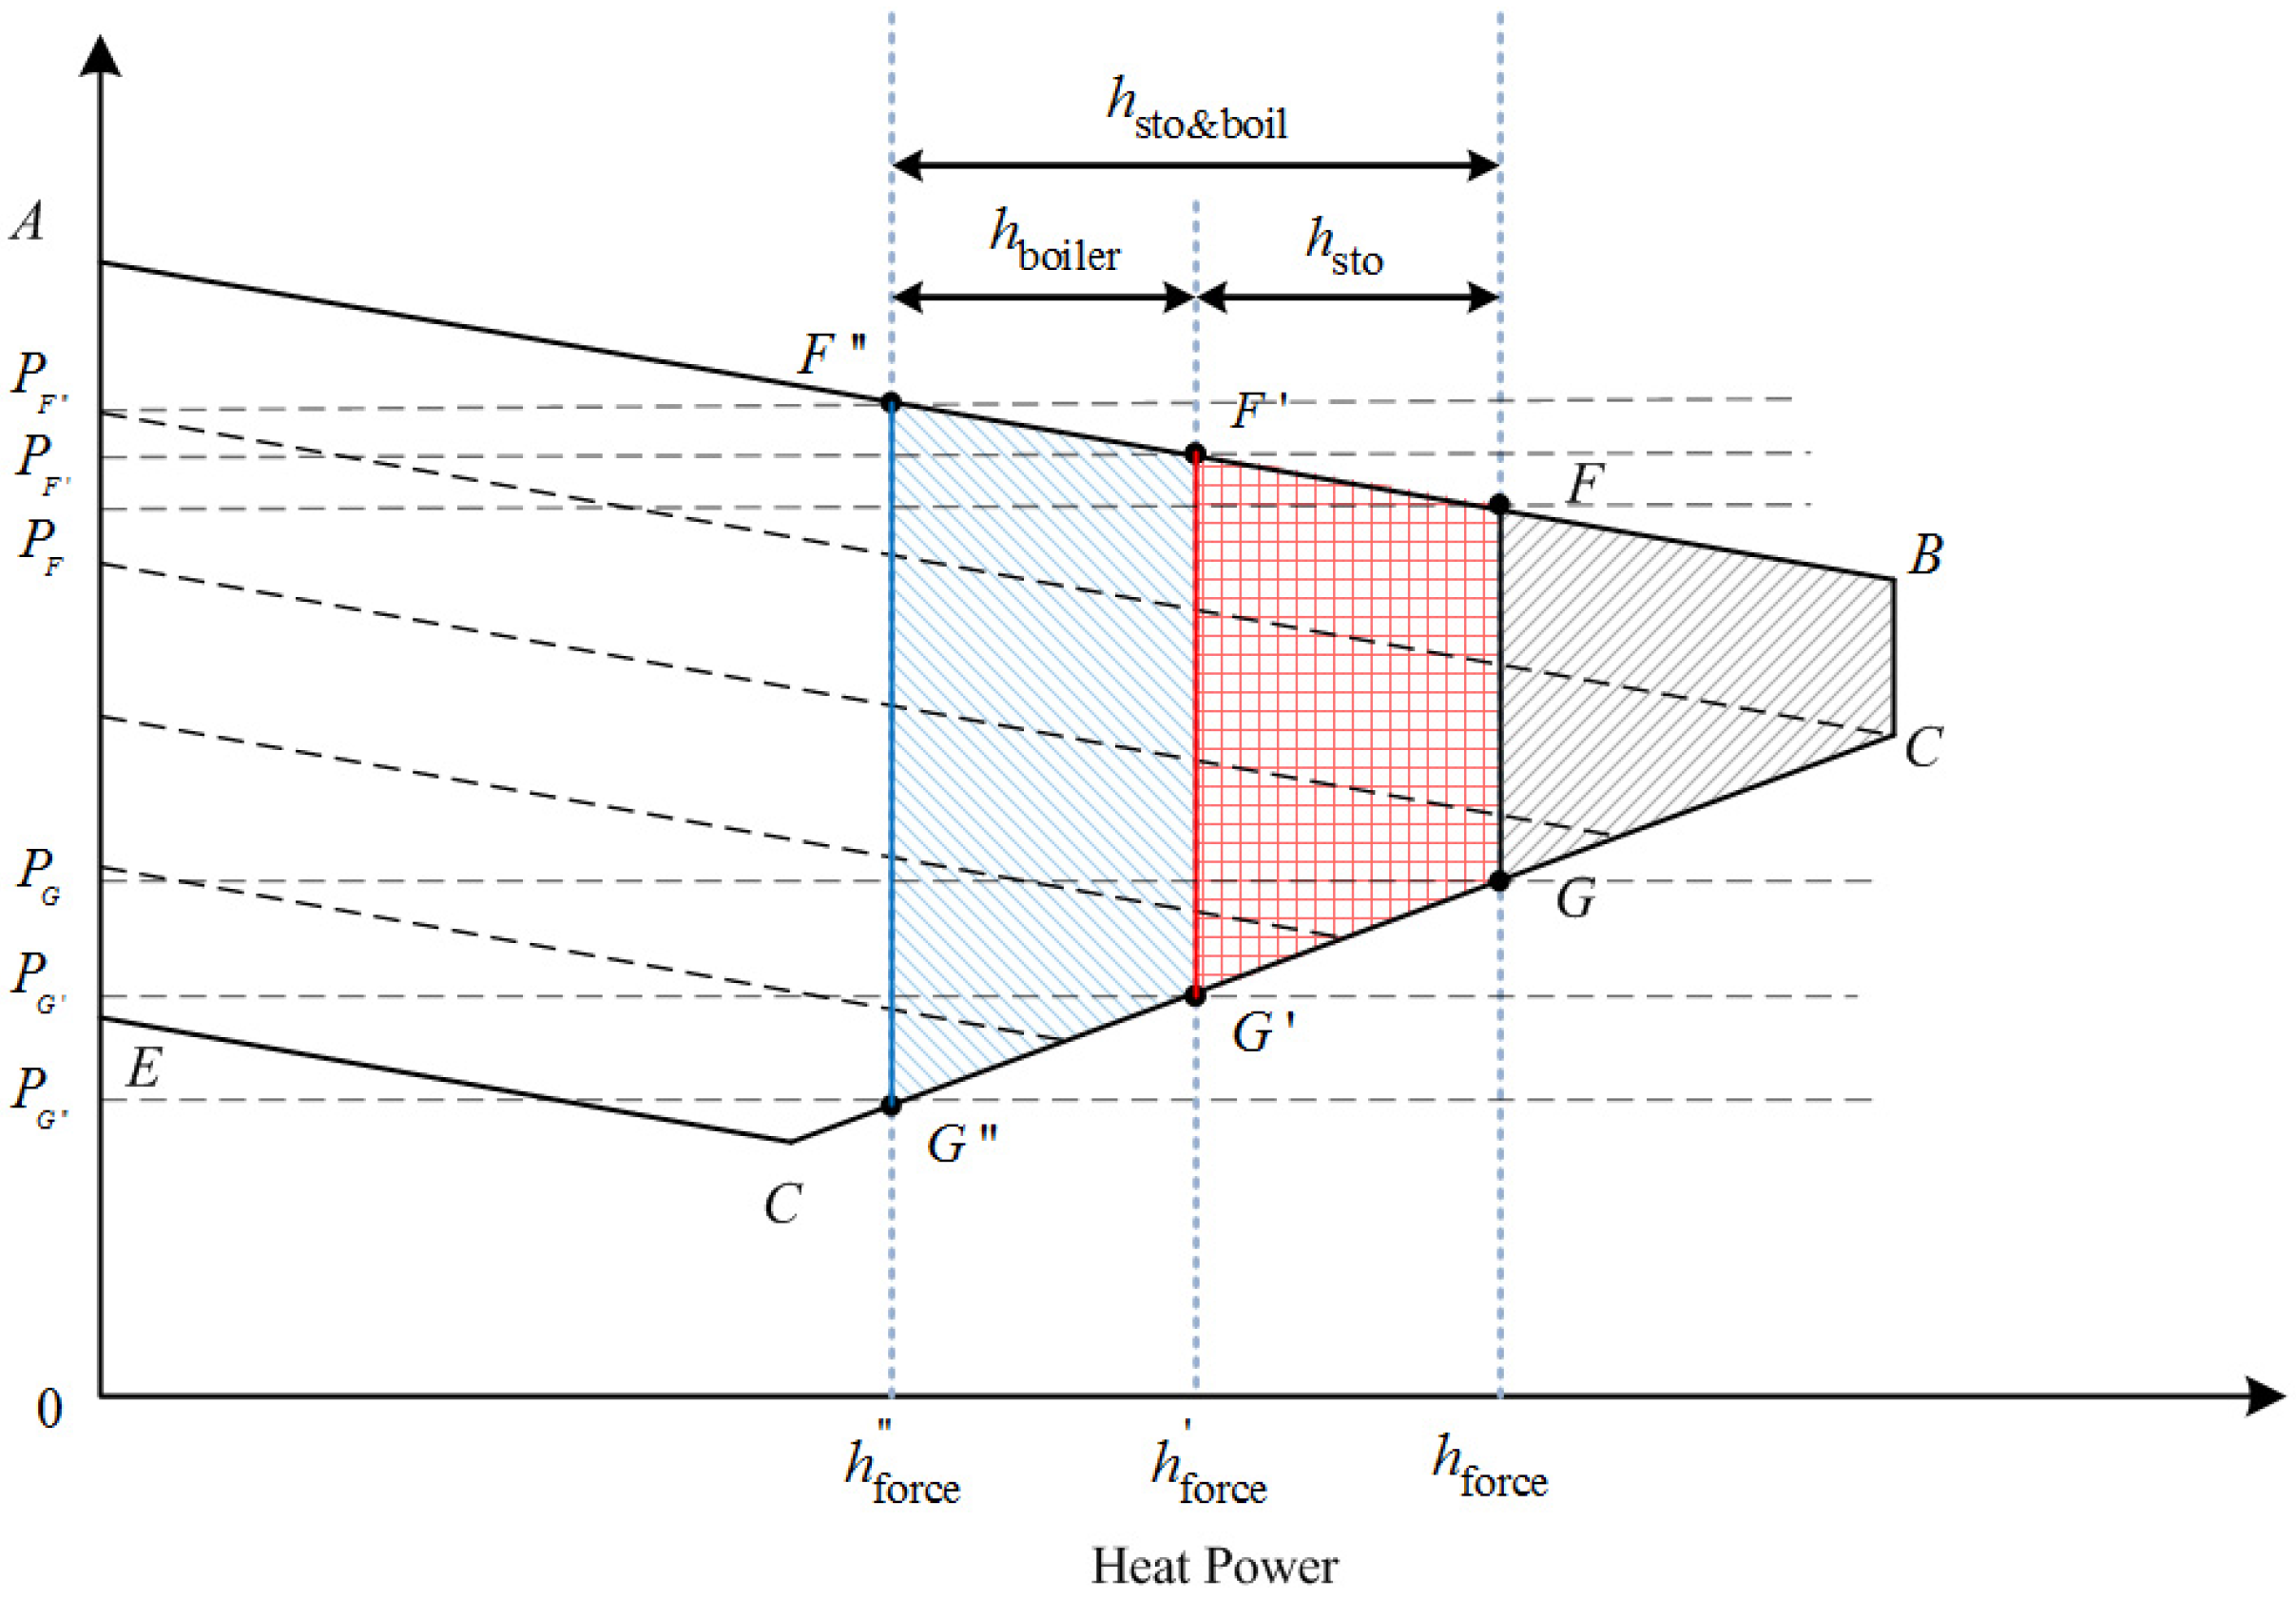
3.2. Effects of the Analysis of Auxiliary Thermal Sources on CHPs

After participation of heat storage, an outside thermal source, with a maximum heat power output of hsto, is added. Due to the participation of an extra heat power source, the electric power output interval of CHP could be expanded to P F and P G from P F and P G under the same heat limit h force as is shown in Figure 4. Meanwhile, because of the supplement of an outside heat source with the same heat load requirements, the heat need of the extraction turbo-generator unit reduces to h force , which means the adjustable interval of the unit’s electric power output could be widened to P F and P G . Obviously, the operation zone of the extraction turbo-generator unit enlarges to the area BCG′F′ during the heating season due to the participation of heat storage. Likewise, because of the proceeding participation of the electric boiler, the force minimum heat power output reduces to h force , the adjustable interval of electric power output widen to P F and P G and the operation zone enlarge to BCG″F″ . Due to the stored thermal in heat storage and the heat output from electric boiler, a maximum heat power h sto&boil could be supplied during the outage period of the CHP.
h sto&boil = h sto + h boiler
h force = h force h sto
h force = h force h sto&boil
h sto and h boiler are the heat power output by heat storage and electric boiler, respectively.
Figure 4. The effects of thermal-electric decoupling on the extraction turbo-generator unit.
Energies 08 08613 g004

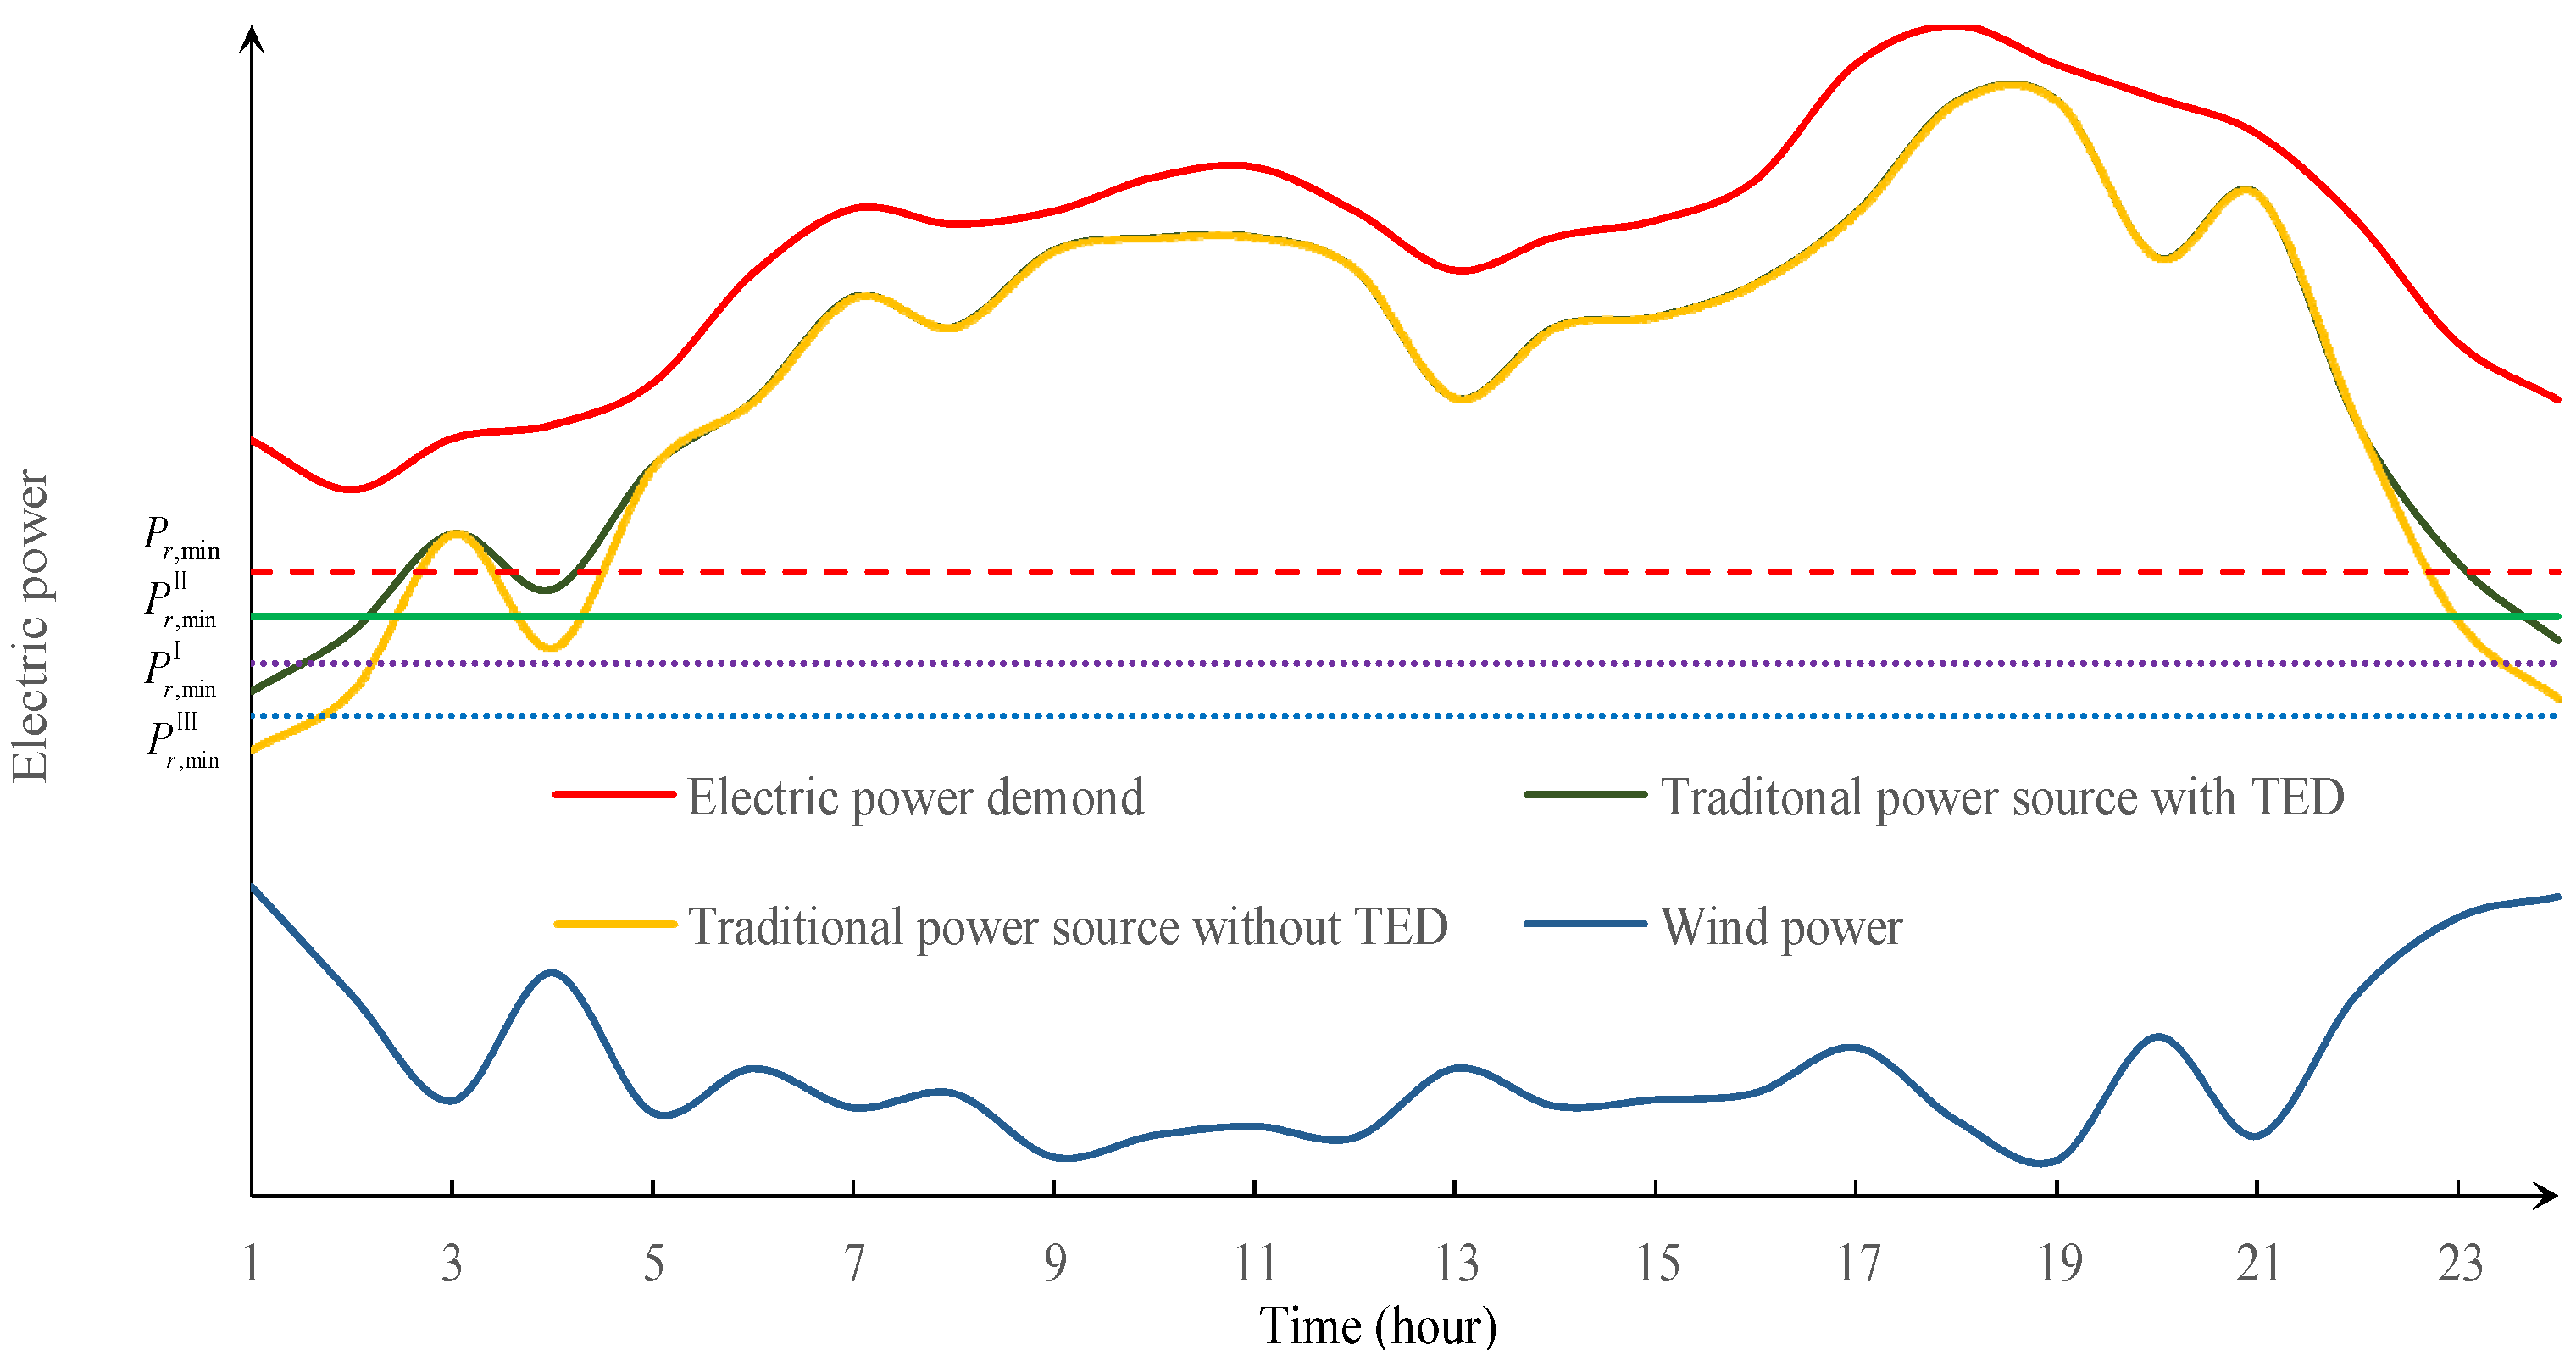
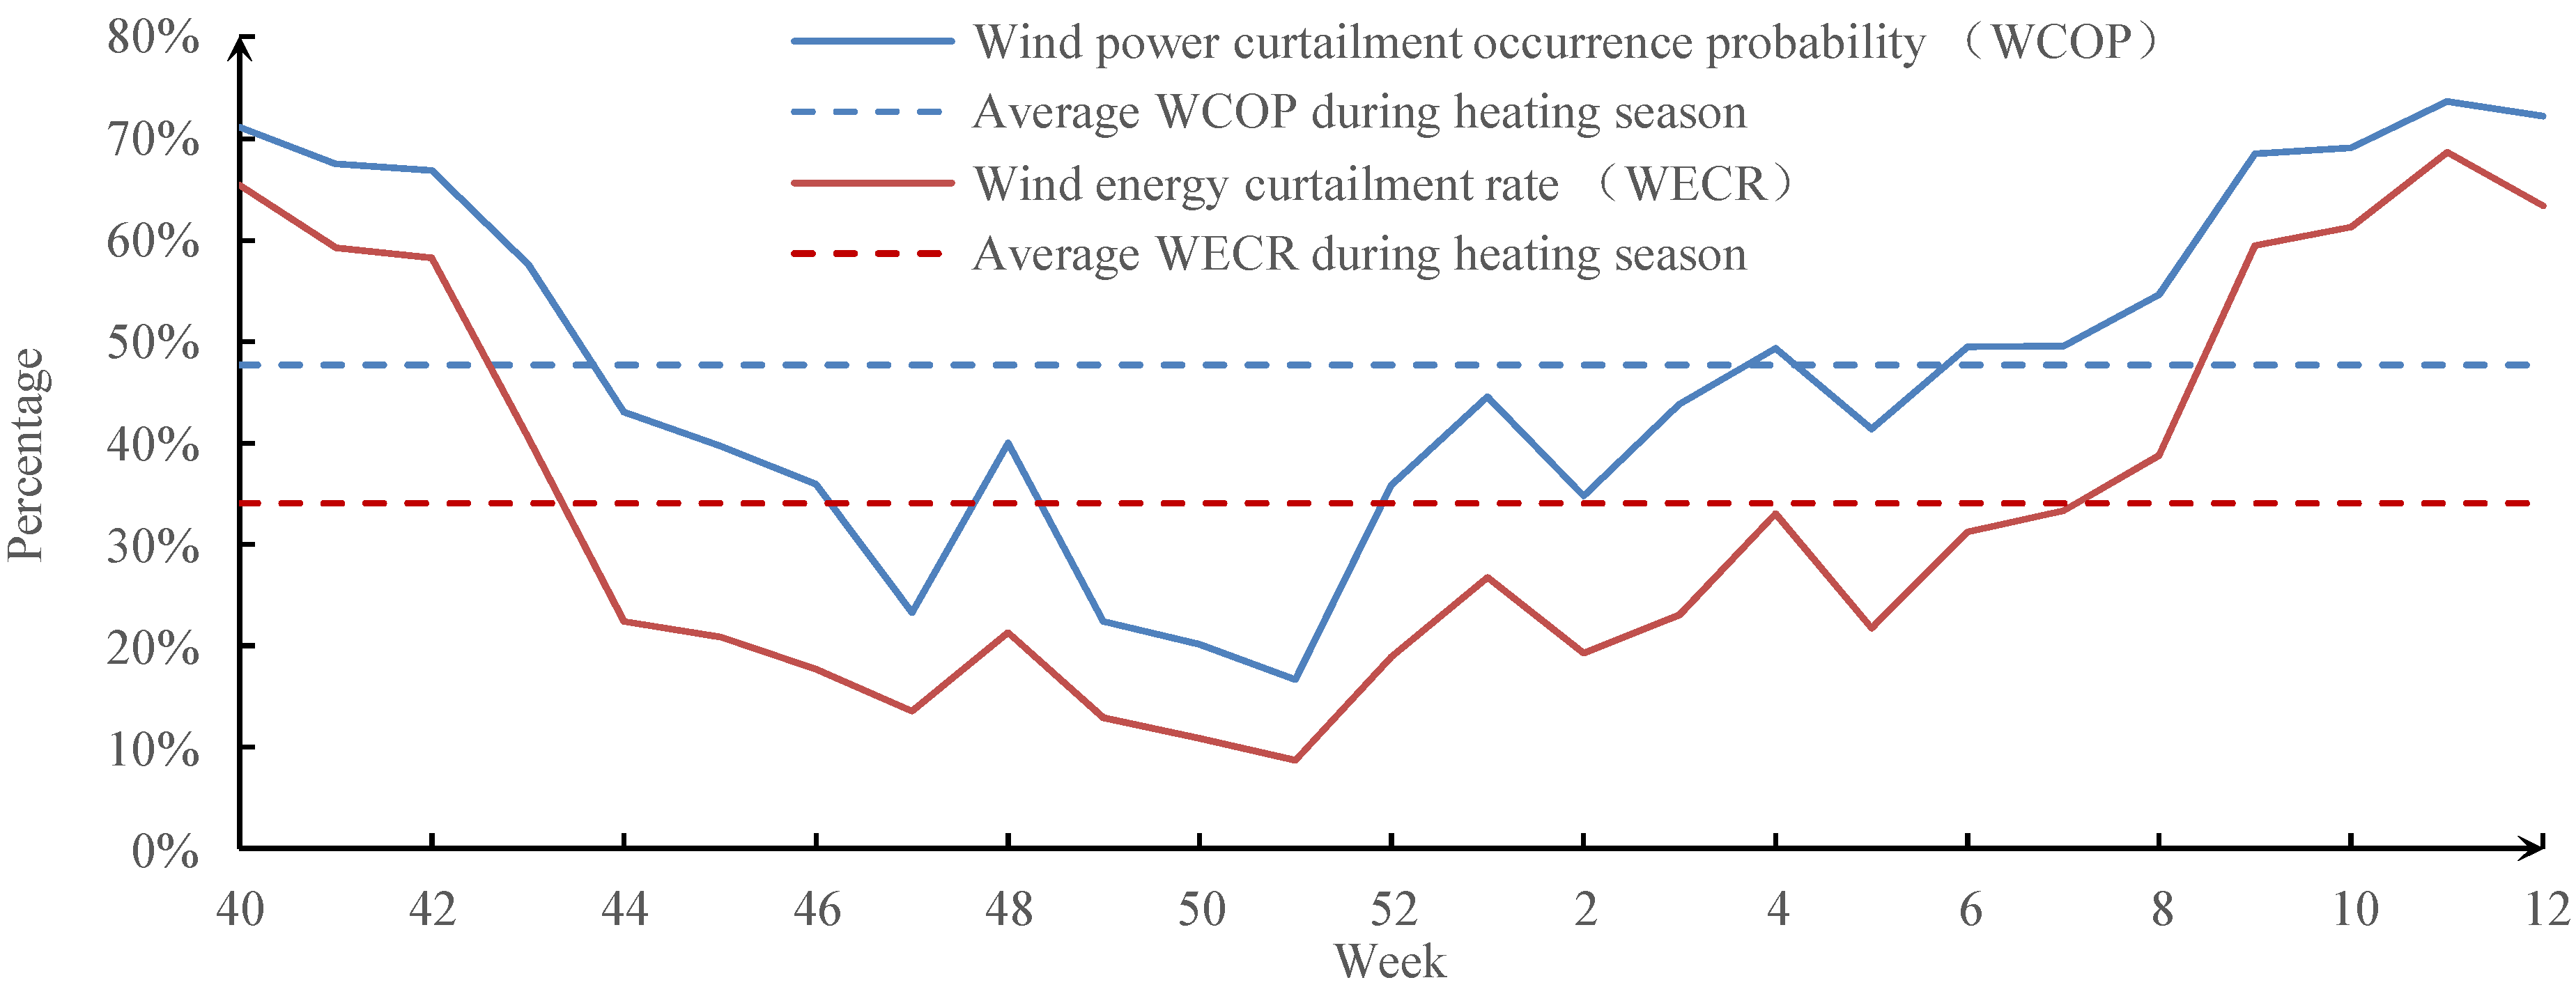
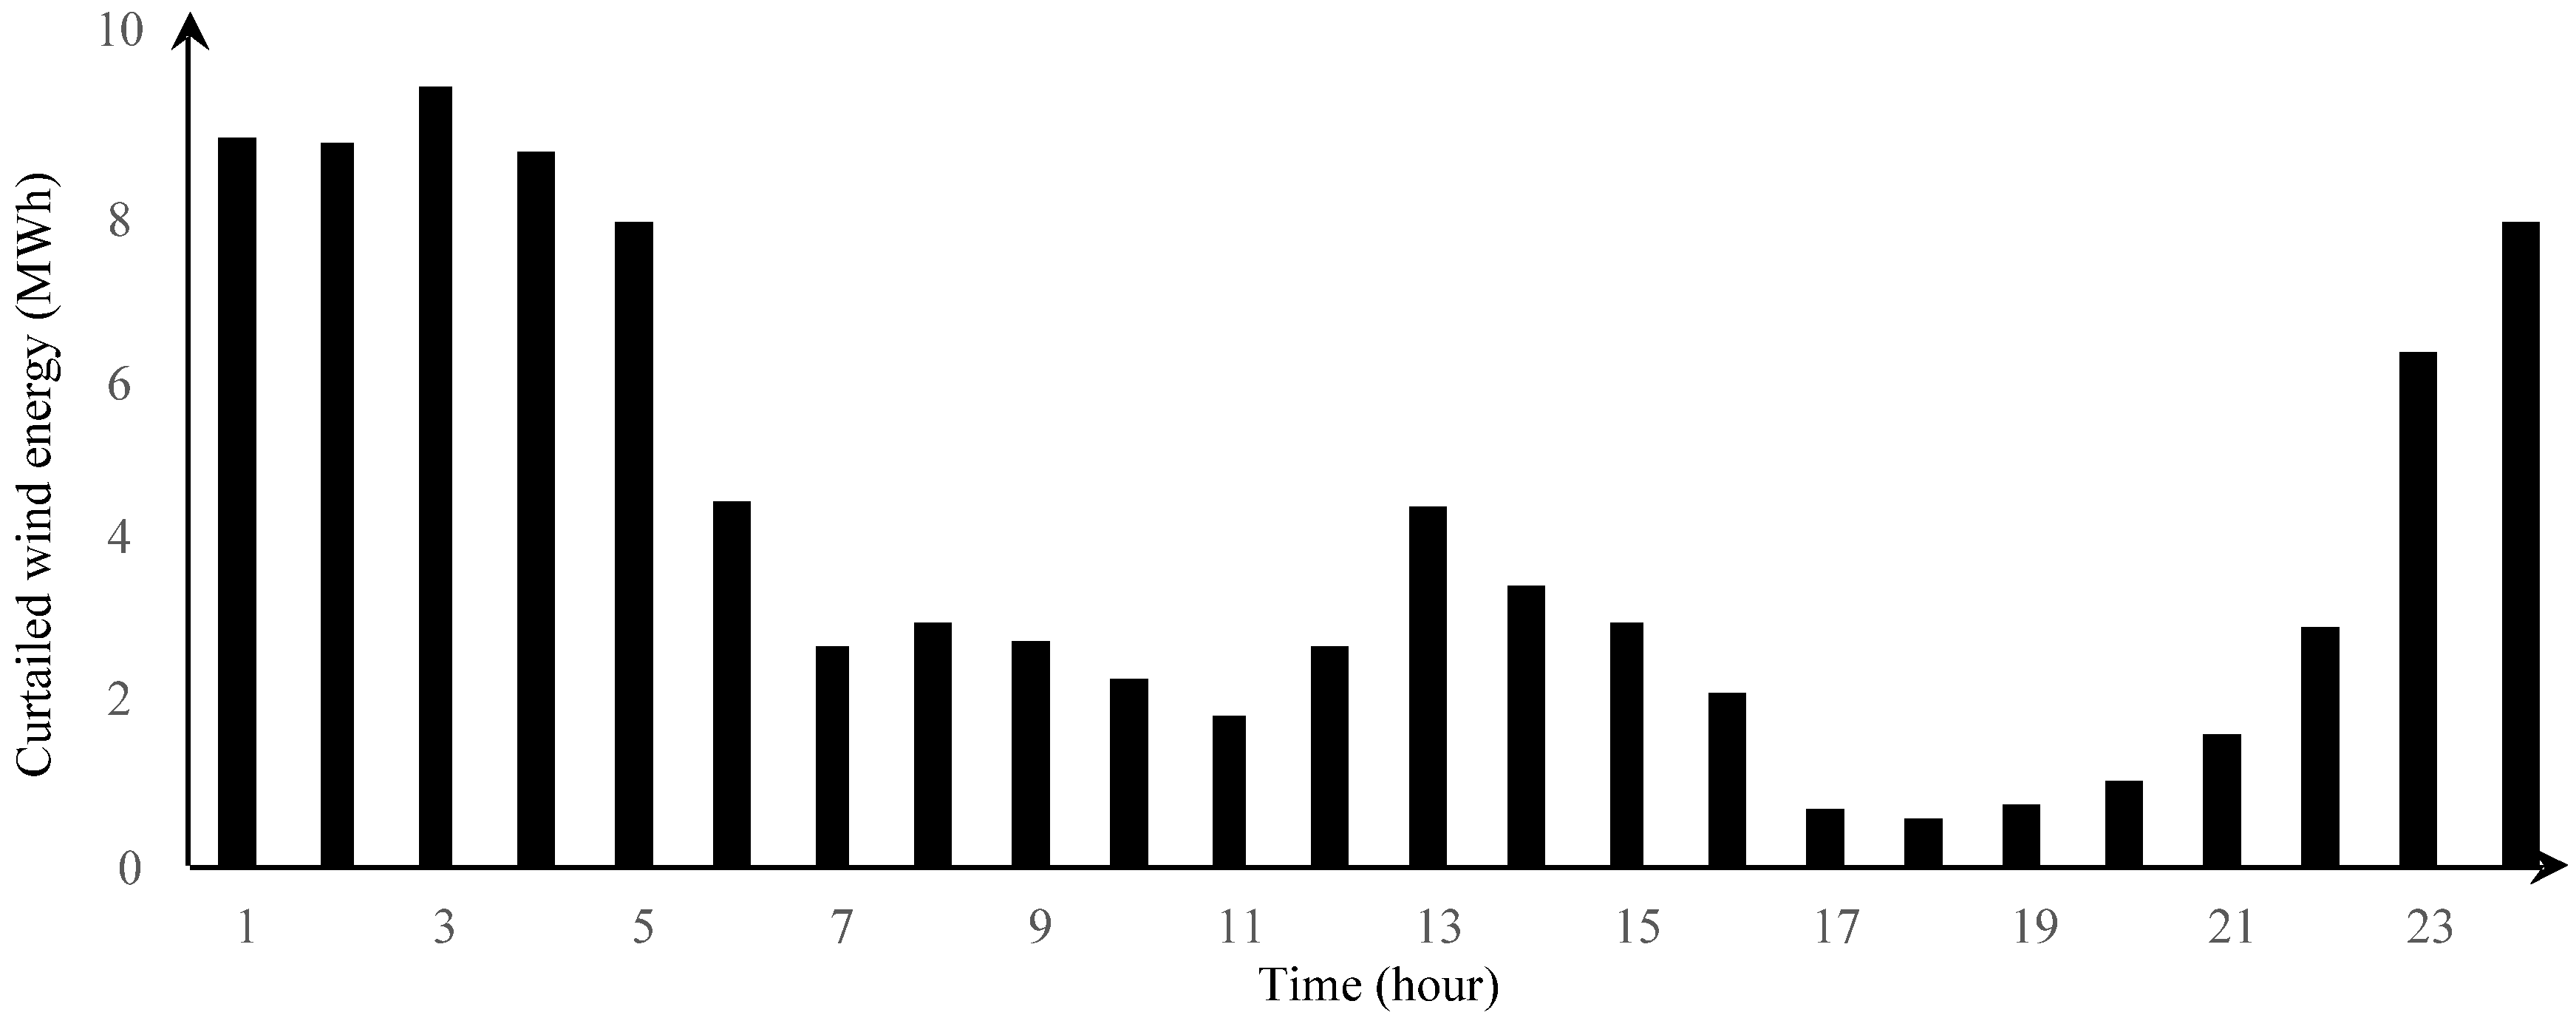
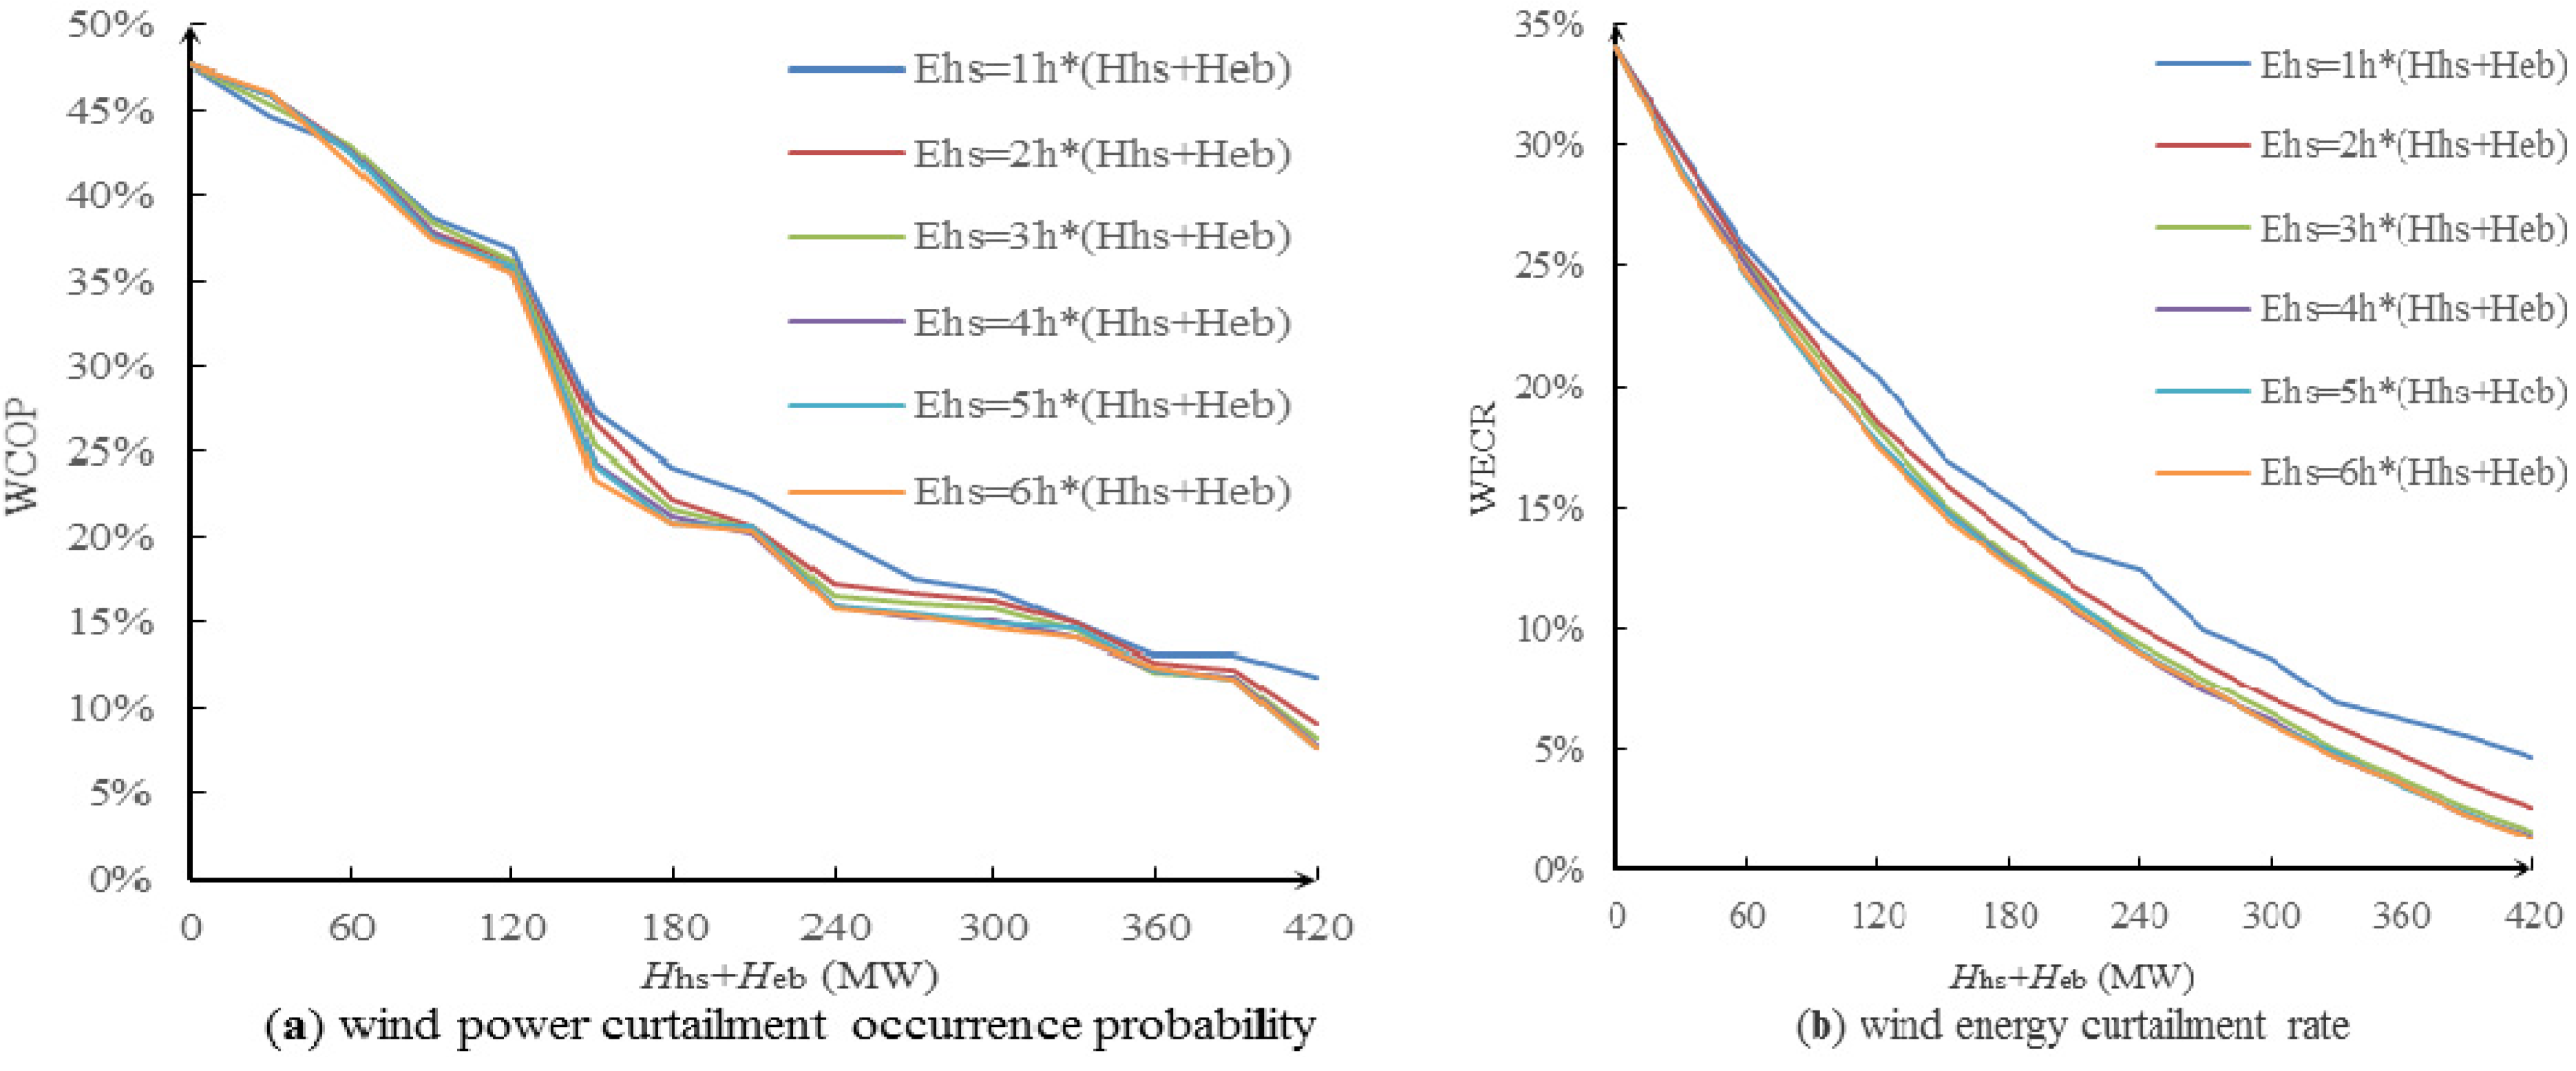
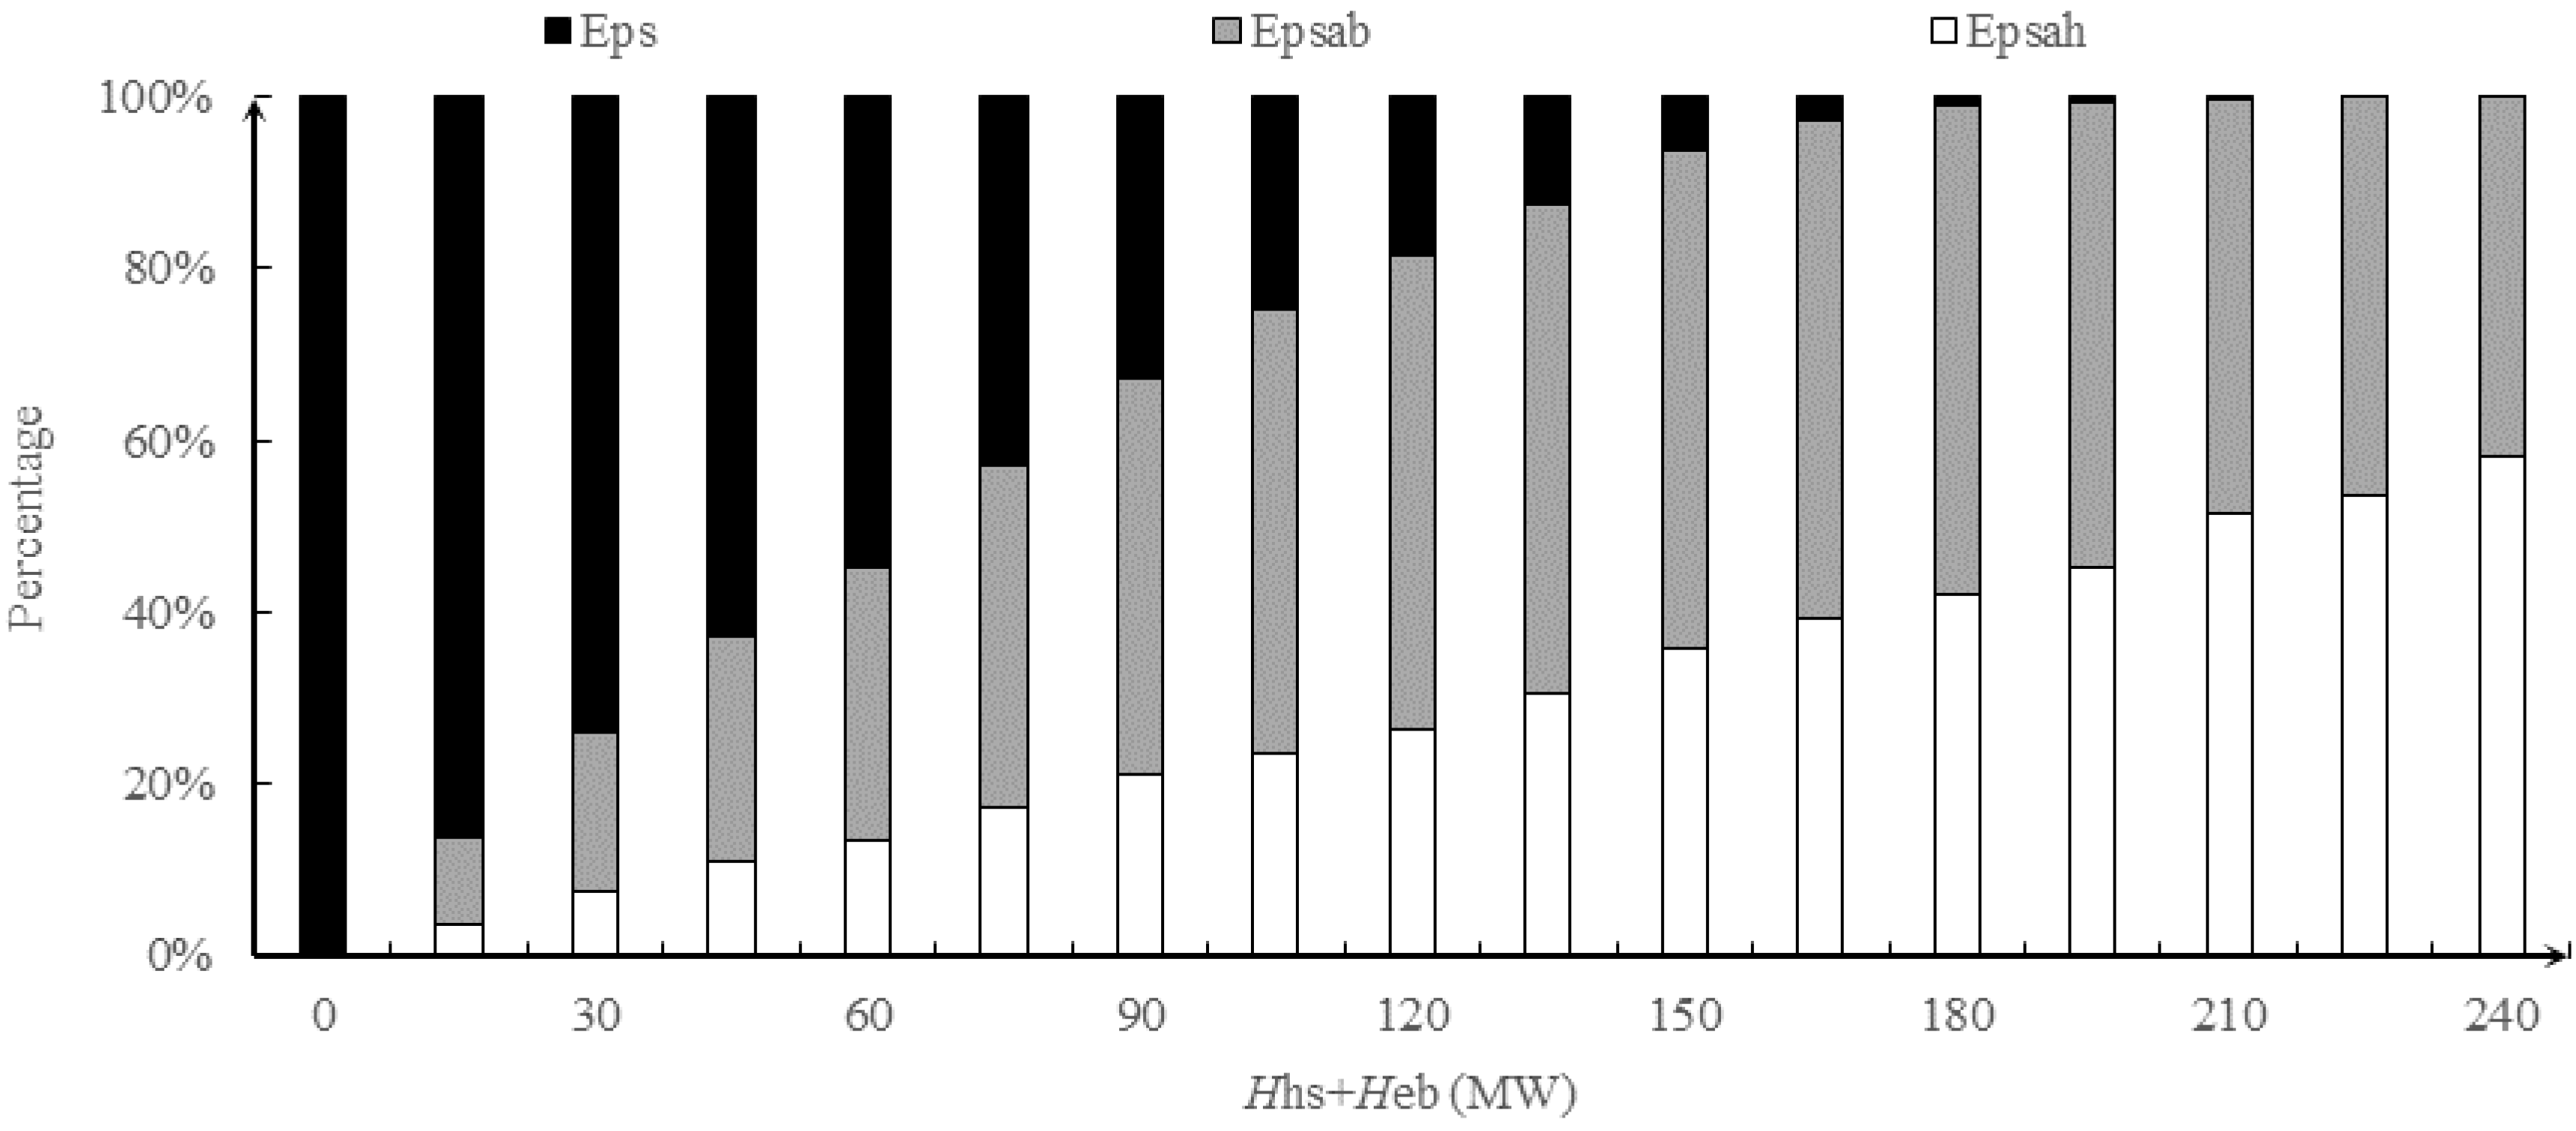
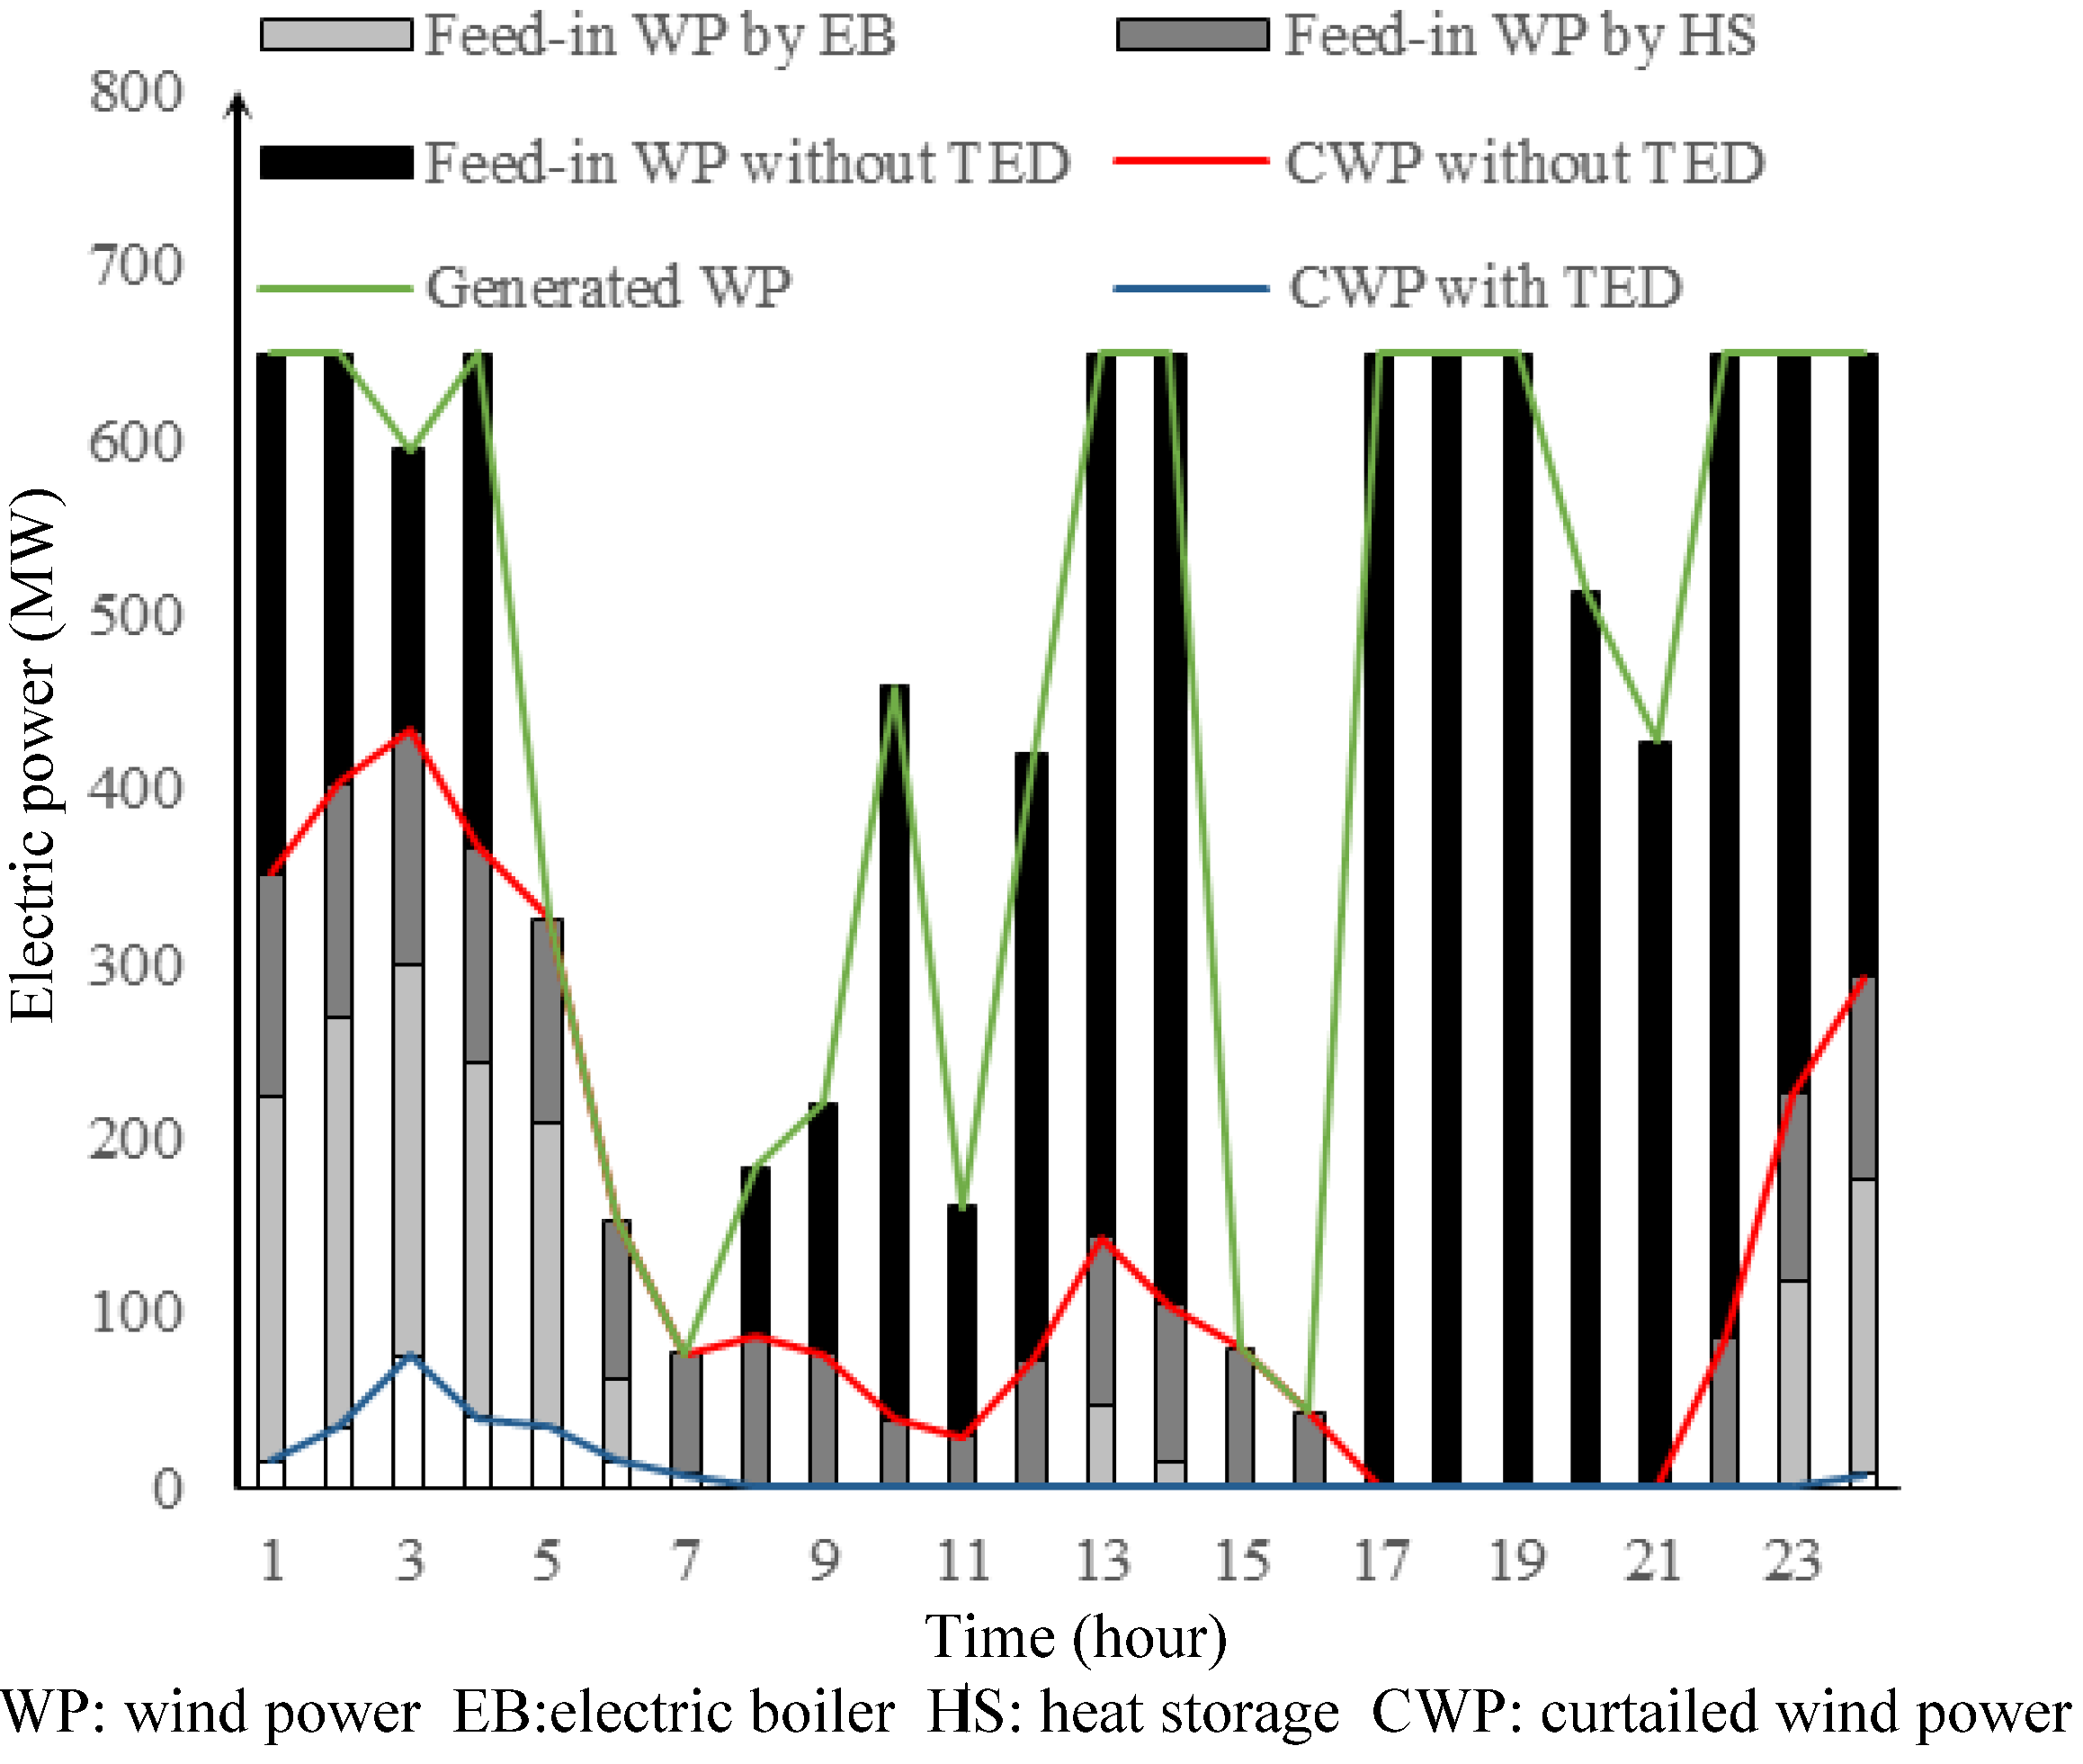
3.3. Technical Analysis of Auxiliary Thermal Sources on Wind Power Curtailment

The impact of the participation of thermal-electric decoupling (TED) is shown in Figure 5, which improves the wind power consumption capacity of the power system during a typical day in the heating season. As is illustrated in Figure 5 and Table 1, after the integration of mass wind power and the execution of “Ordering Power by Heat” policy during heating season, the lack of system peak shaving capacity has enhanced. Without adopting any measures, wind energy surplus occurs at 1 a.m., 2 a.m., 4 a.m., 11 p.m. and 12 p.m. For the participation of heat storage, the wind power curtailment can be avoided at 4 a.m. and 11 p.m. Proceeding to the next step, the participation of the electric boiler could remit the occurrence of wind power surplus by supplying an outside thermal source. In addition the system load level could be increased to provide more interspace for wind power consumption. Moreover, although all of the measures are adopted, the power surplus at 1 a.m. and power lack at 6 p.m. only could be remitted but avoided. That is the cost of the mass wind power integration.
Figure 5. A sketch map of reverse peak regulation characteristics of wind power.
Energies 08 08613 g005
Table 1. The effects of different operating mode of thermal-electric decoupling (TED) on wind power curtailment.
MeasureWind Power Curtailment
No measure1 a.m., 2 a.m., 4 a.m., 11 p.m., 12 p.m.
HS only1 a.m., 2 a.m., 12 p.m.
EB only (EB store the heat)1 a.m., 2 a.m., 4 a.m., 12 p.m.
EB only (EB release the heat)1 a.m., 2 a.m., 12 p.m.
HS & EB (EB store the heat)1 a.m., 12 p.m.
HS & EB (EB release the heat)1 a.m.
HS: heat storage; EB: electric boiler.
P r , min = P r , min P sto = P r , min i = 1 K δ h sto , i C E min , i
P r , min = P r , min P boil = P r , min i = 1 K δ h boil, i C E min , i
P r , min = P r , min P sto&boil = P r , min i = 1 k δ ( h sto , i + h boil , i ) C E min , i
P TE , t = P TE , t P boil,E
{ δ = 1 if   TED   is   configured   for   generator   i δ = 0 otherwise
P TE , t is the traditional energy power output demand with the participation of TED. P r , min is the lower boundary values of system power output after the participation of heat storage; P r , min is the lower boundary value after the operation of electric boiler. P r , min is the lower boundary value after the co-operation of heat storage and electric boiler.

4. Technical Evaluation of Thermal-Electric Decoupling

4.1. Assessment Indexes

Some assessment indexes are put forward to evaluate the impacts of TED.
E wind = 1 N P wind , t
E cur = 1 N P cur , t
E CAB = 1 N P CAB , t
E CAH = 1 N P CAH , t
R wind_cur = b N 100 %
R energy_cur = E cur E wind 100 %
where E wind is the electricity generated by wind turbines during heating season, P wind , t is the wind power at moment t, N is the total sampling size during whole heating season. R wind_cur is the occurrence probability of wind power curtailment (WCOP). R energy_cur is the wind energy curtailment rate (WECR), P cur , t is the curtailed wind power. P CAB , t , P CAH , t , E CAB and E CAH respectively represent the avoided curtailing of wind power and wind energy by the participation of an electric boiler, and heat storage and the value of each are shown in Table 2.
Table 2. The discriminants and parameters values for different Scenarios.
Scenario P CAB , t P CAH , t P cur, t DiscriminationHeat Storage Status
A P r , min P eload , t 00 P eload , t < P r , min & & P eload , t > P r , min Out of work
B P r , min P eload , t 00 P eload , t < P r , min & & P eload , t P r , min Out of work
C P boil ( 1 + C m ) 0 P r , min P eload , t P eload , t < P r , max Out of work
D0 P eload , t P r , min 0 P r , min > P eload , t P r , min Work
E P r , min P eload , t P sto 0 P eload , t < P r , min & & P eload , t P r , min Work
F P r , min P eload , t P sto 0 P eload , t < P r , min & & P eload , t P r , min Work
G P boil ( 1 + C m ) P sto P r , min P eload , t P r , min > P eload , t Work
H000 P r , max P eload , t P r , min N/A

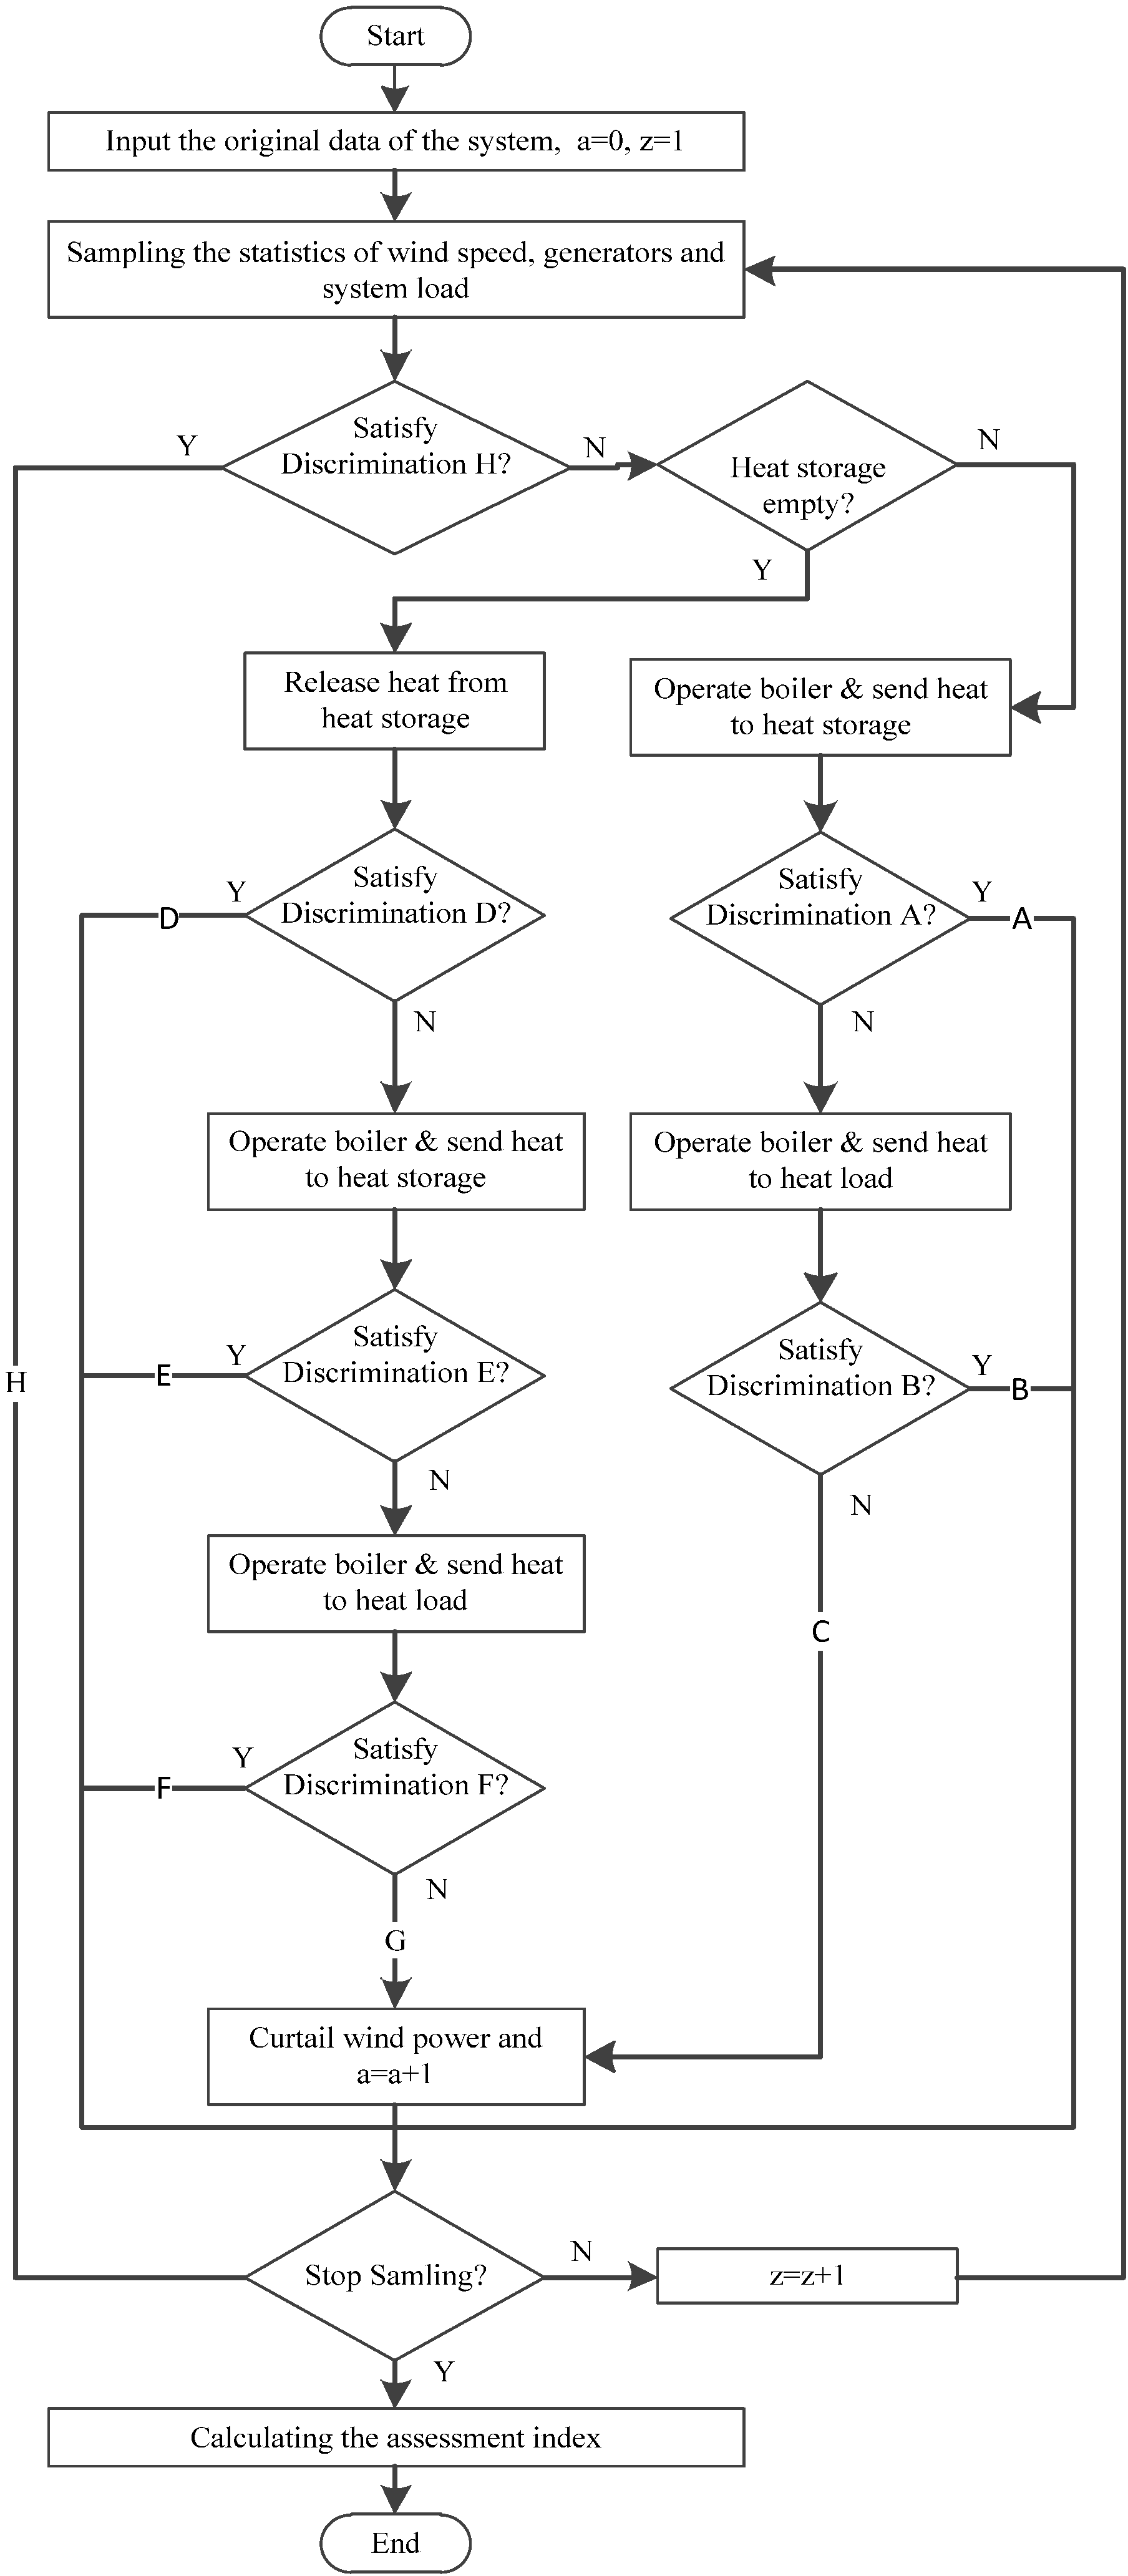
4.2. Calculating Procedures

The calculation of system wind power curtailment indexes involves, as is shown in Figure 6, two main steps. The first is to sample power system operating conditions. The second is to calculate the indexes by using the sampling data.
Figure 6. Flowchart of calculating the evaluation indexes.
Energies 08 08613 g006
Firstly, the Monte Carlo simulation technique is used to sample the system operating conditions. The sampling objects include the wind speed probability distribution, the weekly heat curves, and the system load curves, etc.
Secondly, the satisfaction of system peak shaving capacity using Discrimination H in Table 2 is checked. If negative, the stock in heat storage is checked. Once the stock could not supply heat to the heat load, operating electric boilers and storing the heat to heat storage is completed first, then Discrimination B is checked. If the discrimination can be satisfied, wind power curtailment can be avoided, otherwise, the heat should be sent to the heat load and the CHP’s electric power output should be reduced, followed by a check of Discrimination C. If the judge result of Discrimination C is positive, wind power curtailment still could be averted, or else, part of the wind turbines need to taken off of the grid to maintain system stability. If the heat supply works, firstly send heat to the heating network and decrease the CHP’s electric power output, then check Discrimination D. Non-wind power needs to be curtailed for a positive case, and for a negative case, the electric boiler to increase the system’s electric load level and store the heat in heat storage should be started. Then, continue to check Discrimination E. Similarly, wind power curtailment can be avoided if the condition satisfies Discrimination E; otherwise, heat needs to be sent to the heat load for adding another adjustable additional heat source and the electric power output of CHP needs to be further reduced. Then, after checking Discrimination F, once the discrimination could be met, no wind power needs to be curtailed, or certain parts of wind turbines have to be running offline to maintain the grid stability.
Finally, check the stopping criterion. If the maximum sampling times have not been reached, the sampling and calculating process needs to continue; otherwise, the calculating process and calculation of the indexes needs to be stopped.

5. Modeling and Numerical Simulations

5.1. System Modeling

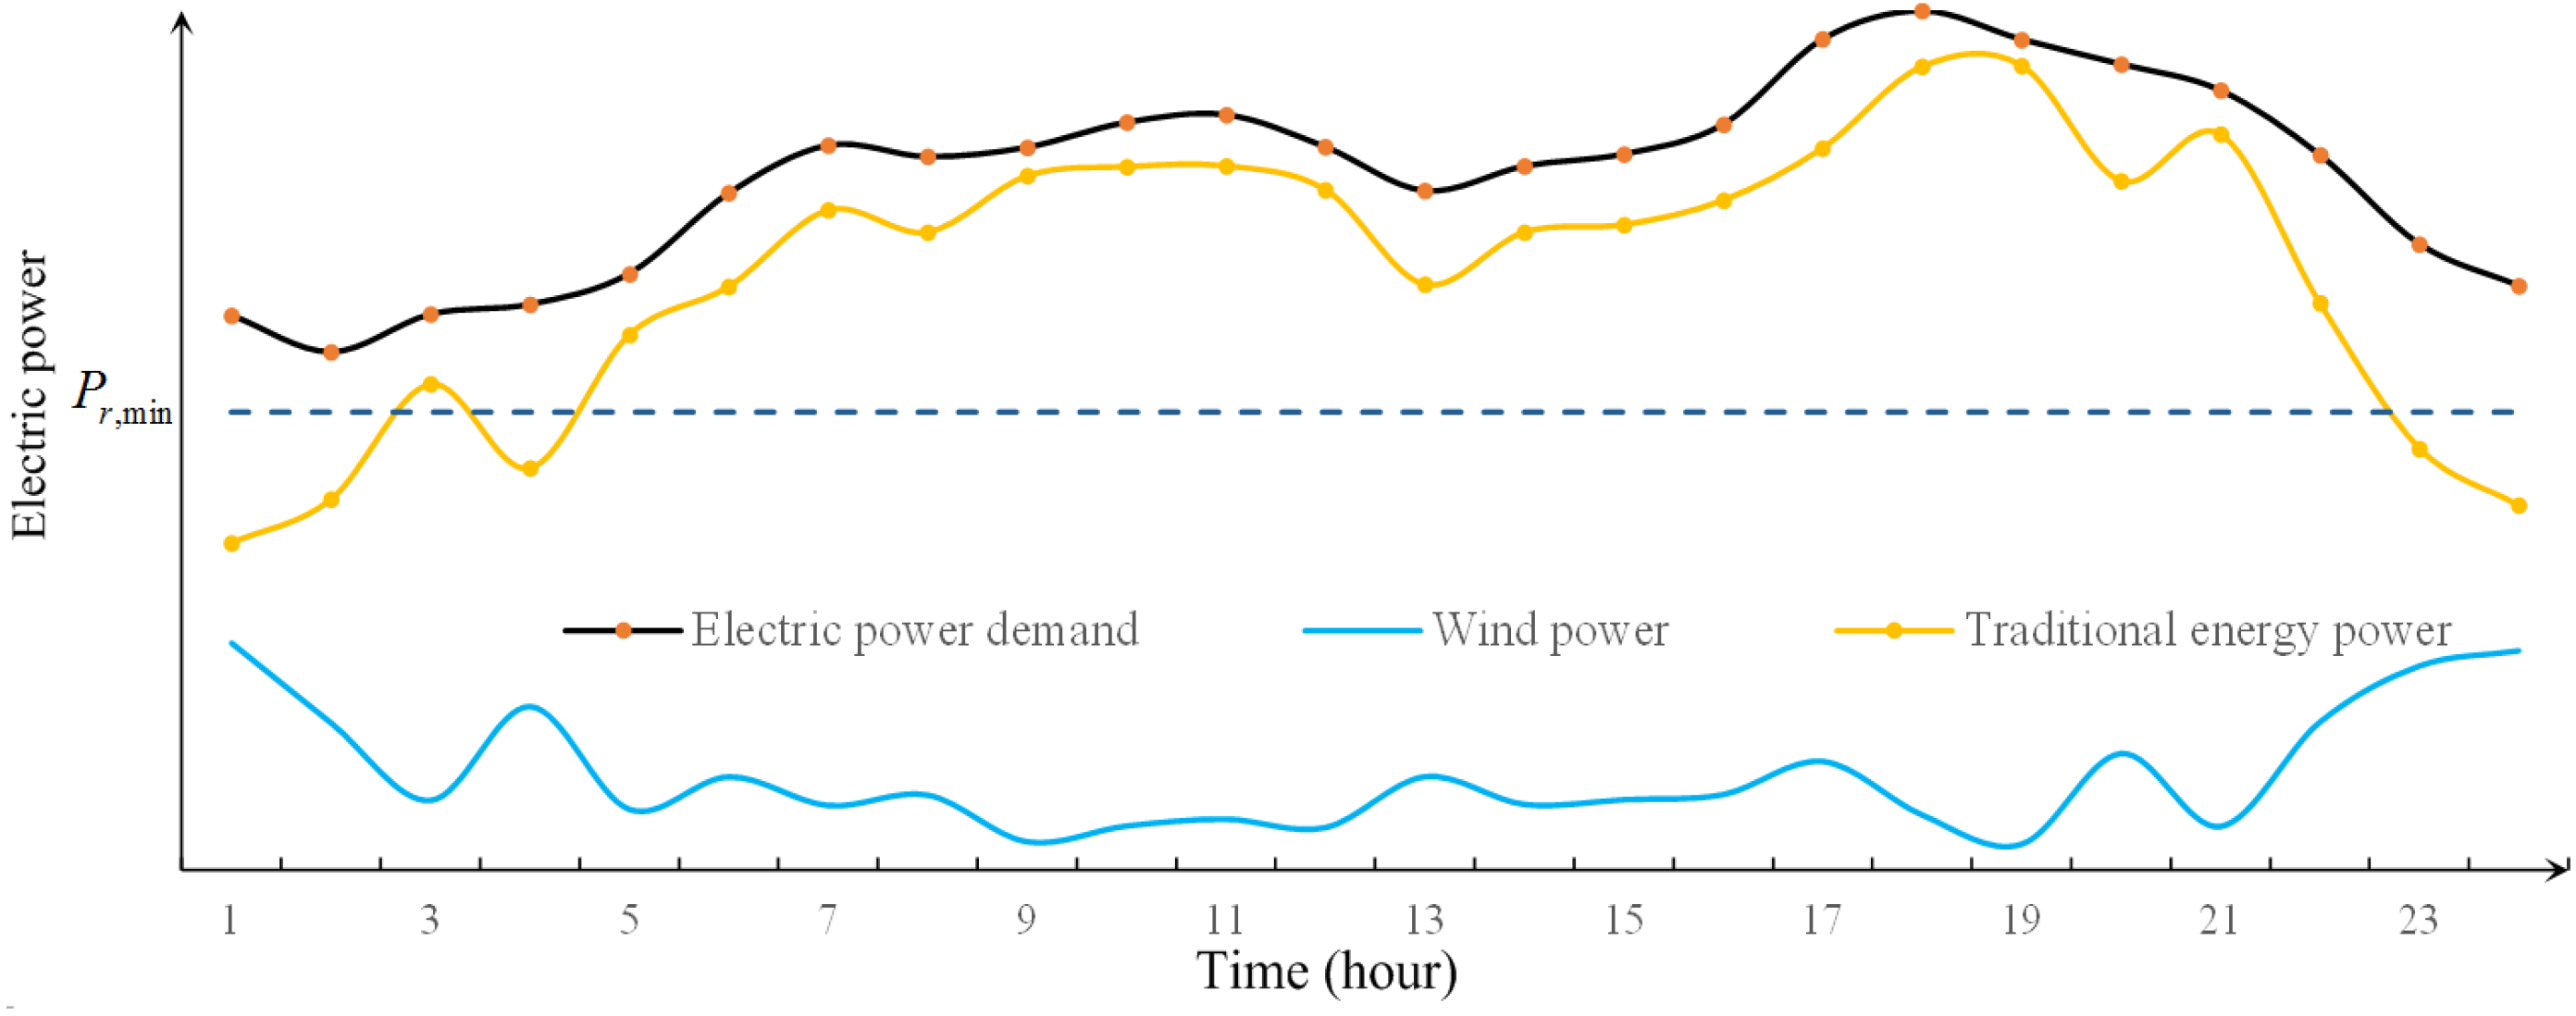
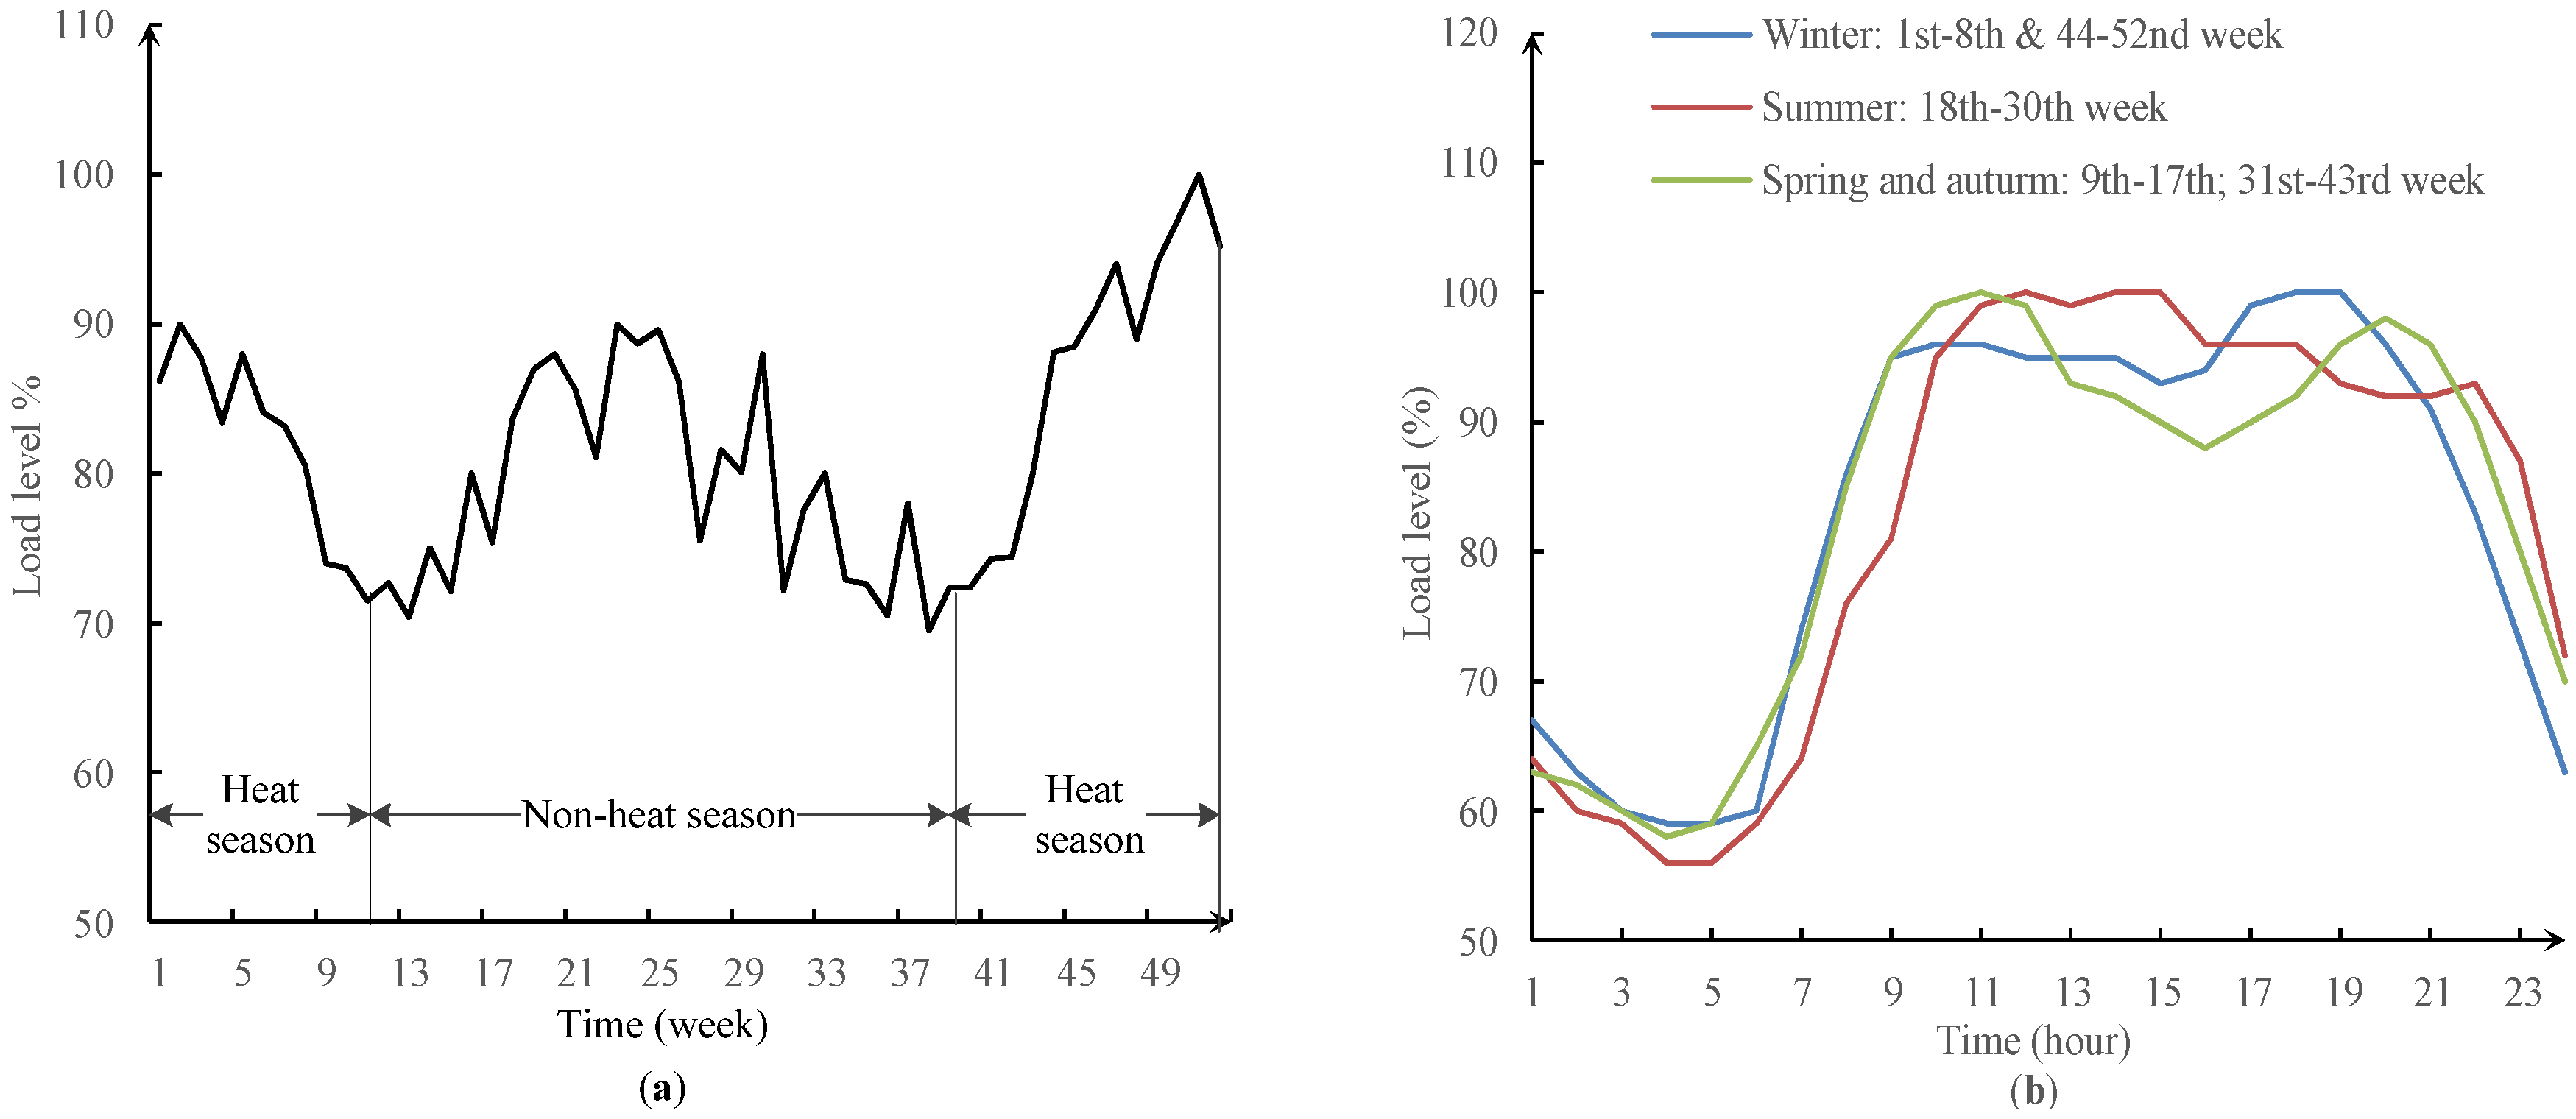
5.1.1. Electric Load Model

The annual weekly electric load curve is presented in Figure 7a, the heating season starts from the 40th week and lasts to the 12th week of the next year. From the Figure 7a, it could be discovered that the load level increases with the beginning of heat season and peaks at the end of a year [25,26], then goes down with the coming of non-heat season. Figure 7b presents the hourly electric load curves for different seasons and reveals that, although the occurrence time and duration of peak load are different from season to season, the vale load emerges and fades away at a similar period.
Figure 7. The weekly (a) and hourly (b) electric load curves.
Energies 08 08613 g007

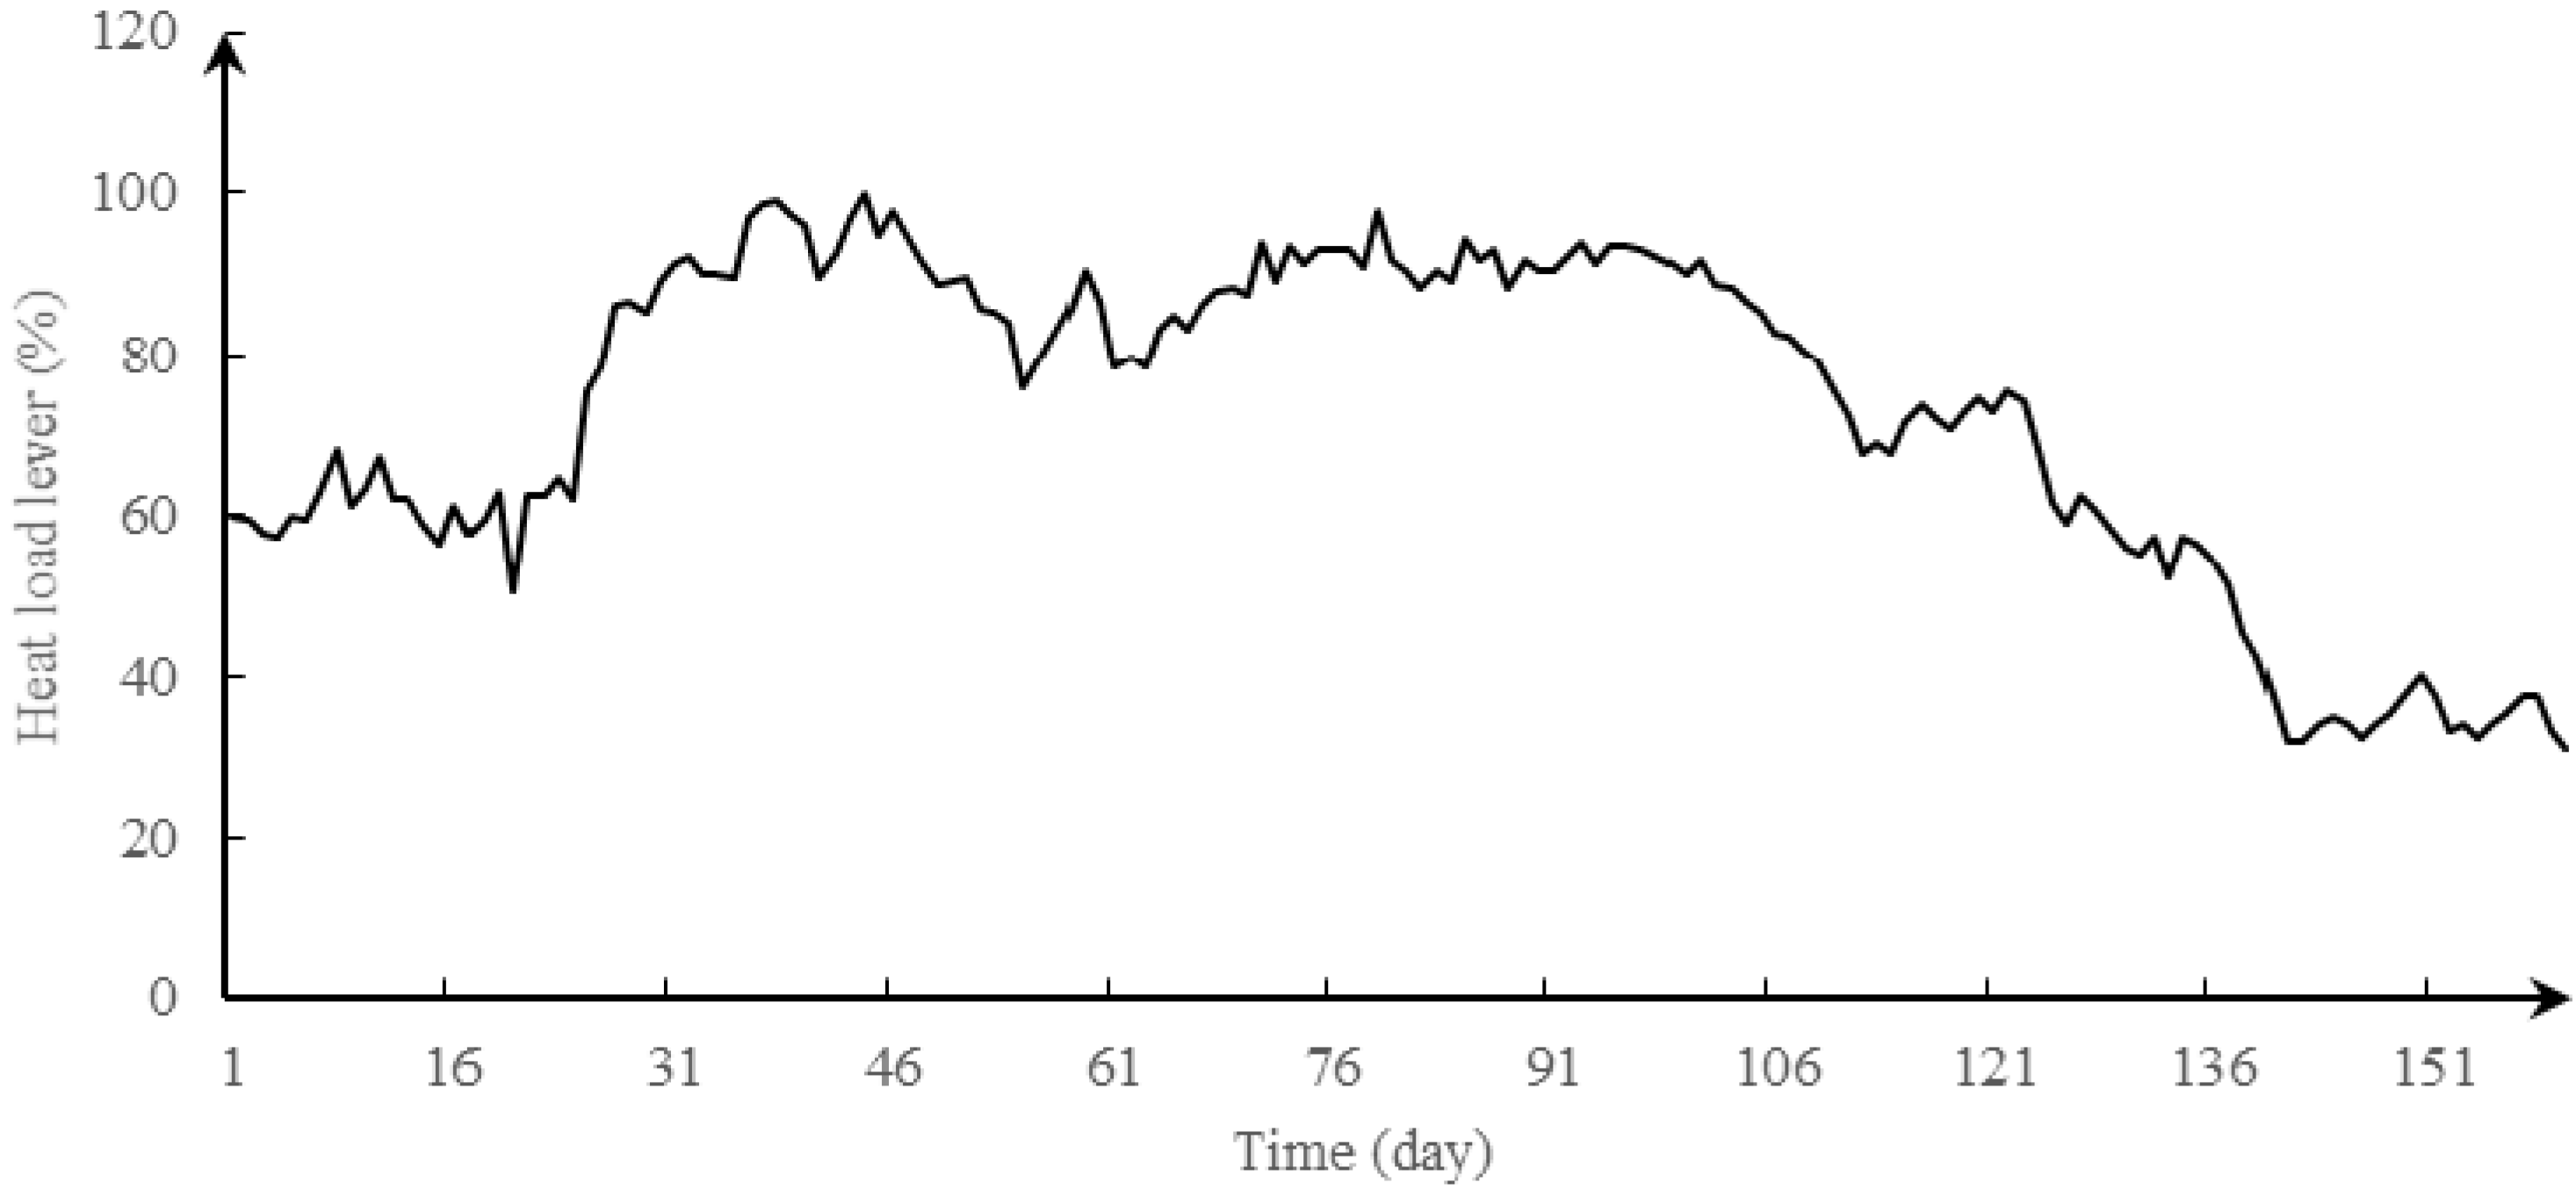
5.1.2. Heat Load Model

The daily heat load level curve is illustrated as below in Figure 8, from which it could be detected that the heat load is relatively low at the beginning and ending period of the heating season compared with the middle of winter due to the change in the weather, assuming the heat load is stable and continuous during the daytime.
Figure 8. The daily heat load level during heating season.
Energies 08 08613 g008

5.1.3. Wind Farms Model

Weibull’s distribution is employed to generate the hourly wind speed data, and its probability density function is as below:
f ( v ) = k c ( v c ) k 1 exp [ ( v c ) k ]
where k and c are the shape parameter and scale parameter of the two-parameter Weibull’s distribution, respectively. The available wind power output of a single wind turbine could be calculated by non-linear equations between wind speed and wind power output below:
P wind , t = { 0 0 v v c i ( A + B v + C v 2 ) P r v c i v v r P r v r v v c o 0 v c o v
where v is the wind speed, vci is cut-in wind speed, vr is rated wind speed, vco is cut-out wind speed, Pwind,t is wind power output and Pr is rated wind power.
The power output of the wind farm could be determined as below:
P WF, t = α τ = 1 N w β P wind, t , τ
where α is the wake effect coefficient of wind farm. Nw is the number of wind turbines within the wind farm.
{ β = 1 the   wind   turbine   working β = 0 otherwise

5.2. General Situation of Simulation

Numerical simulations are conducted on a local grid in an area of Northeast China. The gross installed capacity of this area is 3250 MW, and the proportion of each electric source is exhibited in Table 3. The wind farm is constituted by 400 Envision-1.5-100 wind turbines (Envision Energy Limited, Jiangyin, China), ant the gross installed generation power is 600 MW and the wind power integration rate is about 18.5%. Each unit’s rated power is 1.5 MW, and the cut-in wind speed, rated wind speed and the cut-out wind speed is 3, 14 and 25 m/s, respectively. In the simulations, Weibull’s distribution is employed to generate the hourly wind speed data, and the wind farm is assumed to be single which means the degree of correlation between wind farms is 1, the wake effect coefficient of wind farm assumed to be 0.9. The scale parameter and shape parameter of the wind speed Weibull’s distribution are 1.96 and 5.54 [27,28].
Table 3. The related parameters of the power sources within the simulation region.
Area and Power Source TypeInstalled CapacityElectric Power Output Change Interval (MW, Non-Heat Season)Electric Power Output Change Interval (MW, Heat Season)
Heat zone A (CHPs)300 MW × 2300, 600420, 492
Heat zone B (CHPs)350 MW + 200 MW275, 550385, 460
Heat zone C (CHPs)200 MW × 2200, 400280, 340
Pure condensing steam units200 MW × 3 + 500 MW × 1440, 1100440, 1100
Wind farm1.5 MW × 4000, 6000, 600
Total3250 MW1215, 32501525, 2992
The electric power and heating power output intervals of the CHPs are illustrated in Table 4.
Table 4. The parameters of the combined heat and electric power (CHPs) within the simulation region.
Capacity (MW)ModelElectric Power Output Interval (MW, Rated)Heat Power Output Interval (MW, Rated)Electric Power Output Interval (MW, Heat Season)Heat Power Output Interval (MW, Heat Season)
200C240/N200-12.75/1.08/0.245100, 2000, 250140, 1700, 220
300C240/N300-16.7/535/538/0.4300, 1500, 400210, 2460, 280
350C330N350-17.75/540/540/0.981175, 3500, 450245, 2900, 400

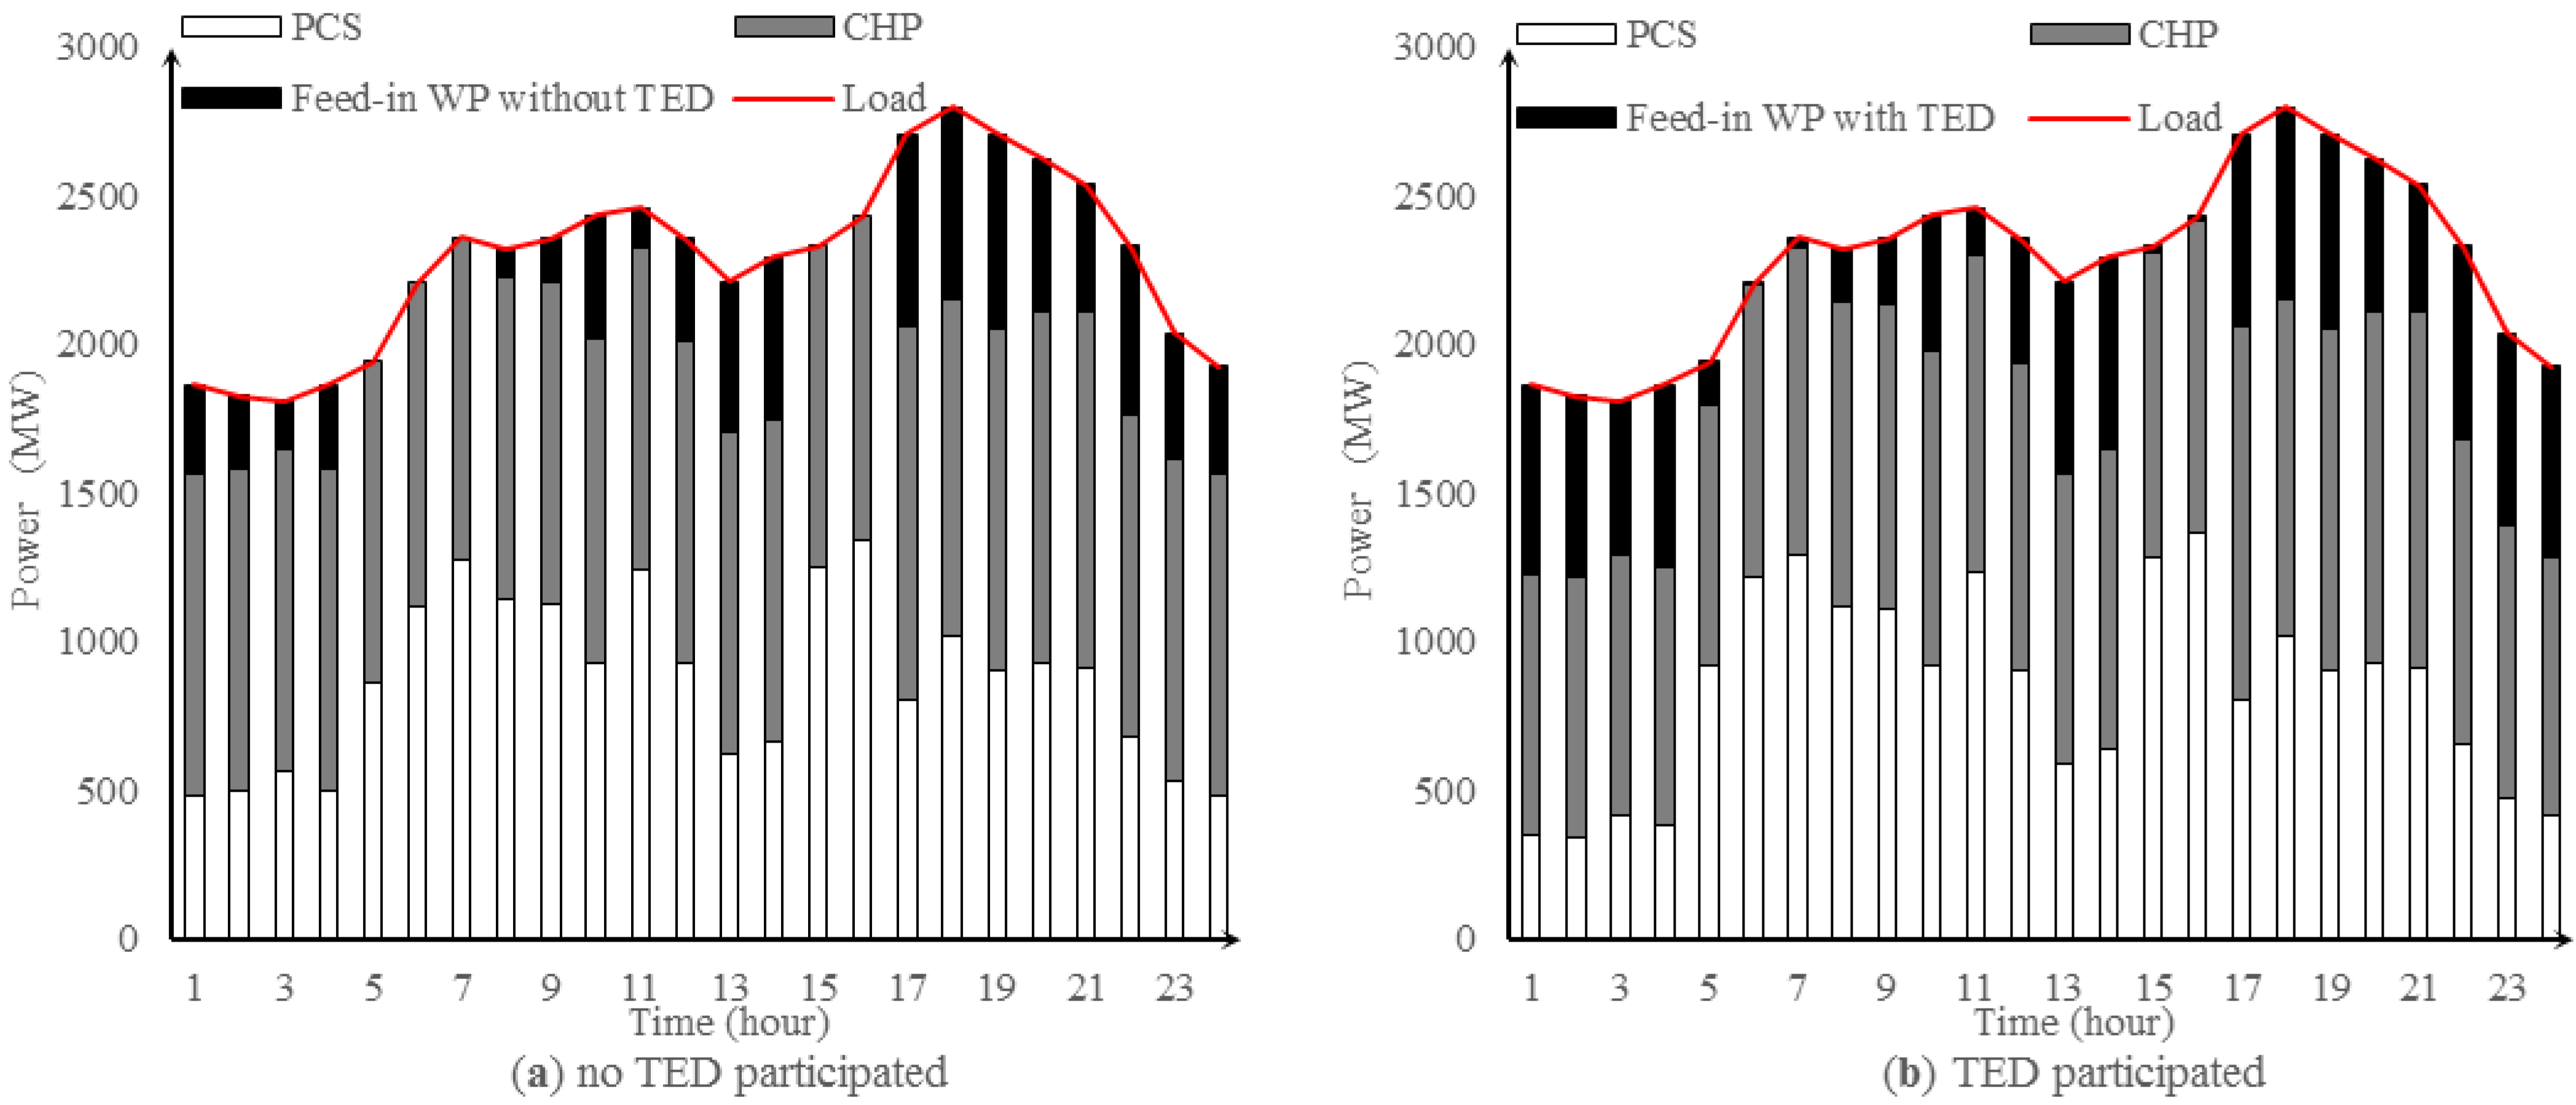
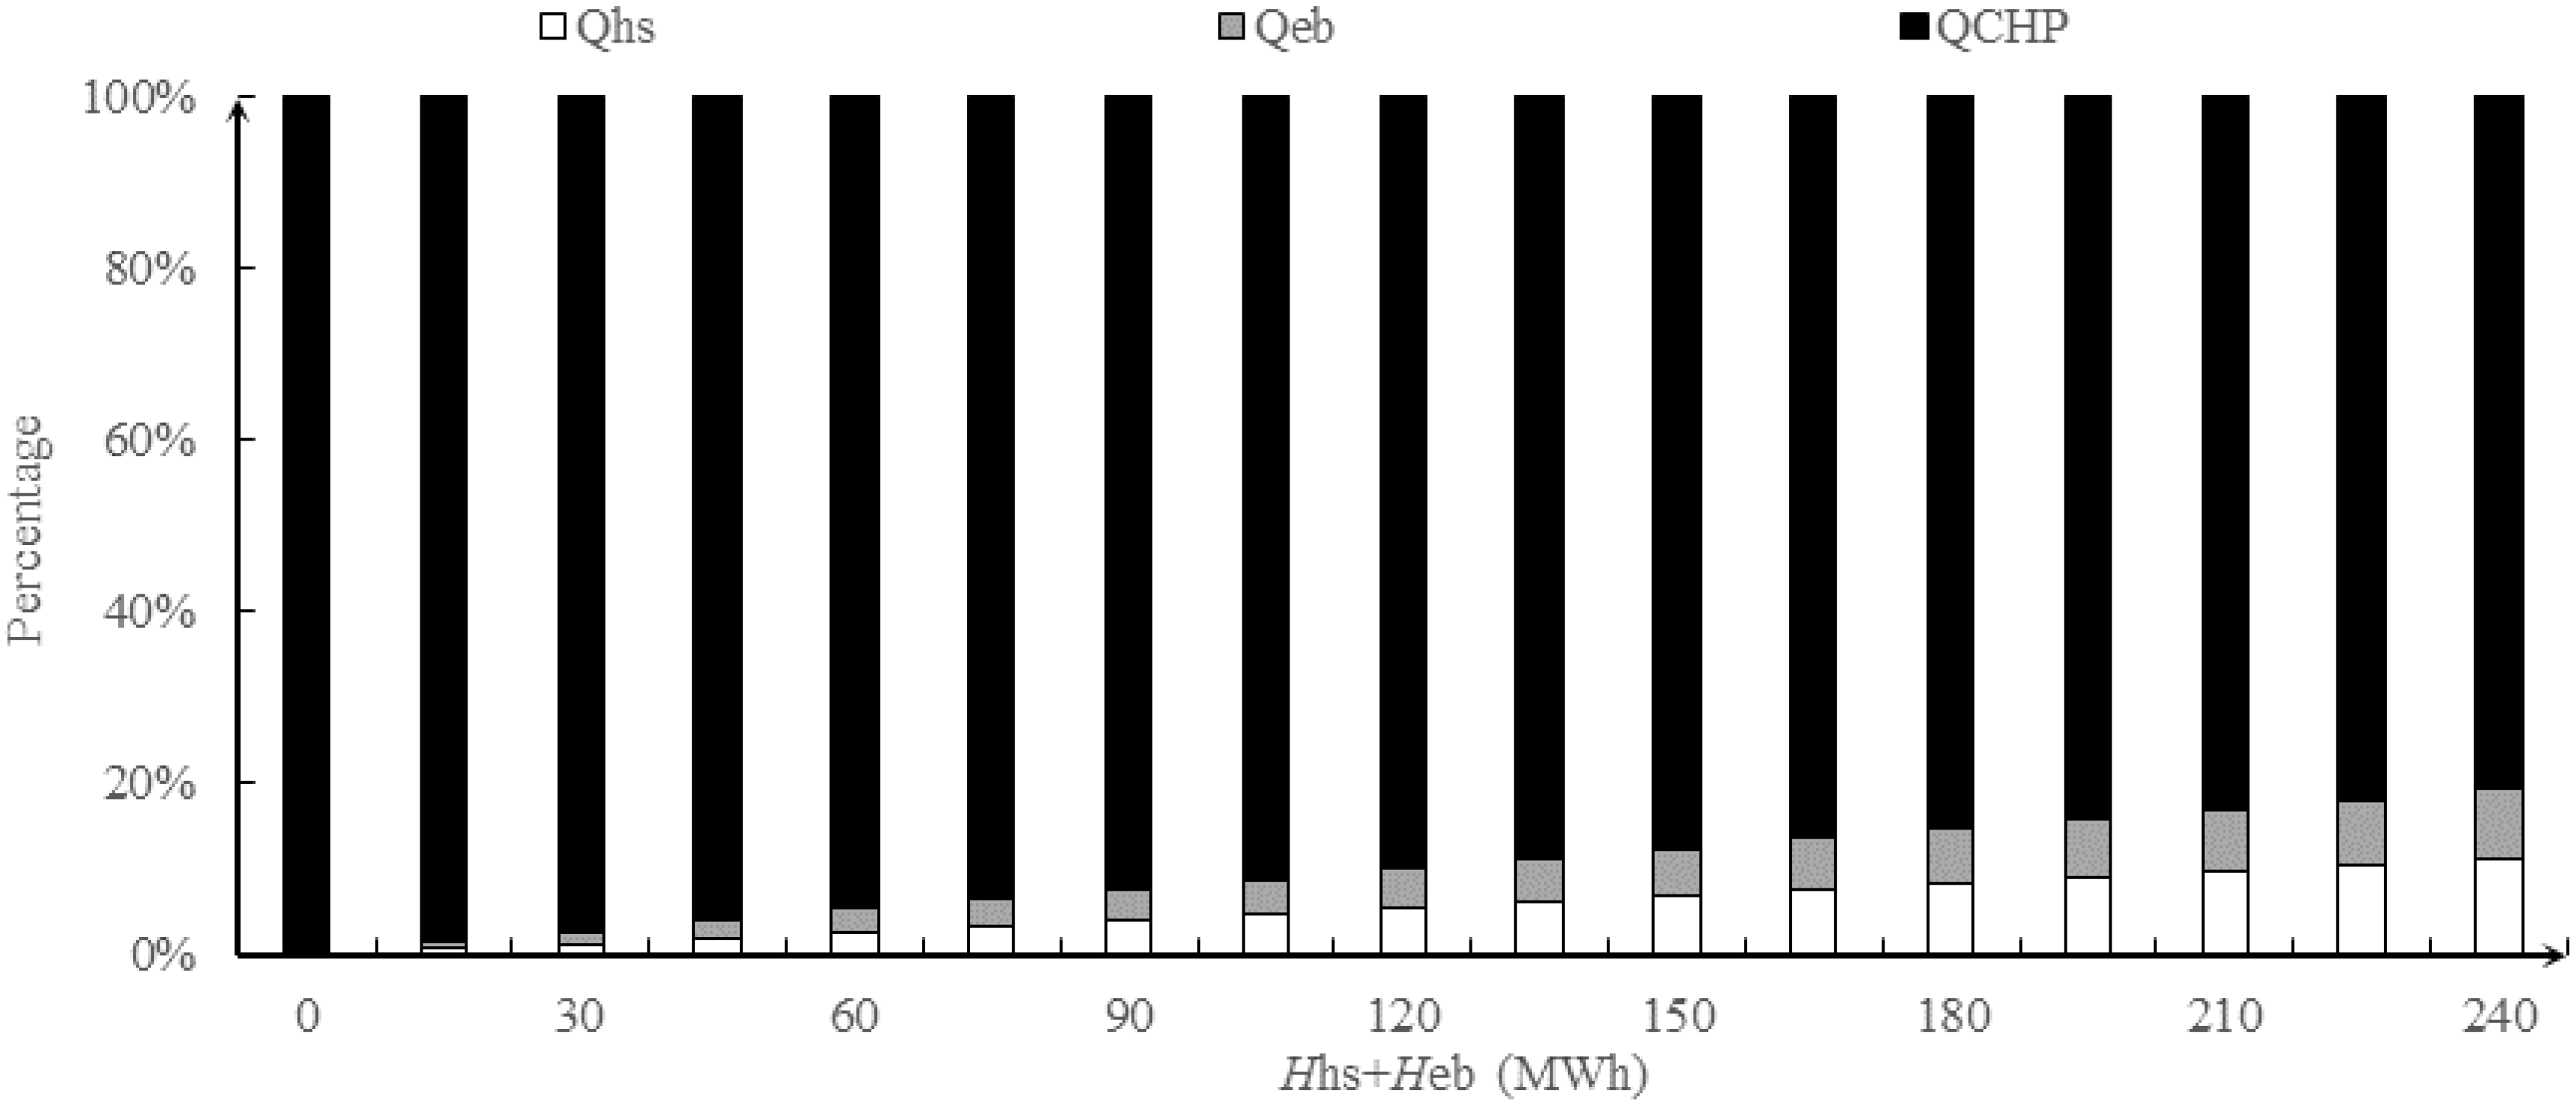
5.3. Simulation Results

Figure 9 illustrates the weekly wind power curtailment occurrence probability and wind energy curtailment rate without the participation of TED. It obviously demonstrates that both values are quite high when heading into heat season, which is reason from the low load level and the beginning of “Ordering Power by Heat” police during this period. While, followed the increase of load level, the values go down until reaching and holding a vale value during the late winter. Then, the values roll up with the close of heating season due to a similar reason as at the beginning of the heating season.
Figure 9. The weekly wind power curtailment occurrence probability (WCOP) and wind energy curtailment rate (WECR) during heat season without TED.
Energies 08 08613 g009
Figure 10 shows the hourly curtailed wind energy during the whole heating season. It apparently states that the majority of wind energy was curtailed during the nighttime, especially from 11 p.m. to 5 a.m. the next day.
Figure 10. The hourly curtailed wind energy during heating season.
Energies 08 08613 g010
Assuming all of the extraction turbo-generator units are configured with TED, the total heat power from outside heat sources increased from 0 to 420 MW, the heat power output of heat storage and electric boiler was 1:1, and the heat storage capacity was set to be one to six times of total heat power output. From the simulation results of wind power curtailment occurrence probability (WCOP) and wind energy curtailment rate (WECR) in Figure 11, it could be detected that the involvement of TED could effectively avoid wind power curtailment, with the power increase of an outside heat supply the occurrence probability of wind power curtailment and wind energy curtailment rate drop rapidly. Irrespective of the construction and operating cost of the TED system, the WCOP could be decreased from about 50% to 10% and the WECR could nearly vanish from roughly 35%. The tankage of heat storage vividly affects the effectiveness of TED when it is not considerably large, while as the tankage could provide over 3 h of heat, the changes of wind power curtailment occurrence probability and wind energy curtailment rage caused by different heat storage volumes are unapparent.. It results that, with the enlarging of the tankage of heat storage, the limit of it becomes weakened, and the power of outside heat resources play a more important role in avoiding power surplus.
Figure 11. The simulation results of WCOP and WECR.
Energies 08 08613 g011
Since the effectiveness of the change of heat storage’s tankage is weak when it could store more than 3 h of energy, the following simulation results are achieved under the condition of Ehs = 3h × (Hhs+Heb). Figure 12 presents the TED’s wind power consumption ability and the wind energy consumption proportion by different parts of TED. Without the participation of TED, approximately 98.9 GWh of wind energy has to be curtailed to maintain the power system balance. From Figure 12, it could be detected that, with the increasing power of outside heat source, the TED could lessen the electricity curtailment remarkably. With the same heat output power, the avoidance of the curtailment of electricity by the electric boiler is larger than by heat storage, mostly since the electric boiler not only could provide outside heat energy to heat loads but also boost the electric load level during peak vale period to consume more electricity.
Figure 12. The proportion of the avoidance of wind energy curtailment by different parts of TED.
Energies 08 08613 g012
The hourly wind power consumption destination within a typical day is shown in Figure 13. Without the coordination of TED, the curtailed wind power is rather large during the valley load period. While, after the operation of TED (420 MW, 1260 MWh), the wind power curtailment releases dramatically, the avoided wind power curtailment by different parts of TED is also shown in the Figure.
Figure 13. The condition of wind power consumption with/without TED.
Energies 08 08613 g013
Figure 14 illustrates the sources and ingredients of typical hourly electric power with and without the participation of TED (420 MW, 1260 MWh). It can be noticed from the Figure that the electric supply is mainly from pure condensing steam units (PCS), combined heat and electric power generations (CHP) and wind power (WP), and the after the participation of TED, the feed-in wind power observably increases and the electric power output of CHP decreases in proportion.
Figure 14. The ingredients of hourly electric power sources with/without TED.
Energies 08 08613 g014
The percentage of heating sources under different TED heating power outputs are presented in Figure 15. Most of the time, the surplus wind power could be consumed by releasing heat from heat storage or absorbed by the electric boiler directly, which means that the electric boiler transforms electricity into heat and saves the heat into heat storage if necessary but releases it to the heat network directly. Thus, the value concerning heat storage is greater than the electric boiler.
Figure 15. The proportion of heat source during the TED working period.
Energies 08 08613 g015

6. Conclusions

This paper analyses the cause of the high wind power curtailment rate during the heating season and proposes a thermal-electric decoupling scheme to enhance the system’s wind power consumption capacity. The effects of the analysis of thermal-electric decoupling and the method to calculate its assessment indexes are provided. The Monte Carlo simulation technique is employed to conduct case studies, and the results show that the proposed approach could relieve the amount of wind power curtailment caused by the “Ordering Power by Heat” policy during the heating season. By introducing 240 MW TED power and 1260 MWh heat storage capacity, the wind energy curtailment rate could be remarkably reduced to about 3% from 35%. Hence, the introduction of TED could improve the ability of the power system to accommodate wind power, from 186 to 275 GWh in the same conditions as above, and enrich the thermal source for heating systems, of which approximately 18% of the heat energy could be supplied by TED.

Acknowledgments

This work has been supported by National Key Technology Research and Development Program (2015BAA01B01), National High Technology Research and Development Program of China (863 Program) (2011AA05A105), and the National Natural Science Funds (50877014).

Author Contributions

Shuang Rong, Zhimin Li and Weixing Li checked and discussed the simulation results. Shuang Rong confirmed the series of simulation parameters and arranged and organized the entire simulation process. Zhimin Li participated in establishing the simulation model. Weixing Li revised the paper. Zhimin Li and Weixing Li made many useful comments and simulation suggestions. In addition, all authors reviewed the manuscript.

Conflicts of Interest

The authors declare no conflict of interest.

References

  1. Ding, J.; Qiu, Y.F.; Sun, H.D.; Zhou, H.C.; Ma, S.Y.; Wang, Z.; Shen, H.; Li, B.; Song, Y.T. Consideration of wind generator tripping under Large-scale wind power integration. Proc. CSEE 2011, 19, 25–36. (In Chinese) [Google Scholar]
  2. Liu, X.D.; Fang, K.; Chen, H.Y.; She, C.Q. Research on rational wind power casting theory for large-scale wind power integration improvement. Power Syst. Prot. Control 2012, 6, 35–39. [Google Scholar]
  3. Li, J.F.; Cai, F.B.; Qiao, L.M.; Wang, J.X.; Gao, H.; Tang, W.Q.; Peng, P.; Geng, D.; Li, X.Q.; Li, Q.H. 2014 China Wind Power Review and outlook. Available online: http://www.doc88.com/p-9435193811067.html (accessed on 12 June 2015).
  4. Zhang, W.L.; Qiu, M.; Lai, X.K. Application of energy storage technologies in power grids. Power Syst. Technol. 2008, 7, 1–9. [Google Scholar]
  5. Teng, J.; Chen, C.; Martinez, I.C. Utilising energy storage systems to mitigate power system vulnerability. IET Génér. Transm. Distrib. 2013, 7, 790–798. [Google Scholar] [CrossRef]
  6. Francisco, D.; Andreas, S.; Oriol, G.; Roberto, V. A review of energy storage technologies for wind power applications. Renew. Sustain. Energy Rev. 2012, 16, 2154–2171. [Google Scholar]
  7. Khodayar, M.E.; Abreu, L.; Shahidehpour, M. Transmission-constrained intra hour coordination of wind and pumped-storage hydro units. IET Génér. Transm. Distrib. 2013, 7, 755–765. [Google Scholar] [CrossRef]
  8. Kushnir, R.; Dayan, A.; Ullmann, A. Temperature and pressure variations within compressed air energy storage caverns. Int. J. Heat Mass Transf. 2012, 55, 5616–5630. [Google Scholar] [CrossRef]
  9. Kassa, I.; Djamila, R.; Toufik, R.; Abdelmounaim, T. Wind energy conversion system associated to a flywheel energy storage system. Analog. Integr. Circuits Signal Proc. 2011, 69, 67–73. [Google Scholar]
  10. Nirmal-Kumar, C.; Niraj, G. Battery energy storage systems: Assessment for small-scale renewable energy integration. Energy Build. 2010, 42, 2124–2130. [Google Scholar]
  11. Hedegaard, K.; Mathiesen, B.; Lund, H.; Heiselberg, P. Wind power integration using individual heat pumps—Analysis of different heat storage options. Energy 2012, 47, 284–293. [Google Scholar] [CrossRef]
  12. Ruan, J.P.; Zhang, J.C.; Wang, J.H. Improvement of stability of wind farms connected to power grid using flywheel energy storage system. Electr. Power Sci. Eng. 2008, 3, 5–8. [Google Scholar]
  13. Gholami, A.; Ansari, J.; Jamei, M.; Kazemi, A. Environmental/economic dispatch incorporating renewable energy sources and plug-in vehicles. IET Génér. Transm. Distrib. 2014, 8, 2183–2198. [Google Scholar] [CrossRef]
  14. Li, Q.Y. Wind power consumption mode based on water source heat pump technology. Automat. Electr. Power Syst. 2012, 36, 25–27. [Google Scholar]
  15. Lund, H.; Munster, E. Modelling of energy systems with a high percentage of CHP and wind power. Renew. Energy 2003, 28, 2179–2193. [Google Scholar] [CrossRef]
  16. Meibom, P.; Kiviluoma, J.; Barth, R.; Brand, H.; Weber, C.; Larsen, H. Value of electric heat boilers and heat pumps for wind power integration. Wind Energy 2007, 10, 321–337. [Google Scholar] [CrossRef]
  17. Mathiesen, B.V.; Lund, H. Comparative analyses of seven technologies to facilitate the integration of fluctuating renewable energy sources. IET Renew. Power Génér. 2008, 3, 190–204. [Google Scholar] [CrossRef]
  18. Papaefthymiou, G.; Hasche, B.; Nabe, C. Potential of heat pumps for demand side management and wind power integration in the German electricity market. IEEE Trans. Sustain. Energy 2012, 3, 636–642. [Google Scholar] [CrossRef]
  19. Akmal, M.; Fox, B.; Morrow, J.D. Impact of heat pump load on distribution networks. IET Génér. Transm. Distrib. 2014, 8, 2065–2073. [Google Scholar] [CrossRef] [Green Version]
  20. Blark, M. Towards an intermittency-friendly energy system: Comparing electric boilers and heat pumps in distributed cogeneration. Appl. Energy 2012, 91, 354–365. [Google Scholar] [CrossRef]
  21. Kiviluoma, J.; Meibom, P. Influence of wind power, plug-in electric vehicles, and heat storages on power system investments. Energy 2010, 35, 1244–1255. [Google Scholar] [CrossRef]
  22. Østergaard, P.A. Wind power integration in Aalborg Municipality using compression heat pumps and geothermal absorption heat pumps. Energy 2013, 49, 502–508. [Google Scholar] [CrossRef]
  23. Jing, T.Y. The Research on Active Power Balance of Power System under Large-Scale Integration of Wind Power. Ph.D. Thesis, Dalian University of Technology, Dalian, China, 2011. [Google Scholar]
  24. Yang, T.H.; Zhou, J.H.; Cao, X.Y.; Cen, K.F. Application of heat-electricity ratio in energy-saving analysis of thermal power station. Power Syst. Eng. 2001, 6, 329–332. [Google Scholar]
  25. Cai, G.W.; Du, Y.; Li, C.S.; Gu, X.G.; Li, Y. Middle and long-term daily load curve forecasting based on support vector machine. Power Syst. Technol. 2006, 23, 56–60. [Google Scholar]
  26. Freris, L.; Infield, D. Renewable Energy in Power Systems, 1st ed.; John Wiley & Sons Ltd Publication: Chester, UK, 2008; pp. 27–33. [Google Scholar]
  27. Zhang, N.; Kang, C.Q.; Duan, C.G. Simulation methodology of multiple wind farms operation considering wind speed correlation. In Proceedings of the third IASTED Asian Conference on Power and Energy Systems, Beijing, China, 12–14 October 2009; pp. 35–42.
  28. Zhang, R.S.; Qi, G.G.; Li, C.B.; Li, L.; Bao, Y.P.; Zhu, Y.S. Forecasting of load model based on typical daily load profile and BP neural network. In Proceedings of the International Conference on System Engineering and Modeling, Kuala Lumpur, Malaysia, 7–8 April 2012; pp. 125–134.

