
CFD Analysis of Regenerative Chambers for Energy Efficiency Improvement in Glass Production Plants


Abstract
:1. Introduction

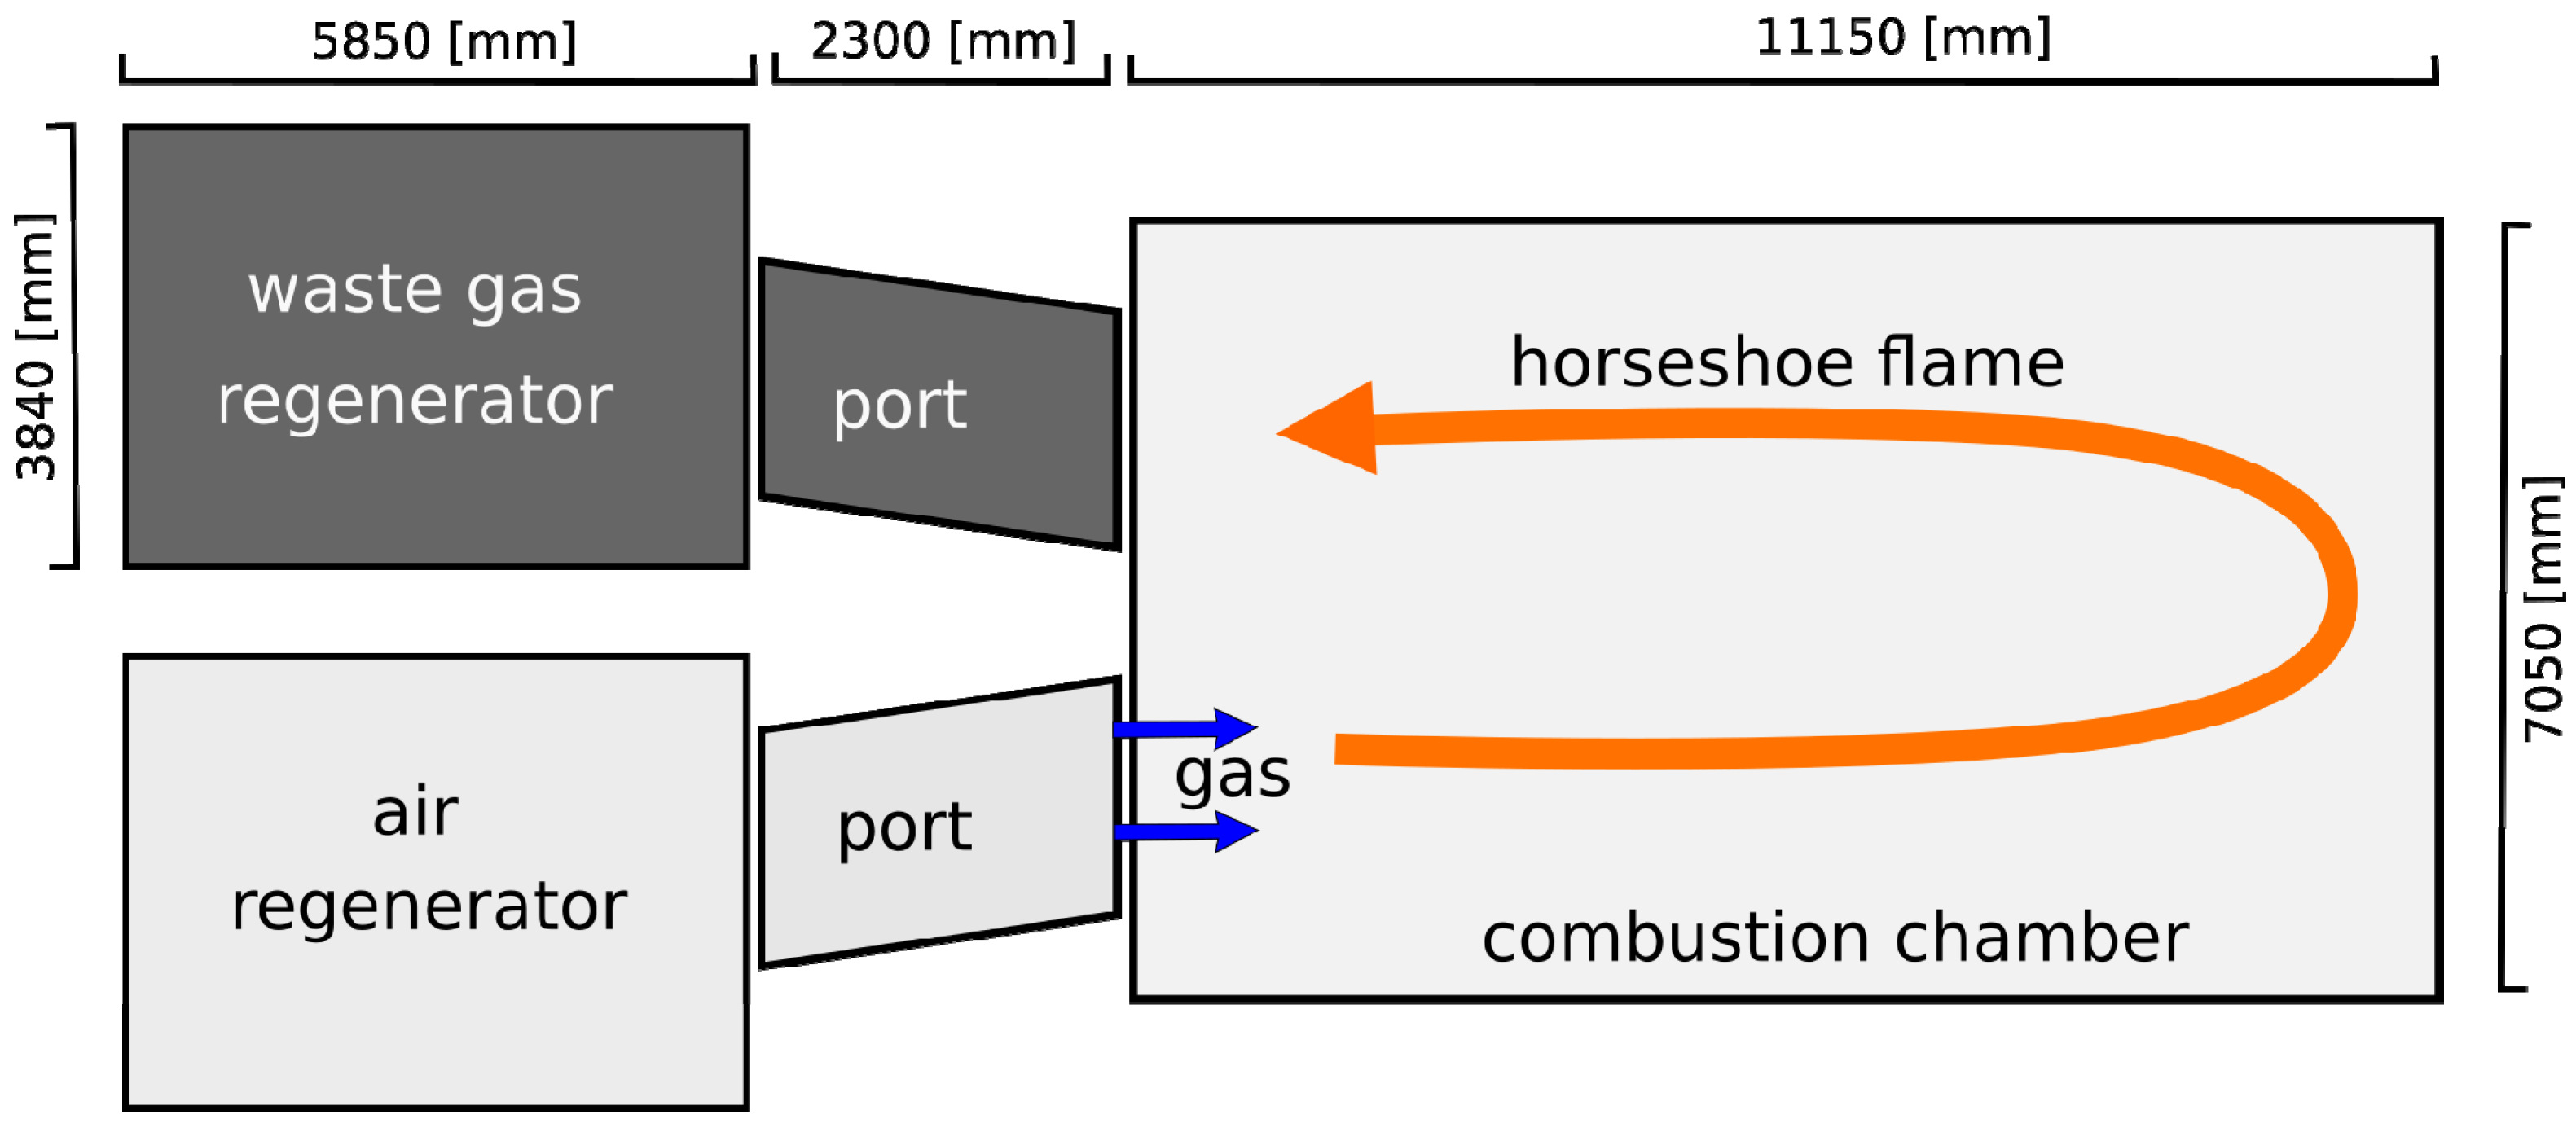
2. Plant Layout


3. Theoretical Modelling
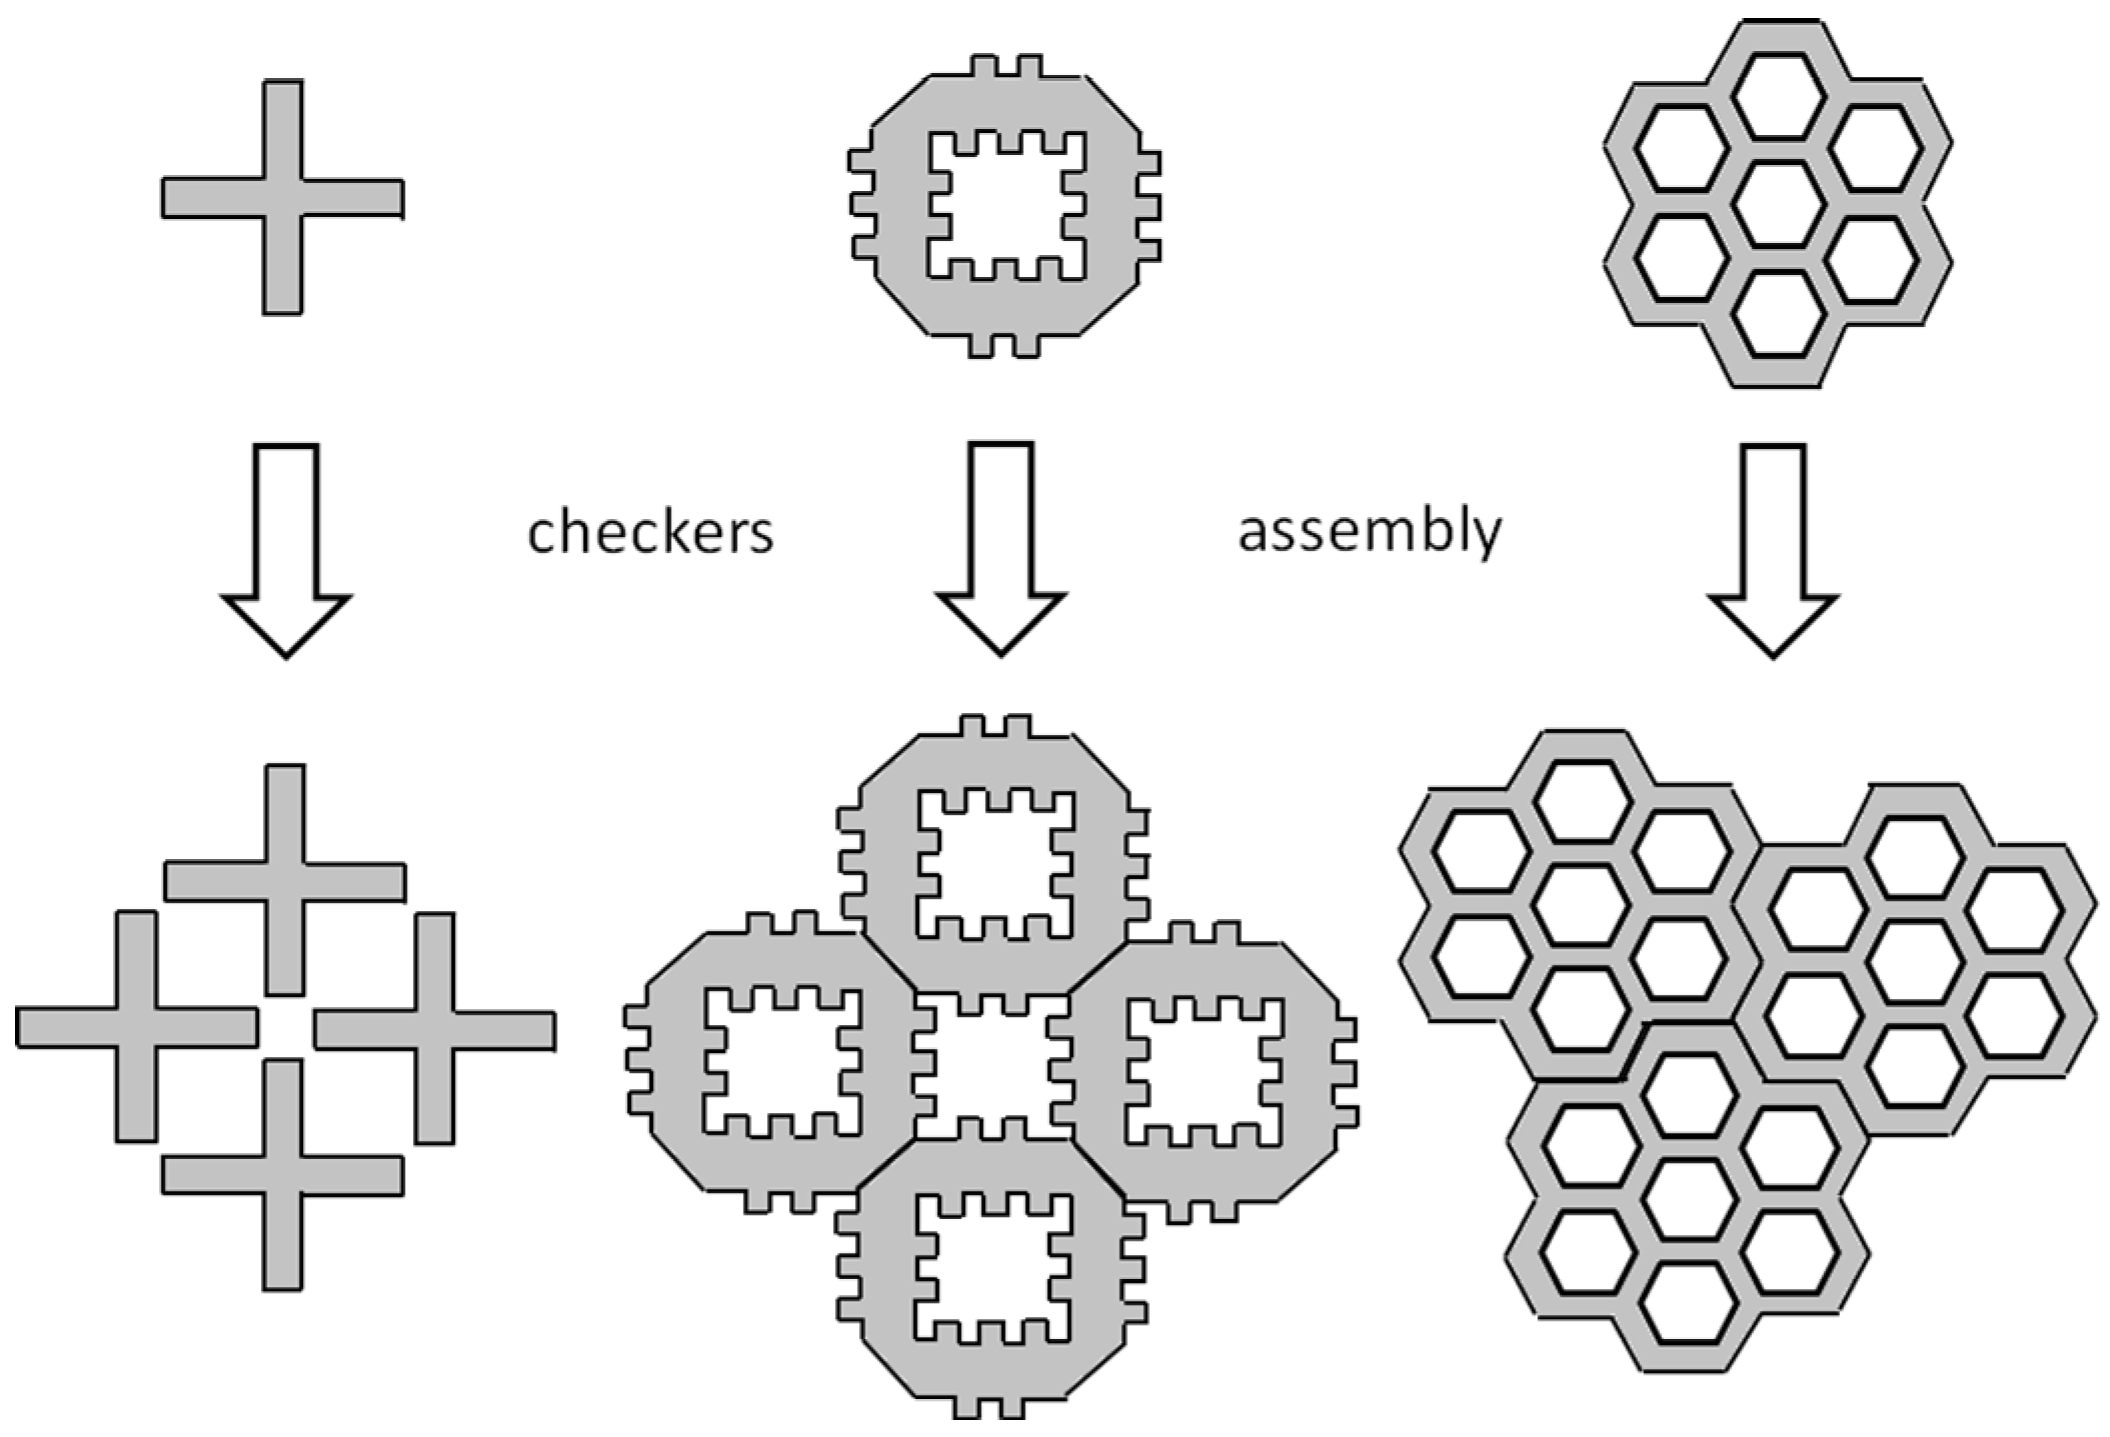
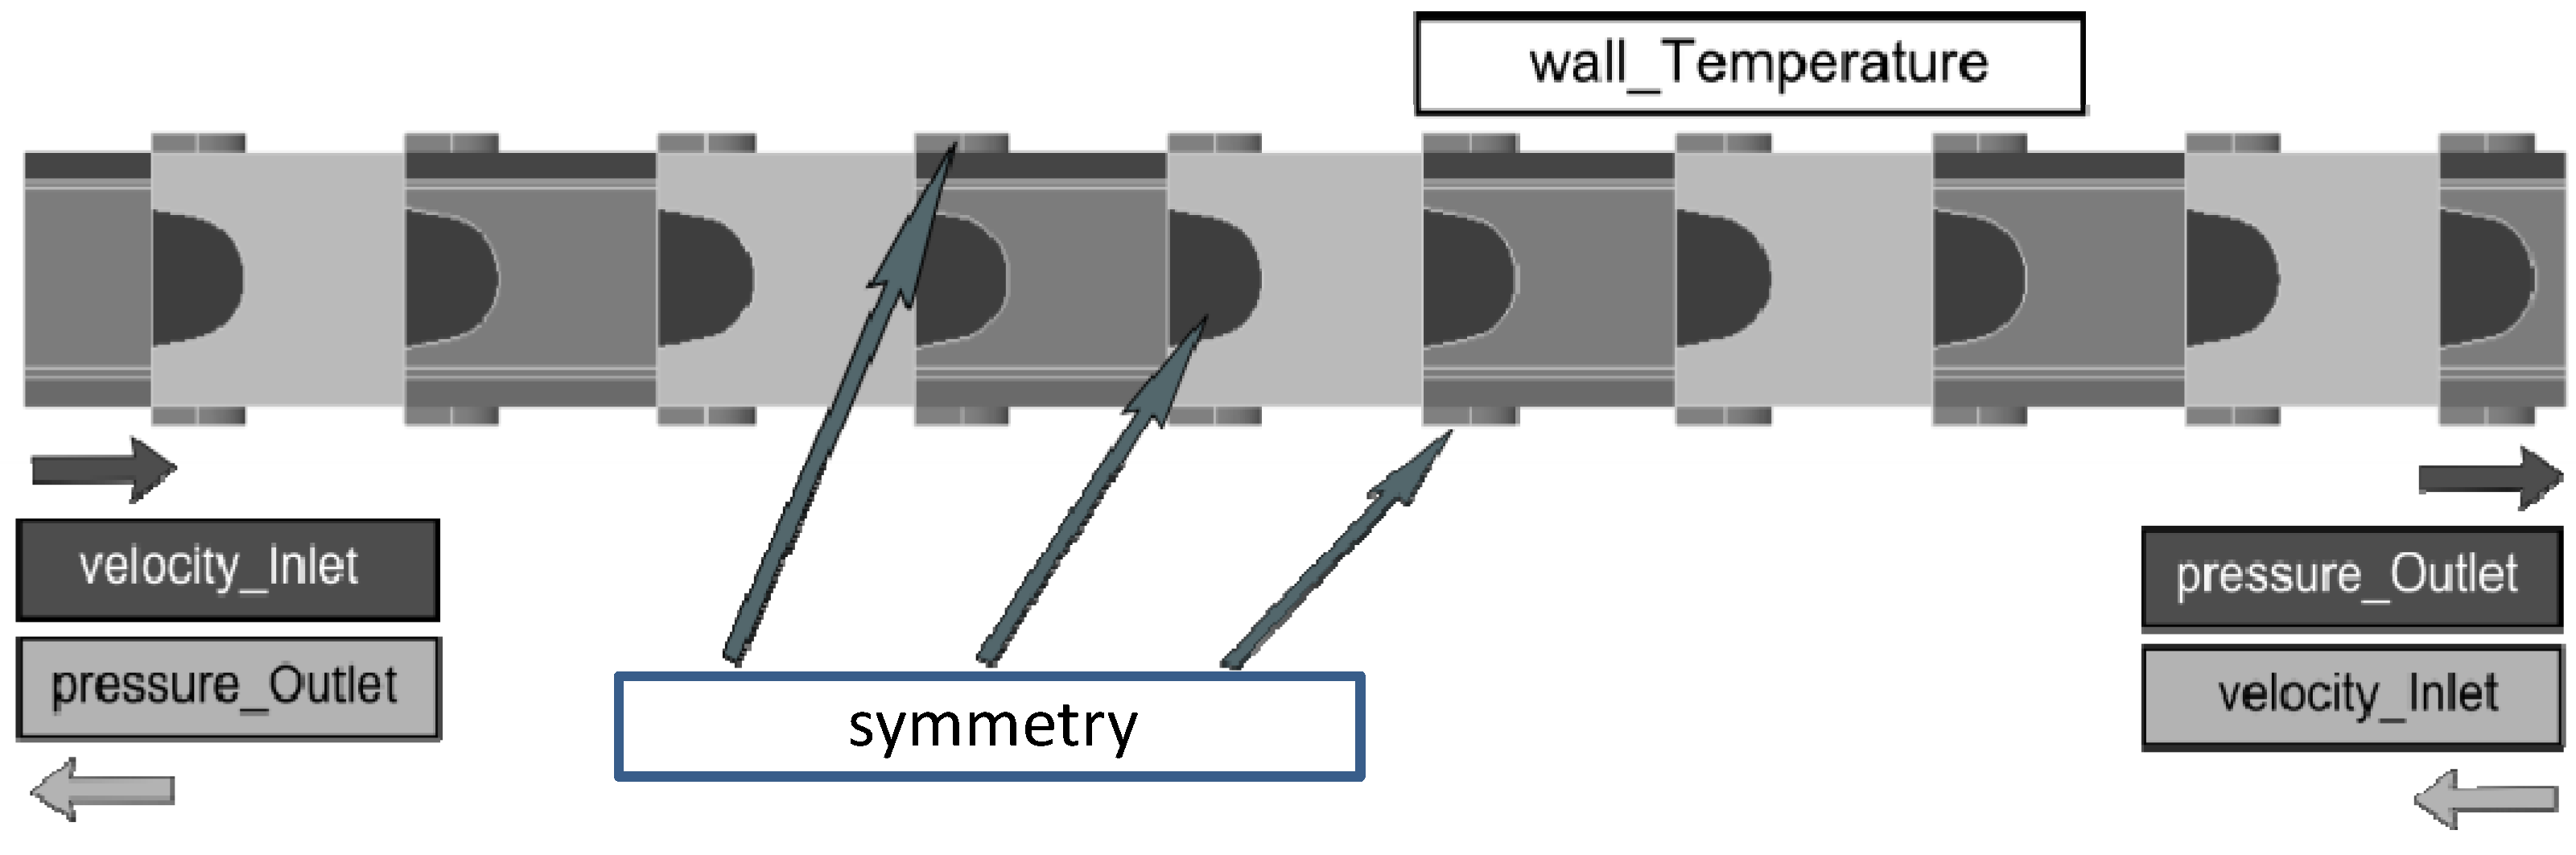
3.1. Geometry and Numerical Details


3.2. Governing Equations
- The viscosity μ is determined according to the Sutherland formula, which proved to be satisfactory for several gases in a wide range of temperature T. For each gas, a specific value of the parameter S, the Sutherland constant, is put into the following expression:where T′ = 273 K and μ′ = μ(T′) are reference values. This expression tends to increasingly underestimate the viscosity of the fluid above 1000 K. Nevertheless, the error at 1773 K (corresponding to highest temperature value in the calculations performed for the hot period) is around 5%, namely an acceptable value given the purpose of this study.
- The equation of state for ideal gases supplies the simplest link between the density, ρ, the average molecular weight, M, and the other thermodynamic variables of the process as follows:
- The specific heat at constant pressure cp can be conveniently described by a fourth-order polynomial expression as from the NIST Database [15], namely:where R is the universal gas constant and the values of coefficients ai are those pertaining to air. Despite the seemingly simple approximation, this choice proved to be satisfactory in data validation, as is shown in the following.
- The thermal conductivity λ is evaluated according to the Eucken Modified approximation based on the kinetic theory of gases, as follows:


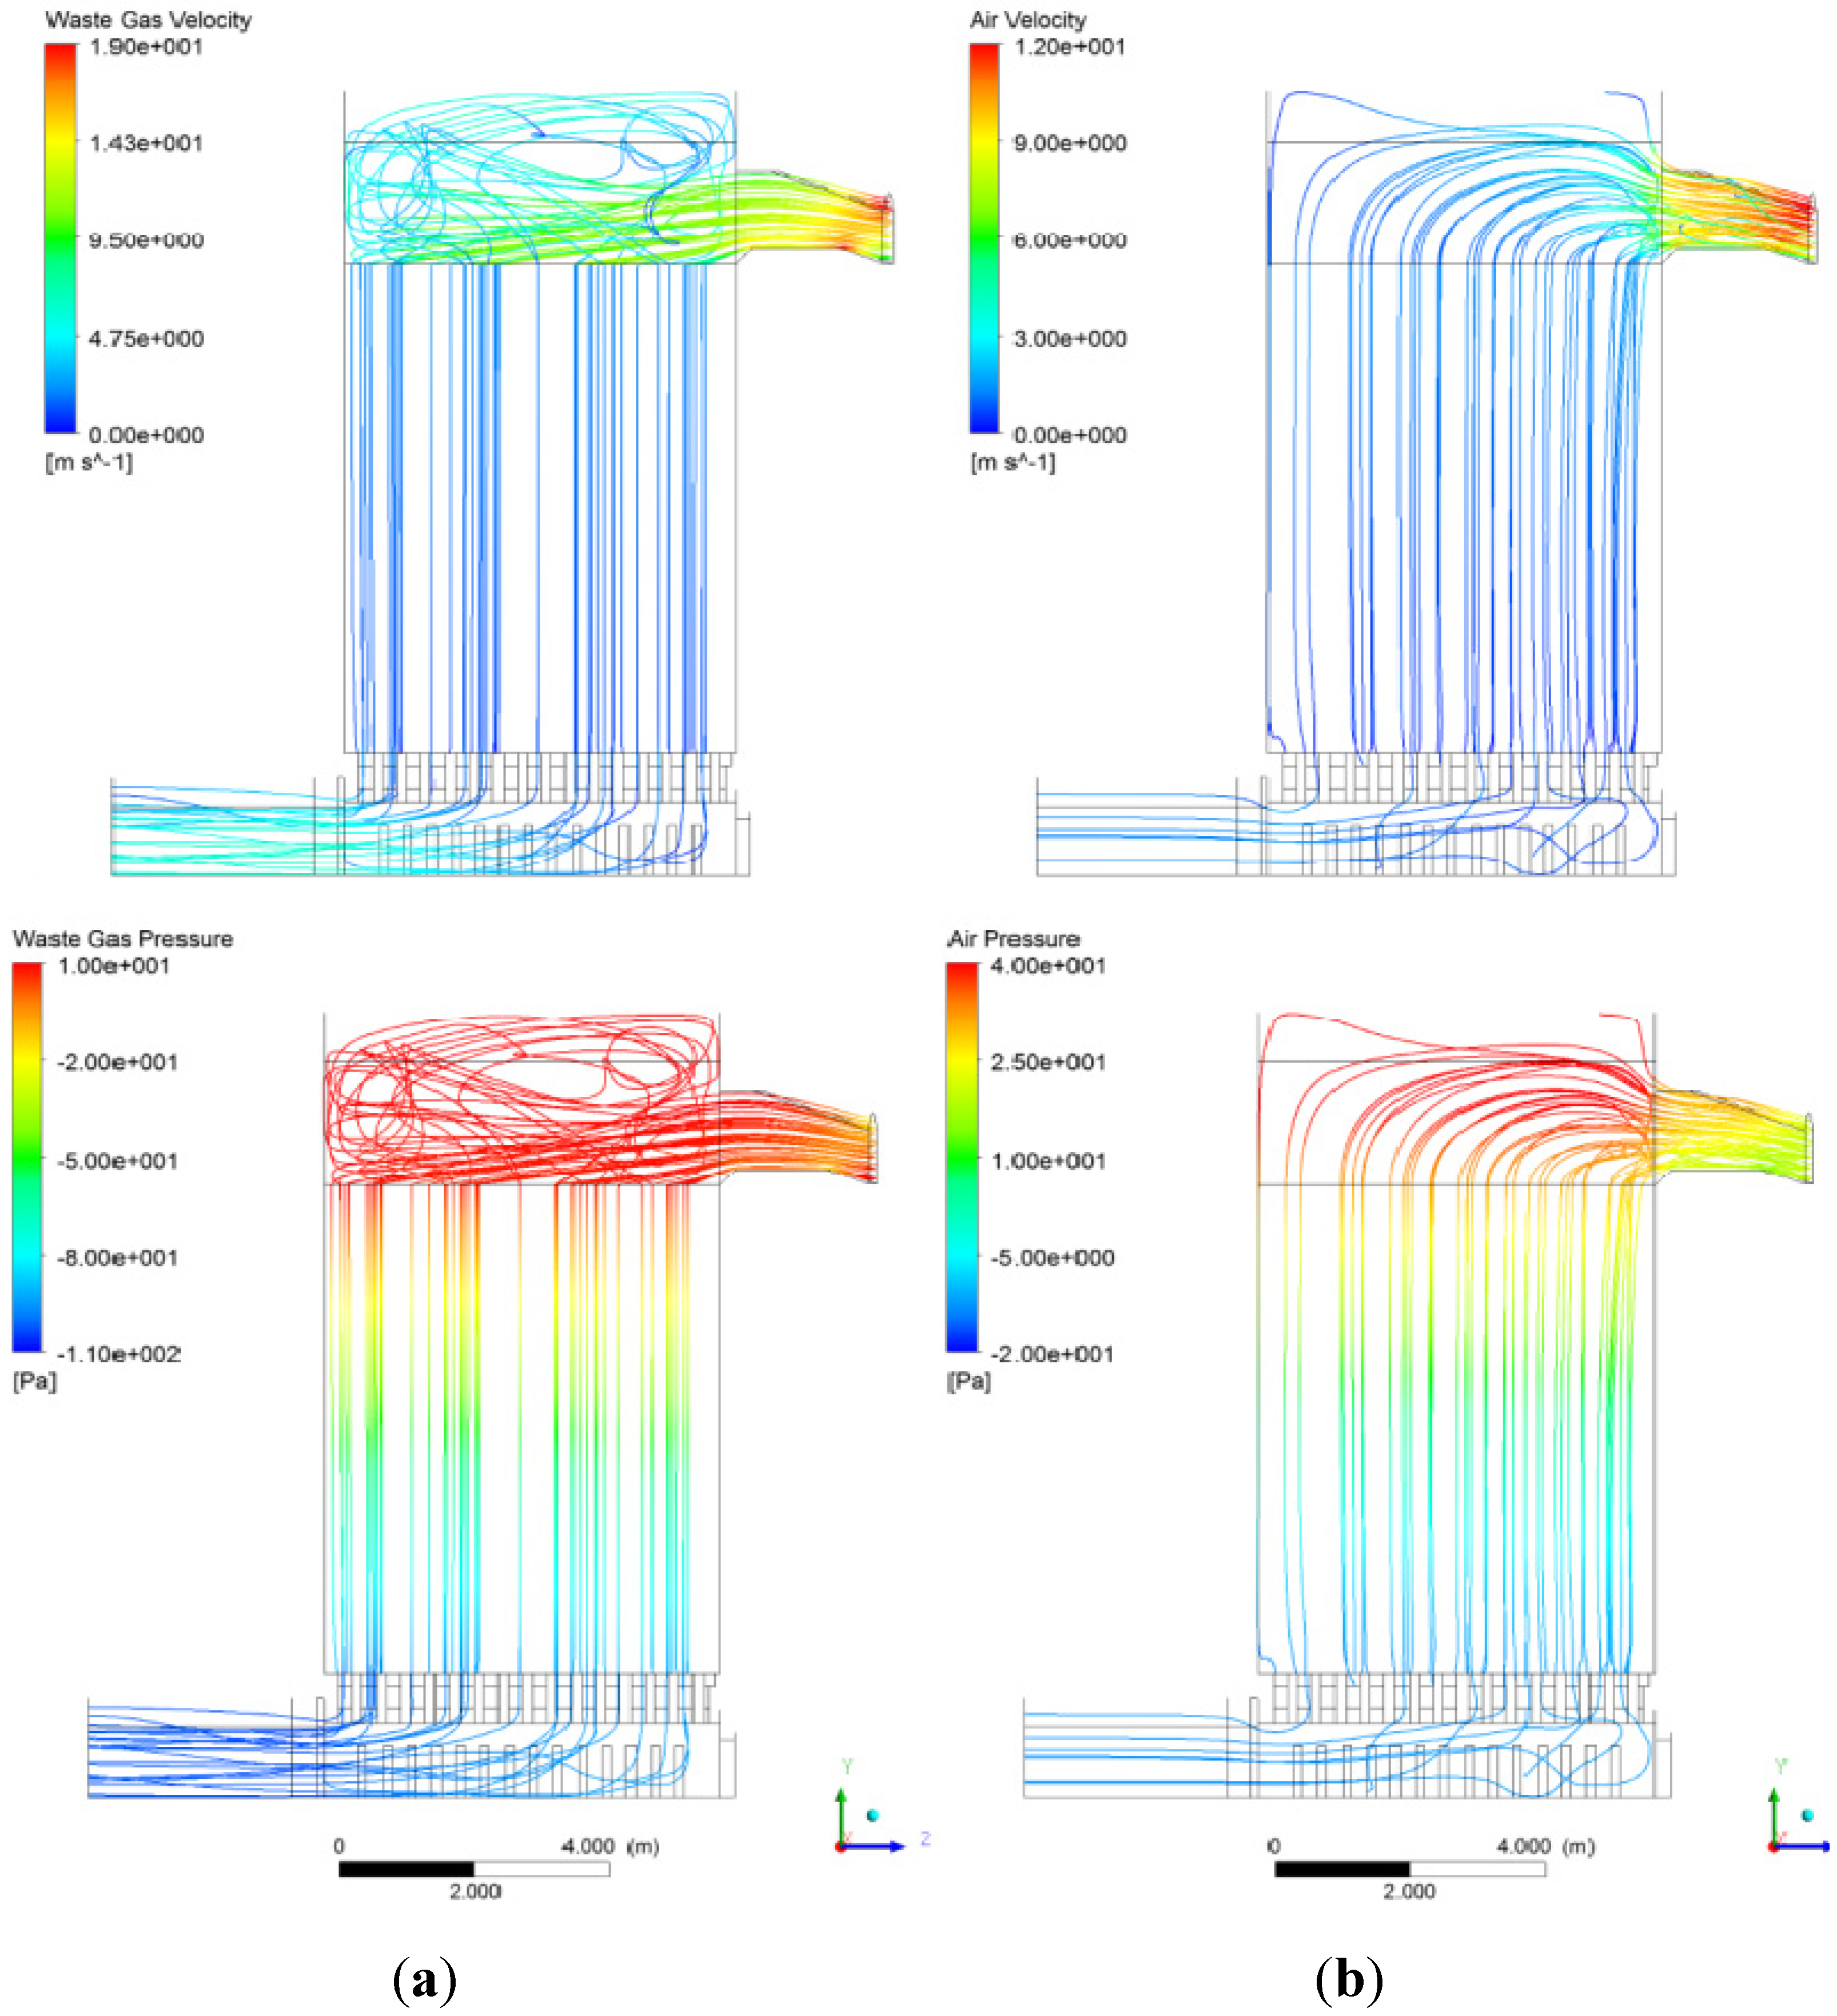
4. Results and Discussion


| Concentration | Point | |||||||||||
|---|---|---|---|---|---|---|---|---|---|---|---|---|
| 1 | 2 | 3 | 4 | 5 | 6 | 7 | 8 | 9 | B | M | T | |
| O2,exp | 20.6 | 20.6 | 20.7 | 20.7 | 20.5 | 20.3 | 18.2 | 18.7 | 20 | 18.1 | 19.6 | 20.4 |
| O2,calc | 20.9 | 20.9 | 20.9 | 20.2 | 20.4 | 20.3 | 17.7 | 18.1 | 17.9 | 17.9 | 19.9 | 20.9 |
| CO2,exp | 0.2 | 0.1 | 0.1 | 0.2 | 0.3 | 0.4 | 2.2 | 1.8 | 2.4 | 2.3 | 1.0 | 0.3 |
| CO2,calc | 0.01 | 0.04 | 0.03 | 0.5 | 0.4 | 0.4 | 2.2 | 1.8 | 2.02 | 2.3 | 0.8 | 0.04 |
5. Conclusions
Acknowledgments
Author Contributions
Conflicts of Interest
Nomenclature
| ai (i = 1–5) | Coefficients in the polynomial expression of the specific heat (Equation (4)) |
| Ci | Inertial resistance factor along the i-th direction |
| cp | Specific heat at constant pressure |
| cv | Specific heat at constant volume |
| Fi | Mass flow rate of the i-th fluid |
| g | Gravity acceleration |
| h | Enthalpy |
| k1, k2 | Constant coefficients in Equation (10) |
| L | Characteristic length |
| M | Average molecular weight |
| p | Pressure |
| R | Universal gas constant |
| S | Sutherland constant in the expression of gas viscosity (Equation (2)) |
| Si | Source term of heat exchange between gas stream and porous solid in Equation (6) |
| Sp | Source term in momentum balance equation |
| T | Temperature |
| T′ | Temperature reference value |
| t | Time |
| U | Average gas velocity |
| u | Velocity vector |
| V | Total apparent volume of the porous medium |
| Wavg | Average vertical velocity |
| αi | Porous permeability along the i-th direction |
| δ | Thickness of the porous medium |
| σw | Relative standard deviation of vertical velocity |
| μ | Dynamic viscosity |
| λ | Thermal conductivity |
| ρ | Density |
| ρa | Average reference density |
| τ | Shear stress tensor |
References
- De Rademaeker, E.; Suter, G.; Pasman, H.J.; Fabiano, B. A review of the past, present and future of the European loss prevention and safety promotion in the process industries. Process Saf. Environ. Prot. 2014, 92, 280–291. [Google Scholar] [CrossRef]
- Le Chevalier, D.; Cabodi, I.; Citti, O.; Gaubil, M.; Poiret, J. New cruciform solutions to upgrade your regenerator. In Ceramic Engineering and Science Proceedings; Drummond, C.H., III, Ed.; John Wiley & Sons: Hoboken, NJ, USA, 2012; Volume 33, pp. 91–104. [Google Scholar]
- Wang, Y.; Chen, H.; Chen, Z.; Ma, H.; Zhao, Q. Slagging and fouling characteristics of HRSG for ferrosilicon electric furnaces. Energies 2015, 8, 1101–1113. [Google Scholar] [CrossRef]
- Van Kersbergen, M.; Beerkens, R.; Sarmiento-Darkin, W.; Kobayashi, H. Optimization of burners in oxygen-gas fired glass furnace. In Ceramic Engineering and Science Proceedings; Drummond, C.H., III, Ed.; John Wiley & Sons: Hoboken, NJ, USA, 2012; Volume 33, pp. 3–14. [Google Scholar]
- Koshelnik, A.V. Modelling operation of system of recuperative heat exchangers for aero engine with combined use of porosity model and thermo-mechanical model. Glass Ceram. 2008, 65, 301–304. [Google Scholar]
- Zarrinehkafsh, M.T.; Sadrameli, S.M. Simulation of fixed bed regenerative heat exchangers for flue gas heat recovery. Appl. Therm. Eng. 2004, 24, 373–382. [Google Scholar] [CrossRef]
- Sardeshpande, V.; Anthony, R.; Gaitonde, U.N.; Banerjee, R. Performance analysis for glass furnace regenerator. Appl. Energy 2011, 88, 4451–4458. [Google Scholar] [CrossRef]
- Reboussin, Y.; Fourmigu, J.F.; Marty, P.; Citti, O. A numerical approach for the study of glass furnace regenerators. Appl. Therm. Eng. 2005, 25, 2299–2320. [Google Scholar] [CrossRef]
- Yakinthos, K.; Missirlis, D.; Sideridis, A.; Vlahostergios, Z.; Seite, O.; Goulas, A. Modelling operation of system of recuperative heat exchangers for aero engine with combined use of porosity model and thermo-mechanical model. Eng. Appl. Comput. Fluid Mech. 2012, 6, 608–621. [Google Scholar] [CrossRef]
- Solisio, C.; Reverberi, A.P.; Del Borghi, A.; Dovì, V.G. Inverse estimation of temperature profiles in landfills using heat recovery fluids measurements. J. Appl. Math. 2012, 2012. [Google Scholar] [CrossRef]
- Reverberi, A.P.; Maga, L.; Cerrato, C.; Fabiano, B. Membrane processes for water recovery and decontamination. Curr. Opin. Chem. Eng. 2014, 6, 75–82. [Google Scholar] [CrossRef]
- Palazzi, E.; Currò, F.; Fabiano, B. Accidental continuous releases from coal processing in semi-confined environment. Energies 2013, 6, 5003–5022. [Google Scholar] [CrossRef]
- Gómez, M.A.; Álvarez Feijoo, M.A.; Comesaña, R.; Eguía, P.; Míguez, J.L.; Porteiro, J. CFD simulation of a concrete cubicle to analyze the thermal effect of phase change materials in buildings. Energies 2012, 5, 2093–2111. [Google Scholar] [CrossRef]
- Reverberi, A.P.; Fabiano, B.; Dovì, V.G. Use of inverse modelling techniques for the estimation of heat transfer coefficients to fluids in cylindrical conduits. Int. Commun. Heat Mass Transfer 2013, 42, 25–31. [Google Scholar] [CrossRef]
- National Institute of Standards and Technology (NIST). Standard Reference Database Number 69. Available online: http://webbook.nist.gov/chemistry/ (accessed on 27 April 2015).
- Anderson, J.D. Computational Fluid Dynamics—The Basics with Applications; McGraw Hill: New York, NY, USA, 1995. [Google Scholar]
- Vianello, C.; Fabiano, B.; Palazzi, E.; Maschio, G. Experimental study on thermal and toxic hazards connected to fire scenarios in road tunnels. J. Loss Prev. Process Ind. 2012, 25, 718–729. [Google Scholar] [CrossRef]
© 2015 by the authors; licensee MDPI, Basel, Switzerland. This article is an open access article distributed under the terms and conditions of the Creative Commons Attribution license (http://creativecommons.org/licenses/by/4.0/).
Share and Cite
Basso, D.; Cravero, C.; Reverberi, A.P.; Fabiano, B. CFD Analysis of Regenerative Chambers for Energy Efficiency Improvement in Glass Production Plants. Energies 2015, 8, 8945-8961. https://doi.org/10.3390/en8088945
Basso D, Cravero C, Reverberi AP, Fabiano B. CFD Analysis of Regenerative Chambers for Energy Efficiency Improvement in Glass Production Plants. Energies. 2015; 8(8):8945-8961. https://doi.org/10.3390/en8088945
Chicago/Turabian StyleBasso, Davide, Carlo Cravero, Andrea P. Reverberi, and Bruno Fabiano. 2015. "CFD Analysis of Regenerative Chambers for Energy Efficiency Improvement in Glass Production Plants" Energies 8, no. 8: 8945-8961. https://doi.org/10.3390/en8088945