
Development of an Optimal Power Control Scheme for Wave-Offshore Hybrid Generation Systems


Abstract
:
1. Introduction
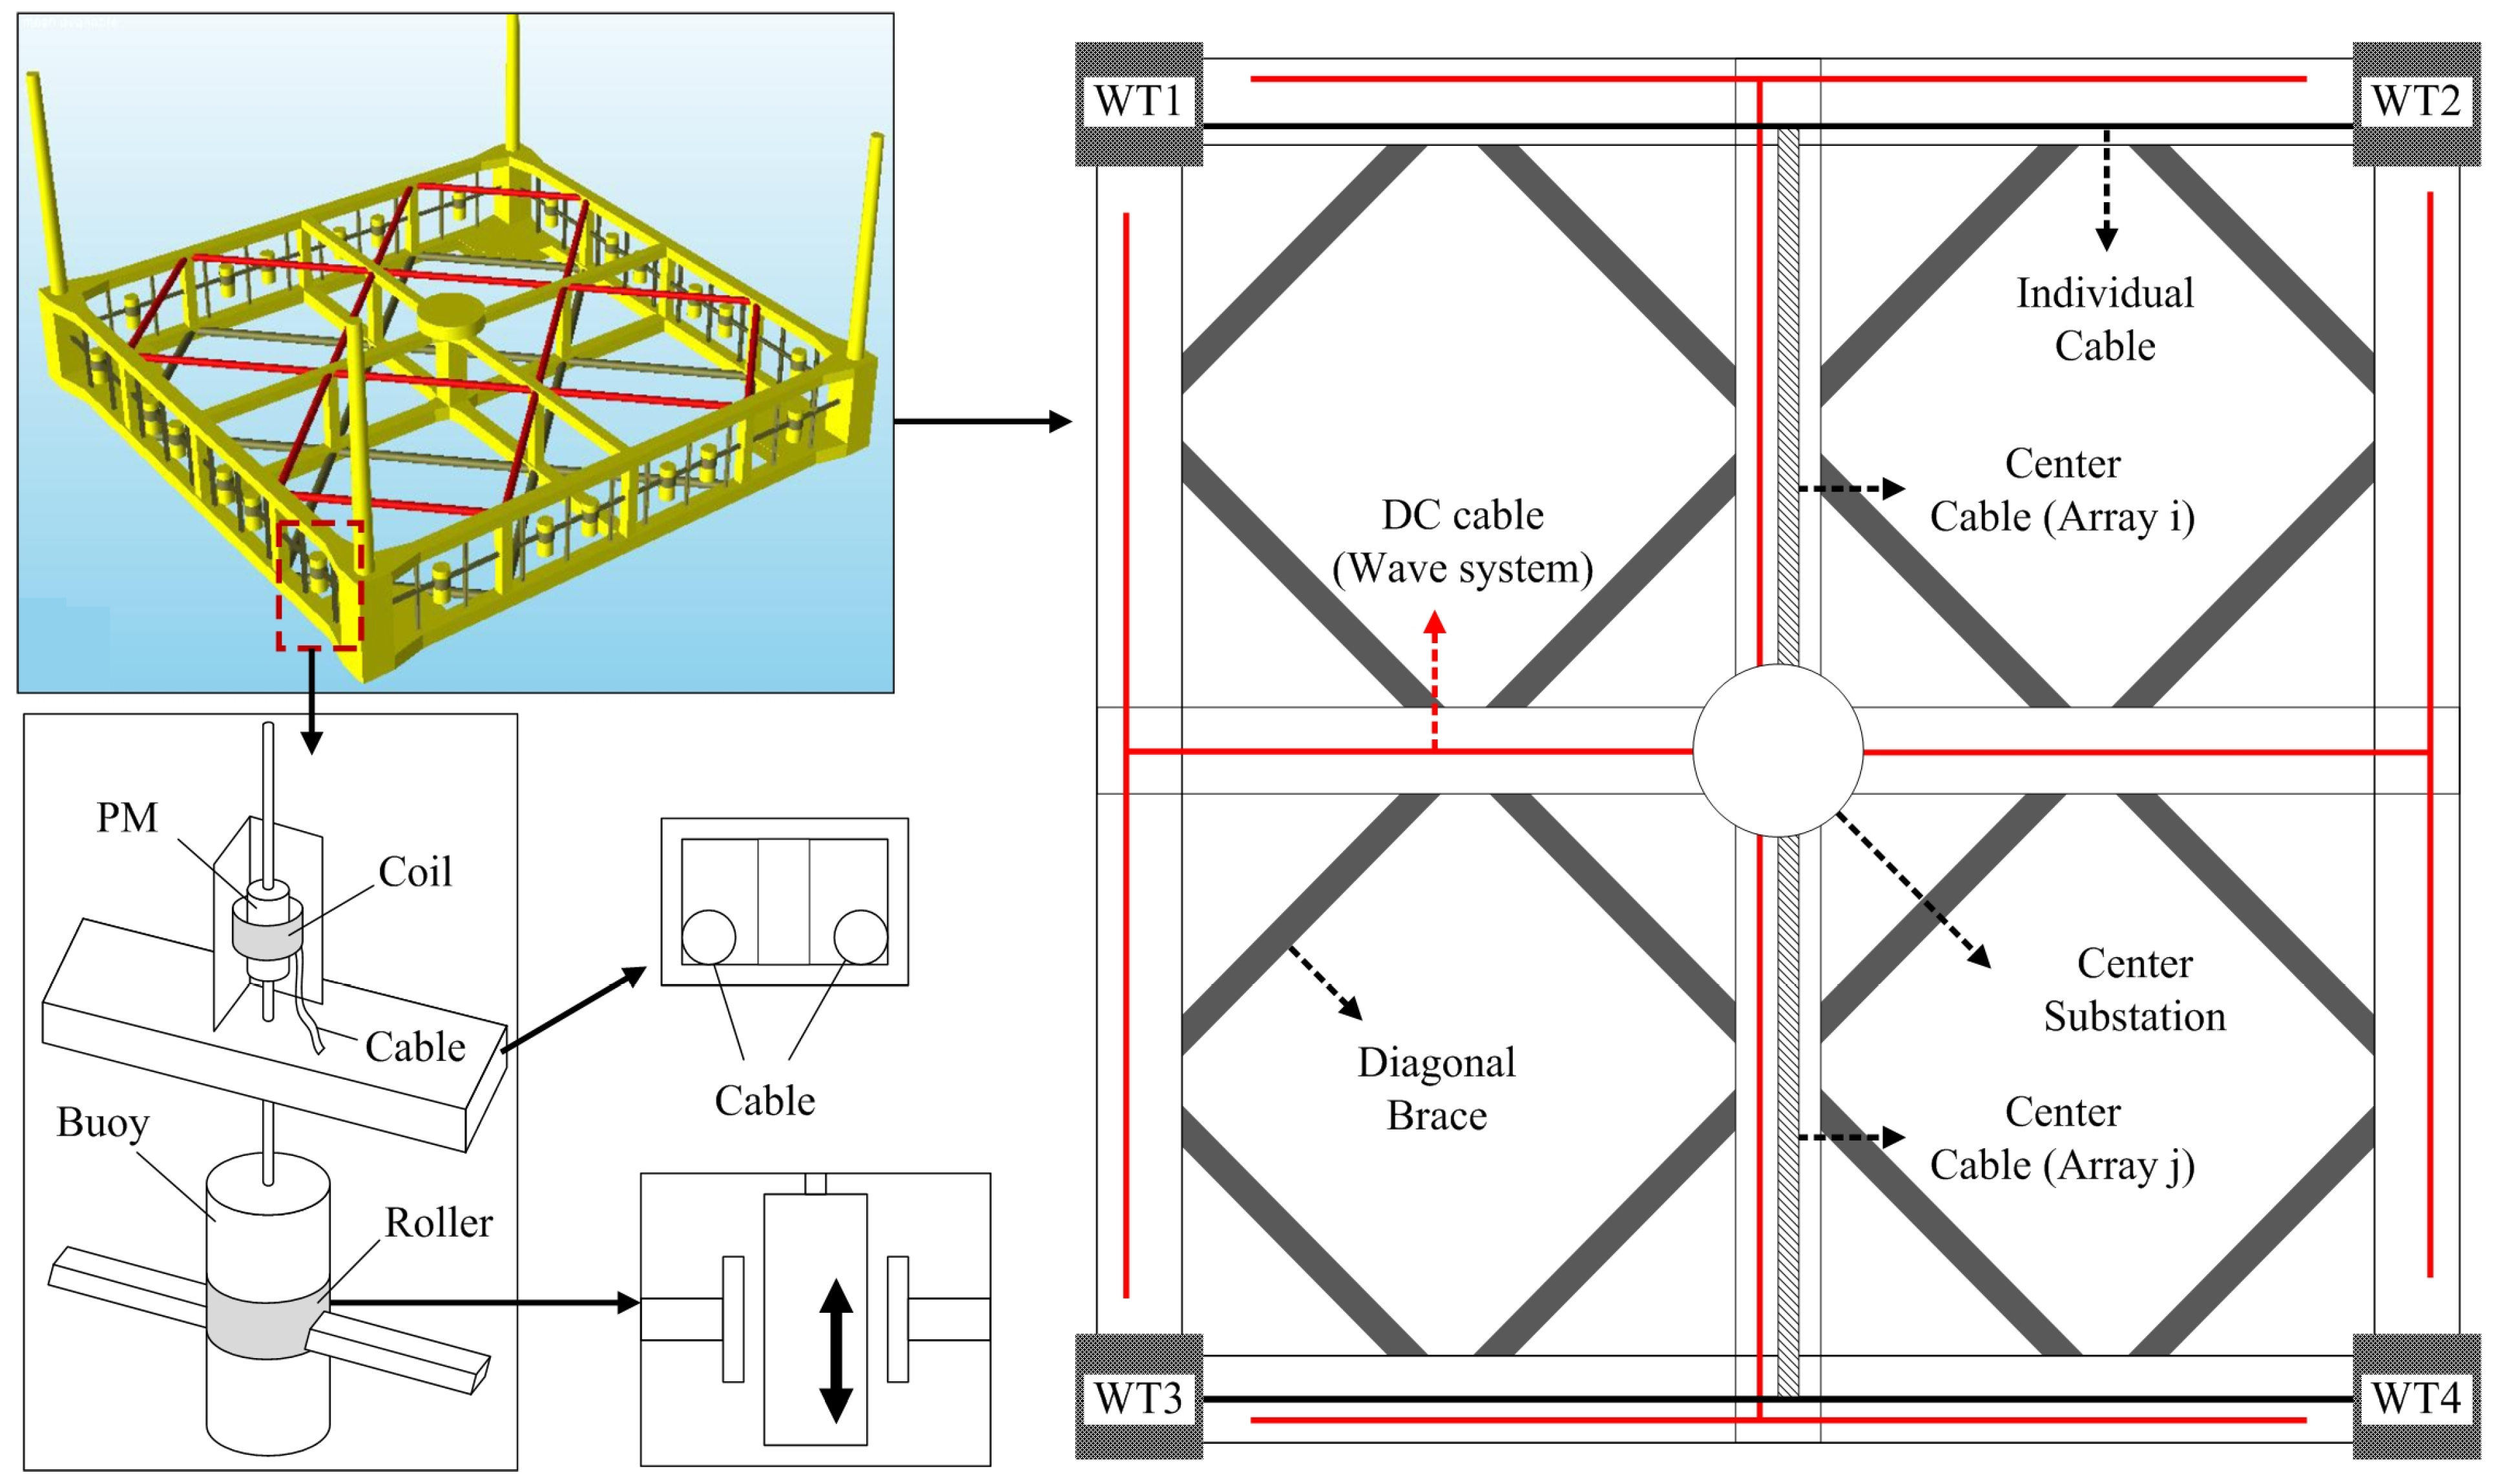
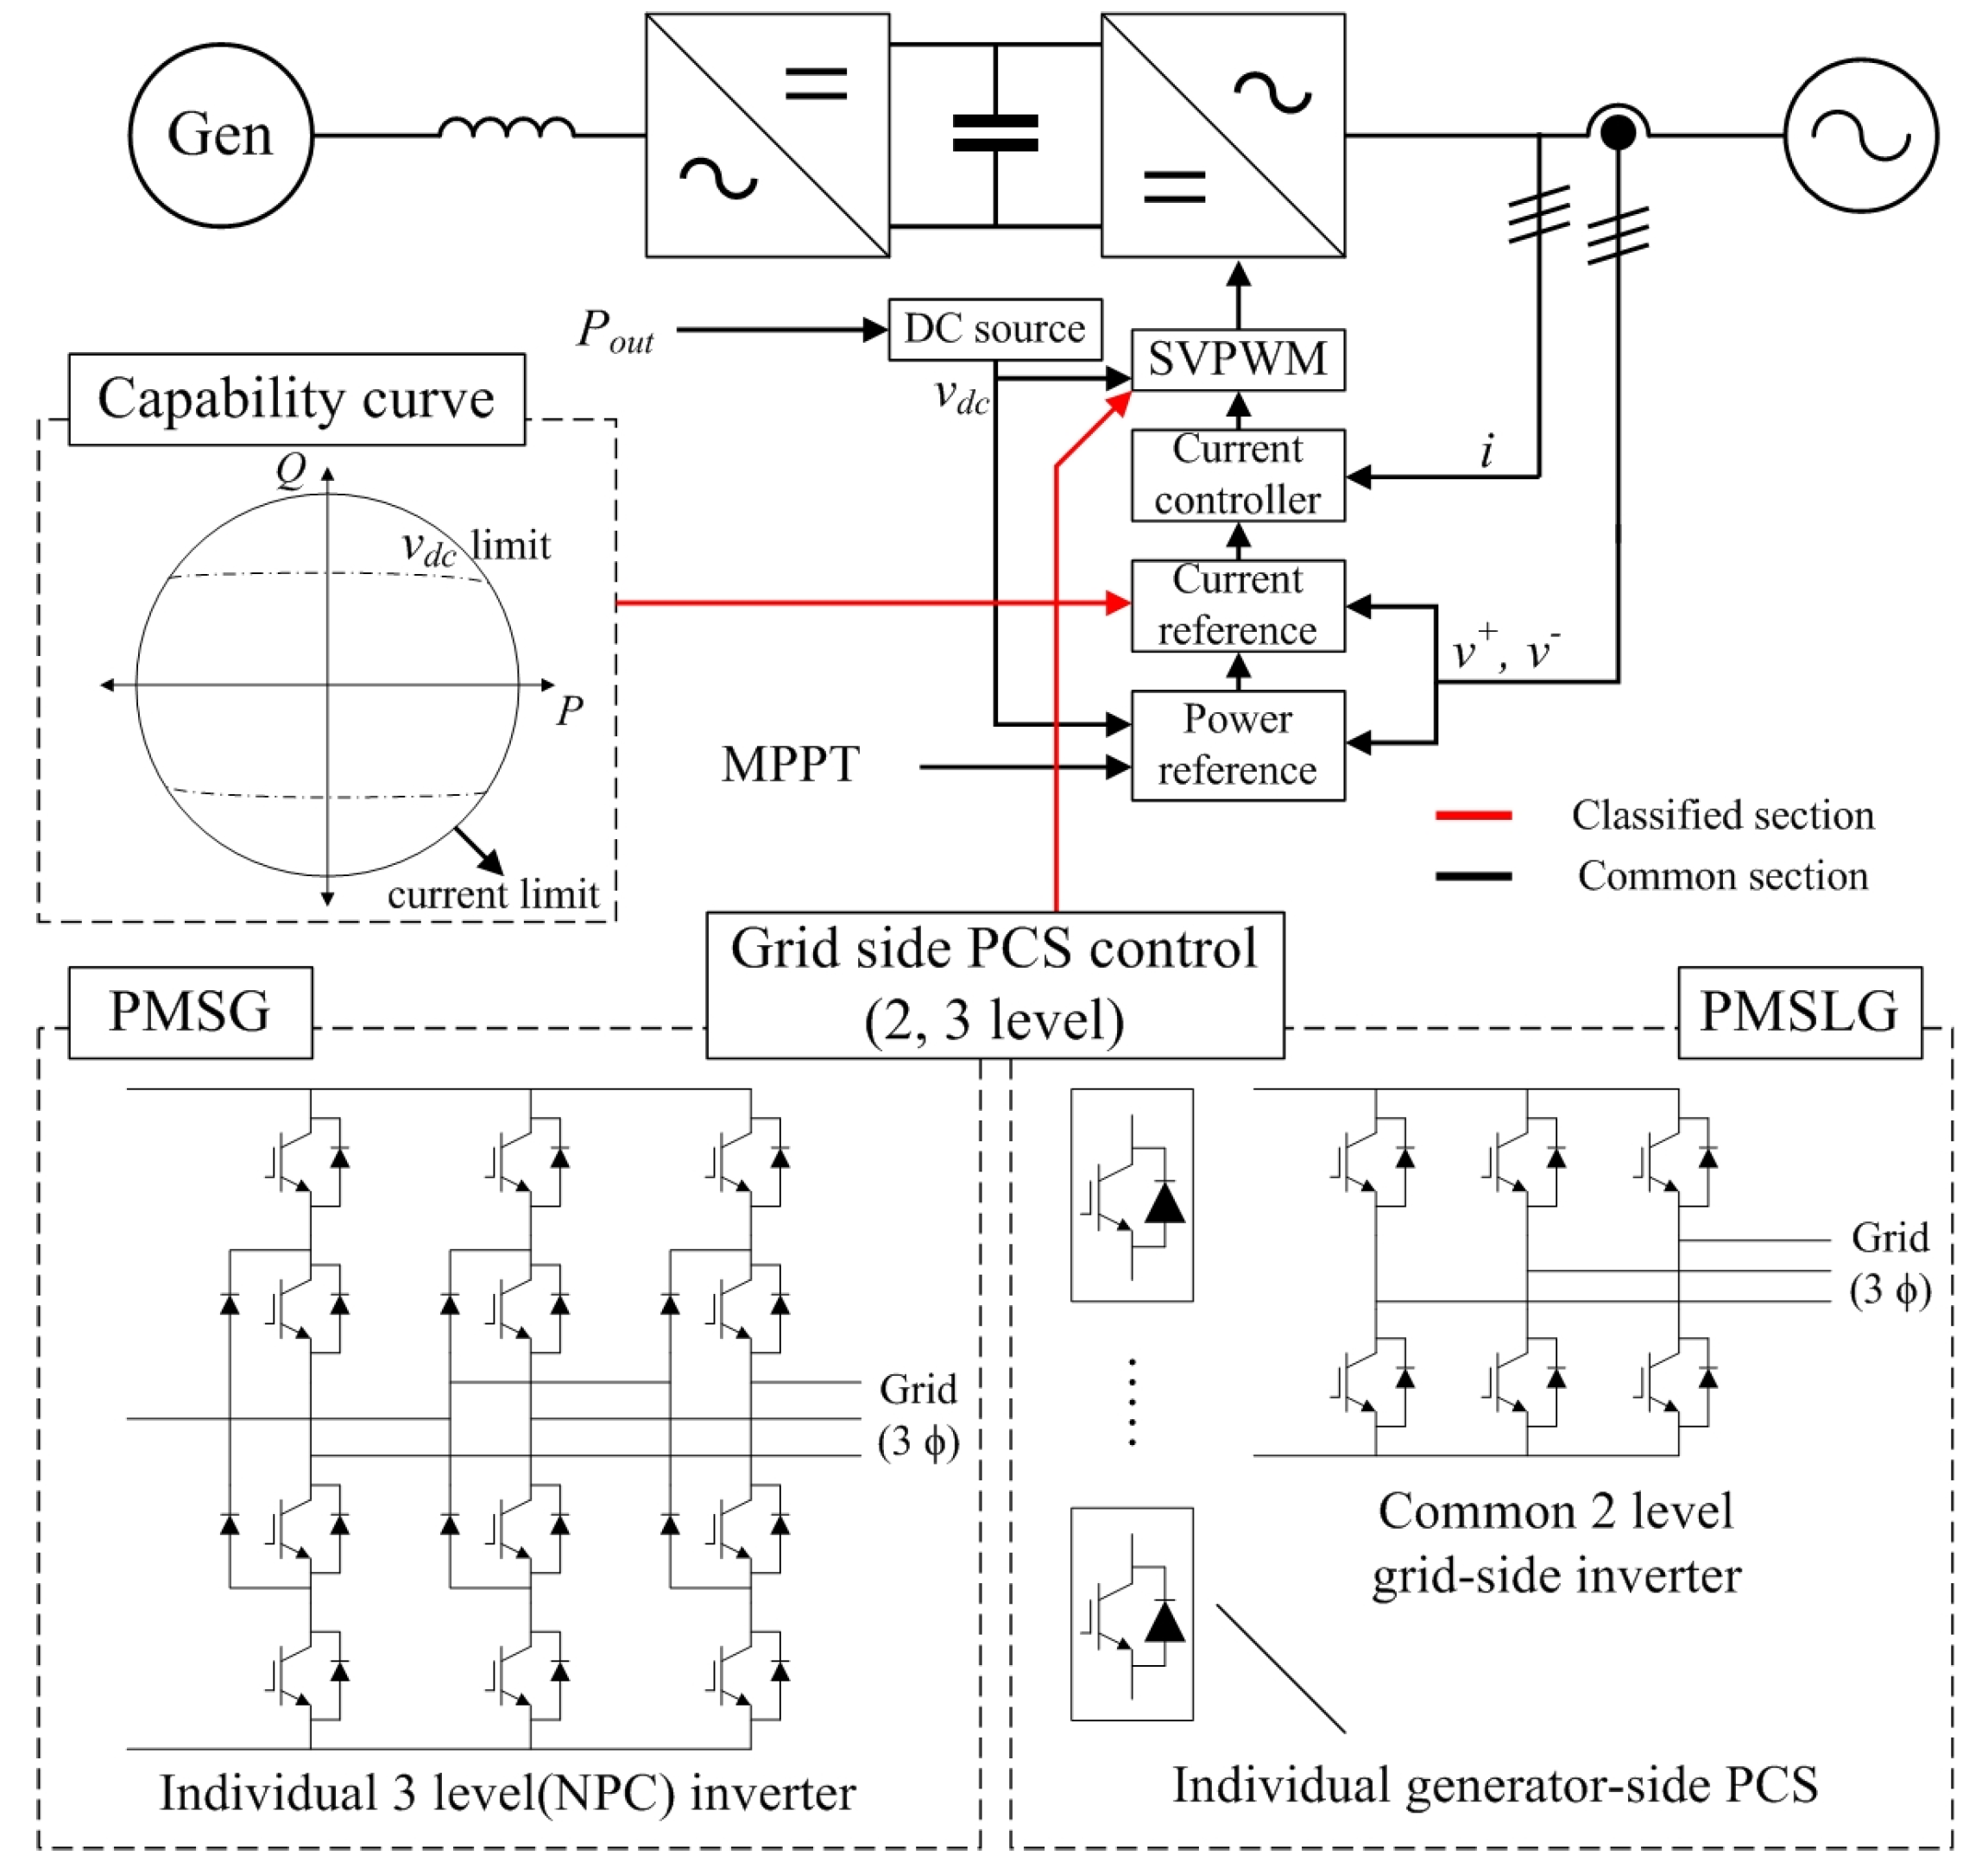
2. Hybrid Generation System (HGS) Configuration
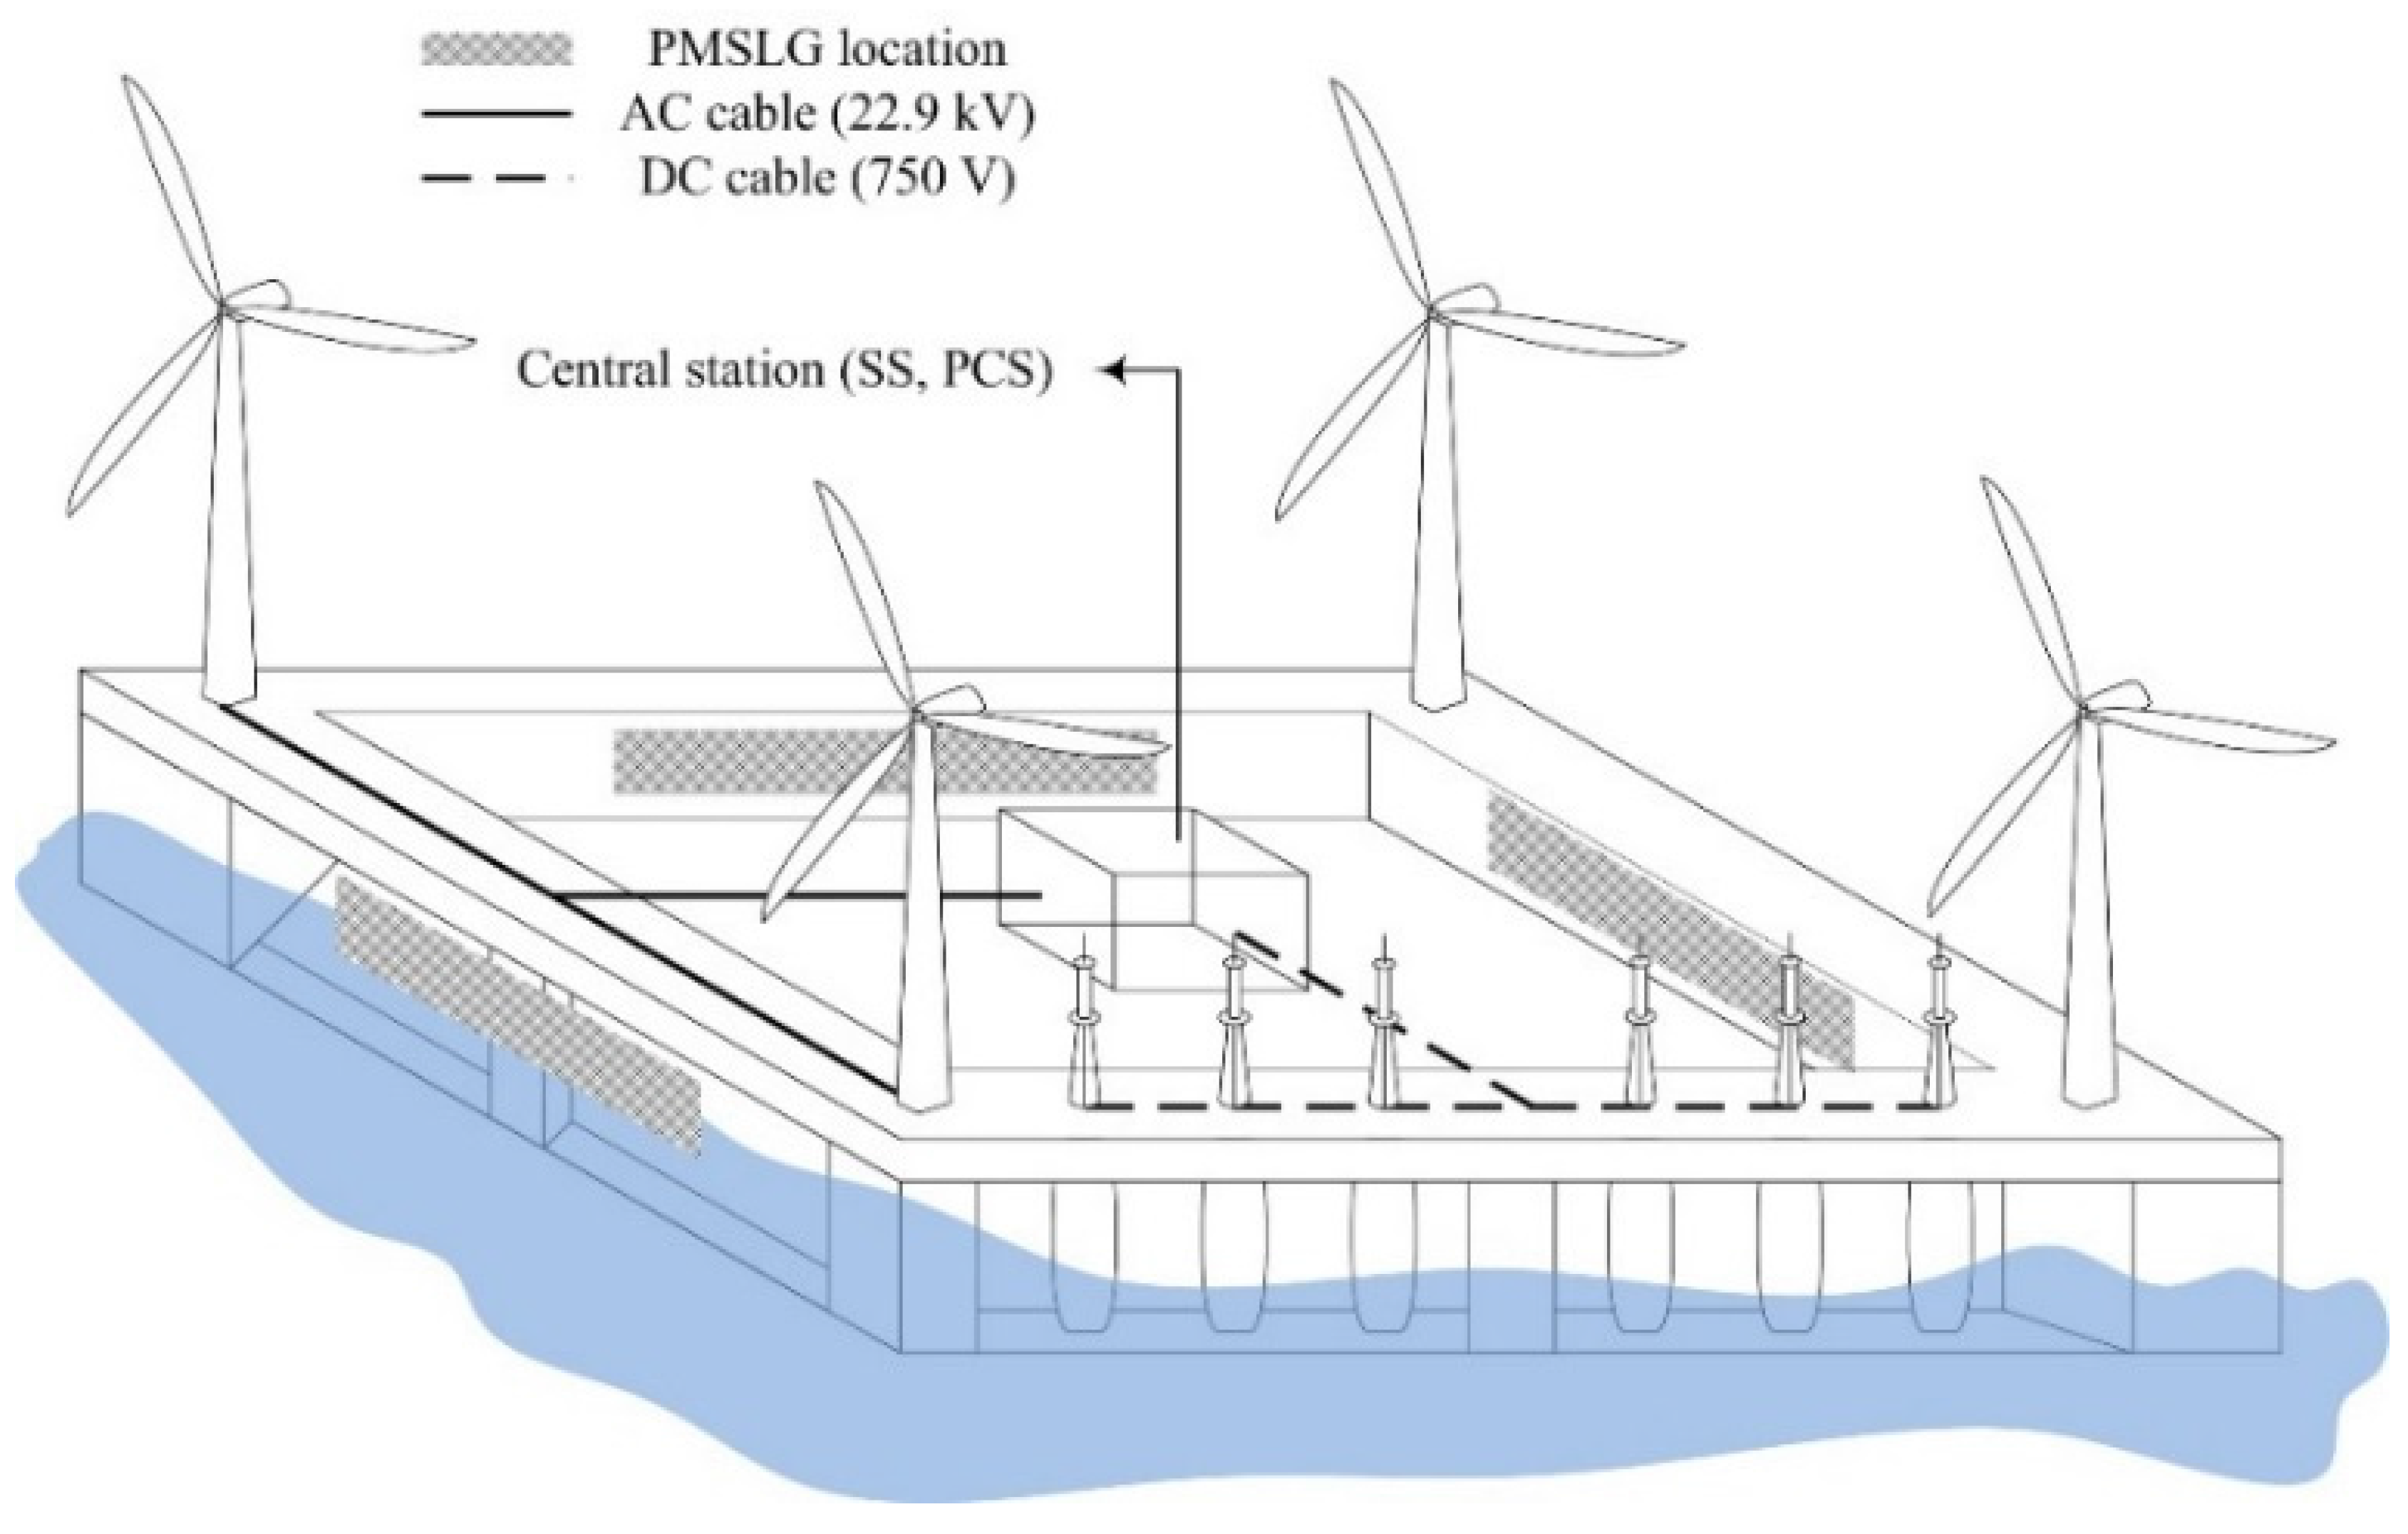
2.1. Wave-Offshore Generation System

2.2. Integrated Monitoring System
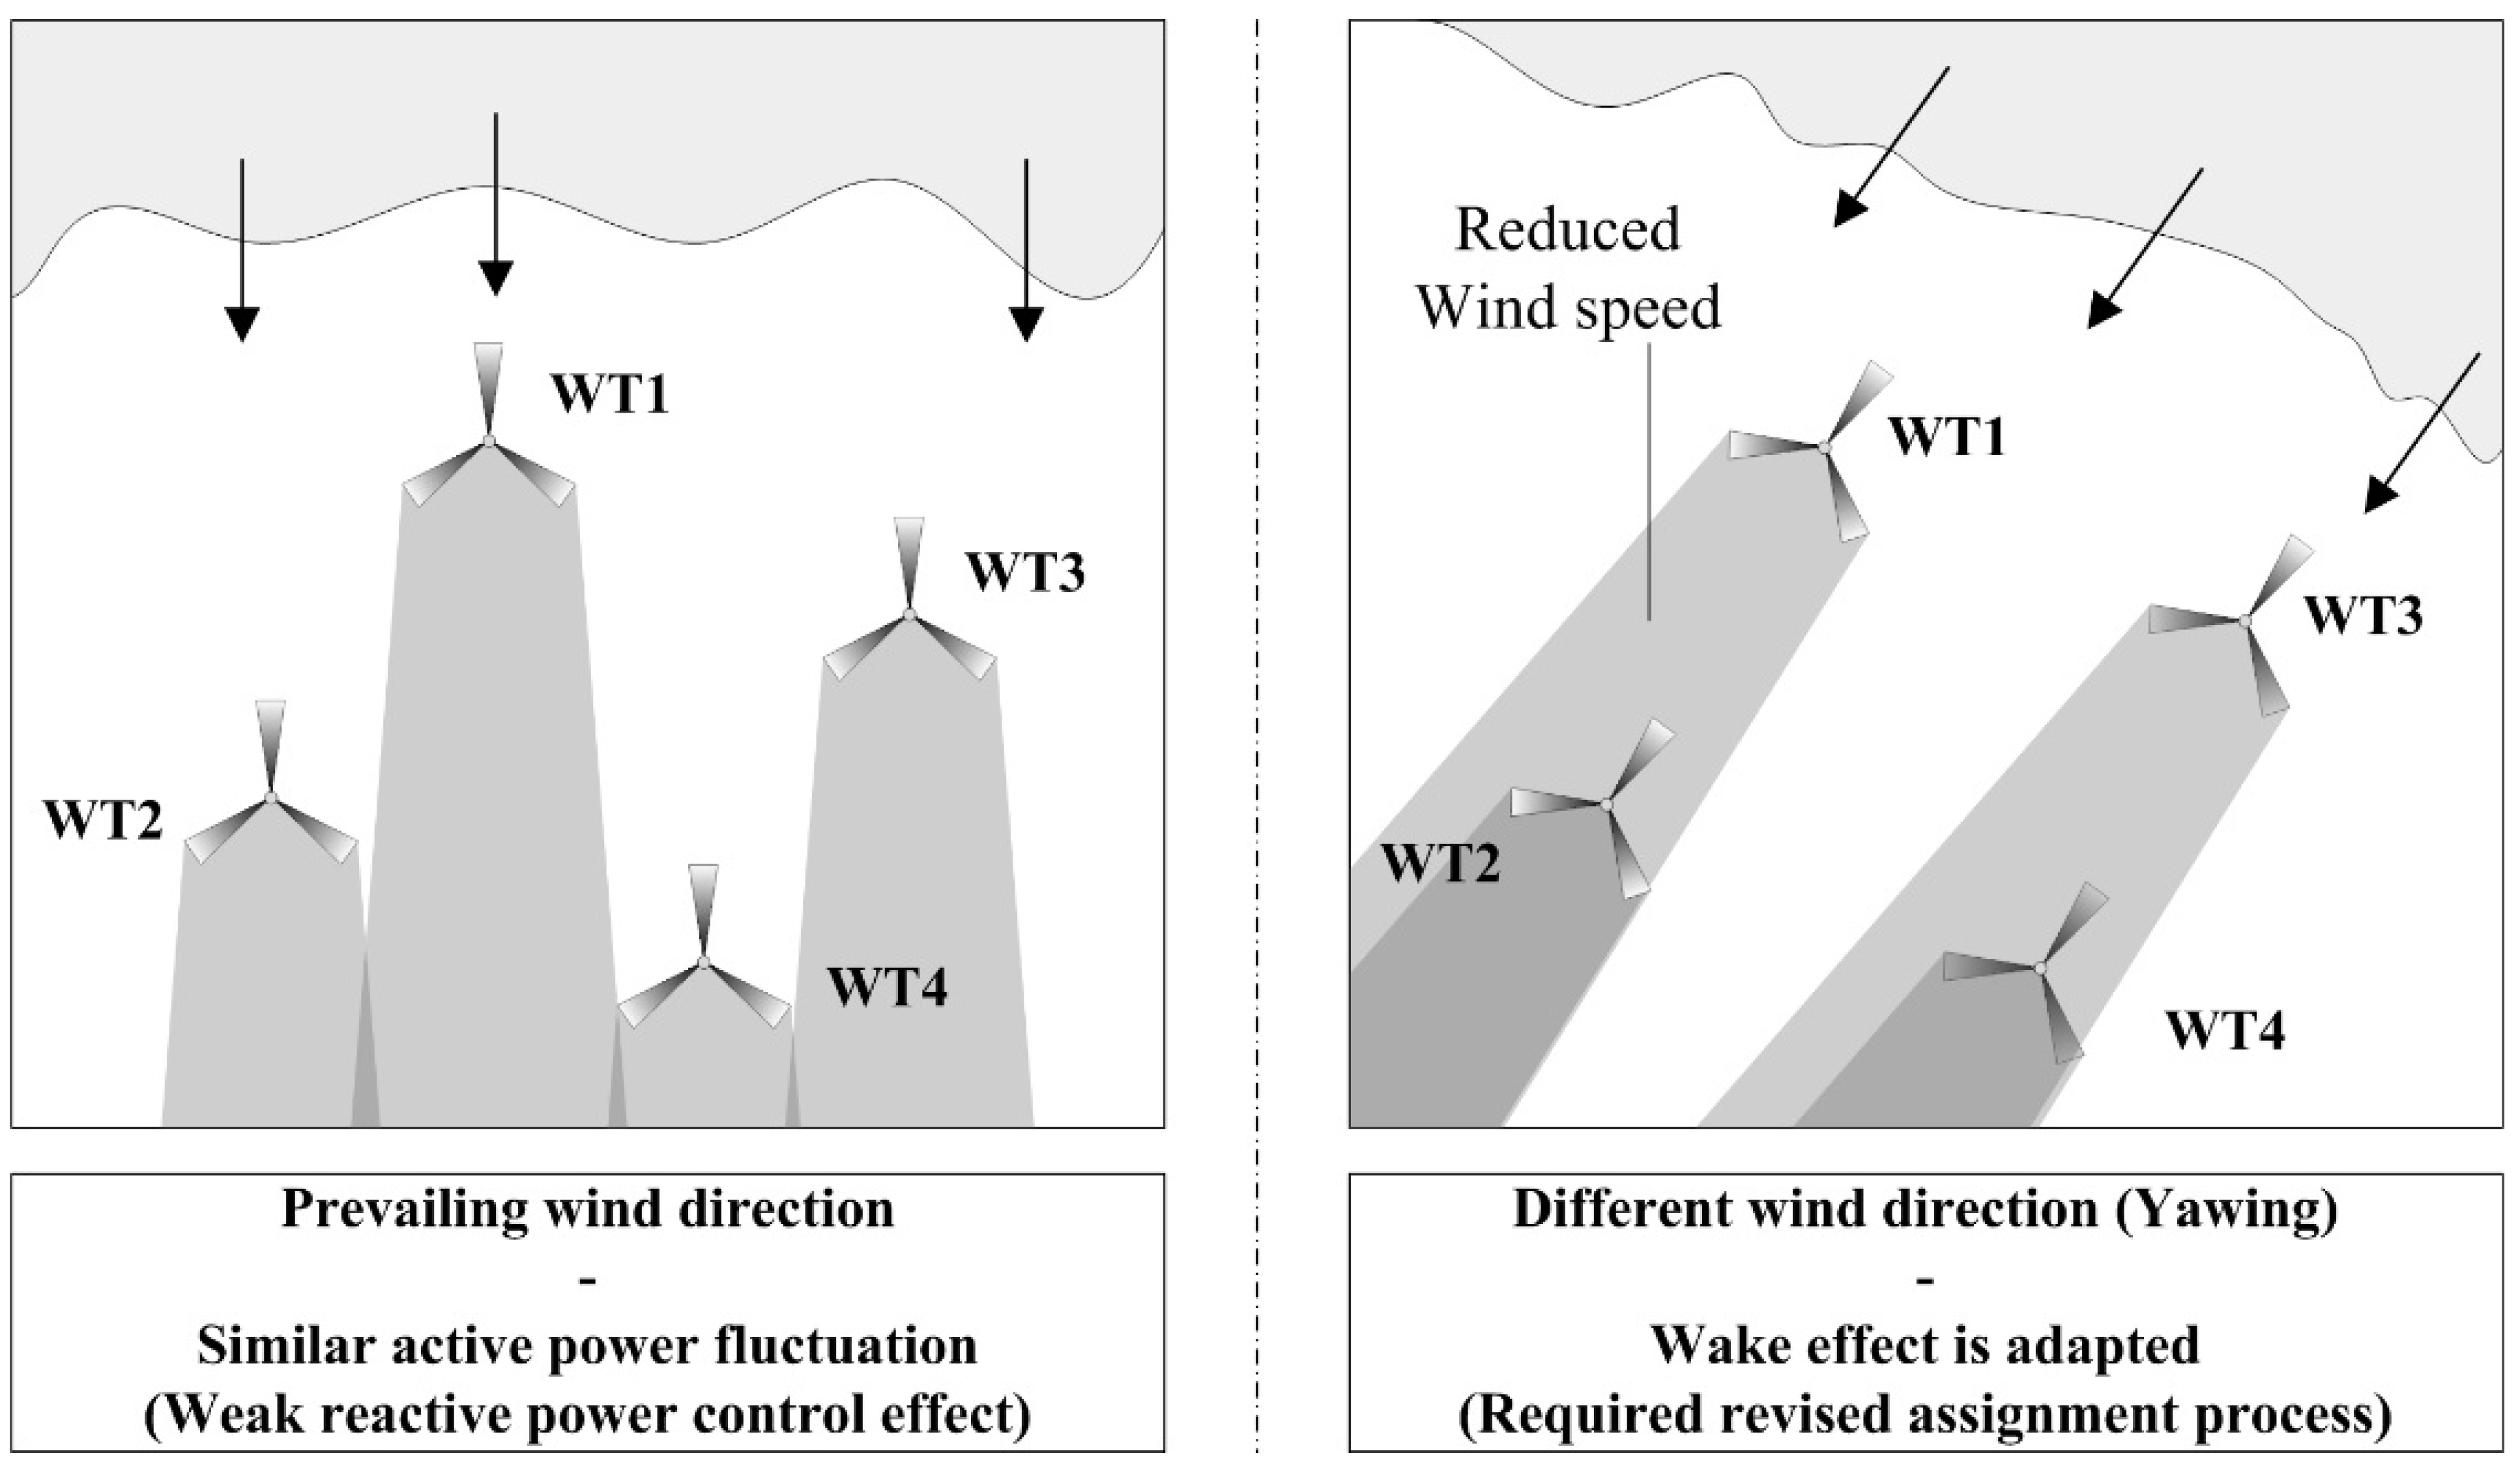
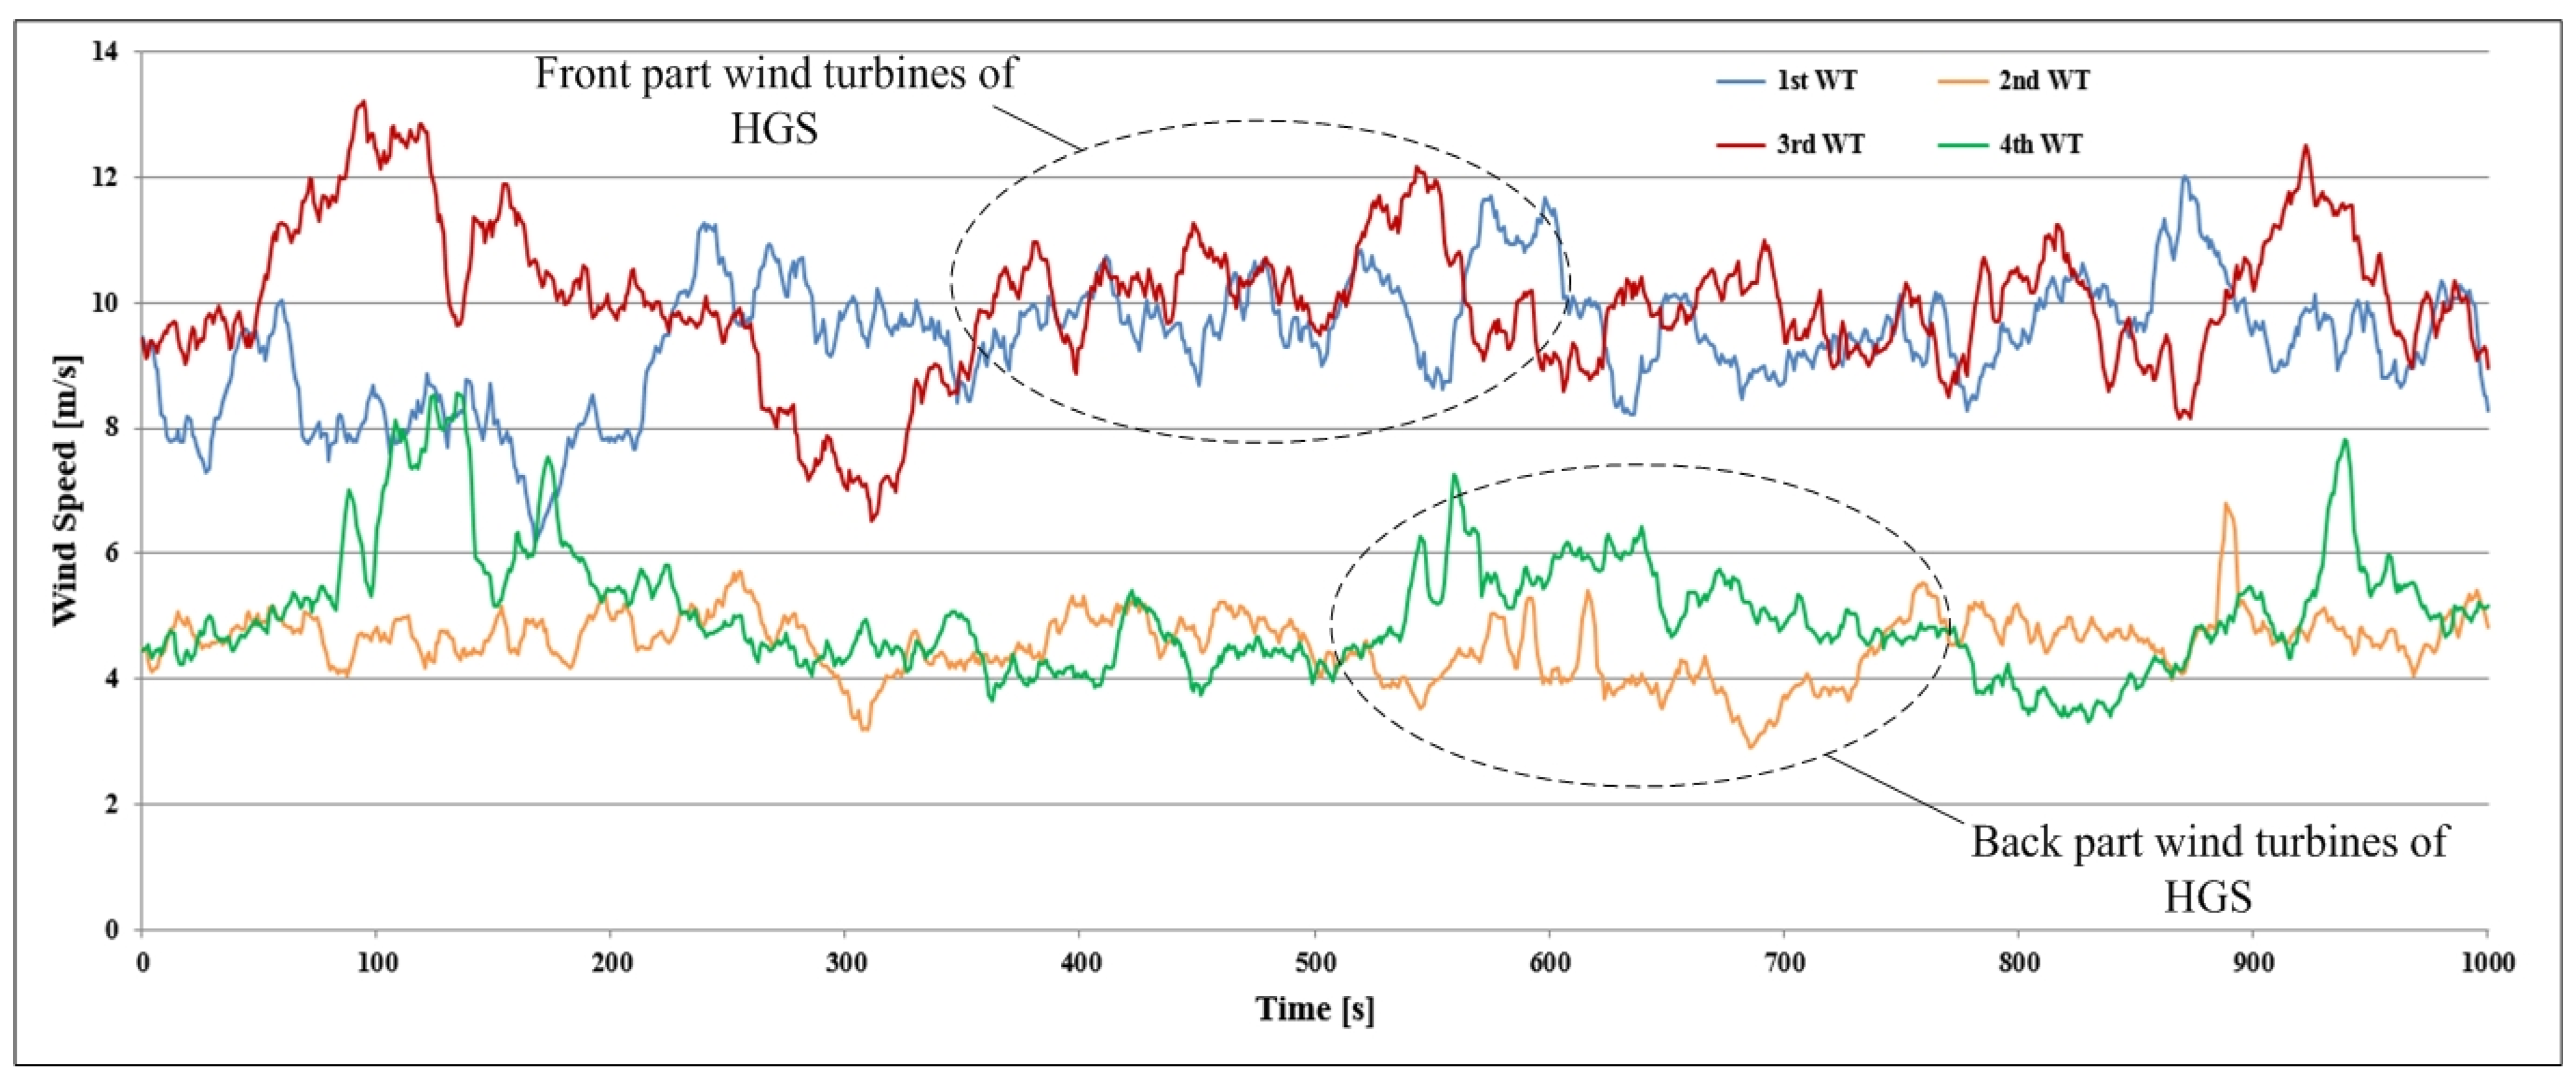
2.3. Wind System Characteristics


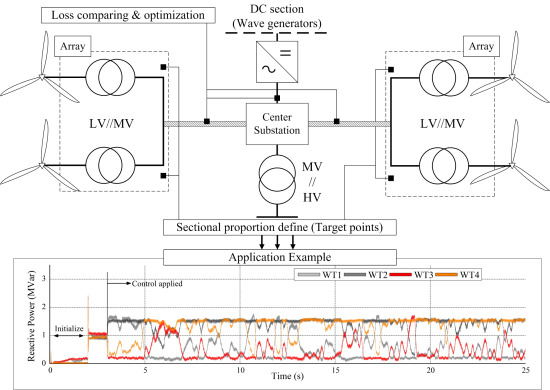
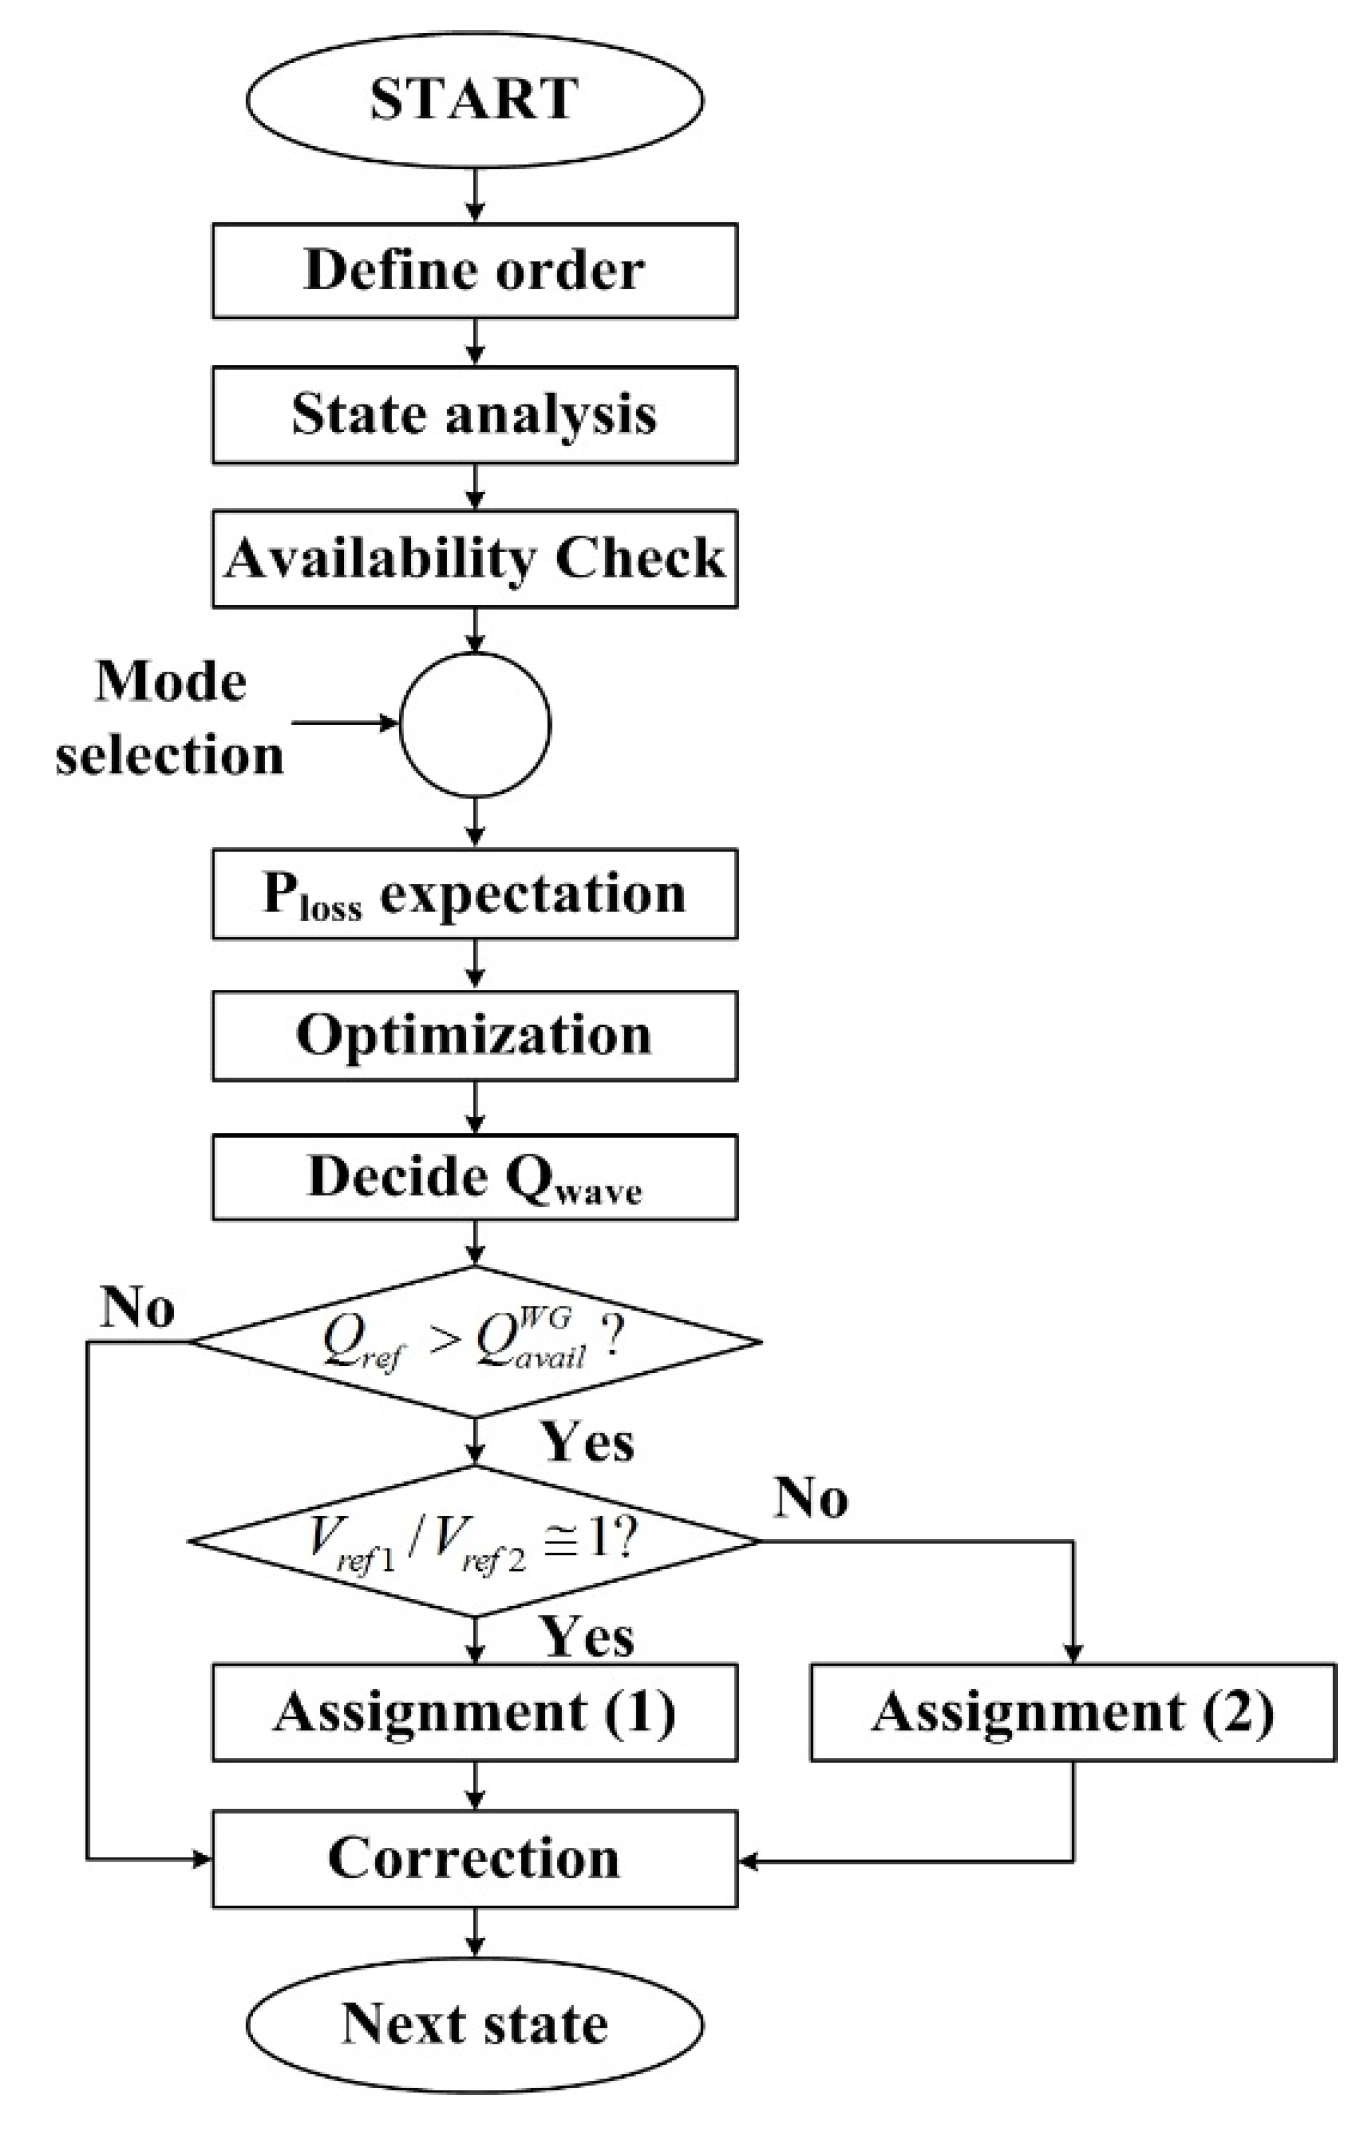
3. Power Control Algorithm
3.1. Proposed Method Description


| Voltage (kV) | Size (mm2) | Allowable current (A) | Conductor resistance (Ω/km) | Inductance (mH/km) | Capacitance (µF/km) |
|---|---|---|---|---|---|
| 0.75 (DC) | 35 | 228 | 0.565 | 0.277 | 0.08 |
| 50 | 289 | 0.393 | 0.266 | 0.09 | |
| 22.9 | 95 | 291 | 0.193 | 0.42 | 0.17 |
| 120 | 330 | 0.153 | 0.41 | 0.18 |
3.2. System Loss Equation

3.3. Reactive Power Assignment Method
3.3.1. Low Voltage Variation
3.3.2. Considering Voltage Variation
3.3.3. Incremental Loss Comparison

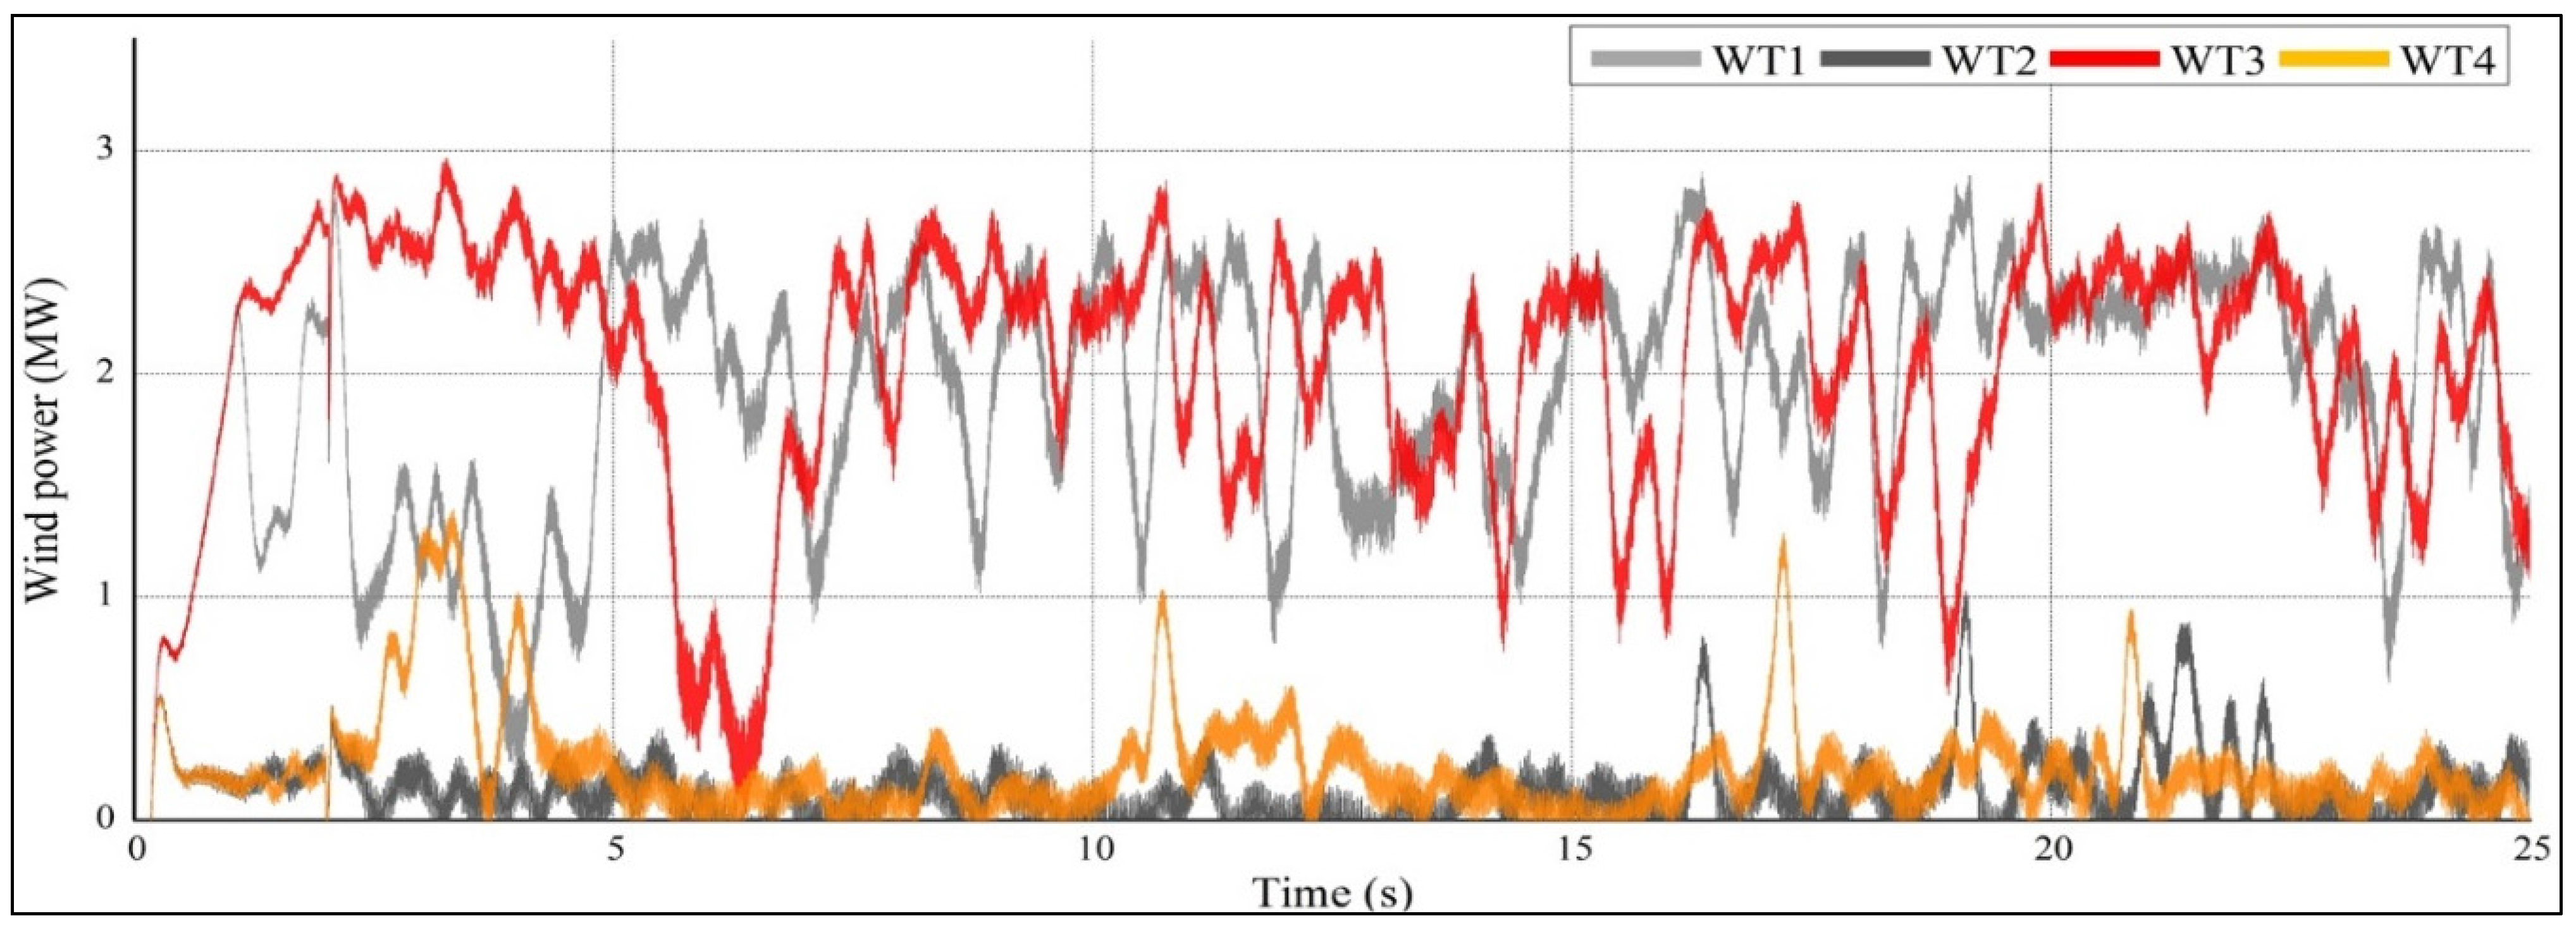
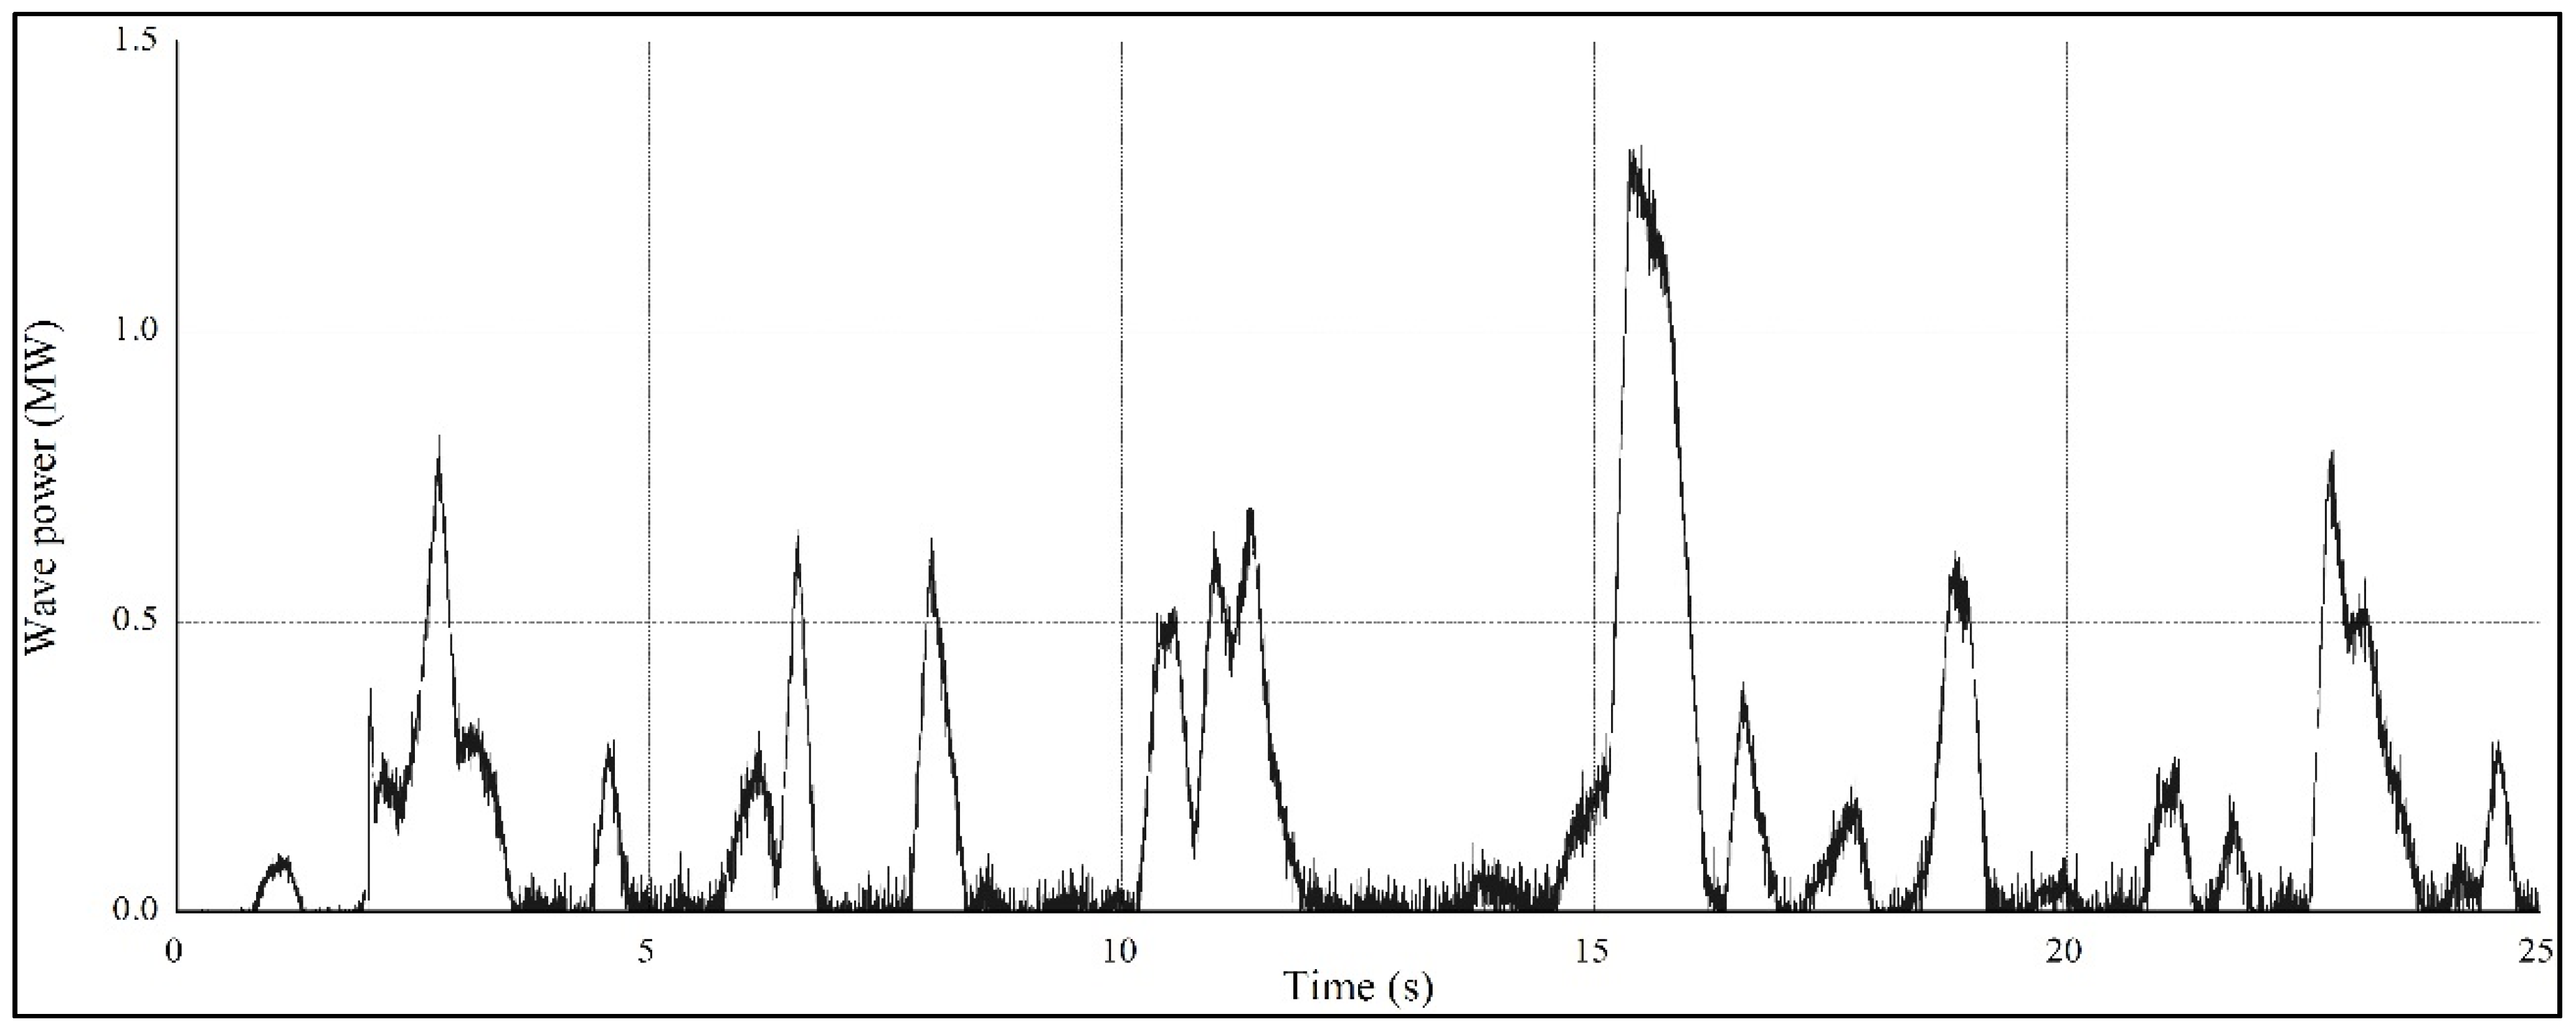
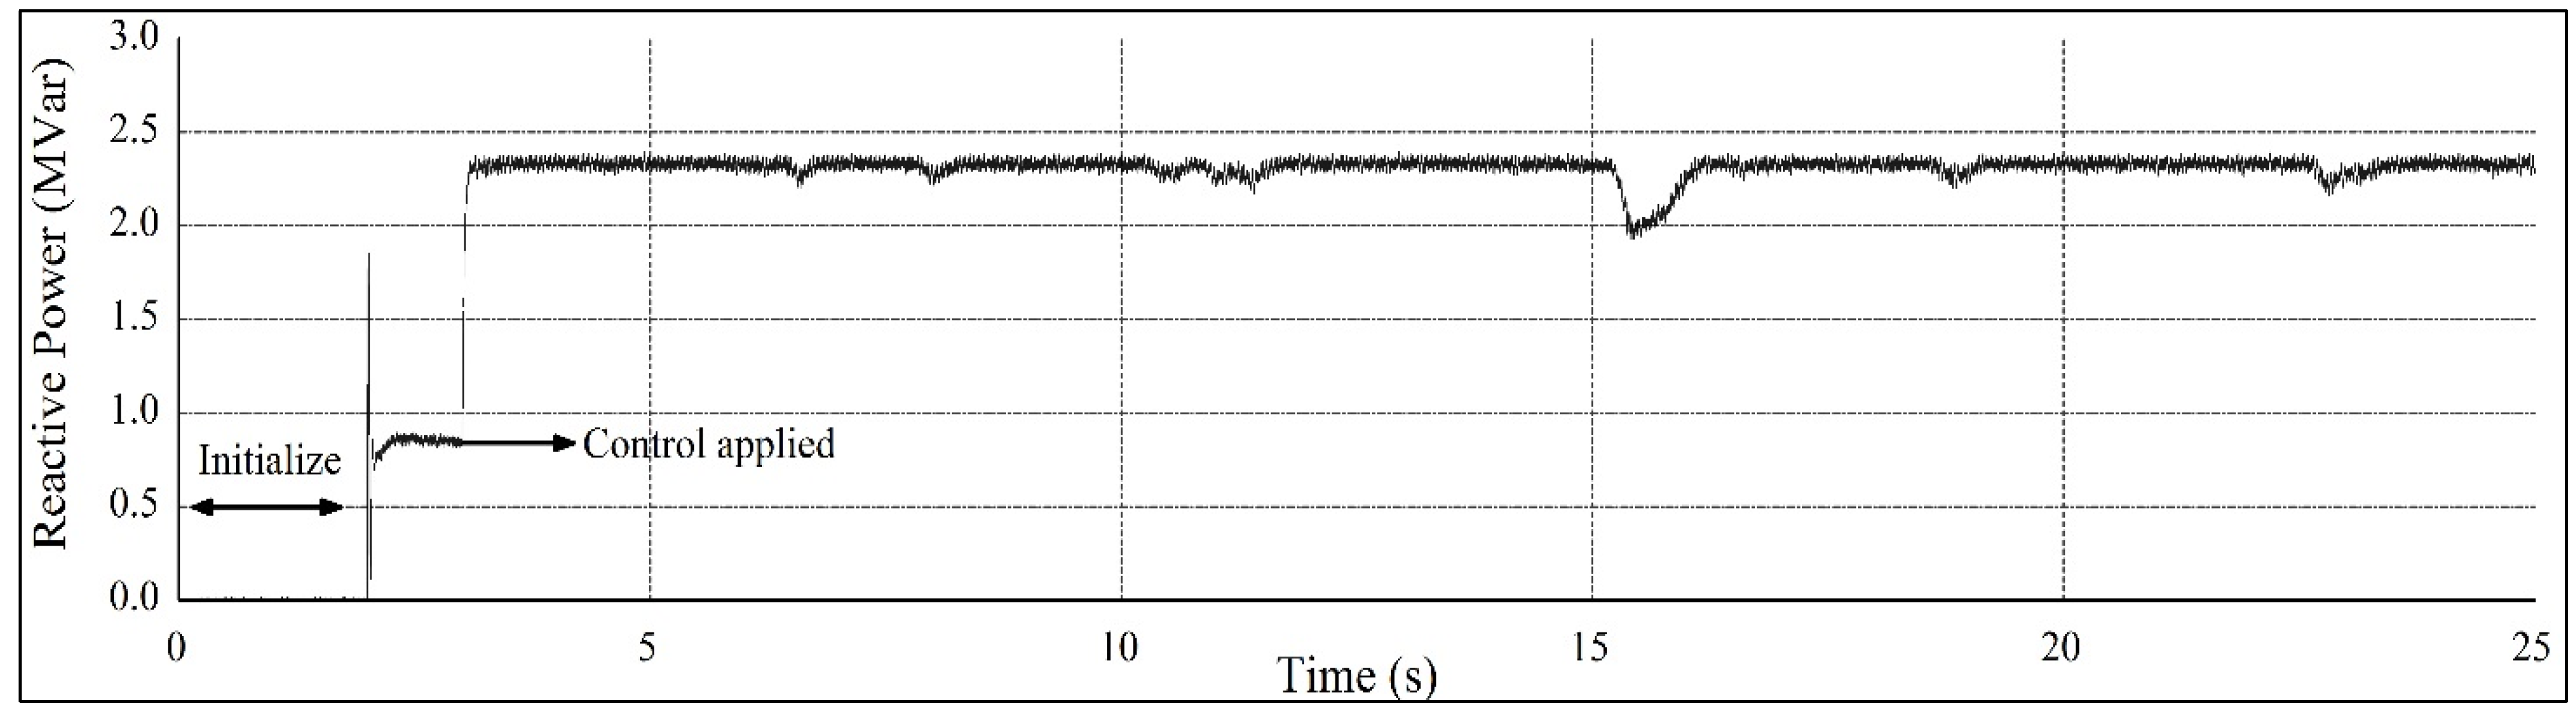
4. Simulation
4.1. System Design
4.2. Simulation


| Number (n) | Rate power (MW) | Grid data | WT-WT distance (m) | Simulation time (s) | ||||
|---|---|---|---|---|---|---|---|---|
| WT | WG | WT | WG | Total | SCR | X/R | ||
| 4 | 24 | 3 | 0.1 | 14.4 | 15 | 15 | 100 | 25 |
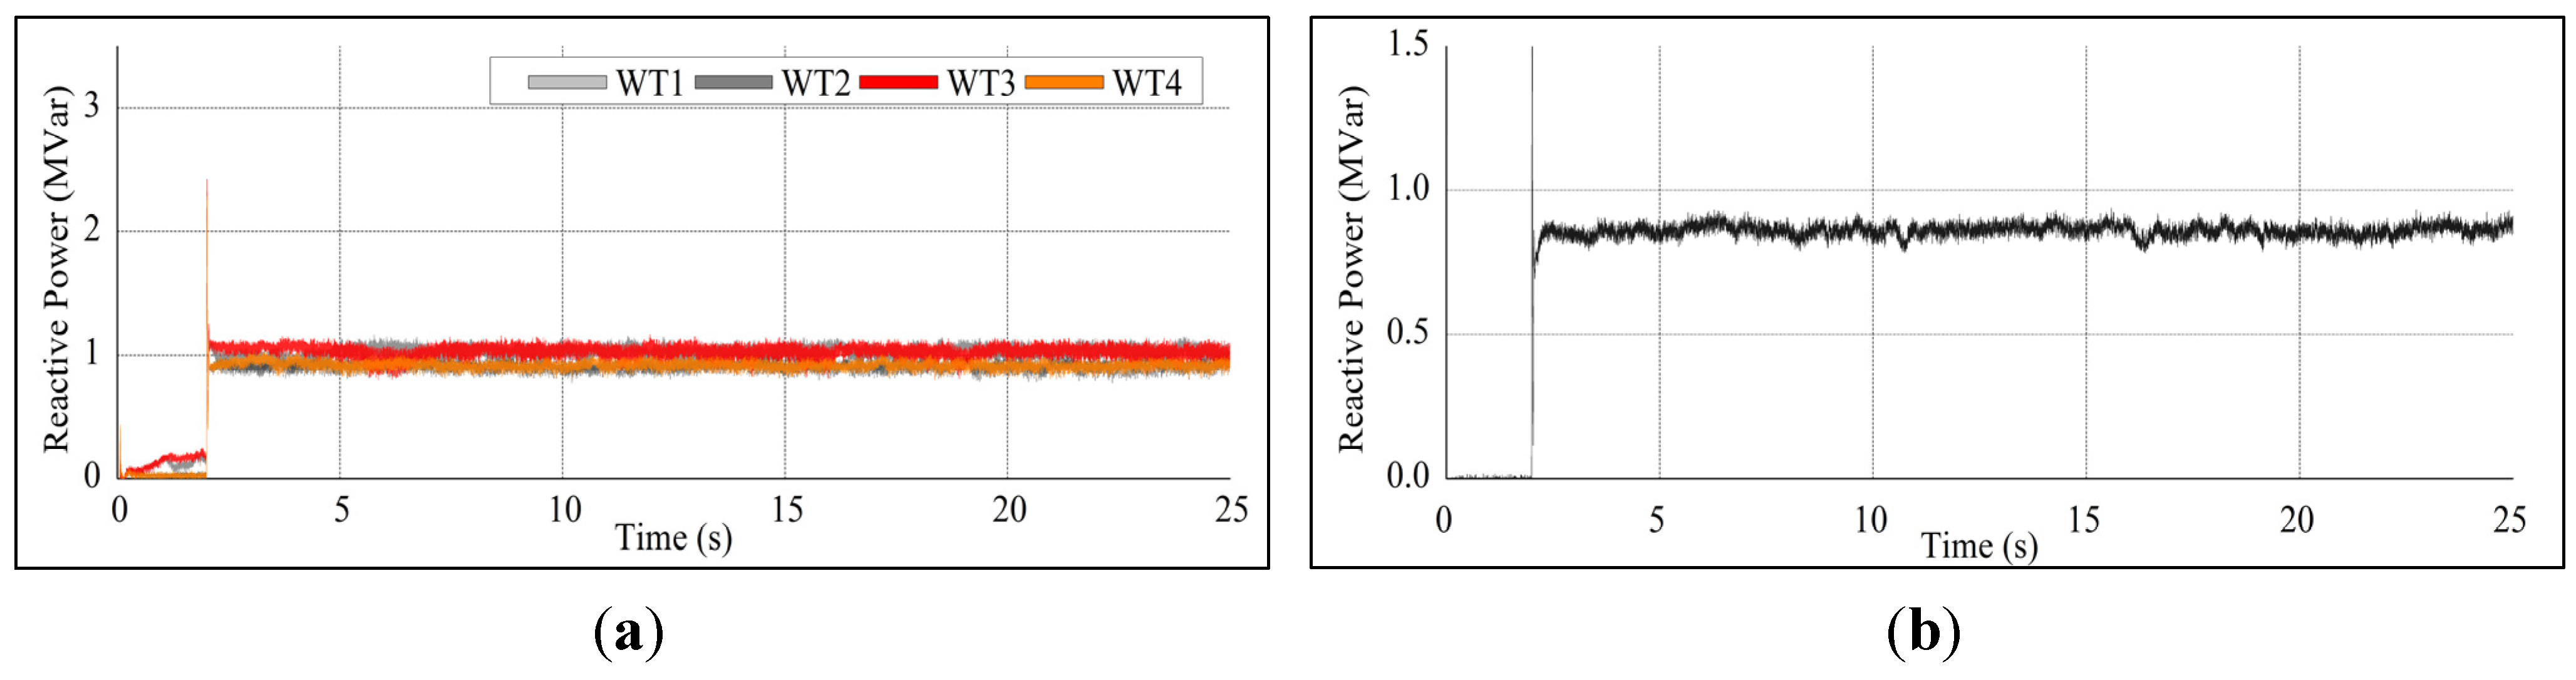
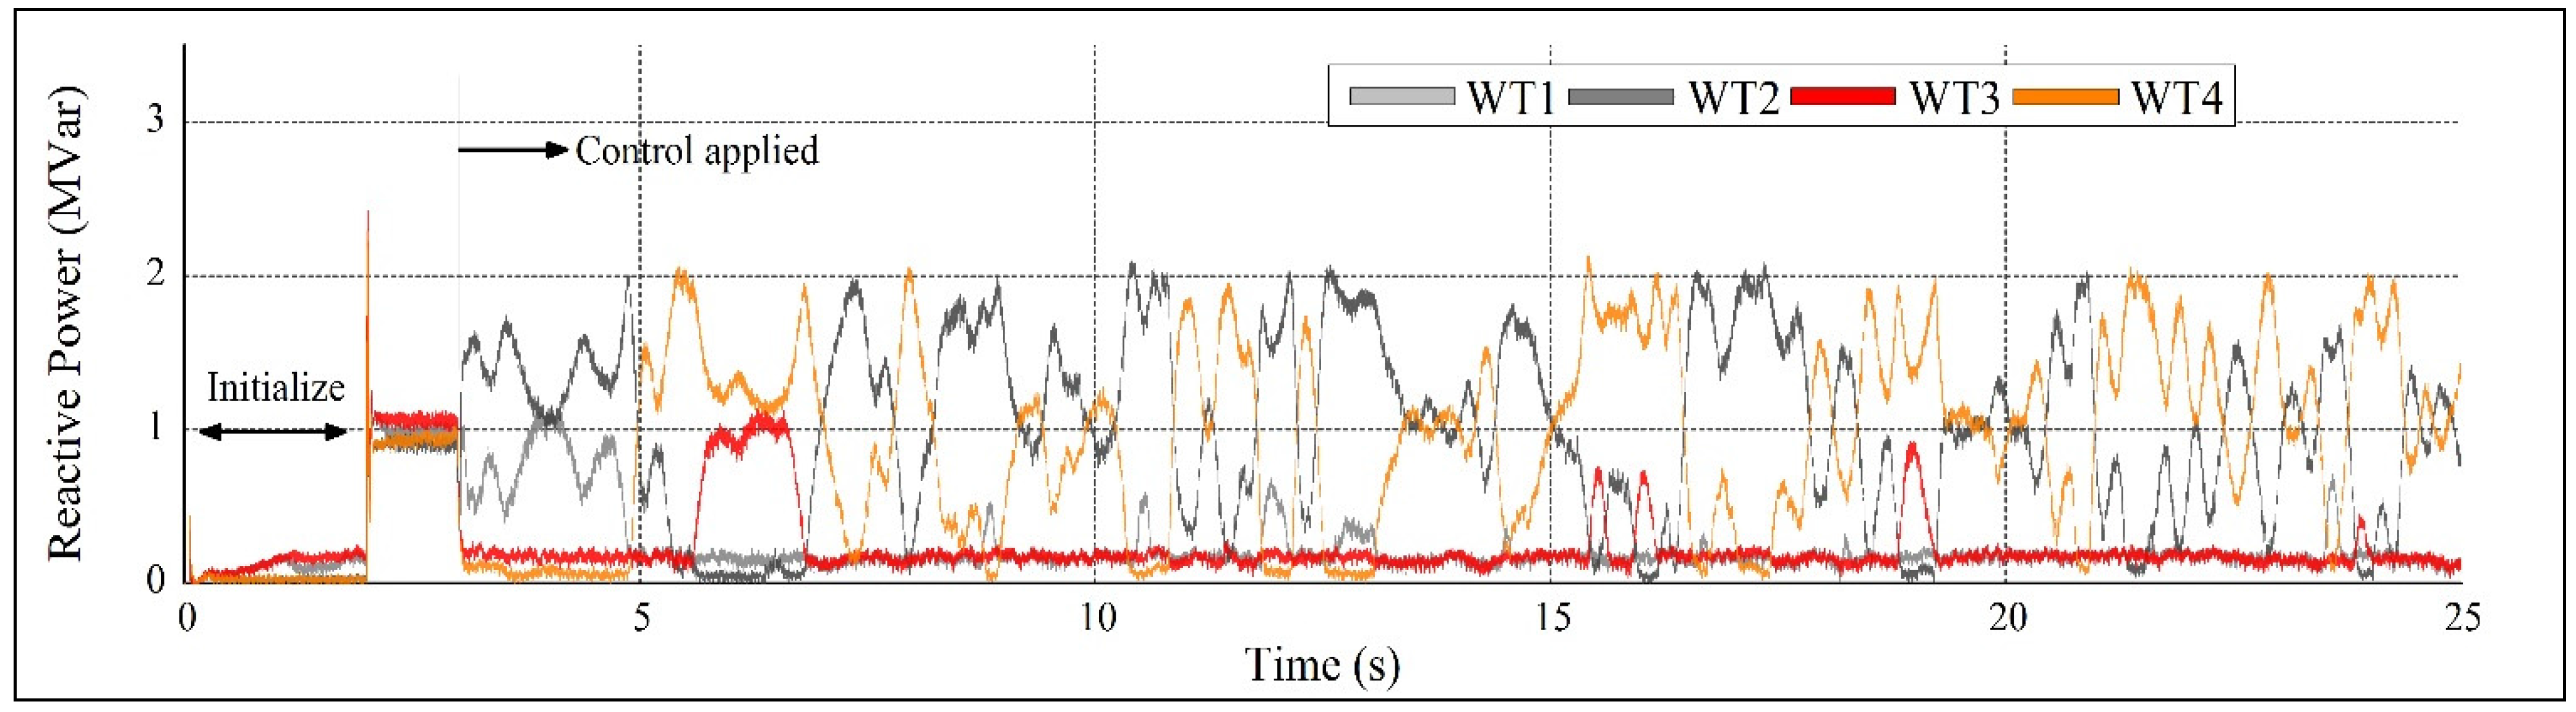
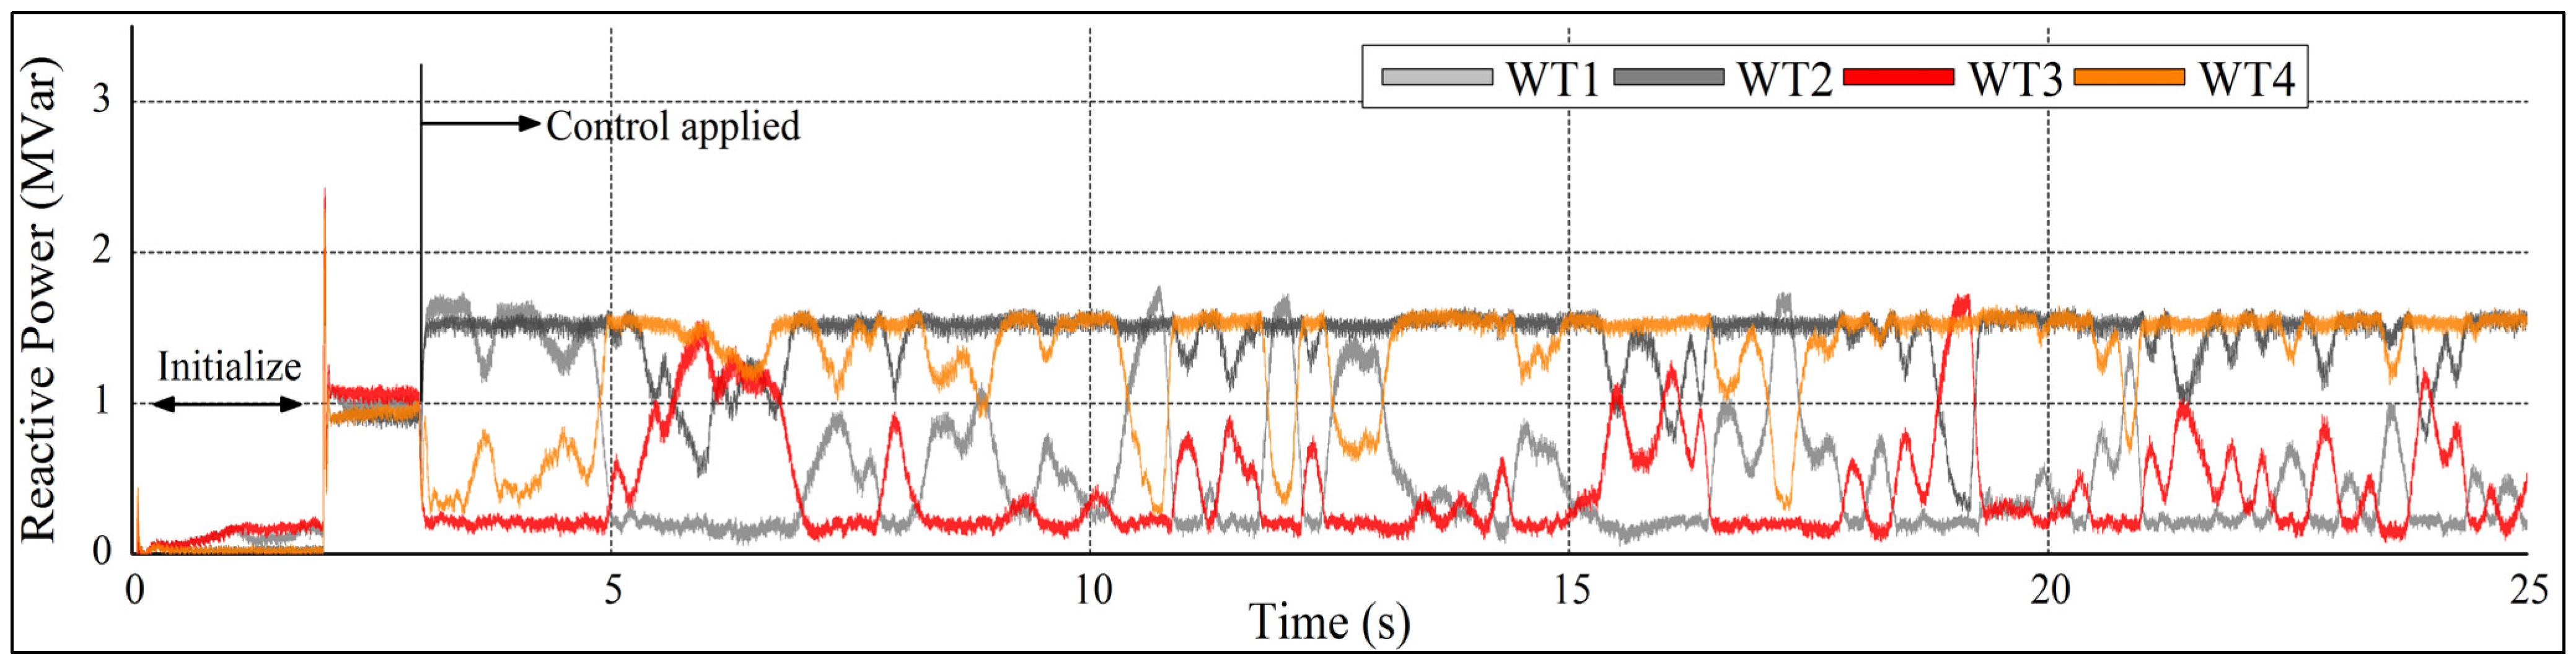
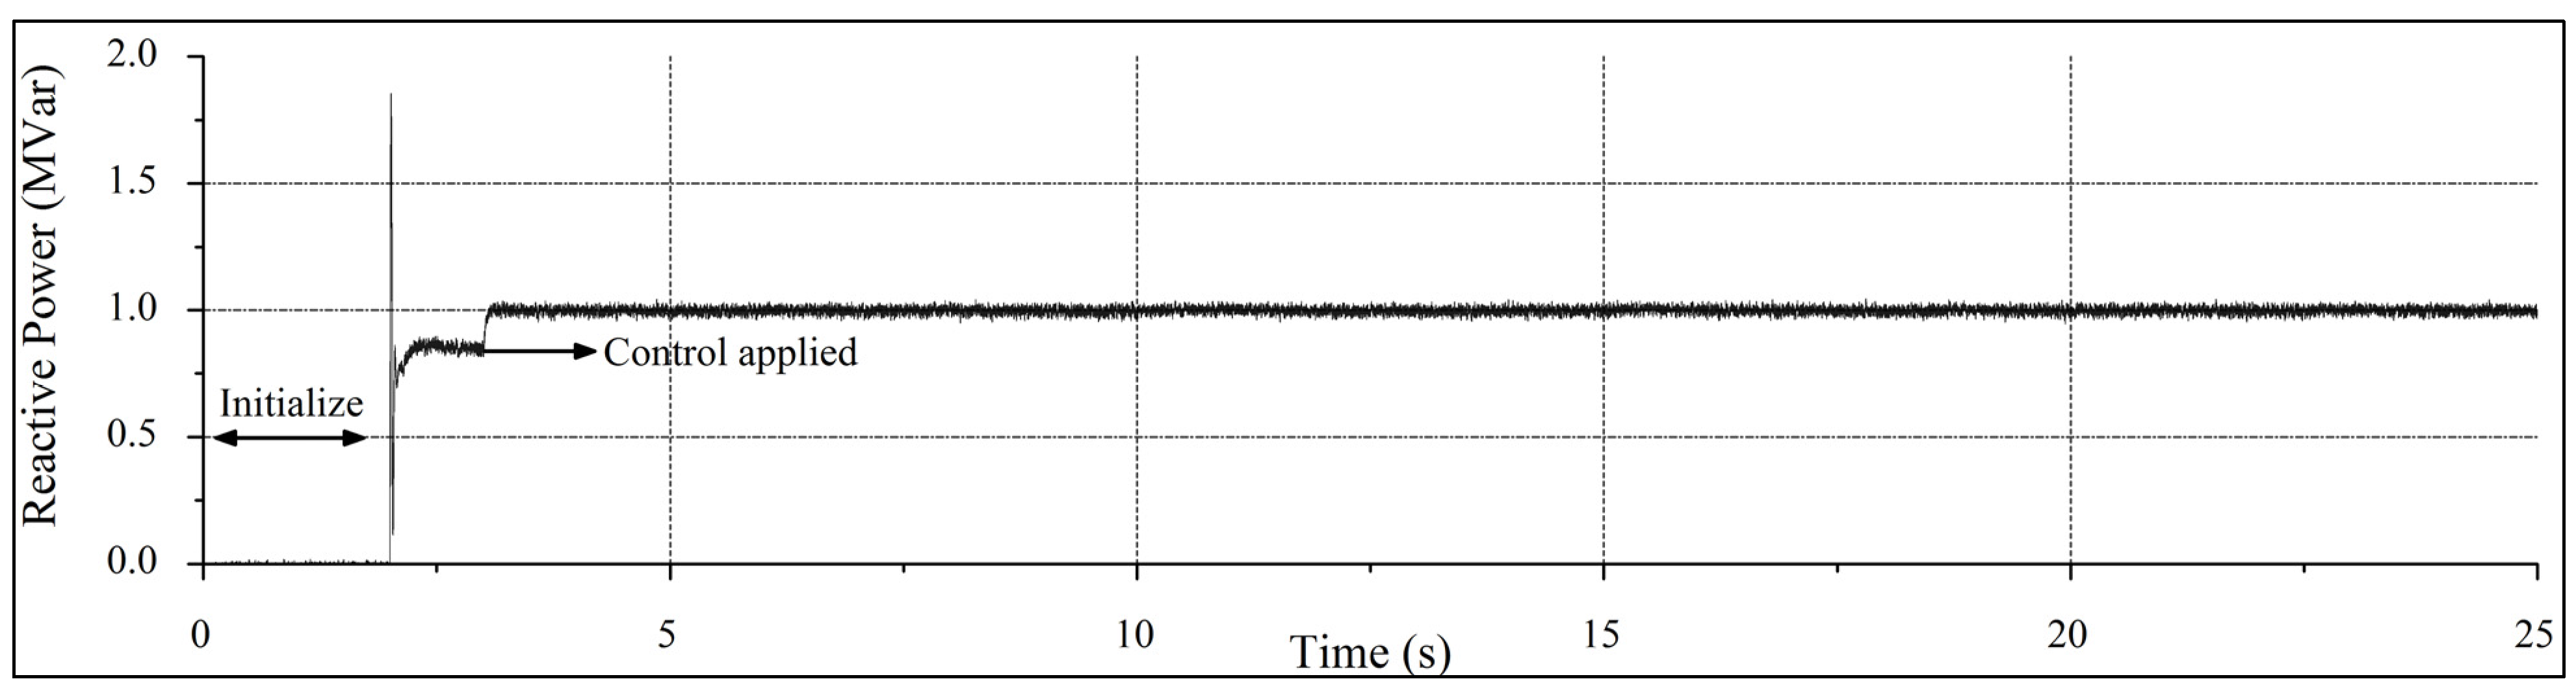
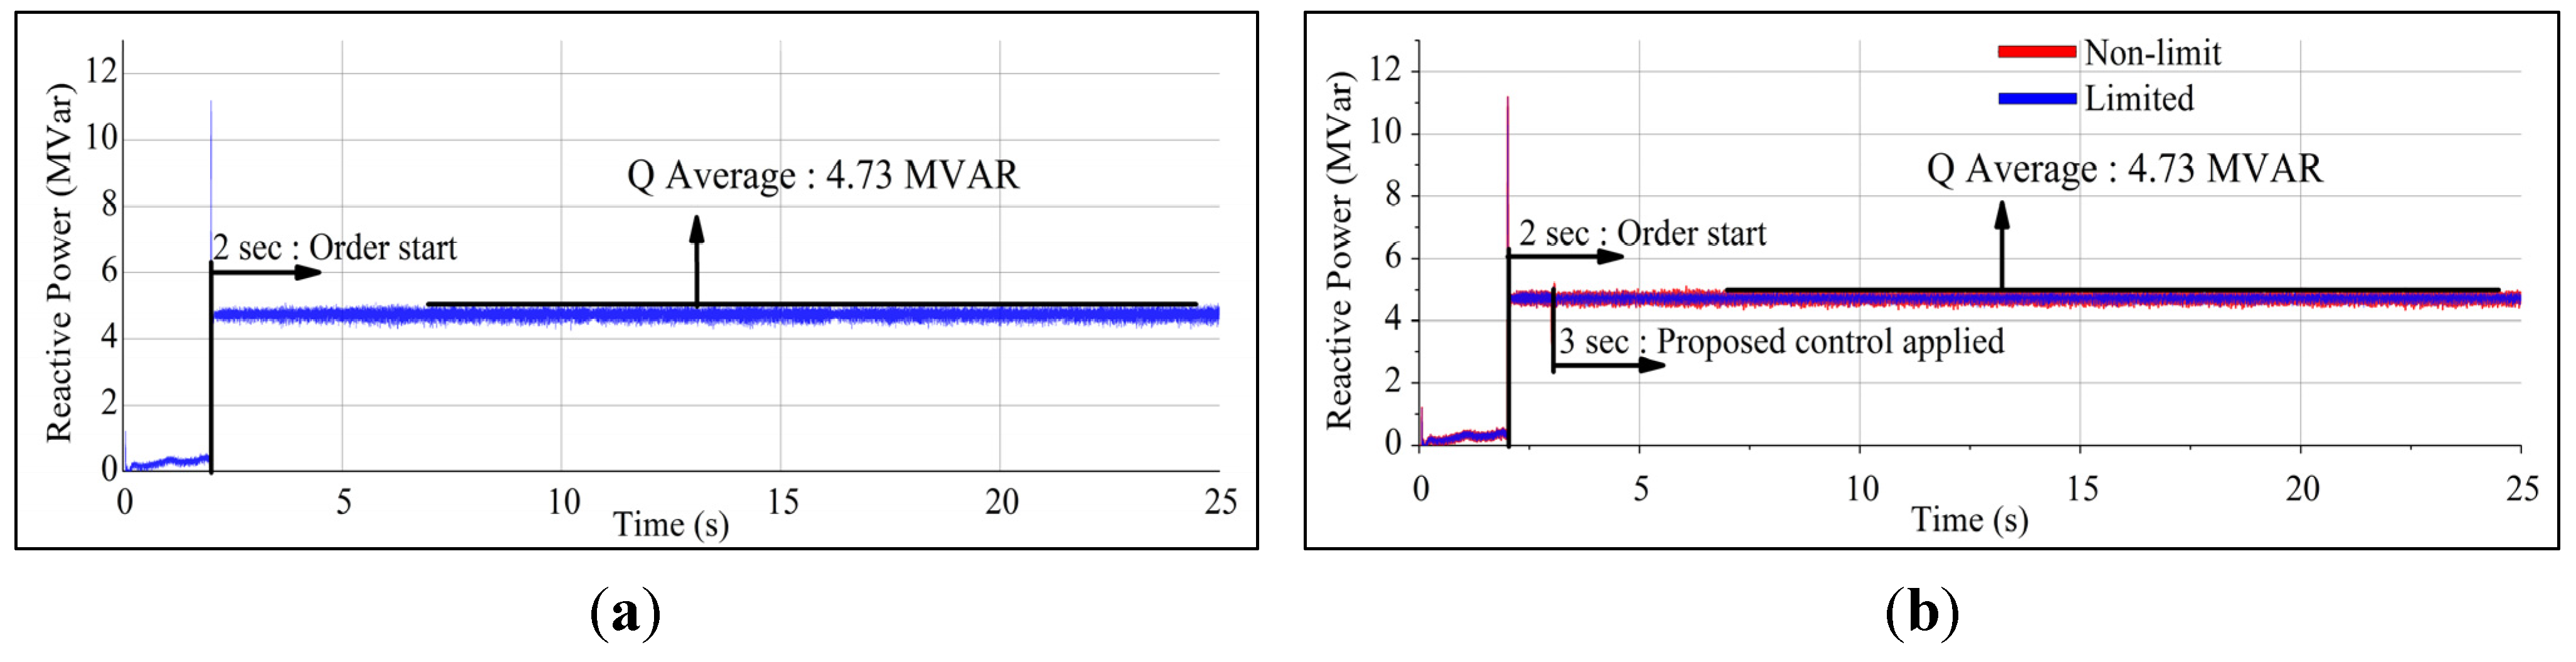
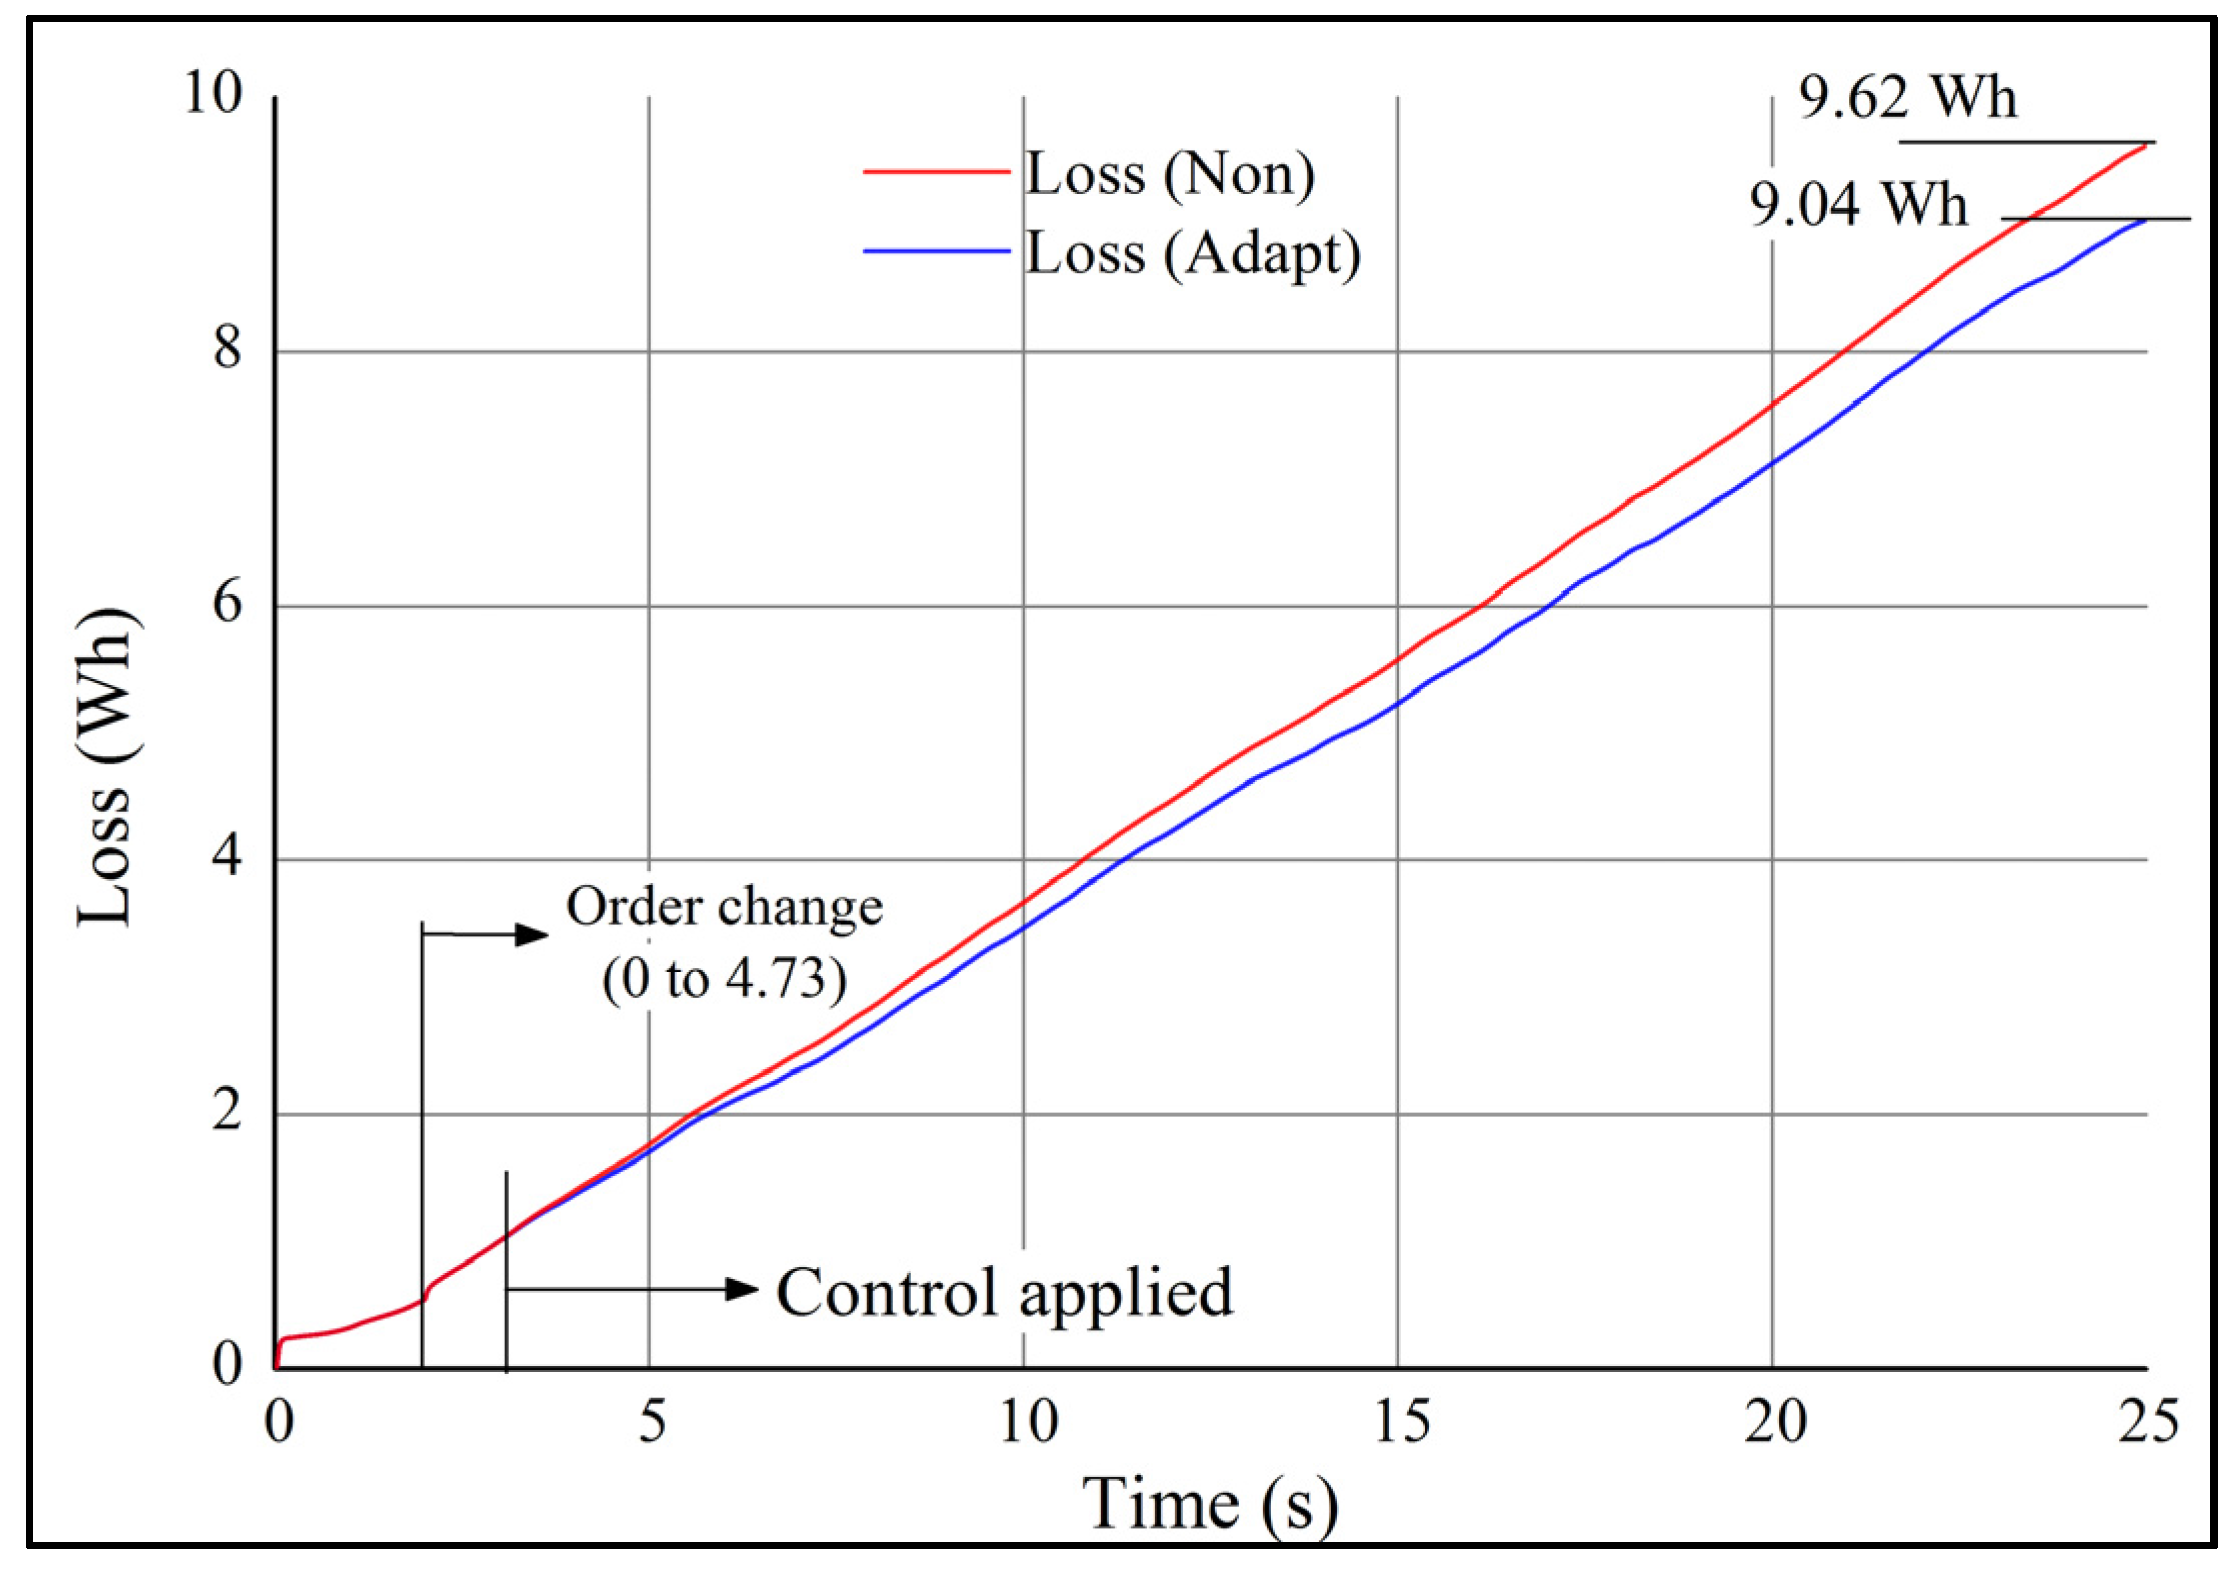
| Case | Initialize section (s) | Normal control (s) | Proposed control (s) | Q order (MVar) |
|---|---|---|---|---|
| Non-adapted | 0–2 | 2–25 | - | 4.73 |
| Adapted | 0–2 | 2–3 | 3–25 | 4.73 |


| Case | Average power loss | Energy loss (25 s) | Absorbed Q at PCC |
|---|---|---|---|
| Non-adapted | 1.411 kW | 9.62 Wh | 4.73 MVar |
| Adapted | 1.316 kW | 9.04 Wh | 4.73 MVar |
| Improvement | 6.7% | 6.02% | - |
5. Conclusions
Acknowledgments
Conflicts of Interest
References
- Morales, A.; Robe, X.; Sala, M.; Prats, P.; Aguerri, C.; Torres, E. Advanced grid requirements for the integration of wind farms into the Spanish transmission system. IET Renew. Power Gener. 2008, 2, 47–57. [Google Scholar] [CrossRef]
- Muyeen, S.M.; Takahashi, R.; Murata, T.; Tamura, J. A Variable speed wind turbine control strategy to meet wind farm grid code requirements. IEEE Trans. Power Syst. 2010, 25, 331–340. [Google Scholar] [CrossRef]
- Yun-Hyuk, C.; Sang-Gyun, K.; Byongjun, L. Coordinated Voltage-Reactive Power Control Schemes Based on PMU Measurement at Automated Substations. J. Electr. Eng. Technol. 2015, 10, 1400–1407. [Google Scholar]
- Hartmann, B.; Dan, A. Cooperation of a grid-connected wind farm and an energy storage unit—Demonstration of a simulation tool. IEEE Trans. Sustain. Energy 2012, 3, 49–56. [Google Scholar] [CrossRef]
- Dicorato, M.; Forte, G.; Trovato, M. Voltage compensation for wind integration in power systems. In Proceedings of the 2012 3rd IEEE International Symposium on Power Electronics for Distributed Generation Systems (PEDG), Aalborg, Danmark, 25–28 June 2012; pp. 464–469.
- Seungmin, J.; Hyun-Wook, K.; Gilsoo, J. Adaptive power control method considering reactive power reserve for wave-offshore hybrid power generator system. Energy Procedia 2014, 61, 1703–1706. [Google Scholar]
- Pérez-Collazo, C.; Greaves, D.; Iglesias, G. A review of combined wave and offshore wind energy. Renew. Sustain. Energy Rev. 2015, 42, 141–153. [Google Scholar] [CrossRef]
- Majumder, R. Aspect of voltage stability and reactive power support in active distribution. Gener. Transm. Distrib. IET 2014, 8, 442–450. [Google Scholar] [CrossRef]
- Zhao, C.; Guo, C. Complete-independent control strategy of active and reactive power for VSC based HVDC system. In Proceedings of the IEEE Power & Energy Society General Meeting, Calgary, AB, Canada, 26–30 July 2009; pp. 1–6.
- Senturk, O.S.; Helle, L.; Rodriguez, P.; Teodorescu, R. Power capability investigation based on electrothermal models of press-pack IGBT three-level NPC and ANPC VSCs for multimegawatt wind turbines. IEEE Trans. Power Electron. 2012, 27, 3195–3206. [Google Scholar] [CrossRef]
- Tian, J.; Su, C.; Soltani, M.; Chen, Z. Active power dispatch method for a wind farm central controller considering wake effect. In Proceedings of the IEEE Conference on Industrial Electronics Society, Dallas, TX, USA, 29 October–1 November 2014; pp. 5450–5456.
- Rosyadi, M.; Muyeen, S.M.; Takahashi, R.; Tamura, J. Voltage stability control of wind farm using PMSG based variable speed wind turbine. In Proceedings of the 2012 International Conference on Electrical Machines (ICEM), Marseille, France, 2–5 September 2012; pp. 2192–2197.
- Beerens, J. Offshore hybrid wind-wave energy converter system. Master’s Thesis, Delft University of Technology, Delft, The Netherlands, 26 February 2010. [Google Scholar]
- Chunhua, L.; Chau, K.T.; Lee, C.H.; Fei, L. An efficient offshore wind-wave hybrid generation system using direct-drive multitoothed rotating and linear machines. In Proceedings of the 2014 17th International Conference on Electrical Machines and Systems (ICEMS), Hangzhou, Zhejiang, China, 22–25 October 2014; pp. 273–279.
- Rekola, J.; Tuusa, H. Comparison of line and load converter topologies in a bipolar LVDC distribution. In Proceedings of the 2011 14th European Conference on Power Electronics and Applications, Birmingham, UK, 30 August–1 September 2011; pp. 1–10.
- Ullah, N.R.; Bhattacharya, K.; Thiringer, T. Wind farms as reactive power ancillary service providers—Technical and economic issues. IEEE Trans. Energy Convers. 2009, 24, 661–672. [Google Scholar] [CrossRef]
- Barthelmie, R.J.; Hansen, K.S.; Pryor, S.C. Meteorological controls on wind turbine wakes. IEEE Proc. 2013, 101, 1010–1019. [Google Scholar] [CrossRef]
- Hyeon-Jae, S.; Jang-Young, C.; Yu-Seop, P.; Min-Mo, K.; Seok-Myeong, J.; Hyungsuk, H. Electromagnetic vibration analysis and measurements of double-sided axial-flux permanent magnet generator with slotless stator. IEEE Trans. Magn. 2014, 50, 1–4. [Google Scholar]
- Bunjongjit, K.; Kumsuwan, Y.; Sriuthaisiriwong, Y. An implementation of three-level BTB NPC voltage source converter based-PMSG wind energy conversion system. In Proceedings of the TENCON 2014-2014 IEEE Region 10 Conference, Bangkok, Thailand, 22–25 October 2014; pp. 1–5.
© 2015 by the authors; licensee MDPI, Basel, Switzerland. This article is an open access article distributed under the terms and conditions of the Creative Commons Attribution license (http://creativecommons.org/licenses/by/4.0/).
Share and Cite
Jung, S.; Jang, G. Development of an Optimal Power Control Scheme for Wave-Offshore Hybrid Generation Systems. Energies 2015, 8, 9009-9028. https://doi.org/10.3390/en8099009
Jung S, Jang G. Development of an Optimal Power Control Scheme for Wave-Offshore Hybrid Generation Systems. Energies. 2015; 8(9):9009-9028. https://doi.org/10.3390/en8099009
Chicago/Turabian StyleJung, Seungmin, and Gilsoo Jang. 2015. "Development of an Optimal Power Control Scheme for Wave-Offshore Hybrid Generation Systems" Energies 8, no. 9: 9009-9028. https://doi.org/10.3390/en8099009