Article

Blade Fault Diagnosis in Small Wind Power Systems Using MPPT with Optimized Control Parameters

Department of Electrical Engineering, National Chin-Yi University of Technology, Taichung 41170, Taiwan
*
Author to whom correspondence should be addressed.
Energies 2015, 8(9), 9191-9210; https://doi.org/10.3390/en8099191
Submission received: 4 July 2015 / Revised: 18 August 2015 / Accepted: 19 August 2015 / Published: 27 August 2015
(This article belongs to the Special Issue Wind Turbine 2015)

Abstract

:
A systematic experiment verification of Chaos Embedded Sliding Mode Extremum Seeking Control for maximum power point tracking and a method for detecting possible faults in small wind turbine systems in advance are proposed in this paper. The chaotic logistic map is used to replace the random function in the particle swarm optimization algorithm for faster searching the optimal control parameter U 0 . From the experimental results, it is verified that the Chaos Embedded Sliding Mode Extremum Seeking Control scheme has a better dynamic response than traditional Extremum Seeking Control scheme and Hill-Climbing Search scheme for maximum power point tracking. In the proposed scheme for fault detection, a chaotic synchronization method is used to transform the maximum power point tracking signal into a chaos synchronization error distribution diagram. It is then taken as the characteristic for fault diagnosis purposes. Finally, an extension theory pattern recognition technique is applied to diagnose the fault. Notably, the use of the chaotic dynamic errors as the fault diagnosis characteristic reduces the number of extracted features required, and therefore greatly reduces both the computation time and the hardware implementation cost. From the experimental results, it is shown that the fault diagnosis rate of the proposed method exceeds 98% not only in non-real-time but also in real-time of faults detection of the blades.

1. Introduction

It is clear from the literature [1,2,3,4,5,6,7] that there are already quite a few algorithms that can be used to increase the maximum power point tracking efficiency of a wind turbine. These include Perturbation and Observation (P&O) [1,2,3], the Hill-Climbing Search Algorithm (HCS) [4,5], Tip Speed Ratio Control (TSR) [6,7] and others. In addition, some investigators have made use of the Optimal Reference Power Curve of stability analysis to do maximum power point tracking (MPPT). This allows a maximum power point tracking algorithm, which uses small signal analysis on a non-linear turbine rotor system, to be achieved [8]. However, most maximum power point tracking control systems rely on measurements of wind or rotor speed and so the design must include a wind speed sensor or tachometer with the additional cost and complexity [9]. In addition, a lot of research has been done on the system architecture of wind power generators driven directly from a DC motor. This allows situational height and wind speed to be easily simulated by variation of motor speed. This approach has been mainly used for use with high power generation systems [10]. In this study, we are concerned mainly with small domestic wind power generation systems, and our results have been verified by the use of a real system. Maximum power point tracking has been done according to the Chaos Embedded (CE) Sliding Mode extremum seeking (SMESC) method advanced by Yau et al. in 2013 [11], after which signal fault diagnosis is carried out.
There are many approaches to wind turbine fault diagnosis and analysis. For fault diagnosis of transmission, or the generator itself, an artificial neural Network [12], Wavelet Analysis [13], Fuzzy Theory [14], and some other diagnostic methods have been proposed. All diagnosis is based on fault conditions of the wind turbine rotor, the stator line response, etc. These fault features are manifested whether the fault is reflected in current or voltage. Wind turbine blade failure diagnosis [15] clearly shows that blade failure itself affects both rotation acceleration and vibration frequency. The characterization of blade failure can be carried out more easily when the blades are rotating and many non-linear and time-varying operational states need to be taken into account. Several different rotational vibration frequencies are transmitted to the sensor when a blade fails. Using Fractal Theory [16,17], the Length Fractal Dimension [18], the Correlation Dimension [19], the Box Dimension [20] the Frequency Shifting Distance Method [21] and other eigenvalues, the frequency signal can become an obvious and characteristic diagnostic feature. Simple observation will show if a feature is abnormal or not, the nature of the fault can then be determined, and the steps needed for maintenance and repair can be easily decided. Otherwise, the control system concept with fault detection and isolation (FDI) and fault-tolerant control (FTC) schemes have been already successfully applied to the fault detection of wind turbines [22,23,24,25,26,27,28,29,30,31,32]. It can be shown the more advantages of this kind schemes, especially in large wind power systems.
The actual measurements part of this study relies on simulation [33] and use is made of both a traditional and improved parameter maximum power point tracking algorithm optimized for simulation comparison and analysis. Real machine tests were made on a wind turbine of small output power and both simulated and real testing was done to validate the results which displayed excellent dynamic response and systematic integration of blade failure diagnosis was achieved. The software used in this study for both the controller and the troubleshooting system was dSPACE DS1104. The program was used to capture the voltage generated by the improved maximum power point tracking algorithm and to ensure fast and accurate diagnostic capability as well as an assessment of the state of the power generating system.
The rest of this study is organized as follows. In Section 2, the system circuit architecture and controller design is described; the system status signal analysis and fault diagnosis architecture are presented in Section 3. The maximum power point tracking simulation analysis and experimental results are shown Section 4. The results of wind turbine blade failure diagnosis experiments are demonstrated in Section 5. Conclusions are drawn in Section 6.

2. System Circuit Architecture and Controller Design

2.1. System Architecture

The wind turbine used in this study was an American Southwest Wind power AIR X series unit as shown in Figure 1. The output voltage is 48 VDC; rated power 160 W; rated wind speed 12.5 m/s; and start wind speed 3.58 m/s. The interior generator is a permanent magnet synchronous device. A King Fan Involute industrial fan unit was used to drive the wind turbine. The speed and strength of the wind could be adjusted by changing the speed and distance of the fan from the wind turbine blades.
Figure 1. The AIR X wind generator.
Energies 08 09191 g001
The wind power generation system setup is shown in Figure 2. The blade assembly is coupled directly to a permanent magnet synchronous generator. The AC output of the generator is converted into direct current by a rectifier circuit. The dSPACE DS1104 is the maximum power point tracking controller that captures the two signals, DC voltage and current. This is paired with a MATLAB R2010a Simulink Real-Time Interface, the RTI library and the related experimental machine interface. The DC is delivered to a DC-DC Boost Converter and a maximum power point tracking algorithm controls the booster duty cycle and switching Pulse Width Modulation (PWM). The boost converter is connected to the load that is a measure of system output power. The dSPACE controller acquires system voltage generated by the SMESC algorithm for fault diagnosis. The state of the power generation system is displayed on the PC screen which also provides information that can be used for signal analysis and diagnosis. The SMESC proposed in this paper is derived from this control (please refer to [33] for detailed ESC). The system’s reliability and robustness with uncertainty and disturbances under investigation are more details in [33].
Figure 2. The wind power generation system schematic.
Energies 08 09191 g002

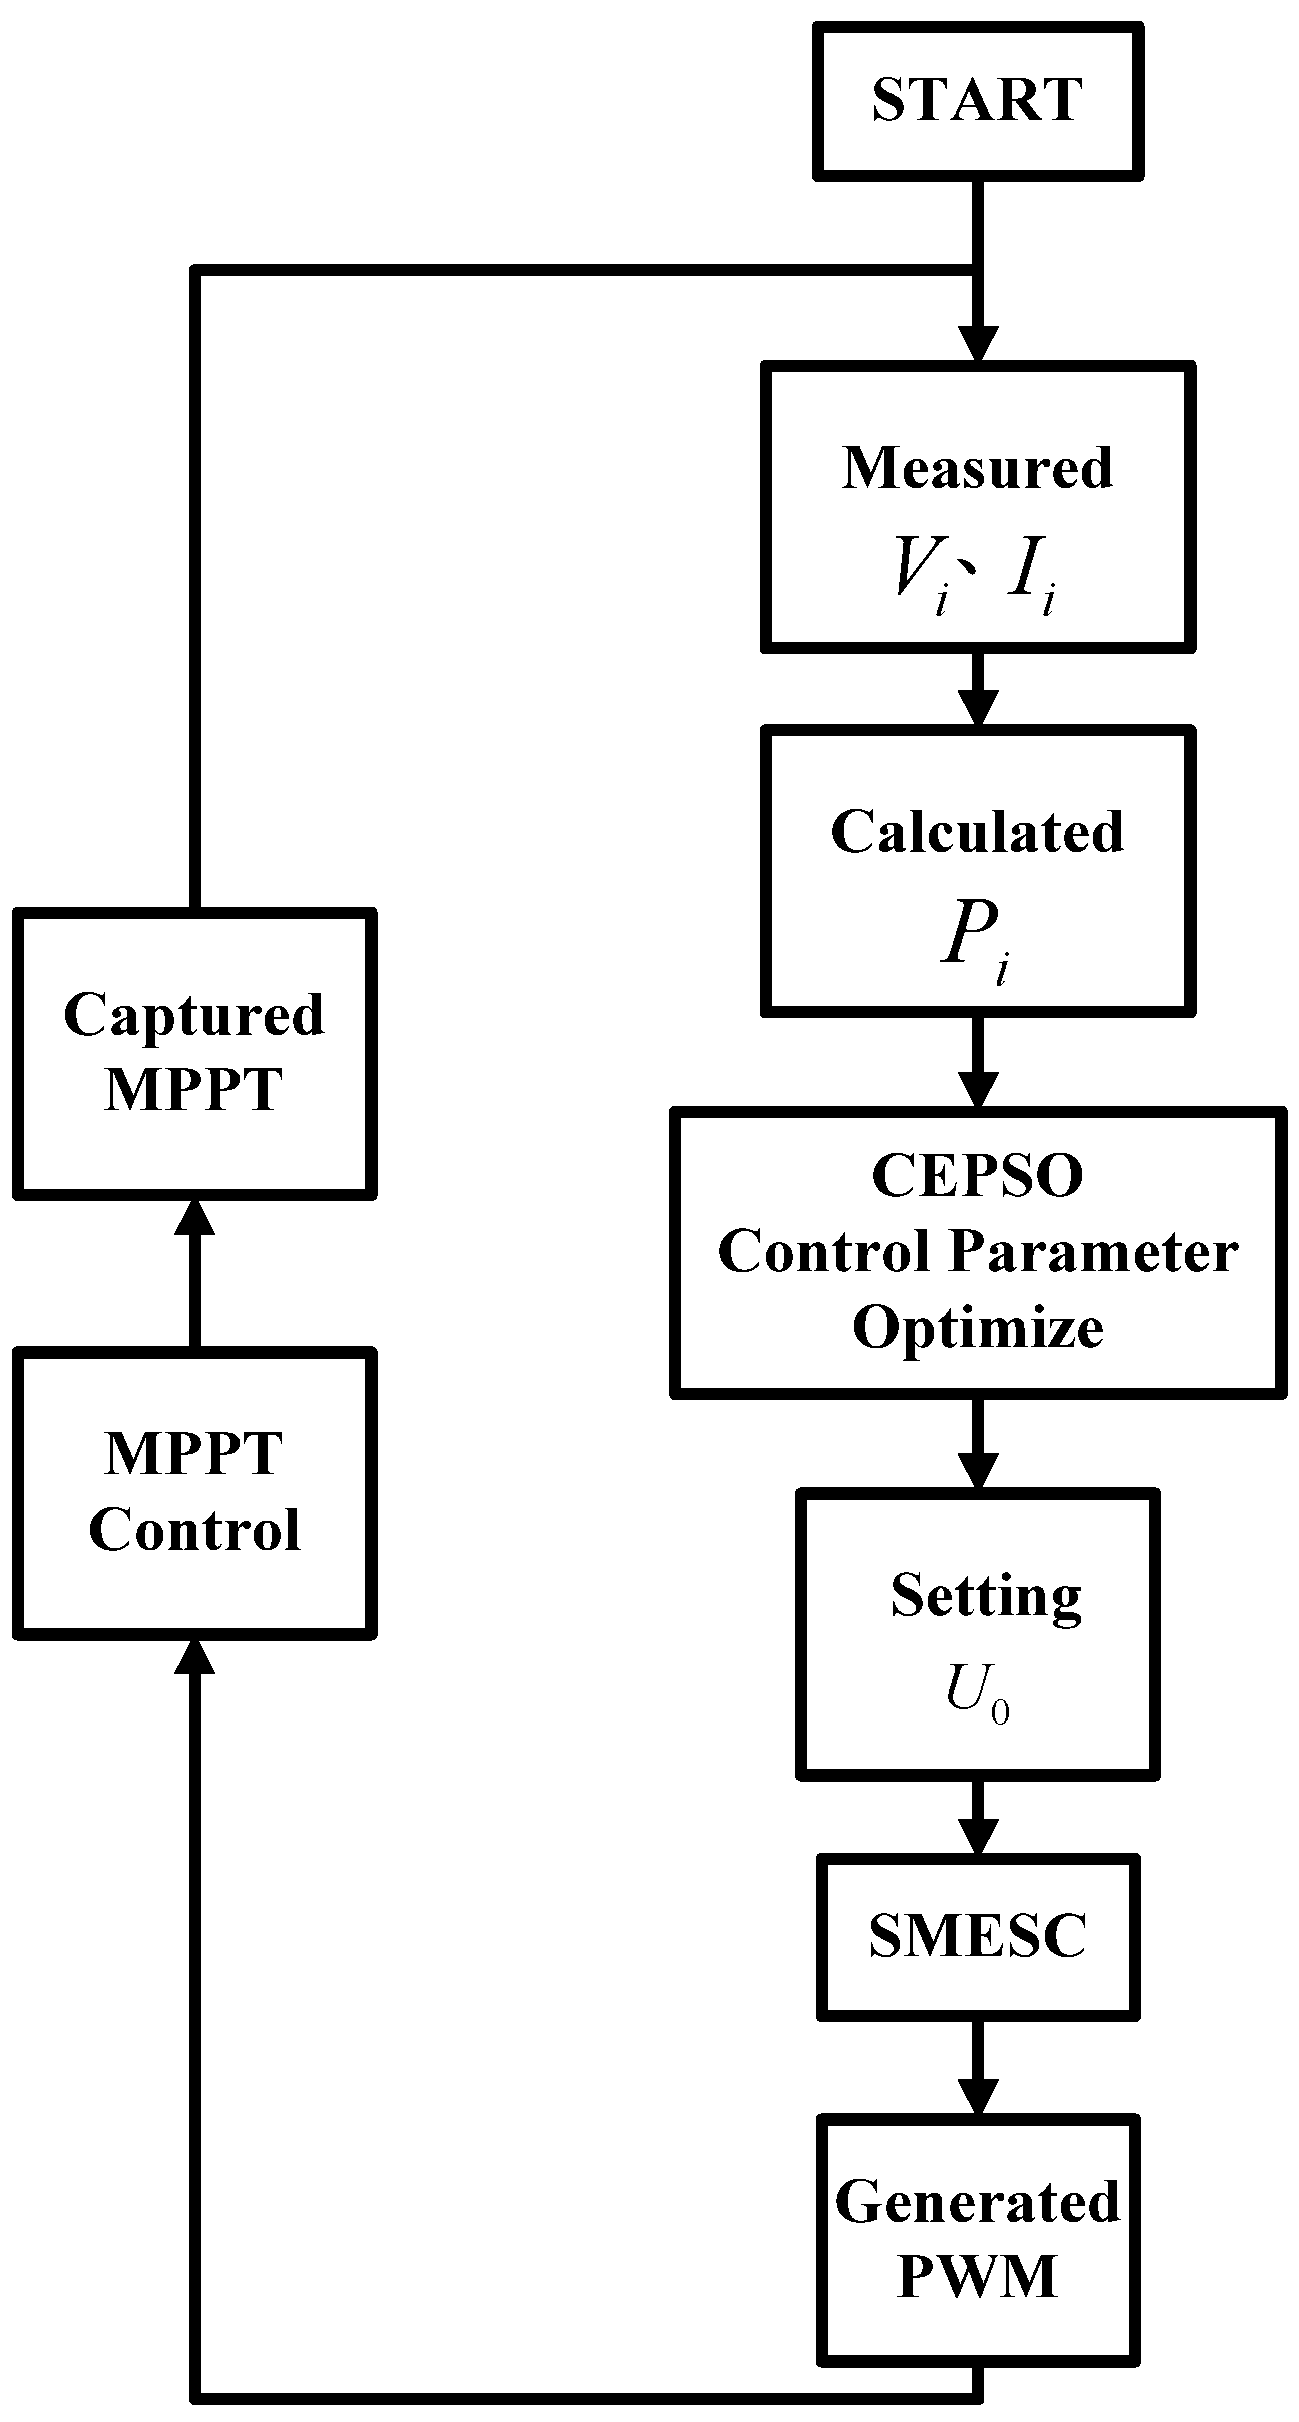
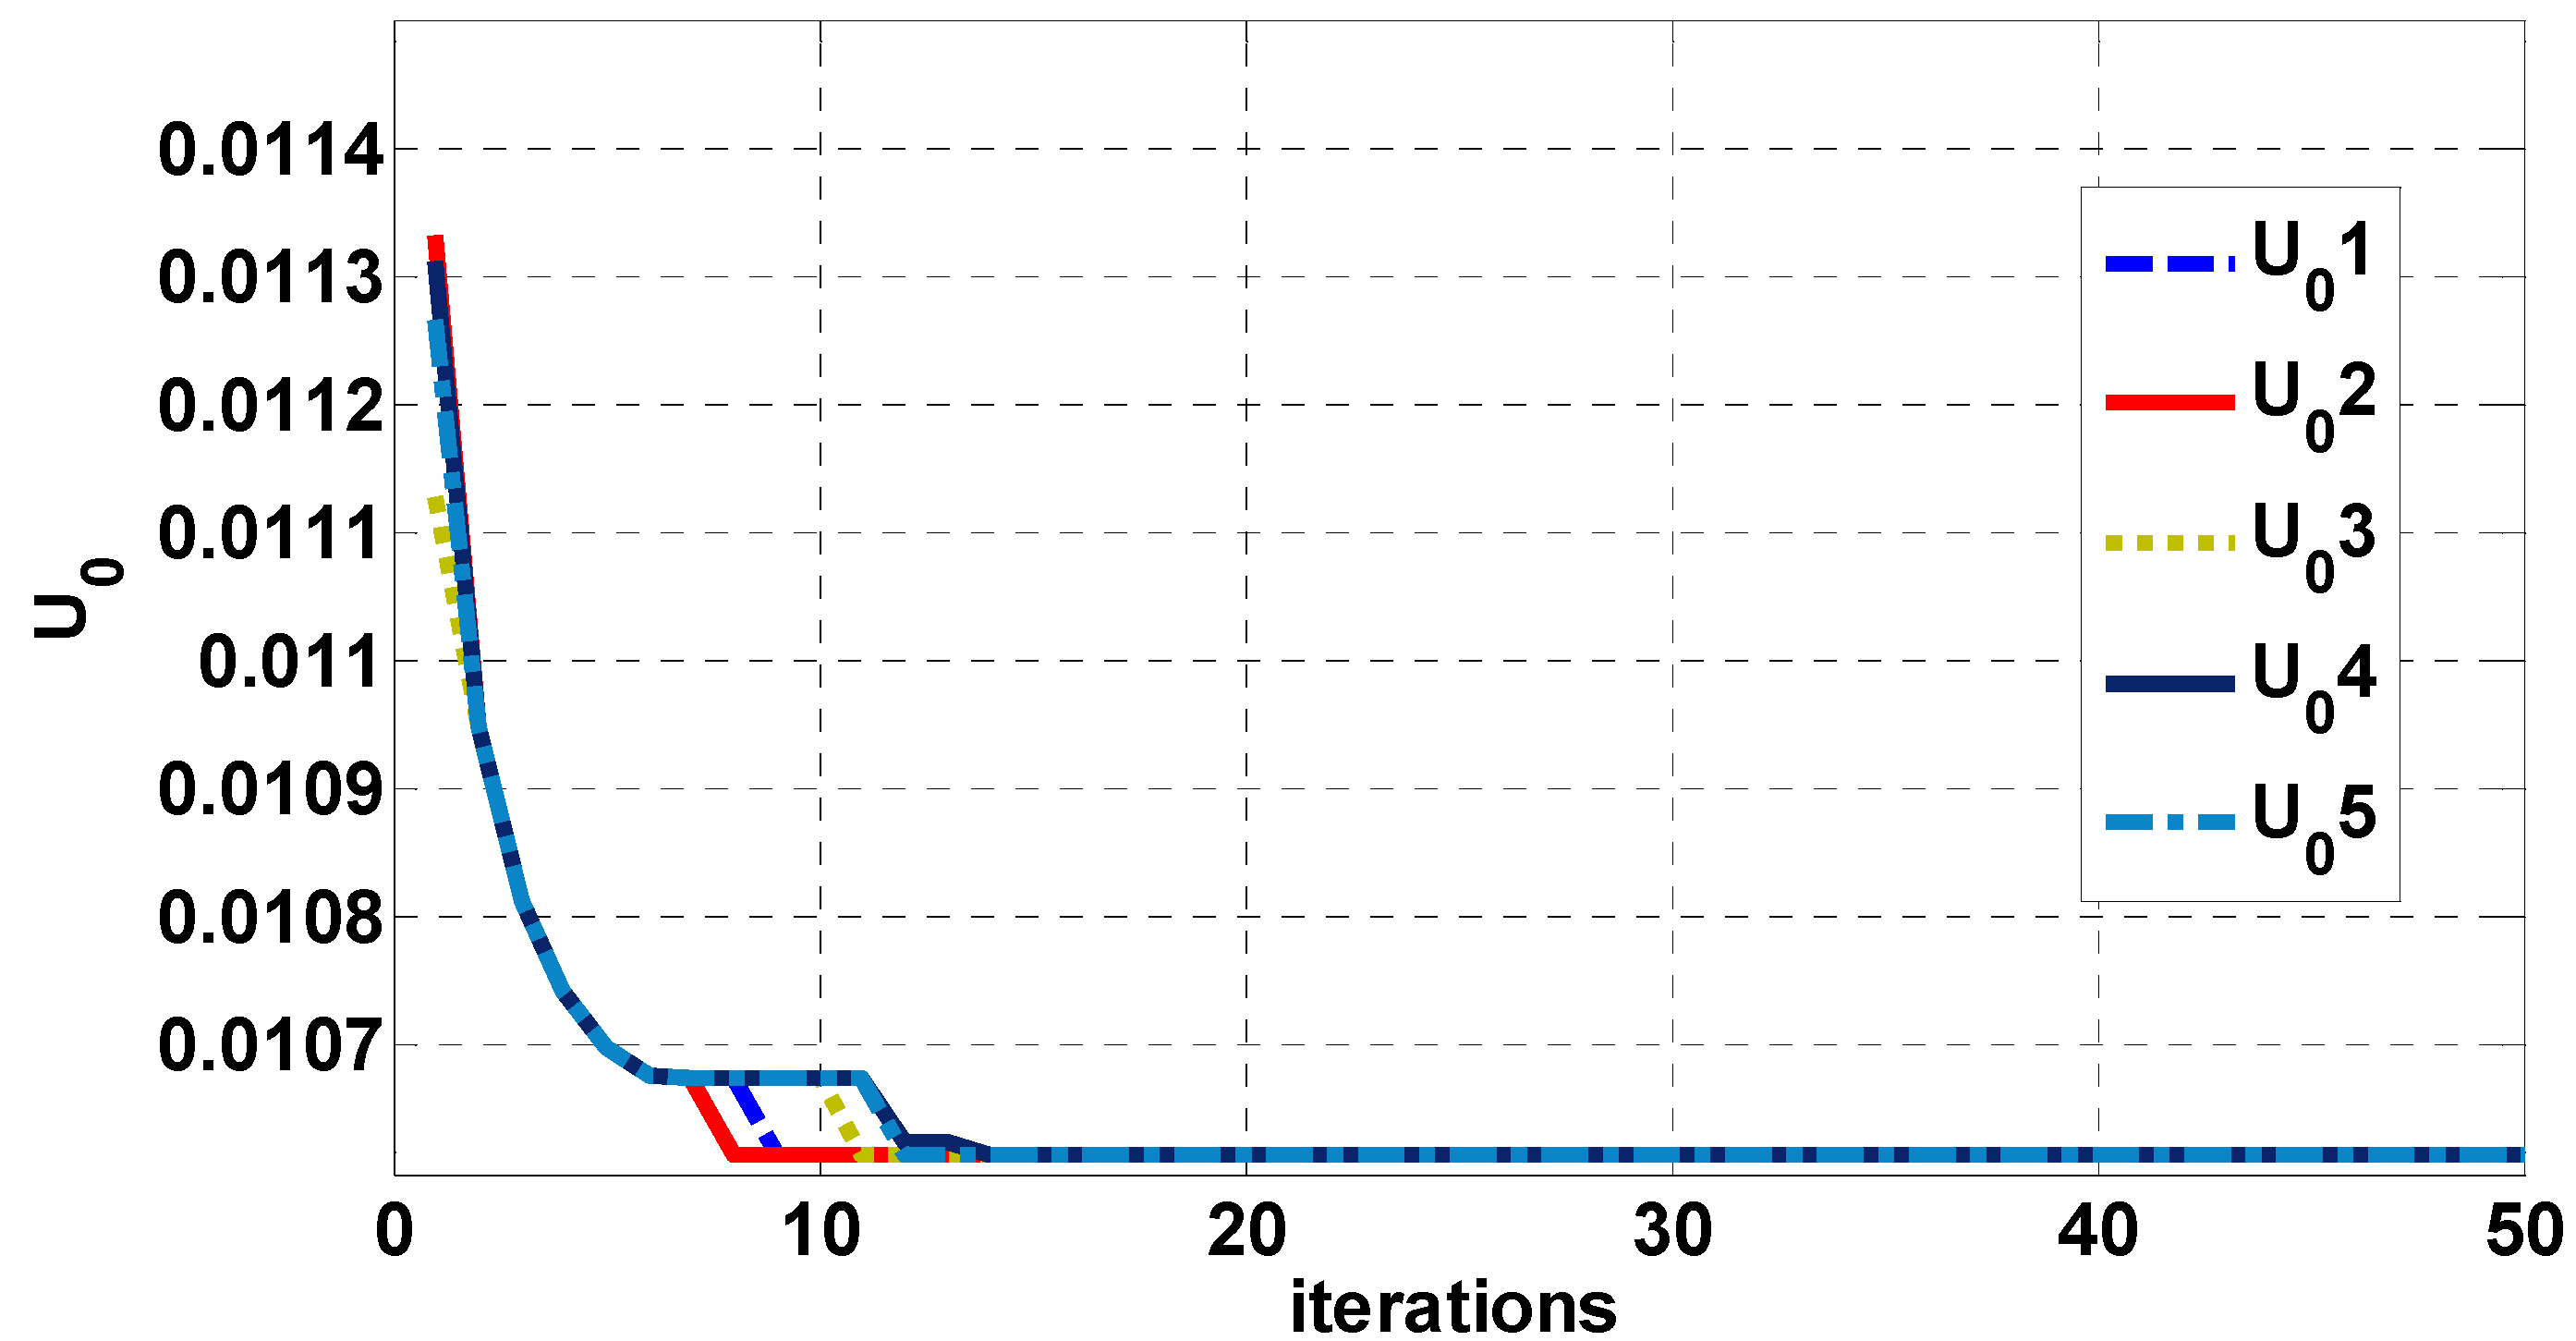
2.2. Control Parameter Optimization and Maximum Power Point Tracking Method

A control parameter optimization method was used in the maximum power point tracking algorithm to provide more effective control. This circumvented the need for direct control parameters to be determined empirically which requires a large number of repetitive software operations. In this way the convergence time of parameter optimization could be reduced using a Chaos Embedded process. Repeated Random number generation which affects the convergence speed during program execution could also be excluded. The overall dynamic response has many advantages over the more traditional algorithms.
The most commonly used algorithm generally employs an empirical constant to control parameter U 0 . However, in this study a Chaos Embedded particle swarm optimization algorithm using mathematical iteration and improved by Logistic Maps, was used to determine the optimal control parameters U 0 (SMESC) and to define the objective function. Use was also made of a PSO algorithm to find the best control parameter to both minimize the objective function and reduce the number of mathematical iterations [33,34]. MATLAB R2010a was used to write the convergence curves of the system. The U 0 obtained was about 0.01 and the IAE optimum value was about 150, as shown in the convergence curves in Figure 3 and Figure 4. Each calculation was carried out five times.
Figure 3. U 0 convergence curve using CEPSO.
Energies 08 09191 g003
Figure 4. IAE convergence curve using CEPSO.
Energies 08 09191 g004

3. The System Status Signal Analysis and Fault Diagnosis Architecture

The chaos theory is a non-linear system theory. This motion trajectory gives rise to a significant change in the end result when there is only a slight variation at the input end. Therefore, the chaos theory is suitable for analyzing the signals of a small change in systems. In this study, a master-slave chaotic system is used to compare normal-state signals and fault signals and generate dynamic errors. The dynamic errors are then used to create the matter-element model required for the extension theory. It needed only the MPPT voltage signals to be measured to diagnose the fault. It reduces the number of extracted features required, and therefore greatly reduces both the computation time and the hardware implementation cost.

3.1. Master-Slave Chaos Dynamic Error System and Extenics Engineering Diagnosis

The Lorenz Master-slave chaotic system, where use has been made of trajectory as a characteristic value to identify wind turbine blade fault conditions and type, has been employed in this study. Traditional Lorenz chaotic system can be expressed by Equation (1) and the chaos synchronization method for fault diagnosis can be found in the references [35] and will not be discussed here:
{ d x d t = α ( y x ) d y d t = β x x z y d z d t = x y γ z  

3.2. Extenics Engineering Diagnosis

Extenics Engineering Diagnosis can eliminate the need for much repetitive work and can resolve conflicts and compatibility problems. In classical mathematics, set 0, 1 is used to describe the characteristics of things. The fuzzy set is also based on (0, 1) to indicate the degree of fuzzy characteristics of things and extension of the set expands the scope of the fuzzy sets to (− , + ). A Correlation function schematic diagram is shown in Figure 5 and correlation calculation formulae are shown below, Equations (2) and (3), for details about Extenics engineering applications readers may refer to reference [36]:
K ( v ) = ρ ( v , X 0 ) D ( v , X 0 , X p )
ρ ( v , X 0 ) = | v a + b 2 | 1 2 ( b a )
D ( v , X 0 , X p ) = { ρ ( v , X p ) ρ ( v , X 0 ) , v   X 0 1 ,   v X 0
Figure 5. Extenics set correlation function schematic.
Energies 08 09191 g005

3.3. The Master-Slave Chaos Dynamic Error System Signal Integration Extenics Engineering Diagnosis Framework

In this study use has been made of Extenics Engineering Diagnosis to develop the fault state diagnosis procedure shown in the flow chart in Figure 6. The fault voltage signal is captured by the controller and input to the master-slave chaos dynamic error system which tracks the error signal between them. The motion trail of the signal acts as an Extenics Engineering Diagnosis characteristic used to determine blade faults and establish an extension element model. A fast and accurate method has been developed using Extenics engineering to determine blade faults and make a quick and easy diagnosis to allow the problem to be corrected.
Figure 6. Flowchart of the master-slave chaos dynamic error system.
Energies 08 09191 g006

4. The Maximum Power Point Tracking Simulation Analysis and Experimental Results

When the wind system with failure condition, it will affect the maximum power point tracking. This study use this feature through the changes in maximum power point to identify various faults in small wind power systems.

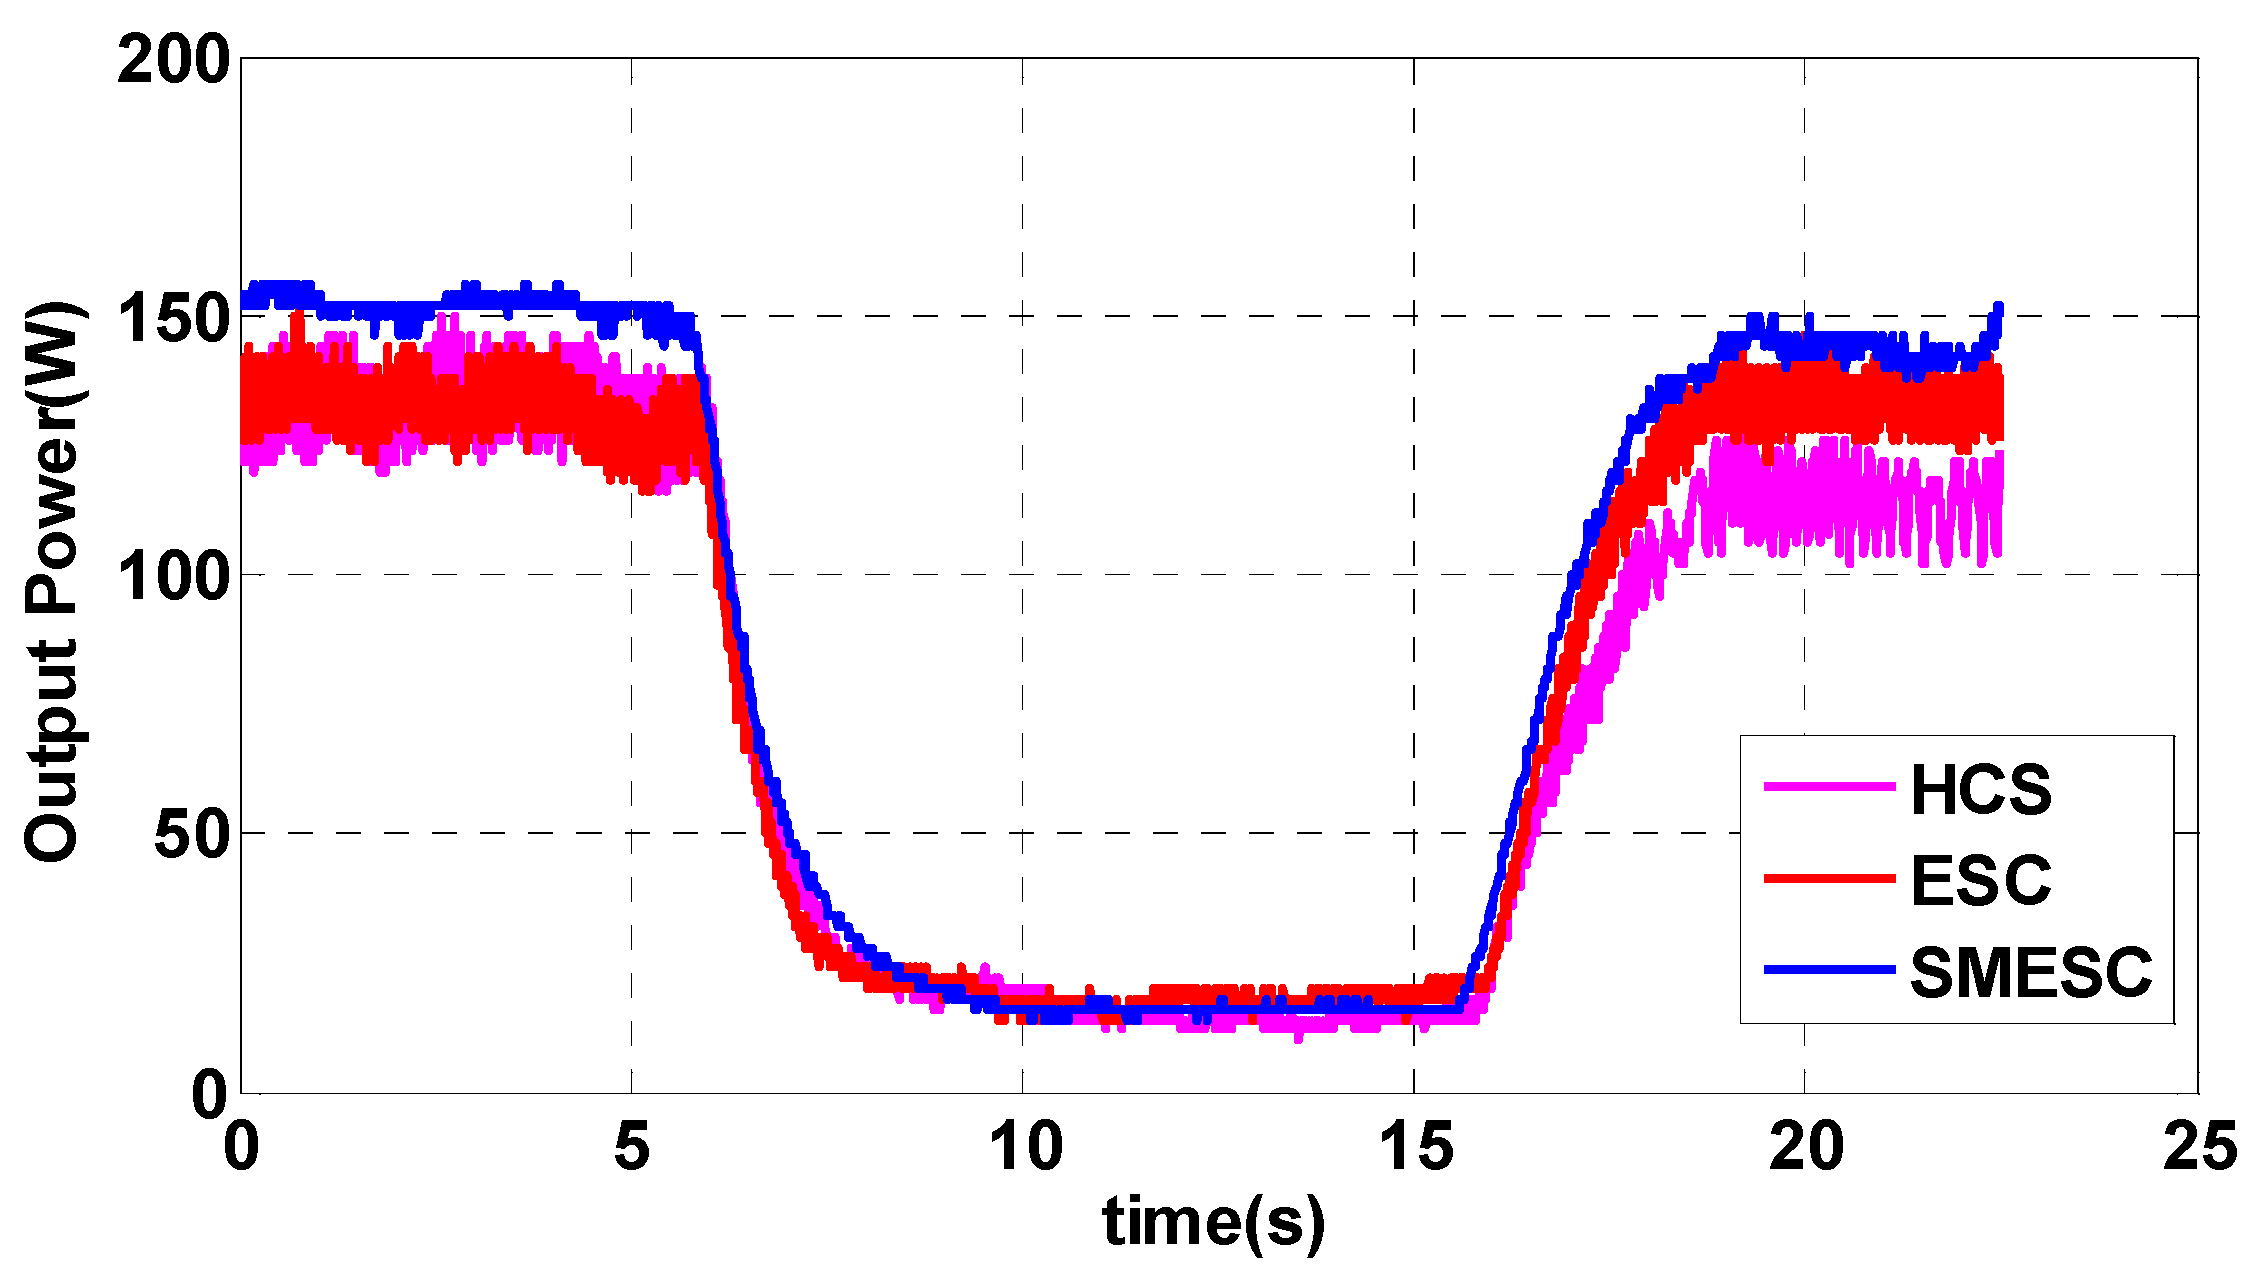
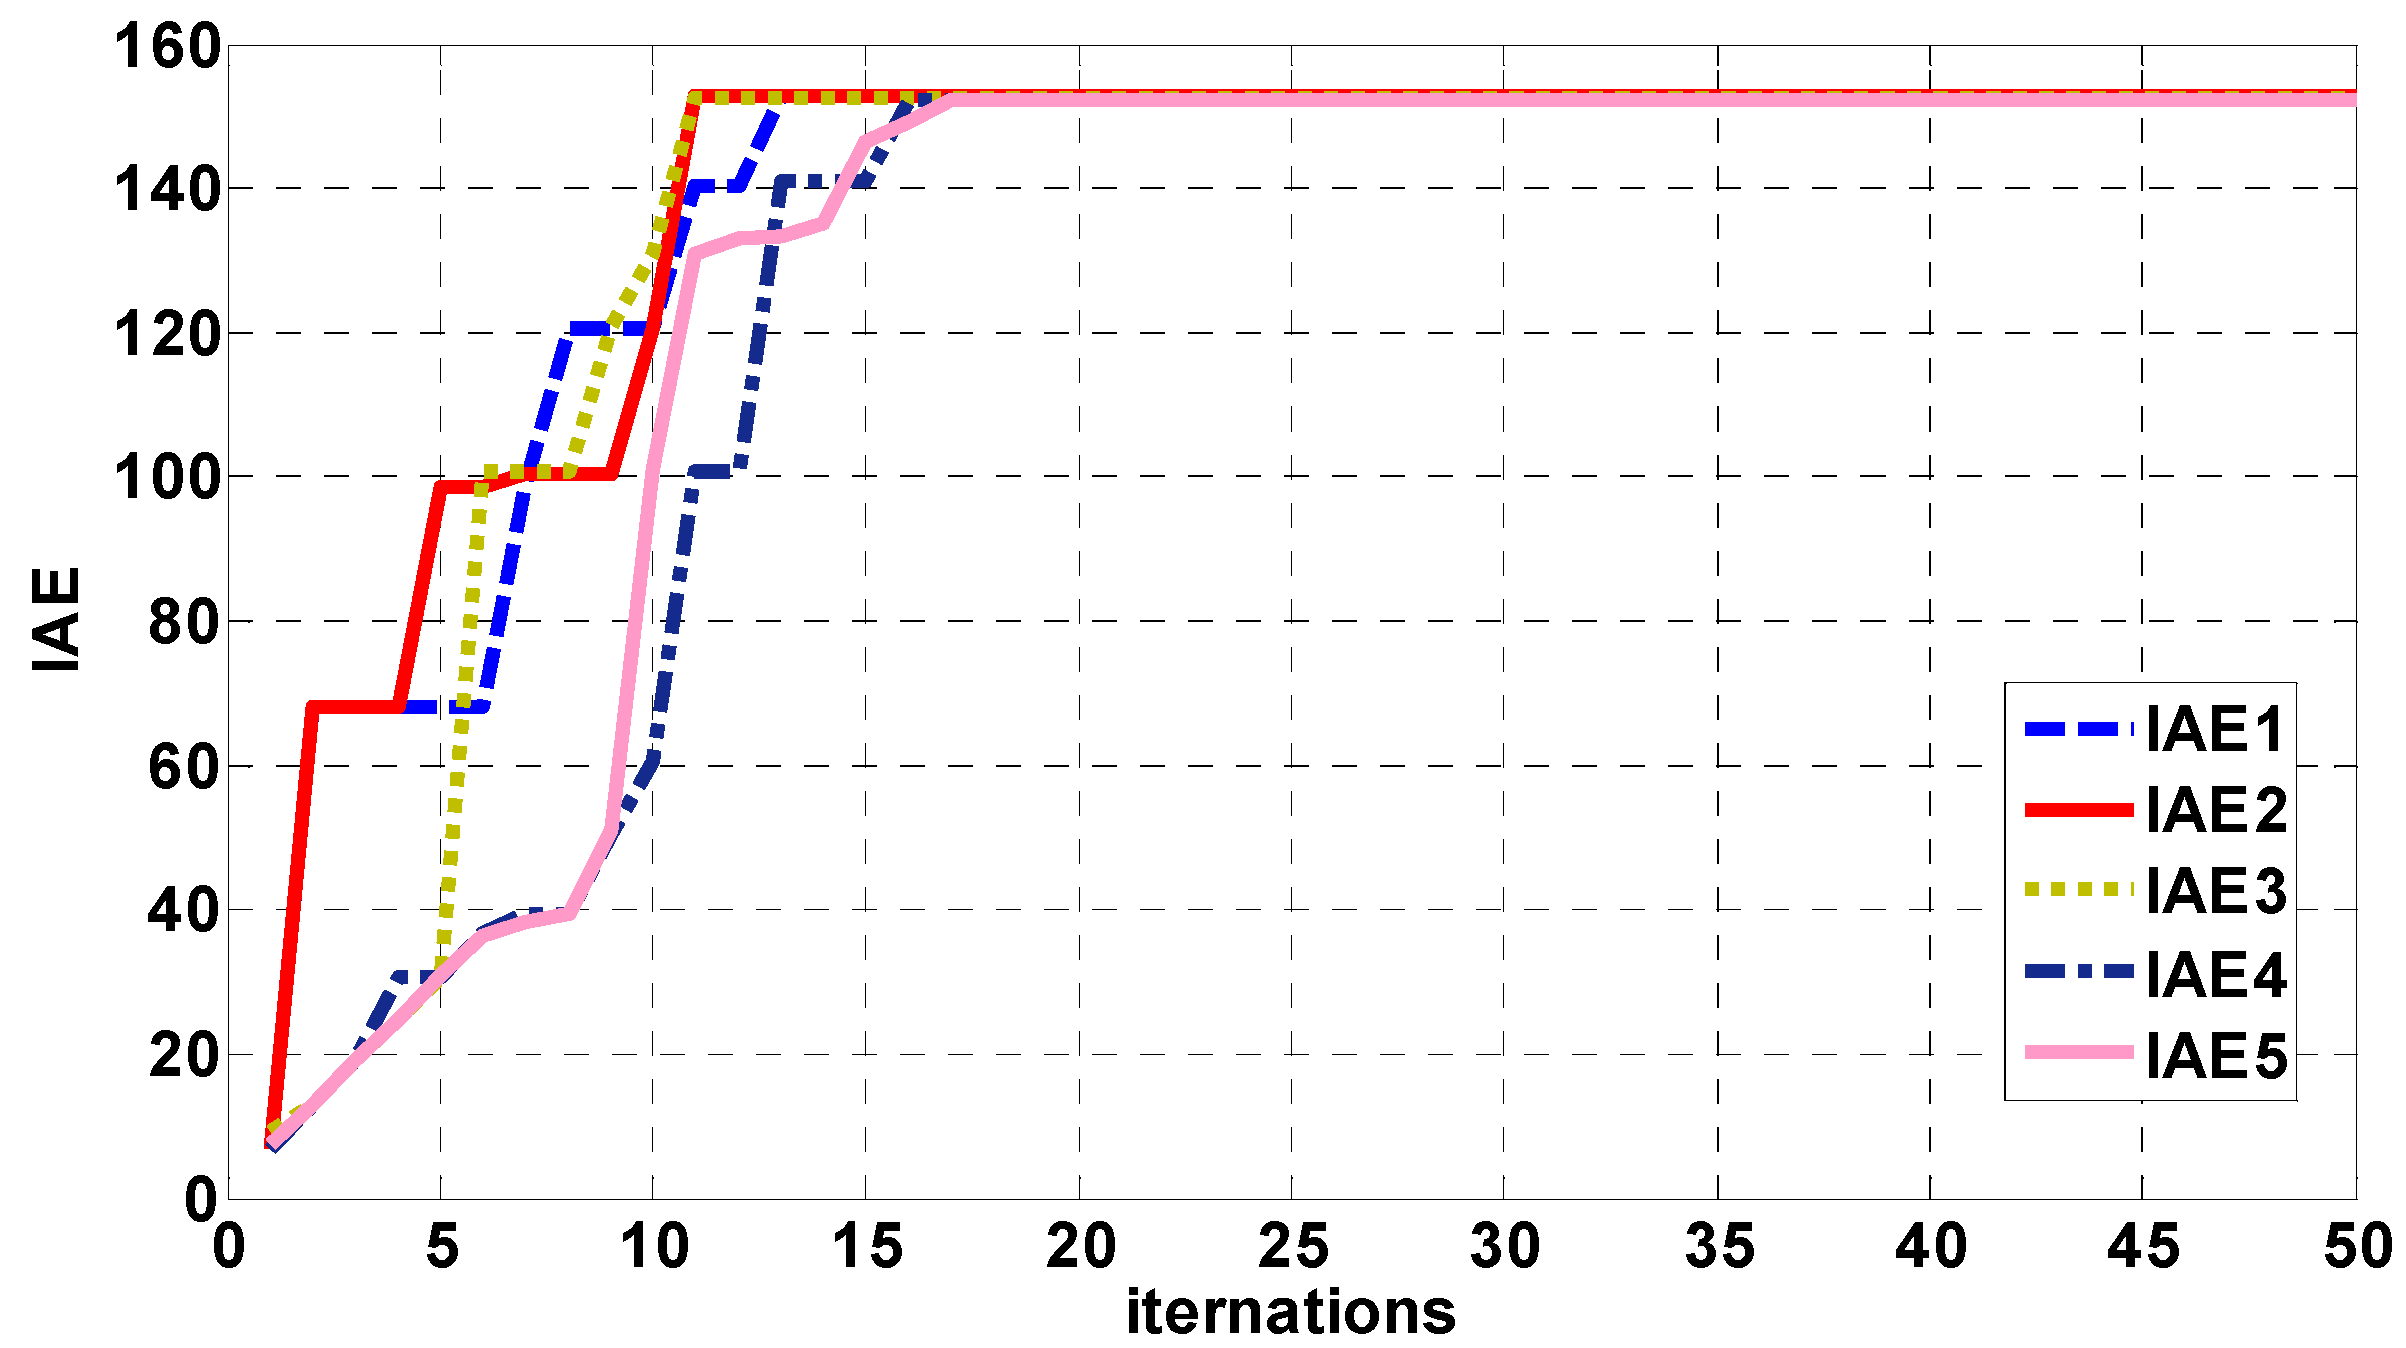
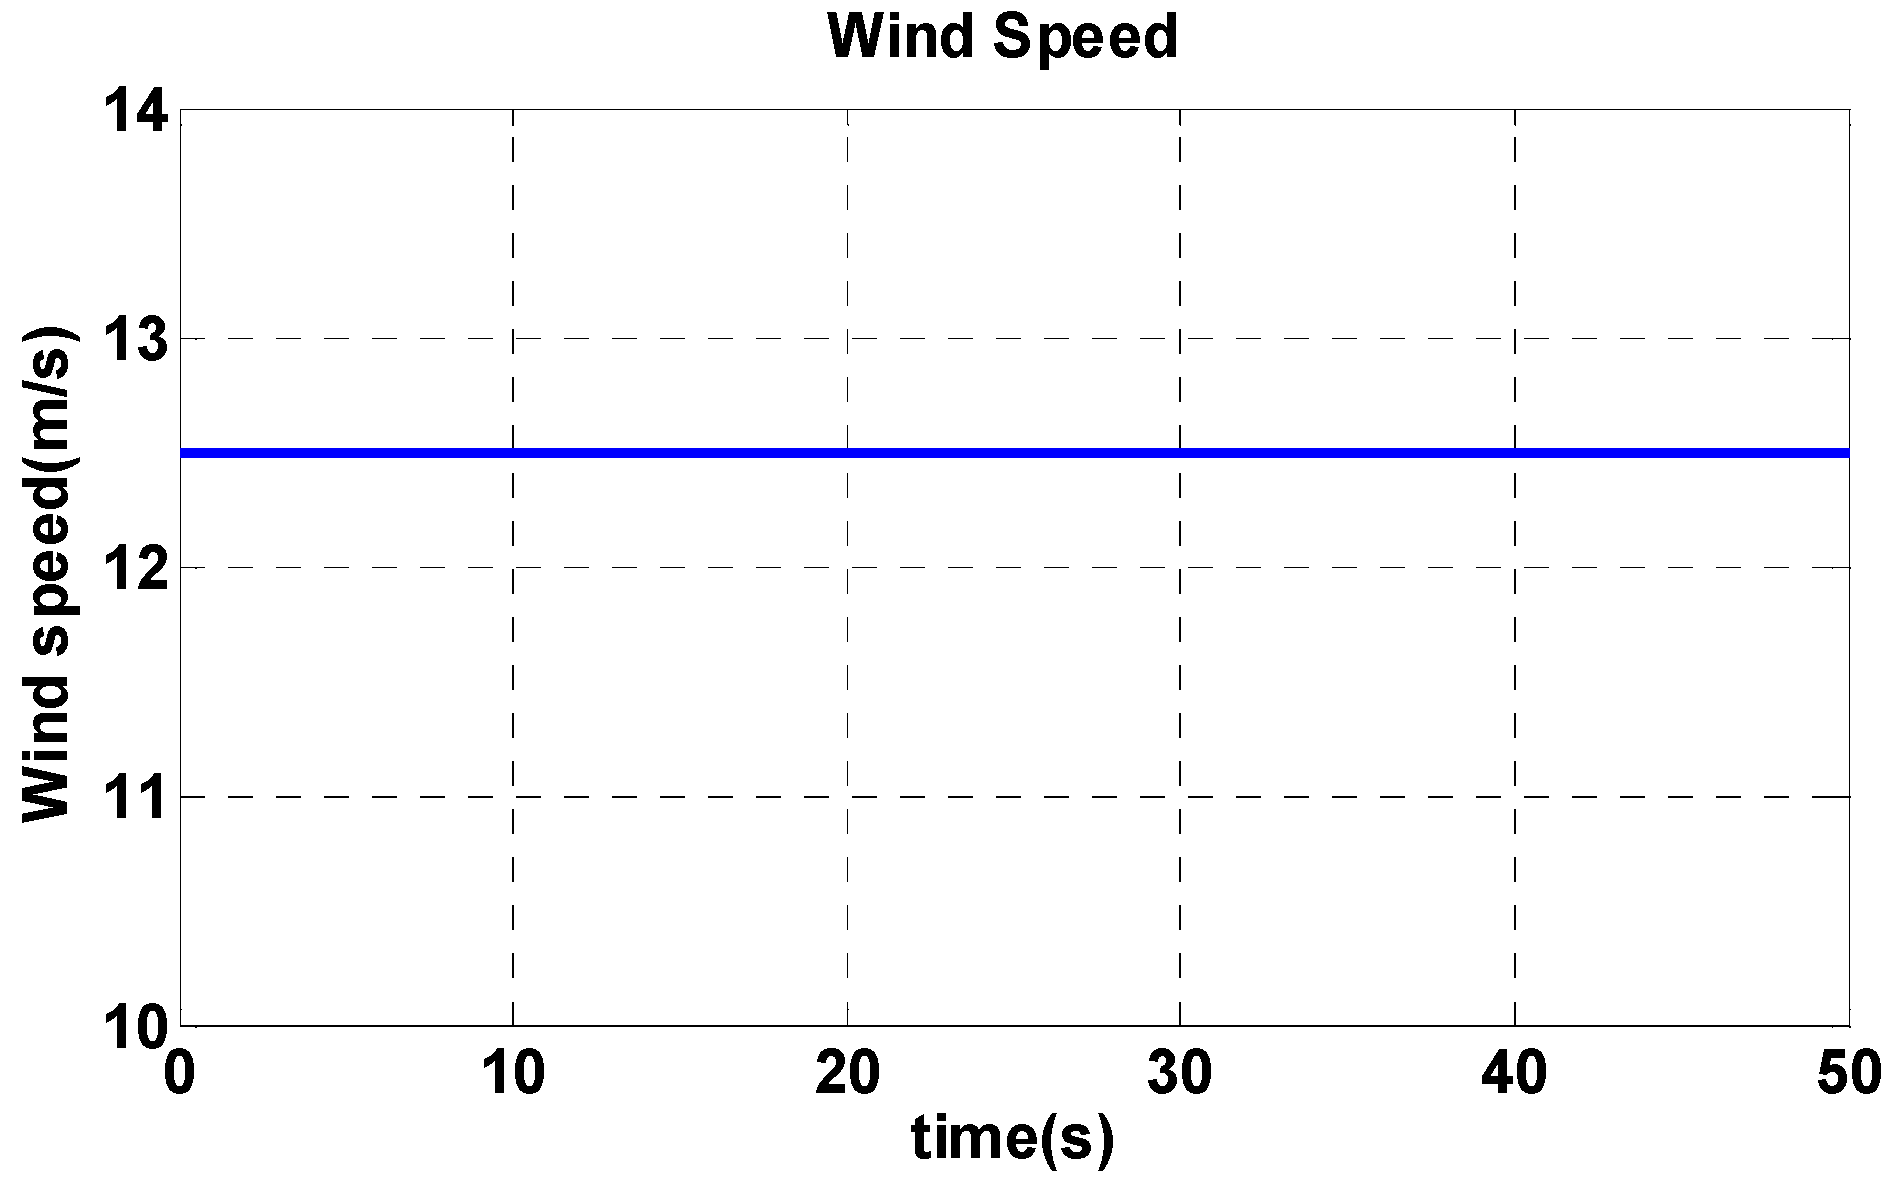
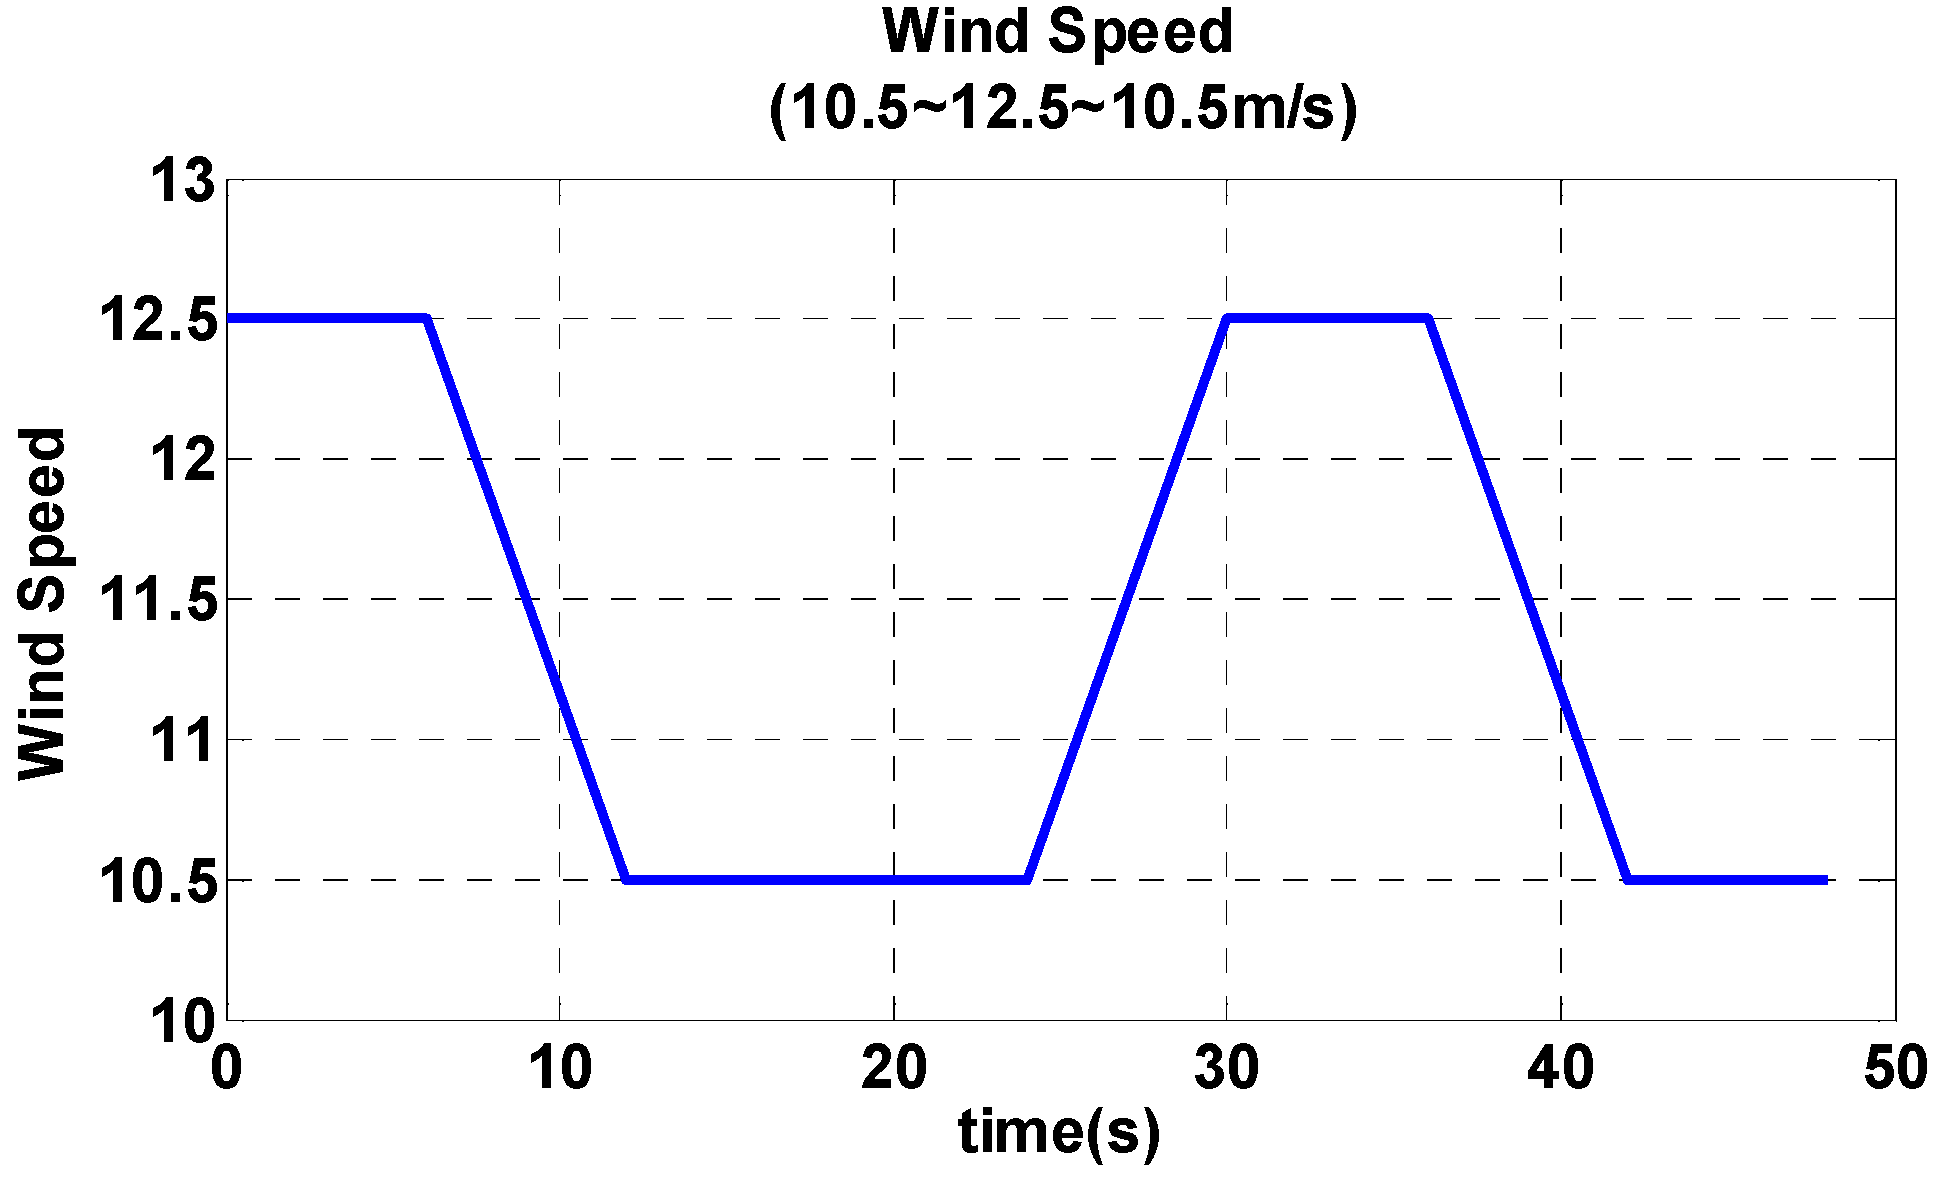
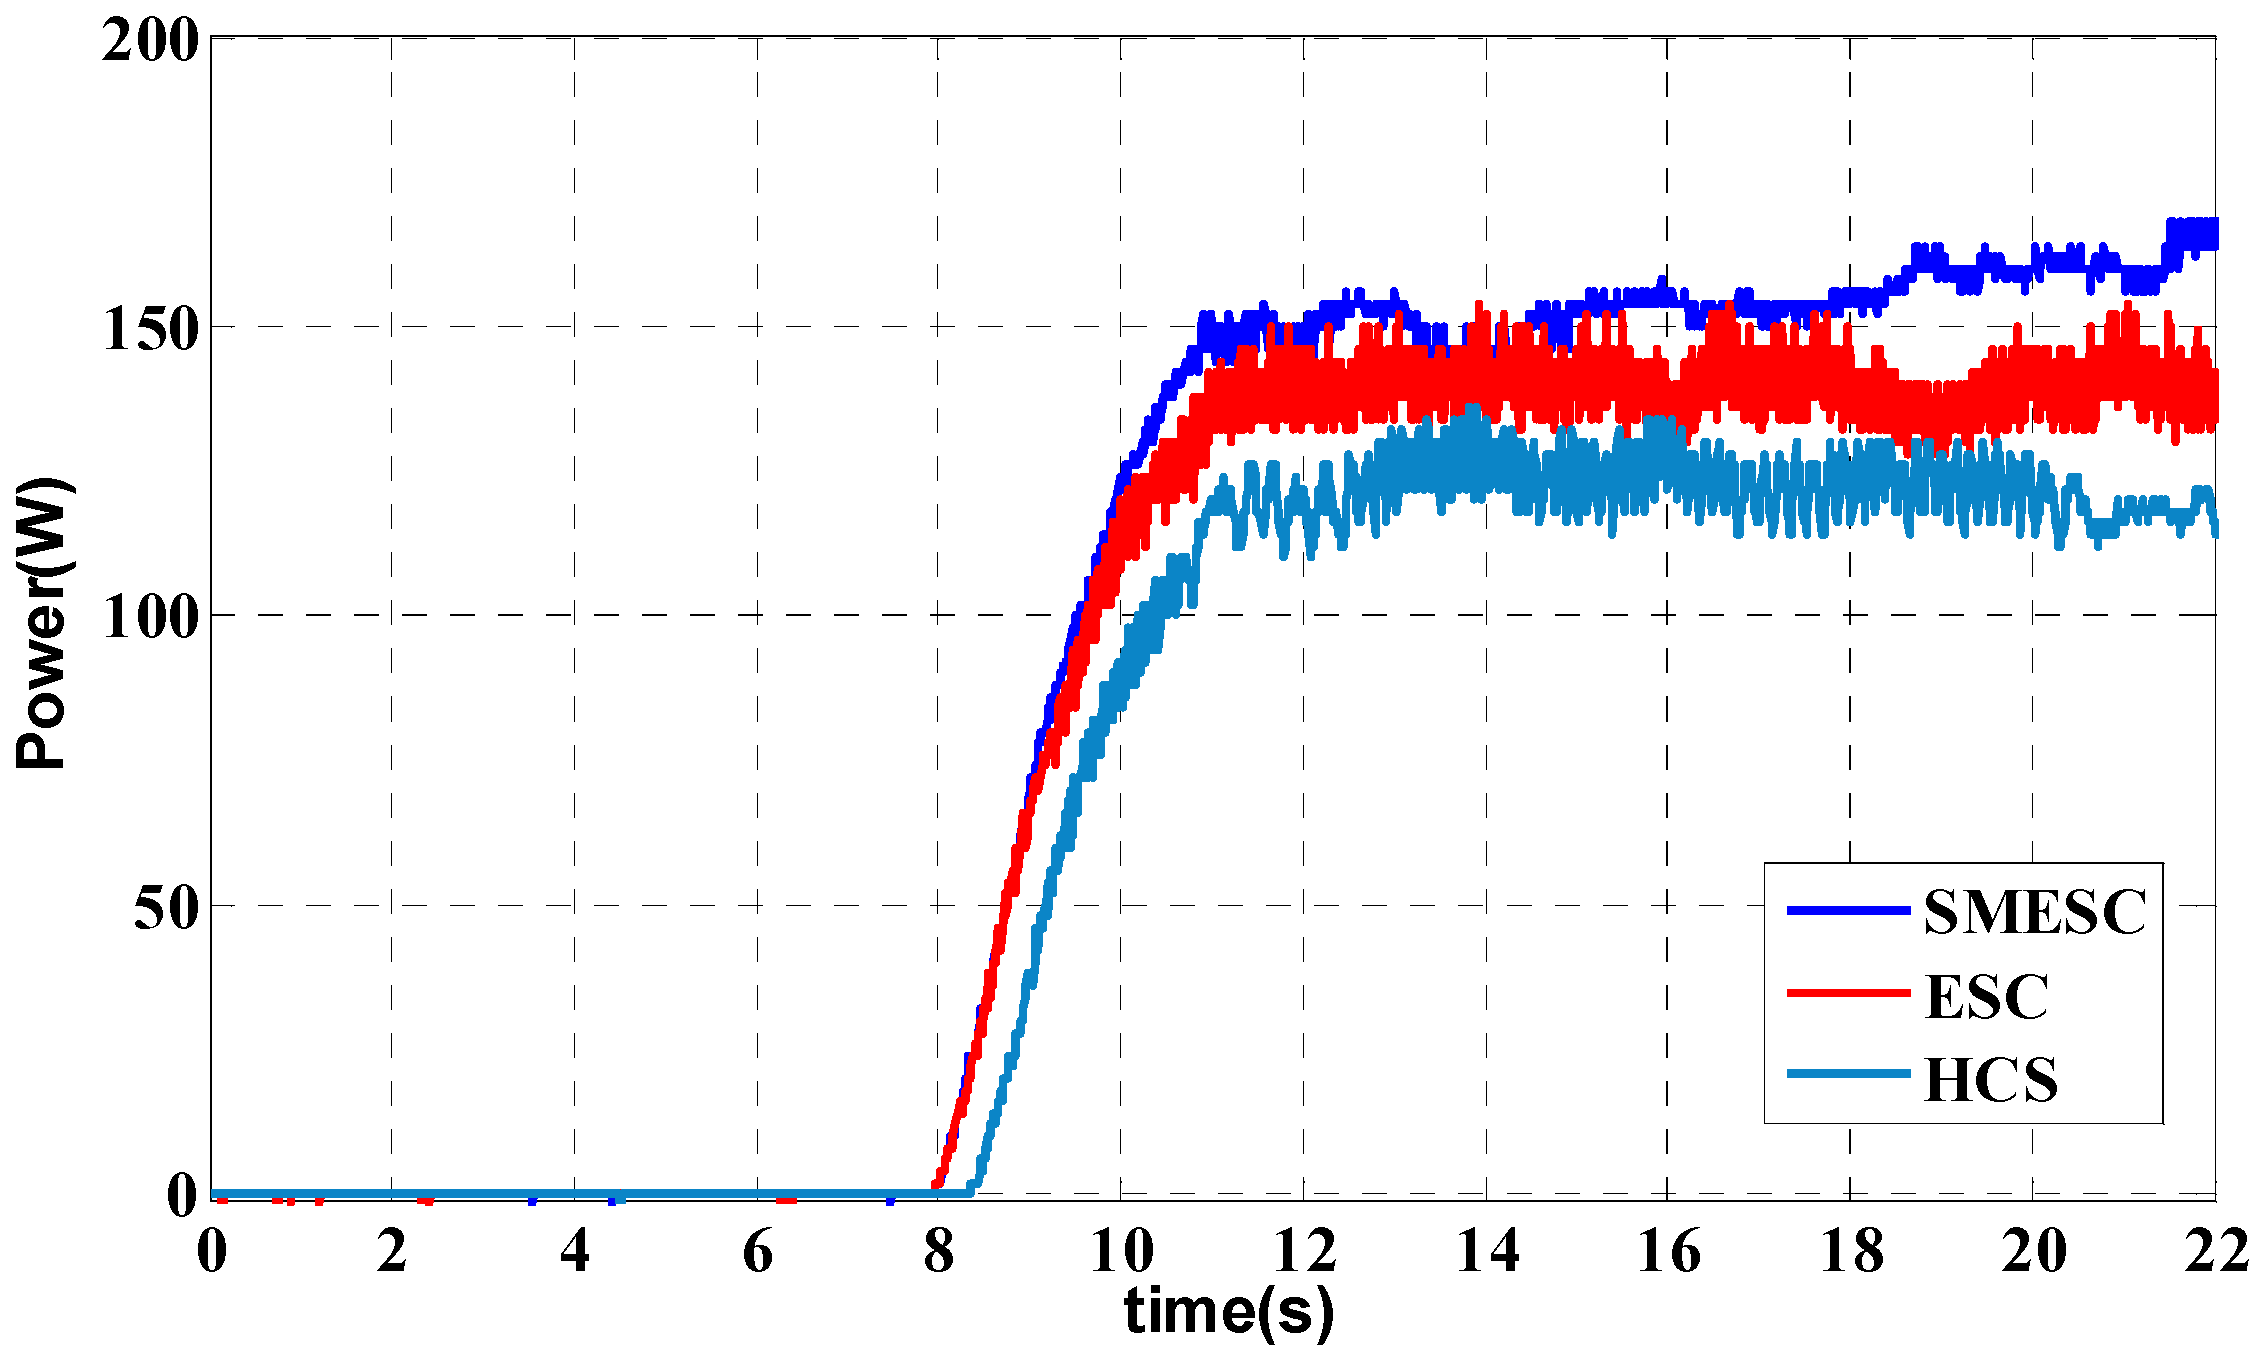
4.1. Maximum Power Point Tracking Algorithm Simulation

This study was amended (see reference [33]) to set the wind turbine blade pitch angle β  to zero. This allows a maximum power dynamic response from the system algorithm under conditions of steady and changing wind speed to compare the advantages and disadvantages of transient and steady state response, see Figure 7. The figure shows the algorithm flow chart of the maximum power point tracking method used. It can be seen from the simulation results that this procedure can be used for wind turbine control. Changes in the dynamic output and response of the wind turbine can be observed when different wind speeds are entered and these observations can be used to verify the practicality of the Sliding Mode Extremum Seeking Control algorithm used in the wind energy industry.
Figure 7. Maximum wind power point tracking flowchart based on CEPSO’s SMESC.
Energies 08 09191 g007
Two sets of wind speed states were simulated. In Figure 8 the wind speed shown is steady at 12.5 m/s. In Figure 9 the wind speed changes from 12.5 to 10.5 m/s after 10 s and then is further increased to 12.5 m/s and dropped again later. Changes in wind speed were tracked for 50 s.
Figure 8. Step input for wind speed of 12 m/s.
Energies 08 09191 g008
Figure 9. Step input changes for wind speeds from 10.5 to 12.5 m/s.
Energies 08 09191 g009
As can be seen in Figure 10, tracking times can be compared by observation of the transient state ESC for a longer time than the other two control methods. The dynamic response of HCS and SMESC are similar, but after the steady state, the HCS response is poorer than that of SMESC. From the figure it can be clearly observed that the steady-state oscillations of SMESC are smaller than for the other two control modes. The experimental results from our simulations show that under identical wind speed conditions the SMESC algorithm used here has a better dynamic response than the others.
Figure 10. HCS, ESC, SMESC dynamic response comparison chart.
Energies 08 09191 g010
The second simulation was a test of the system output dynamic response results using the SMESC algorithm under varying wind speeds, see Figure 11 and Figure 12. The input state sets wind speed changes between 10.5 and 12.5 m/s. The system simulation results show that although the amplitude of the ESC control method under varying wind speed is smaller, maximum power point tracking has more harmonics. Also, time taken for HCS to track the maximum power point is longer and the amplitude is larger than in the SMESC control mode. These results confirm that a wind power generation system using the SMESC control mode will have a better transient and steady state response under varying wind speed states. This is of great help for increasing component life and also saves simulation time.
Figure 11. Three algorithm system dynamic responses: High wind speed dropped and raised again.
Energies 08 09191 g011
Figure 12. Three algorithm system dynamic responses: Low wind speed raised and lowered again.
Energies 08 09191 g012

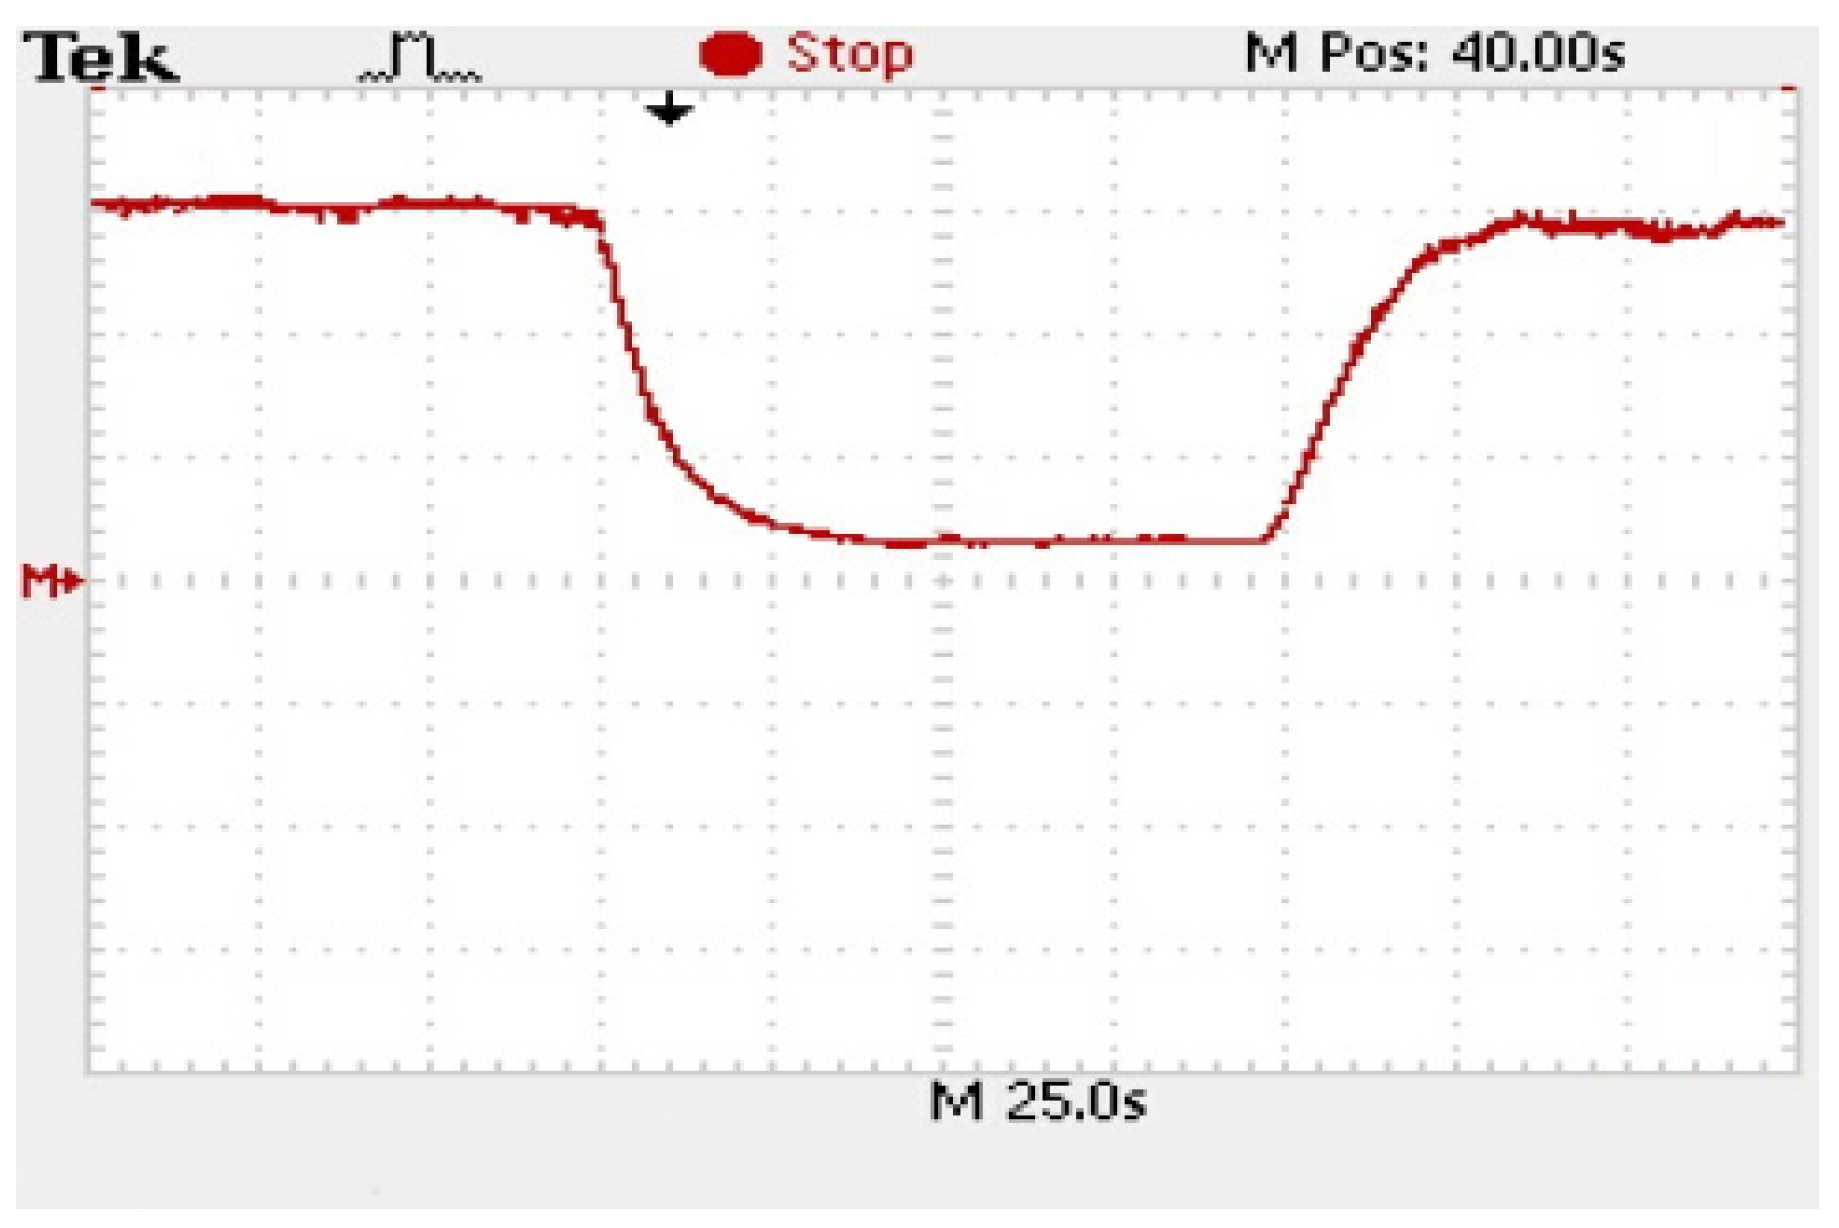
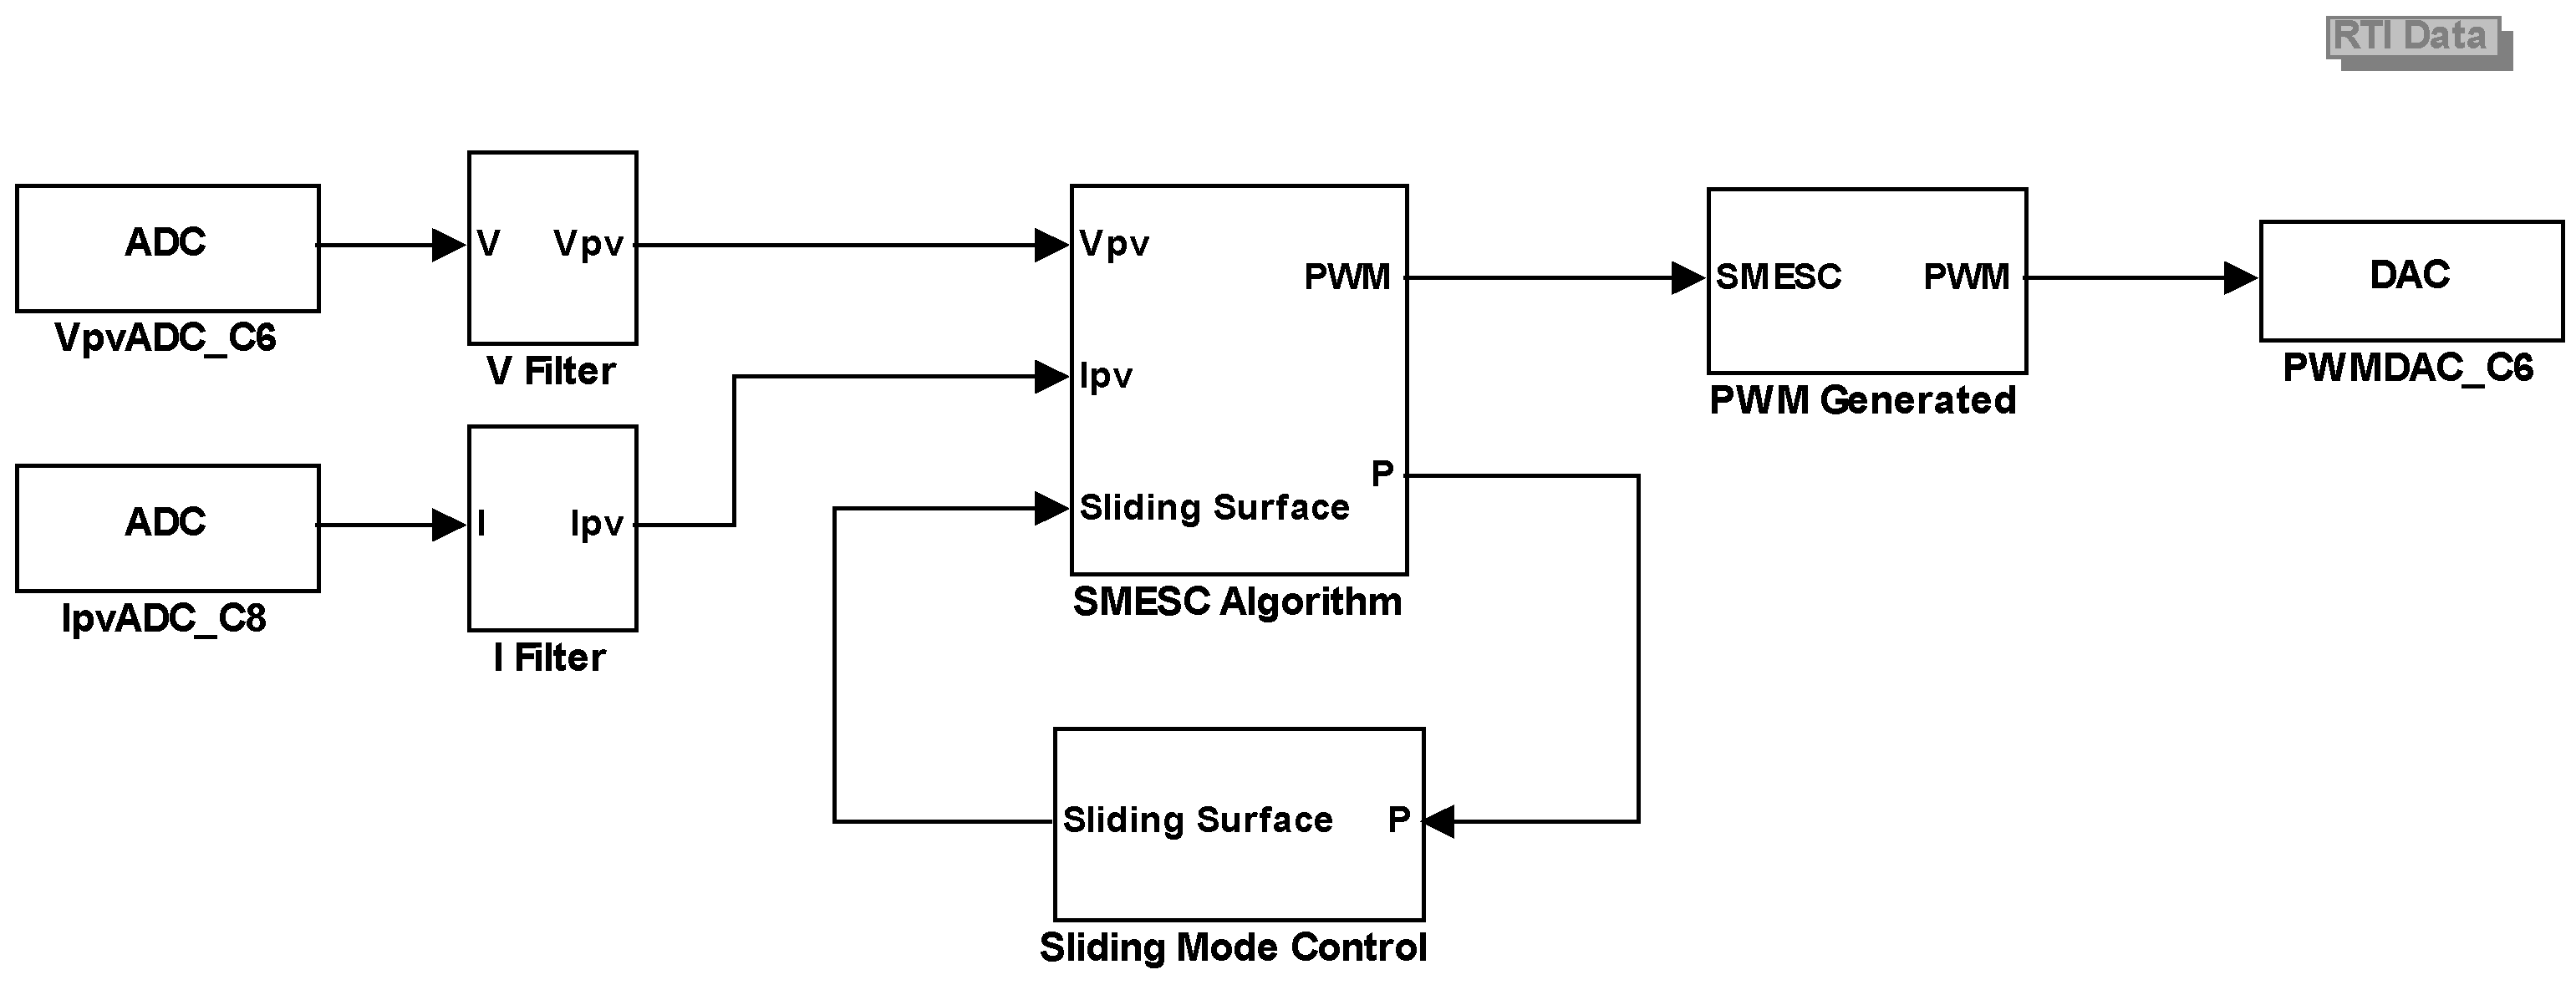
4.2. Maximum Power Point Tracking Algorithm Experimental Results

Software simulation was used to verify the feasibility of each of the control algorithms. The results of these simulations were used to establish a set of wind power generation procedures for actual wind maximum power point tracking, see the hardware flow chart Figure 13. To test a real machine the dSPACE controller utilizes the real-time library Matlab R2010a to realize various control algorithms. The simulation results clearly verify both power output stability and accuracy under conditions of steady and varying wind speed. Figure 14 is a block diagram of the Sliding Mode Extremum Seeking Control algorithm (SMESC) which has input and output from the Sliding Mode control.
Figure 13. Hardware flowchart.
Energies 08 09191 g013
Figure 14. Test program block diagram. Sliding Mode Extremum Seeking Control algorithm.
Energies 08 09191 g014
A traditional extremum seeking control method can cause the high frequency switching phenomenon. This results in a decrease in power output efficiency as well as power losses and the switching element life is also reduced. To counteract this weakness a Sliding Mode control to suppress high frequency switching and a maximum power point alternative switch function slide setting were added. Use was made of power calculated by the Sliding Mode controller to approach the sliding plane and force the power generation system to the maximum power point. The concept of a sliding layer can effectively suppress the tripping phenomenon. Figure 15 shows the actual measured maximum power tracking of the Sliding Mode Extremum Seeking Control with fixed wind speed of 8 m/s. It can be seen from the figure that the transient state response is relatively good, tracking speed is fast, and the steady-state response returns the best maximum power point. Output power is more stable, power loss is effectively reduced, and the life of the control elements is extended to provide a power generation system of high efficiency.
Sliding Mode Extremum Seeking Control was also used to input varying wind speed in a simulation experiment, see Figure 16. The wind speed is first dropped from 8 to 5 m/s, and then raised again to 8 m/s. The maximum power changes are between 156 and 22 W, the second output power curve is shown in Figure 17 where the wind speed is raised from 5 to 8 m/s and the maximum power is around 156 W. The wind speed is then dropped from 8 to 5 m/s and here the maximum power is about 22 W. It can be clearly seen that the algorithm has a good dynamic response and the steady state part has lower oscillation. Actual experimental measurements show that the SMESC output waveform under varying wind speed conditions is much better than that of the traditional maximum power point tracking algorithm and is actually close to ideal.
Figure 15. Maximum power test. Sliding Mode Extremum Seeking Control, fixed wind speed of 8 m/s.
Energies 08 09191 g015
Figure 16. Measured SMESC output power: Wind speed is dropped from 8 to 5 m/s, and then raised to 8 m/s again.
Energies 08 09191 g016
Figure 17. Measured SMESC output power: Wind speed is raised from 5 to 8 m/s, and then dropped back to 5 m/s again.
Energies 08 09191 g017
Finally, the measured output waveform and the dynamic response of three maximum power point tracking algorithms, under fixed wind speed, are compared (see Figure 18). It can be clearly seen that SMESC has the best response under both fluctuating and steady states. All three algorithms entered a fixed wind speed condition at 8 s. HCS has a better steady-state response than ESC, but the algorithm needs to measure one more speed signal and this leads to slower tracking. Although the maximum power point tracking speed of ESC is high, it is affected by dramatic high-frequency oscillation in the steady state. However, the join concept of the sliding layer makes the tracking speed of SMESC faster than that of the other two and the steady-state waveform is also more stable. Simulation analysis and real testing of the dynamic response under changing wind speed input shows SMESC to have the best output waveform.
Figure 18. Waveform of measured output power for the three different control algorithms under fixed wind speed conditions.
Energies 08 09191 g018
In the actual tests two changing wind speed conditions were used with the three maximum power point tracking algorithms, see Figure 19 and Figure 20. It was observed that the dynamic response was the same as for fixed input wind speed and was better than that of traditional tracking algorithms. Simulation results clearly show that SMESC has the fastest tracking speed in both steady state and variable conditions.
Figure 19. Comparison map of HCS, ESC, SMESC: Wind speed is dropped from high to low and then raised to high again.
Energies 08 09191 g019
Figure 20. Comparison map of HCS, ESC, SMESC: Wind speed is increased from low to high and then dropped to low again.
Energies 08 09191 g020

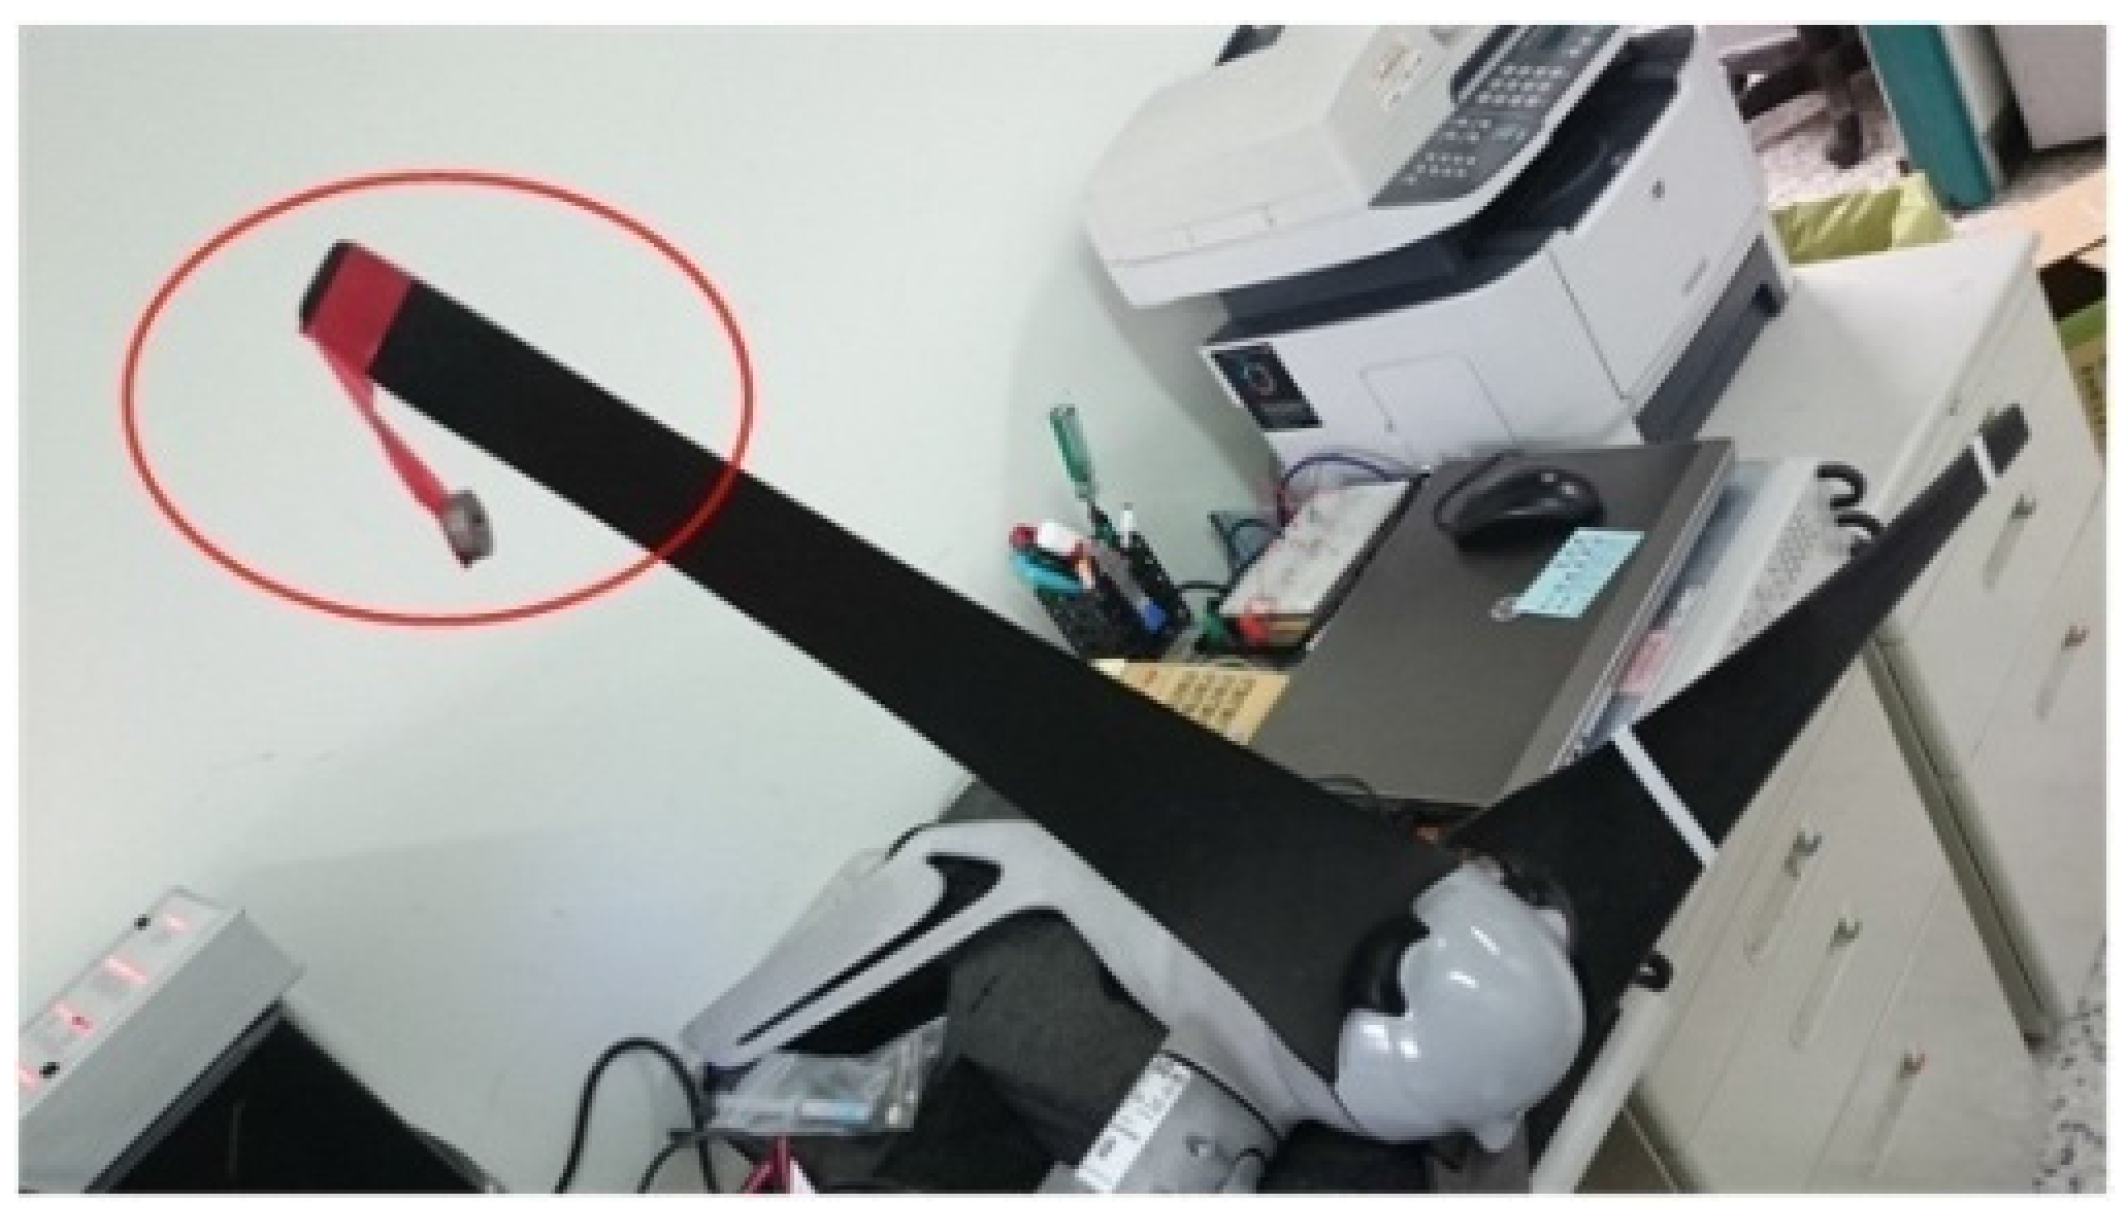
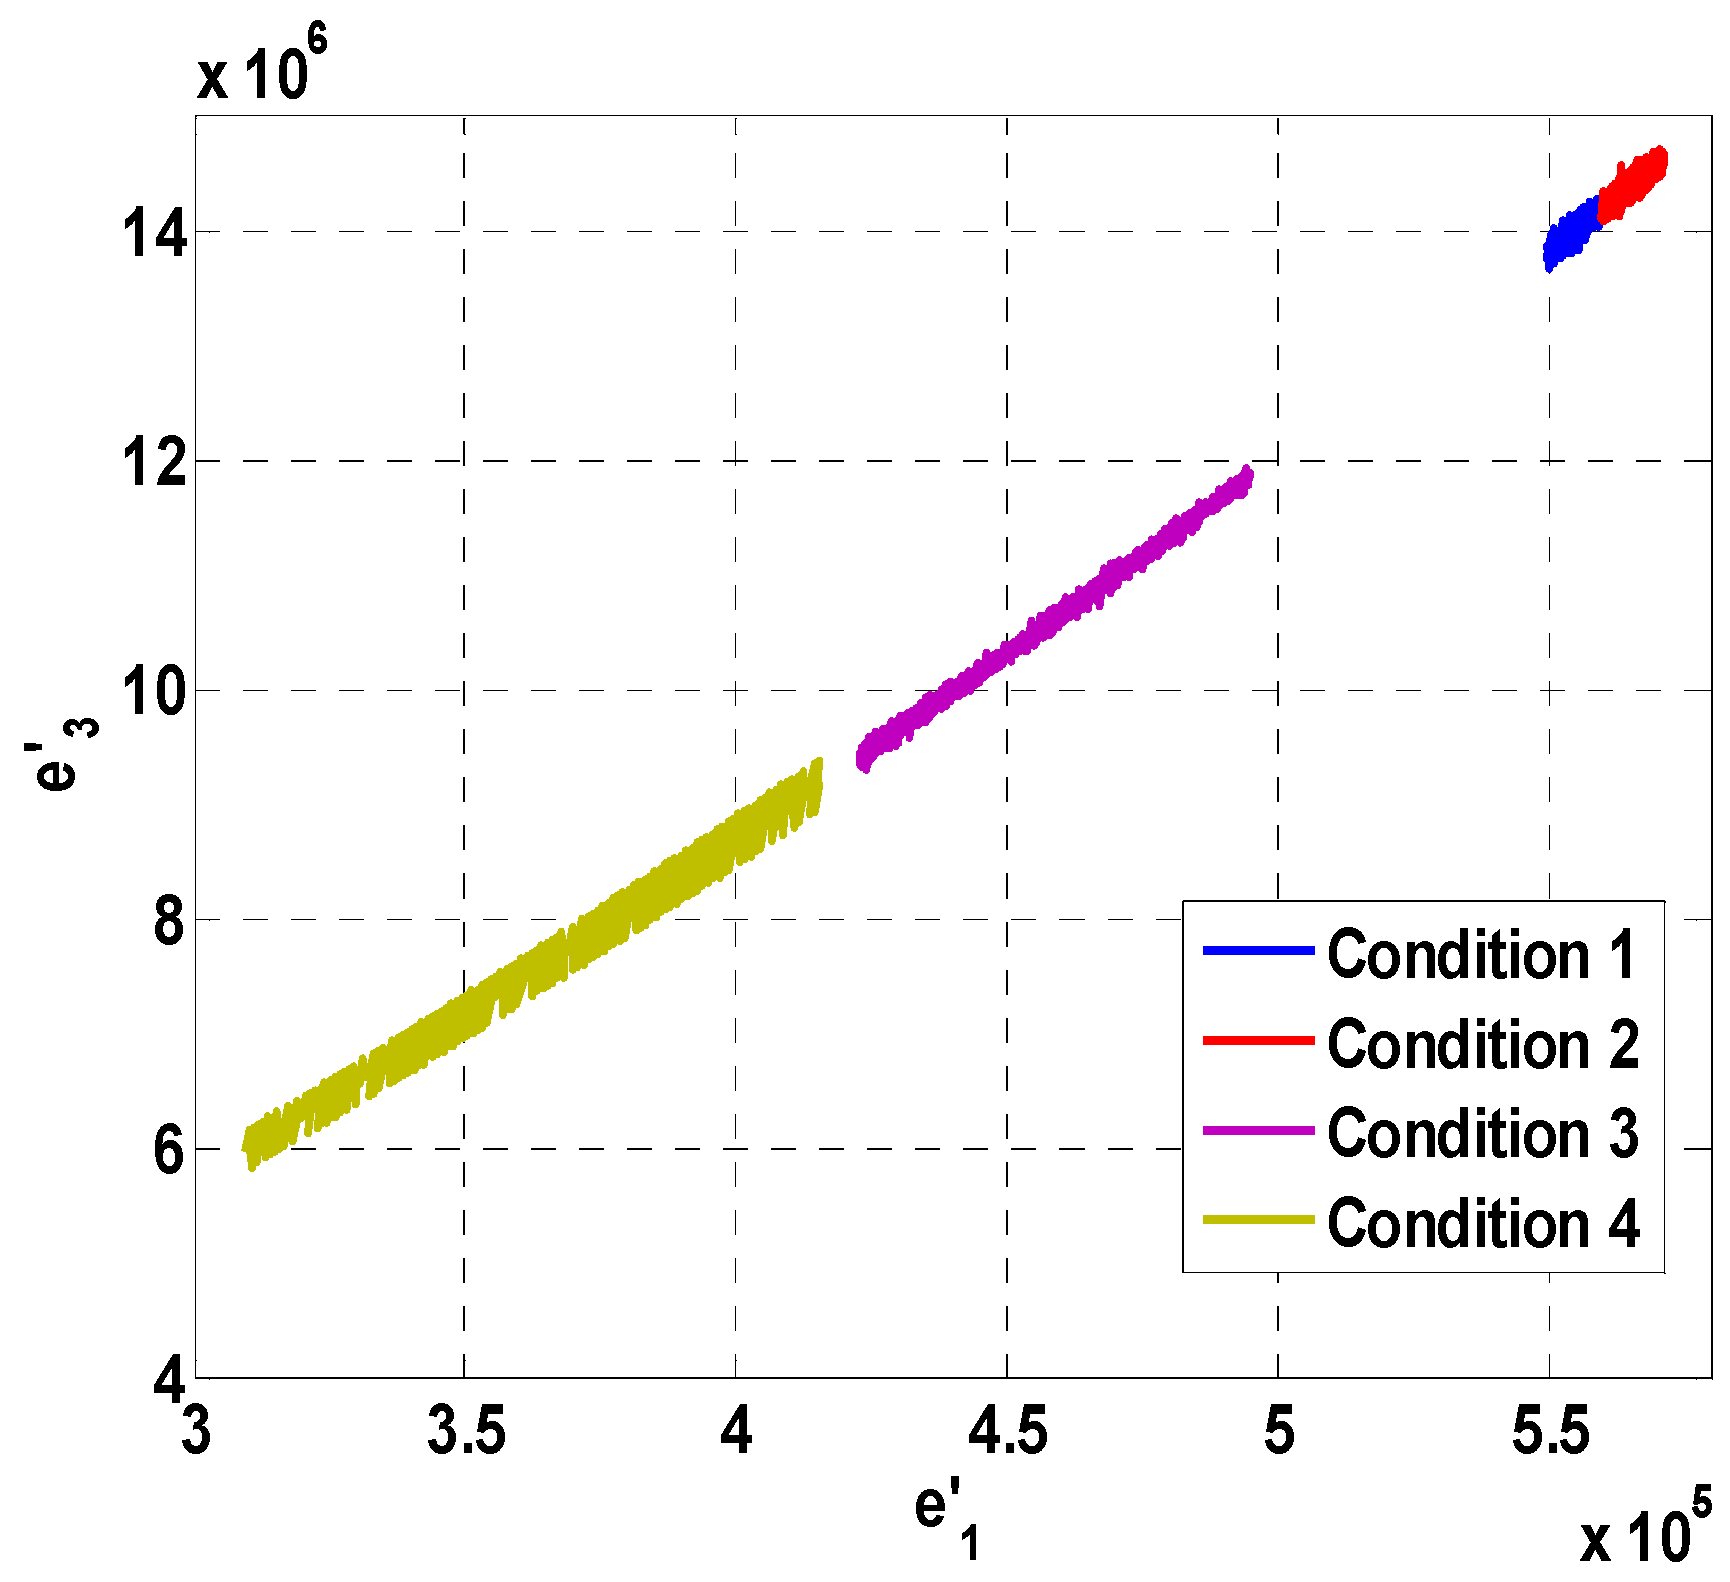
5. Results of Wind Turbine Blade Failure Diagnosis Experiments

In this study generator blade fault diagnosis was integrated into the power generation system. Voltage captured from the generator by the SMESC algorithm is input to the slave (in the Master-Slave Chaos System) where it is tracked by the master. The two systems generate a chaotic dynamic error signal to form the trajectories and entry into the matter element model is achieved by Extenics Engineering Diagnosis to perform rapid and accurate blade failure detection, see Figure 21. The figure shows the hardware and real-time troubleshooting diagnosis software interface. The real-time recognition dSPACE software interface is shown in Figure 22. In this study, the voltage measurement accuracy is 0.15 mV and the wind speed measurement accuracy is 0.1 m/s.
Figure 21. The maximum power point tracking real-time status diagnosis system hardware.
Energies 08 09191 g021
Figure 22. The real-time status diagnosis dSPACE software interface.
Energies 08 09191 g022
To simulate faults and carry out practical fault diagnosis on the AIR X wind turbine blades, various means were employed. Blocks were attached to the blades to cause imbalance and in some cases screws were loosened to cause instability and vibration, see Figure 23. This last fault condition will cause slightly abnormal output voltage. Figure 24 shows a block attached near the tip of a blade. This simulates sea salt crystallization or a bird hit and the loss of balance will result in abnormal output voltage. Figure 25 shows a mass hanging near the tip of a blade to simulate the attachment of wind-borne garbage to the blade. The loss of balance in all such cases, will result in uneven centripetal force, and will be reflected in changes and fluctuations of output voltage.
Figure 23. A blade with a loose hug screw.
Energies 08 09191 g023
Figure 24. A block attached near the tip of a blade.
Energies 08 09191 g024
Figure 25. A blade with a hanging mass.
Energies 08 09191 g025
The number of sample points taken in these experiments was 500 and the sampling frequency was set to 10 kHz. The normal signal of the master, in the Master-Slave Chaos System, was set to zero. The slave was set to the amount of captured voltage signal change. The captured signals were fed into the master-slave system where they were transformed into dynamic errors. Four error states were compared (see Figure 26) taking the normal blade state to be 1. The four error states examined were C1, a normal blade; C2, a blade with a loose hug screw; C3, a blade with a block attached near the tip; and C4, a blade with an attached hanging mass.
Figure 26. Dynamic error comparison plan map of each actual experimental state e 1 ˙   , e 3 ˙ .
Energies 08 09191 g026
Ten of the 500 captured signal points for each of the four states are listed in Table 1. The data in the table was normalized using the Correlation function to give a diagnosis of the fault in each of the conditions where C1, C2, C3, C4 represent: a normal blade, a blade with a loose hub screw, a blade with a block attached near the tip, a blade with an attached hanging mass. From the table it can be clearly observed that the different fault conditions can be recognized with precision and the normal condition is shown in the straight column as 1.
Non-real-time fault diagnosis was carried out to establish a database of voltage signals in the four different states for use during actual tests. The signals, to be used later for processing and state recognition, were input from the terminal. This non-real-time failure diagnosis data has to be established over the long term and any problems need operator follow-up treatment. The real-time fault diagnosis used in this study not only shortens diagnostic time, but all that is needed is for the operator to glance at the display to fully recognize the current state of the system. Table 2 lists the diagnosis rate of both non-real-time and real-time status diagnosis. From Table 2, it can be seen that the accurate rates approach to 100% not only in non-real time diagnostic results but also in real- time diagnostic results. This result verify the feasibility of this scheme. Otherwise, the main goal of this study is to take advantage of the experimental feasibility of SMESC from references [33] and extends the use of this method for fault diagnosis. It can be seen that the accuracy has been very high, so we did not do it again in comparison with other methods. This scheme could be applied to large-scale wind power generation system, and compared with other various methods in the future.
Table 1. Blade state diagnostic experimental results.
ConditionC1C2C3C4
Signal numbers
Condition1
110.986760.59245−1
210.9851110.592729−1
310.983720.592967−1
410.9841610.592891−1
510.9836250.592984−1
610.9823280.593209−1
710.9829040.593108−1
810.9801690.593588−1
910.9800770.593604−1
1010.9776120.594046−1
Condition2
10.90081310.555983−1
20.89877910.555519−1
30.9009310.556009−1
40.90009210.555819−1
50.90031110.555868−1
60.90133910.556102−1
70.89943510.555669−1
80.89924610.555626−1
90.9014810.556135−1
100.90121610.556074−1
Condition 3
1−0.96023−110.646727
2−0.96028−110.713212
3−0.96028−110.709737
4−0.96022−110.670173
5−0.96026−110.716586
6−0.9602−110.663943
7−0.96024−110.681759
8−0.9602−110.650732
9−0.96025−110.708213
10−0.96019−110.668025
Condition 4
1−0.96471−10.8195891
2−0.96471−10.8195891
3−0.96471−10.8195891
4−0.96471−10.8195891
5−0.96471−10.8195891
6−0.96471−10.8195891
7−0.96471−10.8195891
8−0.96471−10.8195891
9−0.96471−10.8195891
10−0.96471−10.8195891
Table 2. Non-real-time and real-time diagnosis results.
SignalsNon-real-time status diagnostic resultsStatus diagnosis rate
500 500Normal100% 100%
500 500Loose bolt on blade hub98.86% 98.86%
500 500A block attached near the tip of the blade99.91% 99.91
500 500A mass hanging from the blade99.86% 99.86%
SignalsReal-time status diagnostic resultsStatus diagnosis rate
500 500Normal100% 100%
500 500Loose bolt on blade hub98.34% 98.34%
500 500A block attached near the tip of the blade98.69% 98.69%
500 500A mass hanging from the blade98.58% 98.58%

6. Conclusions

The experimental results show that the steady-state response of chaos embedded sliding mode extremum seeking control is more stable than that of traditional extremum seeking control and Hill-Climbing Search scheme, and the system has a rapid transient state response that allows fast maximum power point tracking and determination of desired output power. The power generation system incorporates a blade troubleshooter. The master-slave chaos dynamic error system, based on Extenics Engineering Diagnosis, does wind turbine blades diagnostic troubleshooting and a simple measurement of the fault voltage signal is all that is necessary. It is only necessary to input a particular fault signal of maximum power point tracking to the Master-Slave Chaos System to generate a dynamic error map which is paired with the Extenics engineering theory. There is no need for the accumulation of large amounts of learned data. The system provides fast, accurate and low-cost fault state diagnosis. Importantly, the proposed method enables potential faults to be identified in advance such that appropriate steps can be taken to ensure the continued safe operation of the system. The experimental results show that the proposed method achieves a successful fault diagnosis rate of more than 98%. In the further study, we will implement this scheme by embedding system for a portable device and extend it to the large-scale wind power generation systems.

Acknowledgments

The authors would like to thank the Ministry of Science and Technology, Taiwan, R.O.C. for the financial support of this study under Contract No. MOST 104-2221-E-167 -001.

Author Contributions

All authors have worked on this manuscript together and all authors have read and approved the final manuscript.

Conflicts of Interest

The authors declare no conflict of interest.

References

  1. Femia, N.; Petrone, G.; Spagnuolo, G.; Vitelli, M. Optimizing duty-cycle perturbation of P&O MPPT technique. In Proceedings of the 35th IEEE Annual Power Electronics Specialists Conference (PESC), Aachen, Germany, 20–25 June 2004; pp. 1939–1944.
  2. Mahdi, A.J.; Tang, W.H.; Wu, Q.H. Estimation of tip speed ratio using an adaptive perturbation and observation method for wind turbine generator systems. In Proceedings of the IET Conference on Renewable Power Generation (RPG 2011), Edinburgh, UK, 6–8 September 2011; pp. 1–6.
  3. Mahdi, A.J.; Tang, W.H.; Wu, Q.H. Novel perturbation and observation algorithms for variable-speed wind turbine generator systems. In Proceedings of the IEEE Power and Energy Society General Meeting, San Diego, CA, USA, 22–26 July 2012; pp. 1–8.
  4. Raza Kazmi, S.M.; Goto, H.; Guo, H.J.; Ichinokura, O. A novel algorithm for fast and efficient speed-sensorless maximum power point tracking in wind energy conversion systems. IEEE Trans. Ind. Electron. 2010, 58, 29–36. [Google Scholar] [CrossRef]
  5. Yamakura, S.; Kesamaru, K. Dynamic simulation of PMSG small wind turbine generation system with HCS-MPPT control. In Proceedings of the 15th International Conference Electrical Machines and Systems (ICEMS), Sapporo, Japan, 21–24 October 2012; pp. 1–4.
  6. Tatsuta, F.; Suzuki, K.; Nishikata, S. A new control method to realize constant tip speed ratios of series connected wind turbine generators. In Proceedings of the 2013 International Conference Clean Electrical Power (ICCEP), Alghero, Italy, 11–13 June 2013; pp. 434–439.
  7. Yokoyama, H.; Tatsuta, F.; Nishikata, S. Tip speed ratio control of wind turbine generating system connected in series. In Proceedings of the 2011 International Conference Electrical Machines and Systems (ICEMS), Beijing, China, 20–23 August 2011; pp. 1–4.
  8. Zou, Y.; Elbuluk, M.; Sozer, Y. Stability analysis of maximum power point tracking (MPPT) method in wind power systems. In Proceedings of the 2011 IEEE Industry Applications Society Annual Meeting (IAS), Orlando, FL, USA, 9–13 October 2011; pp. 1–8.
  9. Koutroulis, E.; Kalaitzakis, K. Design of a maximum power tracking system for wind-energy-conversion applications. IEEE Trans. Ind. Electron. 2006, 53, 486–494. [Google Scholar] [CrossRef]
  10. Dalala, Z.M.; Zahid, Z.U.; Yu, W.; Cho, Y.; Lai, J.S. Design and analysis of an MPPT technique for small-scale wind energy conversion systems. IEEE Trans. Energy Convers. 2013, 28, 756–767. [Google Scholar] [CrossRef]
  11. Yau, H.T.; Lin, C.J.; Wu, C.H. Sliding Mode Extremum Seeking Control Scheme Based on PSO for Maximum Power Point Tracking in Photovoltaic Systems. Int. J. Photoenergy 2013, 2013, 1–10. [Google Scholar] [CrossRef]
  12. Li, X.; Chen, G.; Chen, Z.; Yuan, Z. Chaotifying linear Elman networks. IEEE Trans. Neural Netw. 2002, 13, 1193–1199. [Google Scholar] [PubMed]
  13. Chen, C.; Sun, C.; Zhang, Y.; Wang, N. Fault diagnosis for large-scale wind turbine rolling bearing using stress wave and wavelet analysis. In Proceedings of the Eighth International Conference Electrical Machines and Systems (ICEMS), Nanjing, China, 27–29 September 2005; pp. 2239–2244.
  14. Li, Y.; Li, G.; Yan, J. Fault diagnosis of wind turbine blades based on fuzzy theory. In Proceedings of the 2011 International Conference Control, Automation and Systems Engineering (CASE), Singapore, 30–31 July 2011; pp. 1–3.
  15. Wang, Z. Study on Condition Monitoring and Fault Diagnosis for Wind Turbine Blades; Department of Mechanical and Electronic Engineering, Tianjin University: Tianjin, China, 2010. [Google Scholar]
  16. Esteller, R.; Vachtsevanos, G.; Echauz, J.; Litt, B. A comparison of waveform fractal dimension algorithms. IEEE Trans. Circ. Syst. I Fundam. Theory Appl. 2001, 48, 177–183. [Google Scholar] [CrossRef]
  17. Mei, Y.; Xu, Y.; Wang, Z. Detection and damage diagnosis for wind turbine blades based on the theory of length fractal dimension on dynamic properties. In Proceedings of the 2010 International Conference Measuring Technology and Mechatronics Automation (ICMTMA), Changsha, China, 13–14 March 2010; pp. 1089–1092.
  18. Taso, T.F.; Kuo, C.C. Application of the Hilbert-Huang transform with fractal feature enhancement for failure types classification of wind turbines. In Proceedings of the 2012 International Conference Computer Distributed Control and Intelligent Environmental Monitoring (CDCIEM), Hunan, China, 5–6 March 2012; pp. 149–152.
  19. Pang, M.; Zhou, X.; Yang, C. Fault diagnosis of automobile main reducer based on correlation dimension. In Proceedings of the International Technology and Innovation Conference (ITIC), Hangzhou, China, 6–7 November 2006; pp. 1975–1979.
  20. Yang, G.; Liu, Y.; Zhao, L.; Cui, S. Typical power quality disturbance identification based on fractal box dimension. In Proceedings of the Chaos-Fractals Theories and Applications (IWCFTA) International Workshop, Shenyang, China, 6–8 November 2009; pp. 412–416.
  21. Chen, S.J.; Zhan, T.S.; Huang, C.H.; Chen, J.L.; Lin, C.H. Nontechnical loss and outage detection using fractional-order self-synchronization error-based fuzzy petri nets in micro-distribution systems. IEEE Trans. Smart Grid 2014, 6, 411–420. [Google Scholar] [CrossRef]
  22. Johnson, K.E.; Fleming, P.A. Development, implementation, and testing of fault detection strategies on the National Wind Technology Center’s controls advanced research turbines. Mechatronics 2011, 21, 728–736. [Google Scholar] [CrossRef]
  23. Odgaard, P.F.; Stoustrup, J.; Kinnaert, M. Fault-tolerant control of wind turbines: A benchmark model. IEEE Trans Control Syst. Technol. 2013, 21, 1168–1182. [Google Scholar] [CrossRef]
  24. Odgaard, P.F.; Stoustrup, J. Fault tolerant wind farm control—A benchmark model. In Proceedings of the 2013 IEEE International Conference on Control Applications (CCA), Hyderabad, India, 28–30 August 2013; pp. 412–417.
  25. Odgaard, P.F.; Johnson, K.E. Wind turbine fault detection and fault tolerant control—An enhanced benchmark challenge. In Proceedings of the American Control Conference (ACC), Washington, DC, USA, 17–19 June 2013; pp. 4447–4452.
  26. Johnson, K.E.; Pao, L.Y.; Balas, M.J.; Fingersh, L.J. Control of variable-speed wind turbines: Standard and adaptive techniques for maximizing energy capture. Control Syst. 2006, 26, 70–81. [Google Scholar] [CrossRef]
  27. Sloth, C.; Esbensen, T.; Stoustrup, J. Active and passive fault-tolerant LPV control of wind turbines. In Proceedings of the American Control Conference (ACC), Baltimore, MD, USA, 30 June–2 July 2010; pp. 4640–4646.
  28. Sami, M.P.; Ron, J. An FTC approach to wind turbine power maximisation via T–S fuzzy modelling and control. In Proceedings of the 8th IFAC Symposium on Fault Detection, Supervision and Safety of Technical Processes, National Autonomous University of Mexico, Mexico City, Mexico, 29–31 August 2012; pp. 349–354.
  29. Puig, V. Fault diagnosis and fault tolerant control using set-membership approaches: Application to real case studies. Int. J. Appl. Math. Comput. Sci. 2010, 20, 619–635. [Google Scholar] [CrossRef] [Green Version]
  30. Mickael, R.; Didier, T.; Samir, A.; Dominique, S. Fault Tolerant Control design for polytopic LPV systems. Int. J. Appl. Math. Comput. Sci. 2007, 17, 27–37. [Google Scholar]
  31. Niemann, H.; Stoustrup, J. An architecture for fault tolerant controllers. Int. J. Control 2005, 78, 1091–1110. [Google Scholar] [CrossRef]
  32. Chen, Z.; Patton, R.; Chen, J. Robust fault-tolerant system synthesis via LMI. In Proceedings of the 3rd IFAC Symposium on Fault Detection, Supervision and Safety for Technical Processes 1997 (SAFEPROCESS 97), Kingston-upon-Hull, UK, 26–28 August 1997; pp. 347–352.
  33. Chen, J.H.; Yau, H.T.; Hung, W. Design and study on sliding mode extremum seeking control of the chaos embedded particle swarm optimization for maximum power point tracking in wind power systems. Energies Wind Turbine 2014, 7, 1706–1720. [Google Scholar] [CrossRef]
  34. Chen, J.H.; Yau, H.T.; Hung, T.H. Design and implementation of FPGA-based intelligent sunlight tracking system. Mechatronics 2015, 25, 55–64. [Google Scholar] [CrossRef]
  35. Kuo, Y.-C.; Hsieh, C.-T.; Yau, H.-T.; Li, Y.-C. Research and development of a chaotic signal synchronization error dynamics-based ball bearing fault diagnostor. Entropy 2014, 16, 5358–5376. [Google Scholar] [CrossRef]
  36. Wang, M.H.; Ho, C.Y. Application of extension theory to the fault diagnosis of power transformers. In Proceeding of the 22nd Symposium on Electrical Power Engineering, Kaohsiung, Taiwan, 26 November 2001.

