Article

Fumed Silica Nanoparticles Incorporated in Quaternized Poly(Vinyl Alcohol) Nanocomposite Membrane for Enhanced Power Densities in Direct Alcohol Alkaline Fuel Cells

1
Department of Chemical and Materials Engineering, Chang Gung University, Kwei-shan, Taoyuan 333, Taiwan
2
Department of Chemical Engineering, Mingchi University of Technology, Tai-shan, New Taipei City 243, Taiwan
*
Author to whom correspondence should be addressed.
Energies 2016, 9(1), 15; https://doi.org/10.3390/en9010015
Submission received: 31 July 2015 / Revised: 13 November 2015 / Accepted: 21 December 2015 / Published: 25 December 2015
(This article belongs to the Special Issue Methanol and Alcohol Fuel Cells)

Abstract

:
A nanocomposite polymer membrane based on quaternized poly(vinyl alcohol)/fumed silica (QPVA/FS) was prepared via a quaternization process and solution casting method. The physico-chemical properties of the QPVA/FS membrane were investigated. Its high ionic conductivity was found to depend greatly on the concentration of fumed silica in the QPVA matrix. A maximum conductivity of 3.50 × 10⁻² S/cm was obtained for QPVA/5%FS at 60 °C when it was doped with 6 M KOH. The permeabilities of methanol and ethanol were reduced with increasing fumed silica content. Cell voltage and peak power density were analyzed as functions of fumed silica concentration, temperature, methanol and ethanol concentrations. A maximum power density of 96.8 mW/cm2 was achieved with QPVA/5%FS electrolyte using 2 M methanol + 6 M KOH as fuel at 80 °C. A peak power density of 79 mW/cm2 was obtained using the QPVA/5%FS electrolyte with 3 M ethanol + 5 M KOH as fuel. The resulting peak power densities are higher than the majority of published reports. The results confirm that QPVA/FS exhibits promise as a future polymeric electrolyte for use in direct alkaline alcoholic fuel cells.

Graphical Abstract

1. Introduction

Presently, inorganic-organic nanocomposite electrolyte membranes are generating increasing interest for use in direct methanol fuel cell (DMFC) applications with different fuel cell structures and polymer electrolytes operated at varying temperatures [1]. The DMFC is a remarkable energy source with a broad range of applications, spanning from portable electronic devices to medium-scale and low cost power generators [2]. During fuel cell performance, high methanol crossover produces surplus reactive free radicals at cathodes, leading to catastrophic failure of polymeric electrolyte membranes [3]. In addition, methanol crossover not only causes a high degree of fuel loss but also negatively affects cathodes, resulting in an enhanced mixed potential that restricts the efficiency of electrochemical cell performance and leads to catalytic poisoning [4,5,6]. Additionally, unlike Nafion® membranes, there are no commercially available standard DMFC membranes for acidic proton exchange in fuel cells, therefore, current research is based on two types of hydroxide-conducting solid electrolytes for use in direct methanol alkaline fuel cells (DMAFCs): anionic-exchange membranes with fixed-charge functional groups and potassium hydroxide-doped membranes, which serve as alternatives to Nafion membranes in alcoholic fuel cell technology [7,8,9]. The advantages of DMAFCs include their use of non-Pt catalysts, faster fuel oxidation kinetics in alkaline versus acidic media, reduced methanol crossover, lower permeability, higher conductivities, light-weight packaging and low cost [10,11,12]. Among the many types of polymeric membranes, particular focus should be paid to poly(vinyl alcohol) (PVA) membranes, as they offer good film-forming matrixes, superior chemical resistance, mechanical strength, satisfactory adhesive use, low cost, and environmental friendliness when used in fuel cells [13,14]. In addition, polyhydroxyl polymers have high densities of reactive chemical functions, which enable modifications [15]. In this study, a polyhydroxyl polymer was used as an anionic exchange membrane for quaternization. Therefore, quaternary ammonium groups were introduced into PVA polymer via –N+(CH3)3 functional groups using glycidyltrimethyl ammonium chloride (GTMAC) as an amination agent. The quaternized PVA (QPVA) membrane exhibited improved hydrophilicity, water permselectivity, higher ionic conductivity and reduced methanol permeability relative to a pristine PVA membrane [16,17]. Zhang et al., reported that permselectivity and water permeability increased as a result of an increasing degree of quaternization, which posed a limitation on electrochemical reactions [18]. Therefore, the quaternization process must be optimized to improve electrochemical performance. In our previous work, the quaternization efficiency of a 2.5 quaternized PVA matrix with chitosan nanoparticles was optimized to improve fuel cell performance by reducing permeability and improving conductivity [17]. Yang et al., designed a QPVA/poly (epichlorohydrin) polymer membrane using a simple blend process and studied it in a methanol fuel cell by varying different parameters to improve the cell performance to 20.81 mW/cm2 [10]. Similarly, Fang et al., prepared a modified quaternized poly (phthalazinon ether sulfone ketone) anion exchange membrane that showed high ionic conductivity (14 × 10−2 S/cm) and improved thermal stability [19]. Xiong et al., demonstrated that a cross-linked quaternized PVA membrane improved conductivity to 7.34 × 10⁻³ S/cm and reduced permeability by increasing the concentration of methanol, which could be accomplished at a low cost [20]. In addition, a QPVA with quaternized chitosan was used to increase conductivity from 10−3 to 10−2 S/cm and to reduce methanol permeability to a range of 10−6–10−7 cm2/s, with no detrimental effect on cell performance [21]. Therefore, the available literature illustrates that the presence of quaternary ammonium groups in PVA polymers can improve ionic conductivity by providing superior OH anion exchange and reducing methanol permeability to enhance the performance of DMAFCs.
In addition, inorganic nanofillers, such as silica, Al2O3, CNT, Fe3O4-CNT, chitosan, and GO, have been introduced into polymer blendsto increase the conductivity and performance of DMAFCs [5,11,16,17,22]. Silica is a stiffener material that provides a high surface area, chemical stability, and mechanical strength and can reduce crystallinity and glass transition temperature to improve ionic conductivity when incorporated into a polymeric matrix [23]. In our previous work, PVA/FS nanocomposites were shown to improve ionic conductivity, cell potential and power densities when fumed silica percentages were increased in PVA matrixes, which were studied via assessments of methanol and KOH concentrations, oxygen flow rates and temperature effects [24]. Khoonsap et al., reported that fumed silica particles in PVA nanocomposite membranes enhance their water permeability and selectivity by promoting both water diffusion and adsorption [25]. Mondal et al., synthesized quaternized aromatic amine-based PVA membranes cross-linked with silica nanoparticles; the composite membranes exhibited improved initial decomposition temperatures, water uptake, ion exchange capacity and mechanical strength [26]. Xiong et al., elucidated the preparation of nanocomposite QPVA membranes that contained different percentages of silica nanocomposite, which enhanced ionic conductivity to 1.4 × 10⁻² S/cm and reduced methanol permeability to 11.6 × 10⁻⁷ cm2/s; however, they did not explore their effects on fuel cell performance [27]. Consequently, the ionic transport properties and reduced methanol permeabilities of polymeric electrolyte membranes can be improved by the addition of inorganic nanomaterials, such as fumed silica. Due to the lack of available literature on quaternized polymer membranes, the present work focused on creating a quaternized polymer matrix with fumed silica for use in methanol or ethanol fuel cells.
In this paper, we investigated the use of pristine and QPVA nanocomposite membranes, which incorporated varying concentrations of fumed silica, indirect methanol alkaline fuel cells. The exfoliation of 2.5 quaternized PVA was obtained with glycidyltrimethylammonium chloride (GTMAC). The fumed silica nanoparticles were dispersed in the QPVA matrix, and thin film membranes were created from the mixtures using a solution casting method. Ionic conductivity was increased in the QPVA/5%FS nanocomposite membrane relative to the pristine QPVA and other nanocomposite membranes. The physic-chemical characterization of pristine and fumed silica-incorporated QPVA nanocomposite membranes (with varying percentages of silica) were investigated, as well as their elemental mapping, water uptake, ionic conductivities and permeabilities. Methanol and ethanol permeabilities were reduced in response to increasing fumed silica concentrations in the QPVA matrix. Finally, cell potentials and power densities were measured at different fumed silica percentages, temperatures, methanol and ethanol concentrations, and the correlation ofits electrolyte characteristics was studied in detail.

2. Results and Discussion

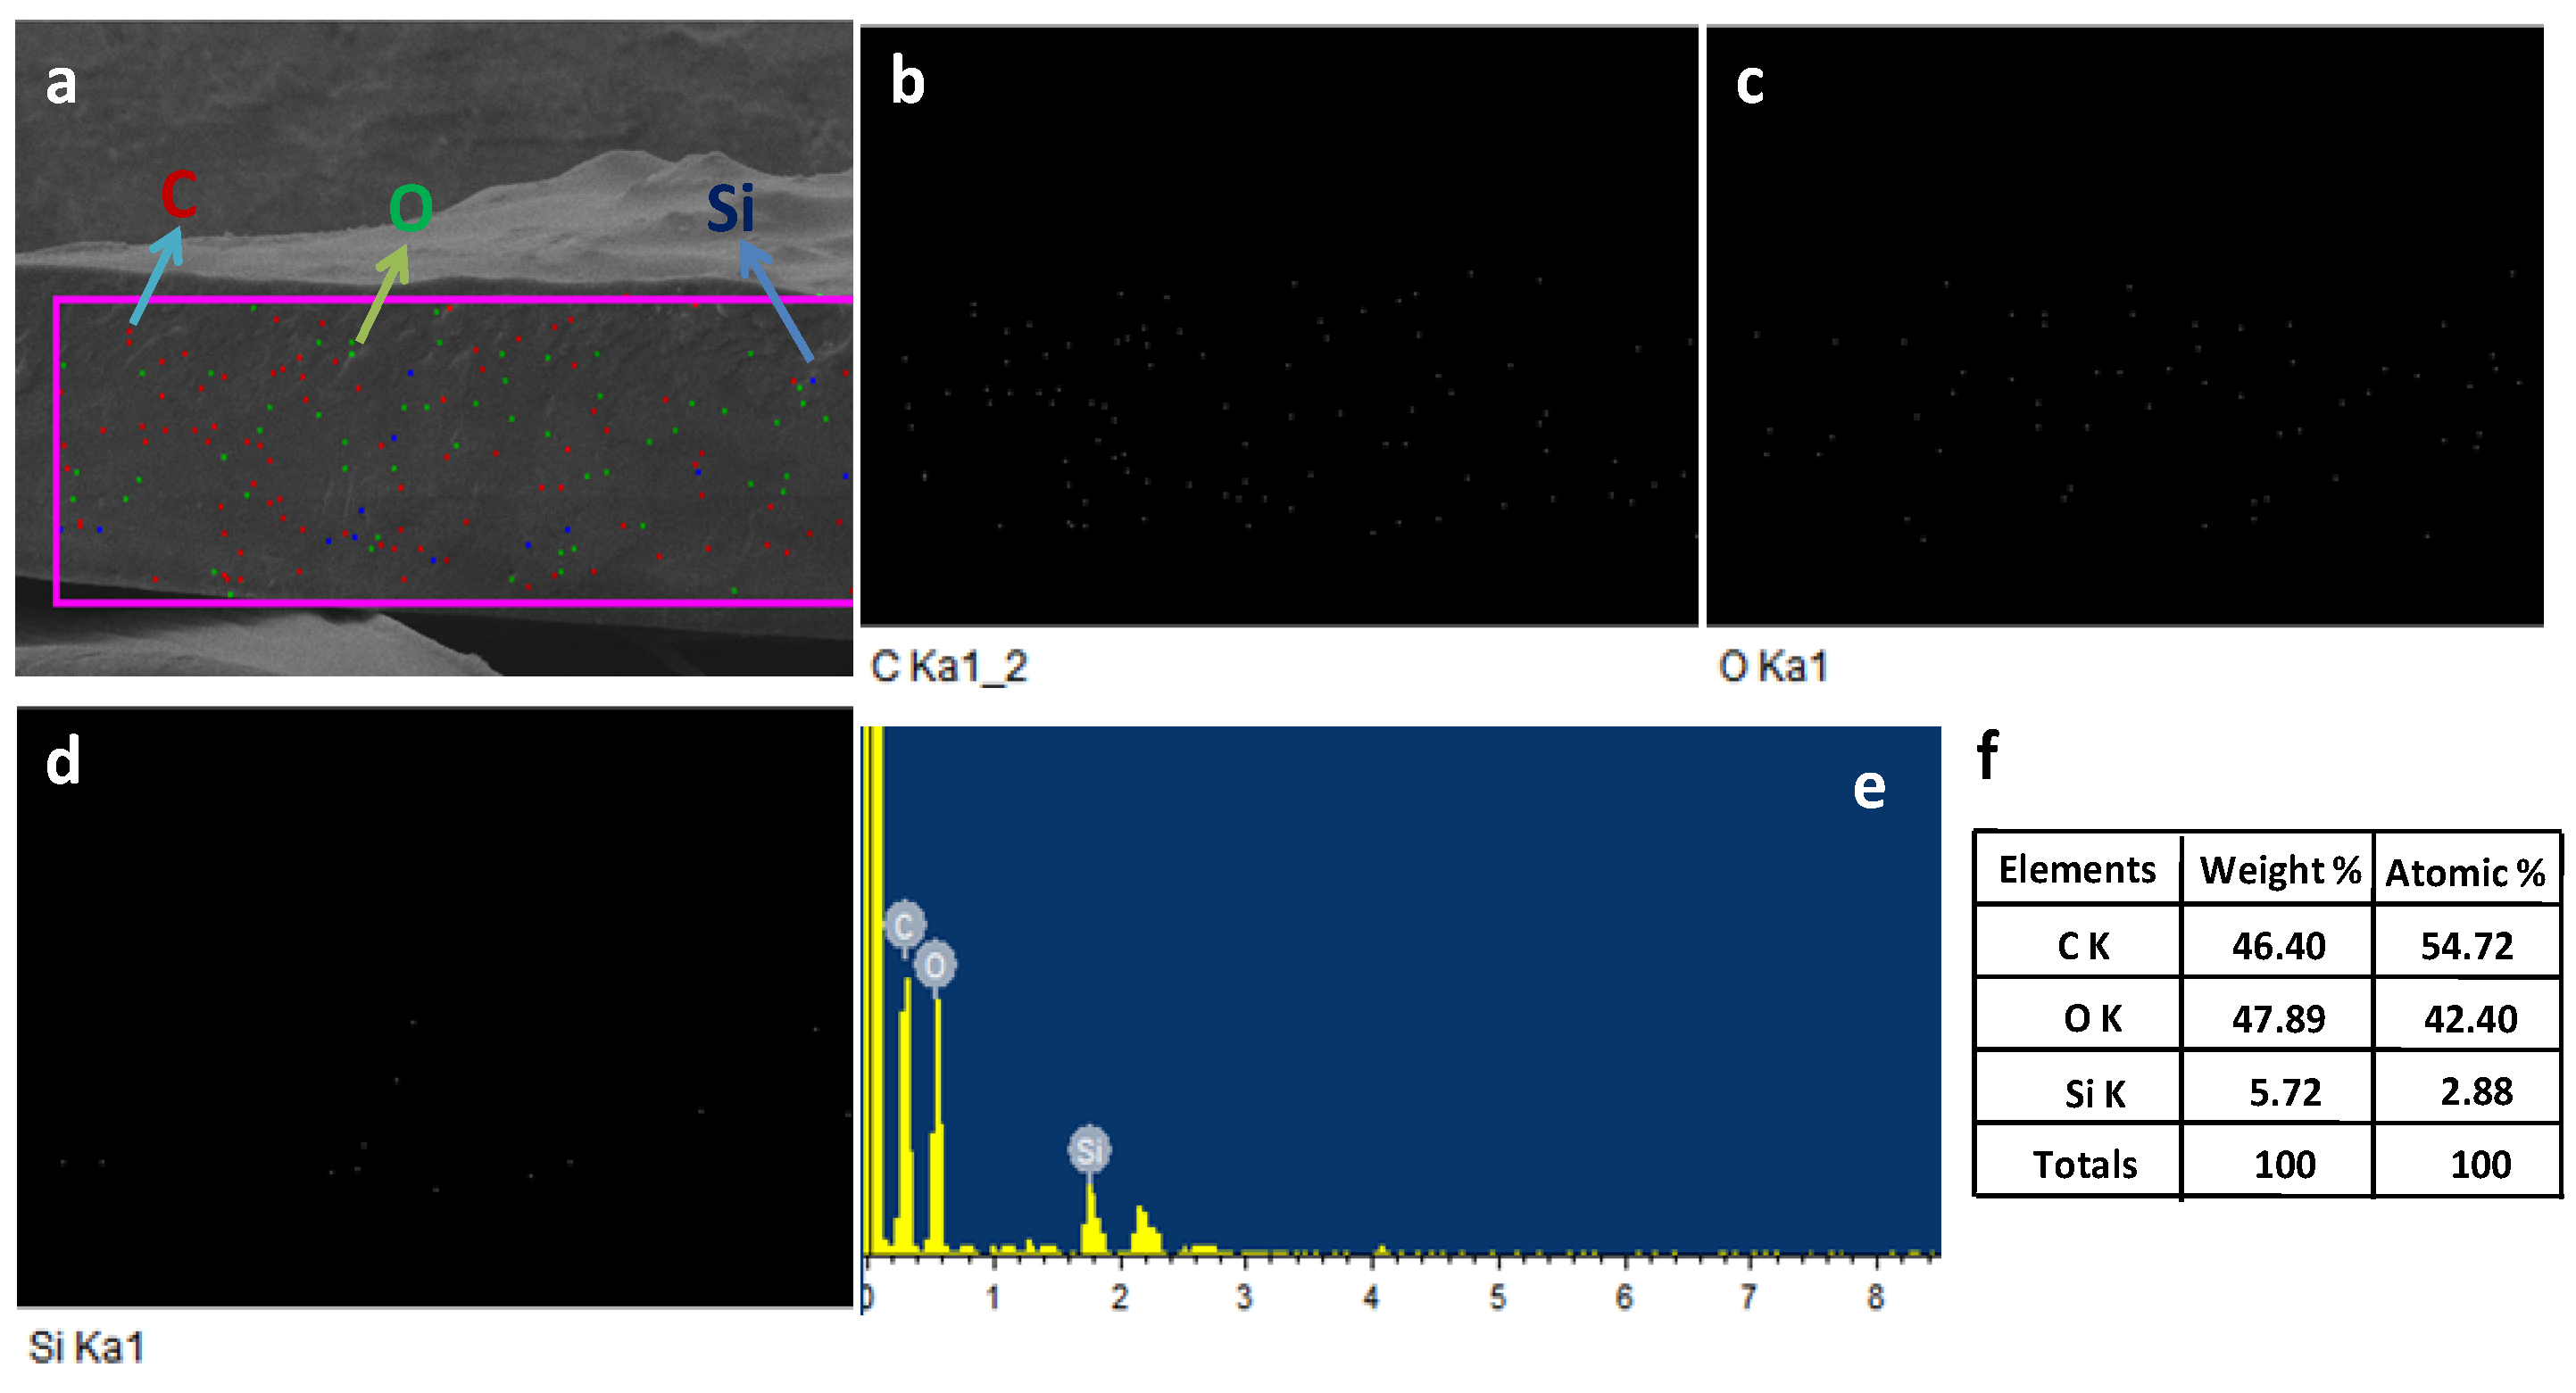
2.1. Morphological and Composition Analysis

The morphology of QPVA/5%FS nanocomposite membrane was analyzed using FESEM. To identify whether the distribution of the fumed silica nanoparticles in the QPVA matrix was uniform, it was analyzed by cross-sectional imaging, as shown in Figure 1a. The morphology of the membrane was characterized by a smooth surface with a uniform dispersion of fumed silica nanoparticles that were <50 nm in size. To further evaluate the nanocomposites, their elemental mapping and compositions were studied by EDX. The elemental mapping of the QPVA/5%FS nanocomposite membrane is shown in Figure 1b–d. The fumed silica nanoparticles were barely discernable as different colored dots and appeared evenly distributed, as highlighted in Figure 1a. However, the number elements (C, O and Si) distributed in the membrane matrix were clearly viewed as light dots in different morphological assessments. The elemental composition of the QPVA/5%FS nanocomposite was identified by an EDX spectrum, as shown in Figure 1e. The weight percentage of the elemental C (46.40 wt %), O (47.89 wt %) and Si (5.72 wt %) composition further suggests the high uniformity of the QPVA/5%FS nanocomposite membrane and its lack of impurities.
Figure 1. (a) Cross-sectional image of a QPVA/5%FS nanocomposite membrane and the scanning area for EDX mapping; (b) EDX mapping of carbon; (c) EDX mapping of oxygen; (d) EDX mapping of silica; (e) EDX graph of QPVA/5%FS; (f) Percentage of elements present in QPVA/5%FS nanocomposite membranes.
Energies 09 00015 g001

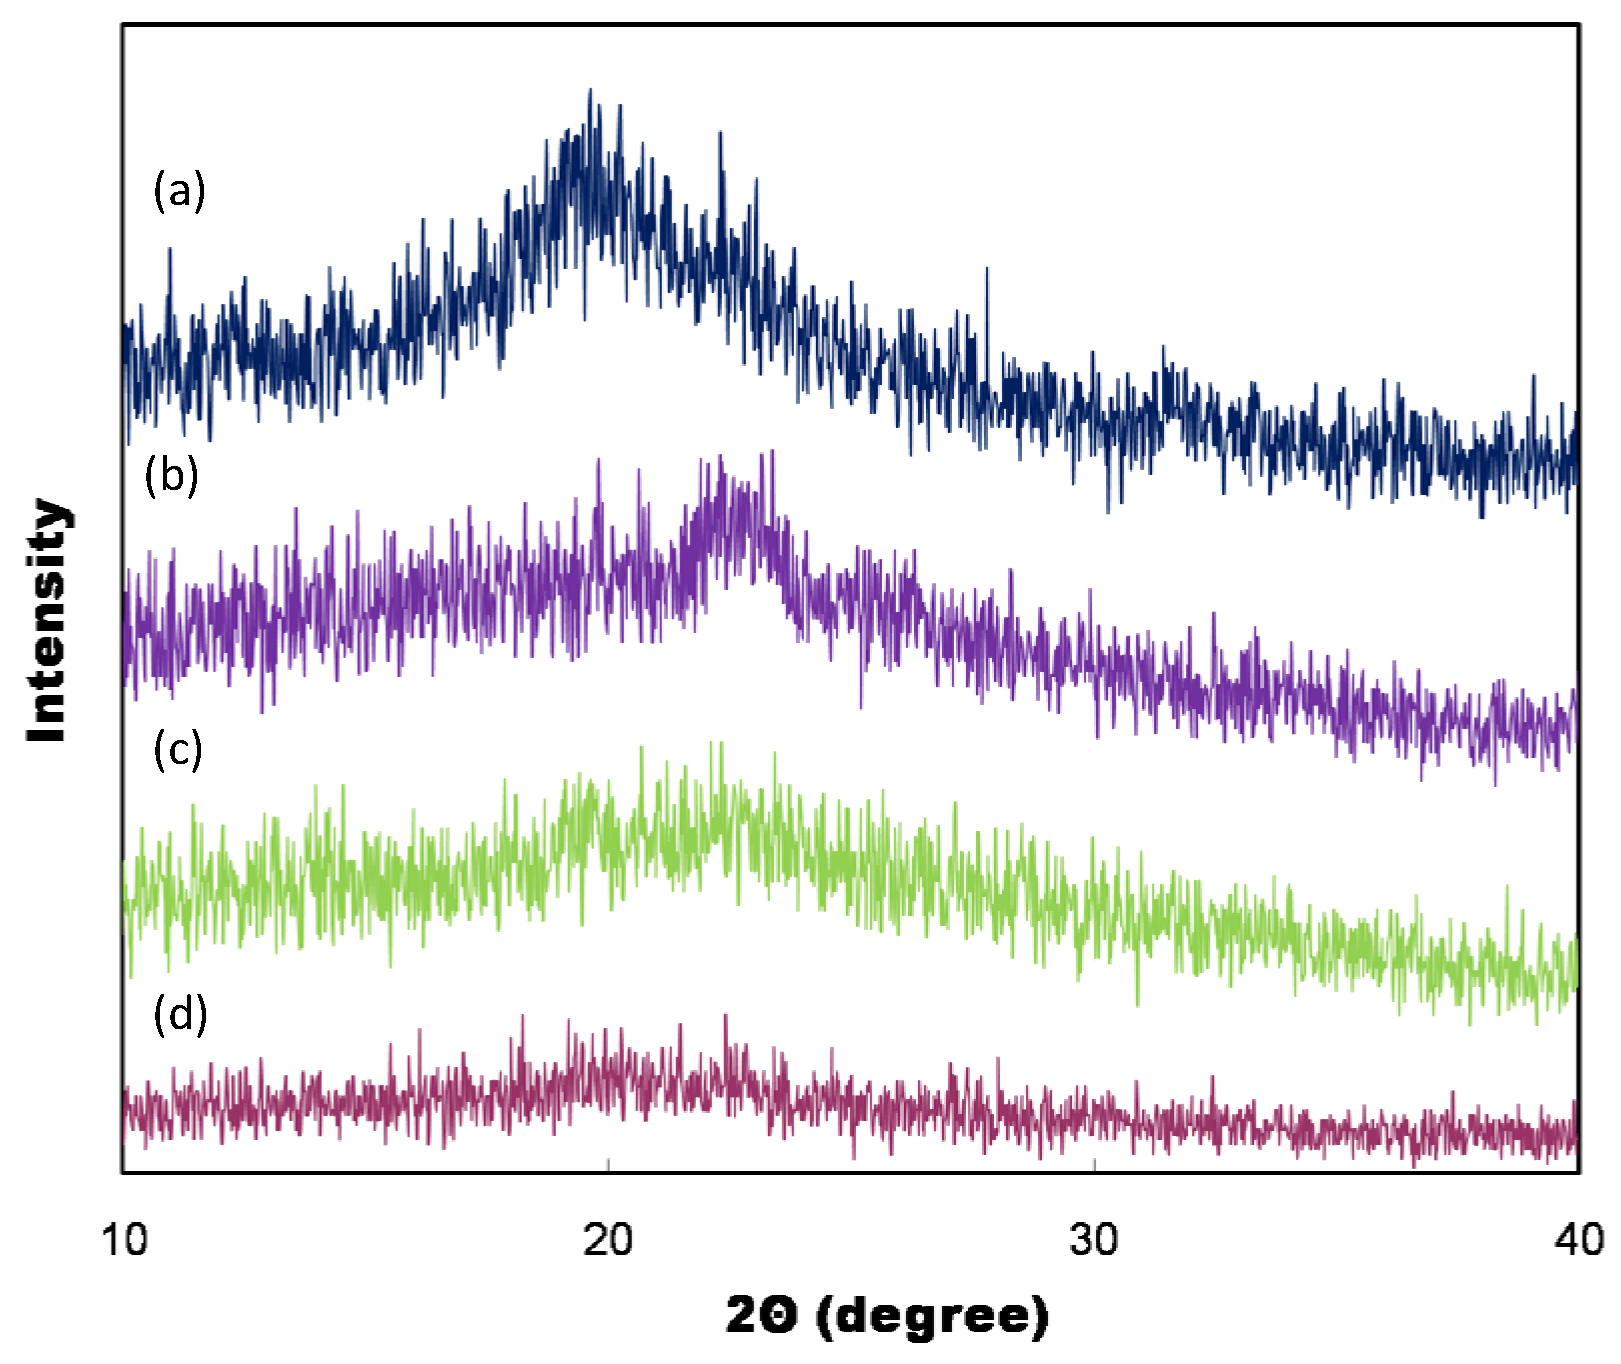
2.2. Structural Analysis
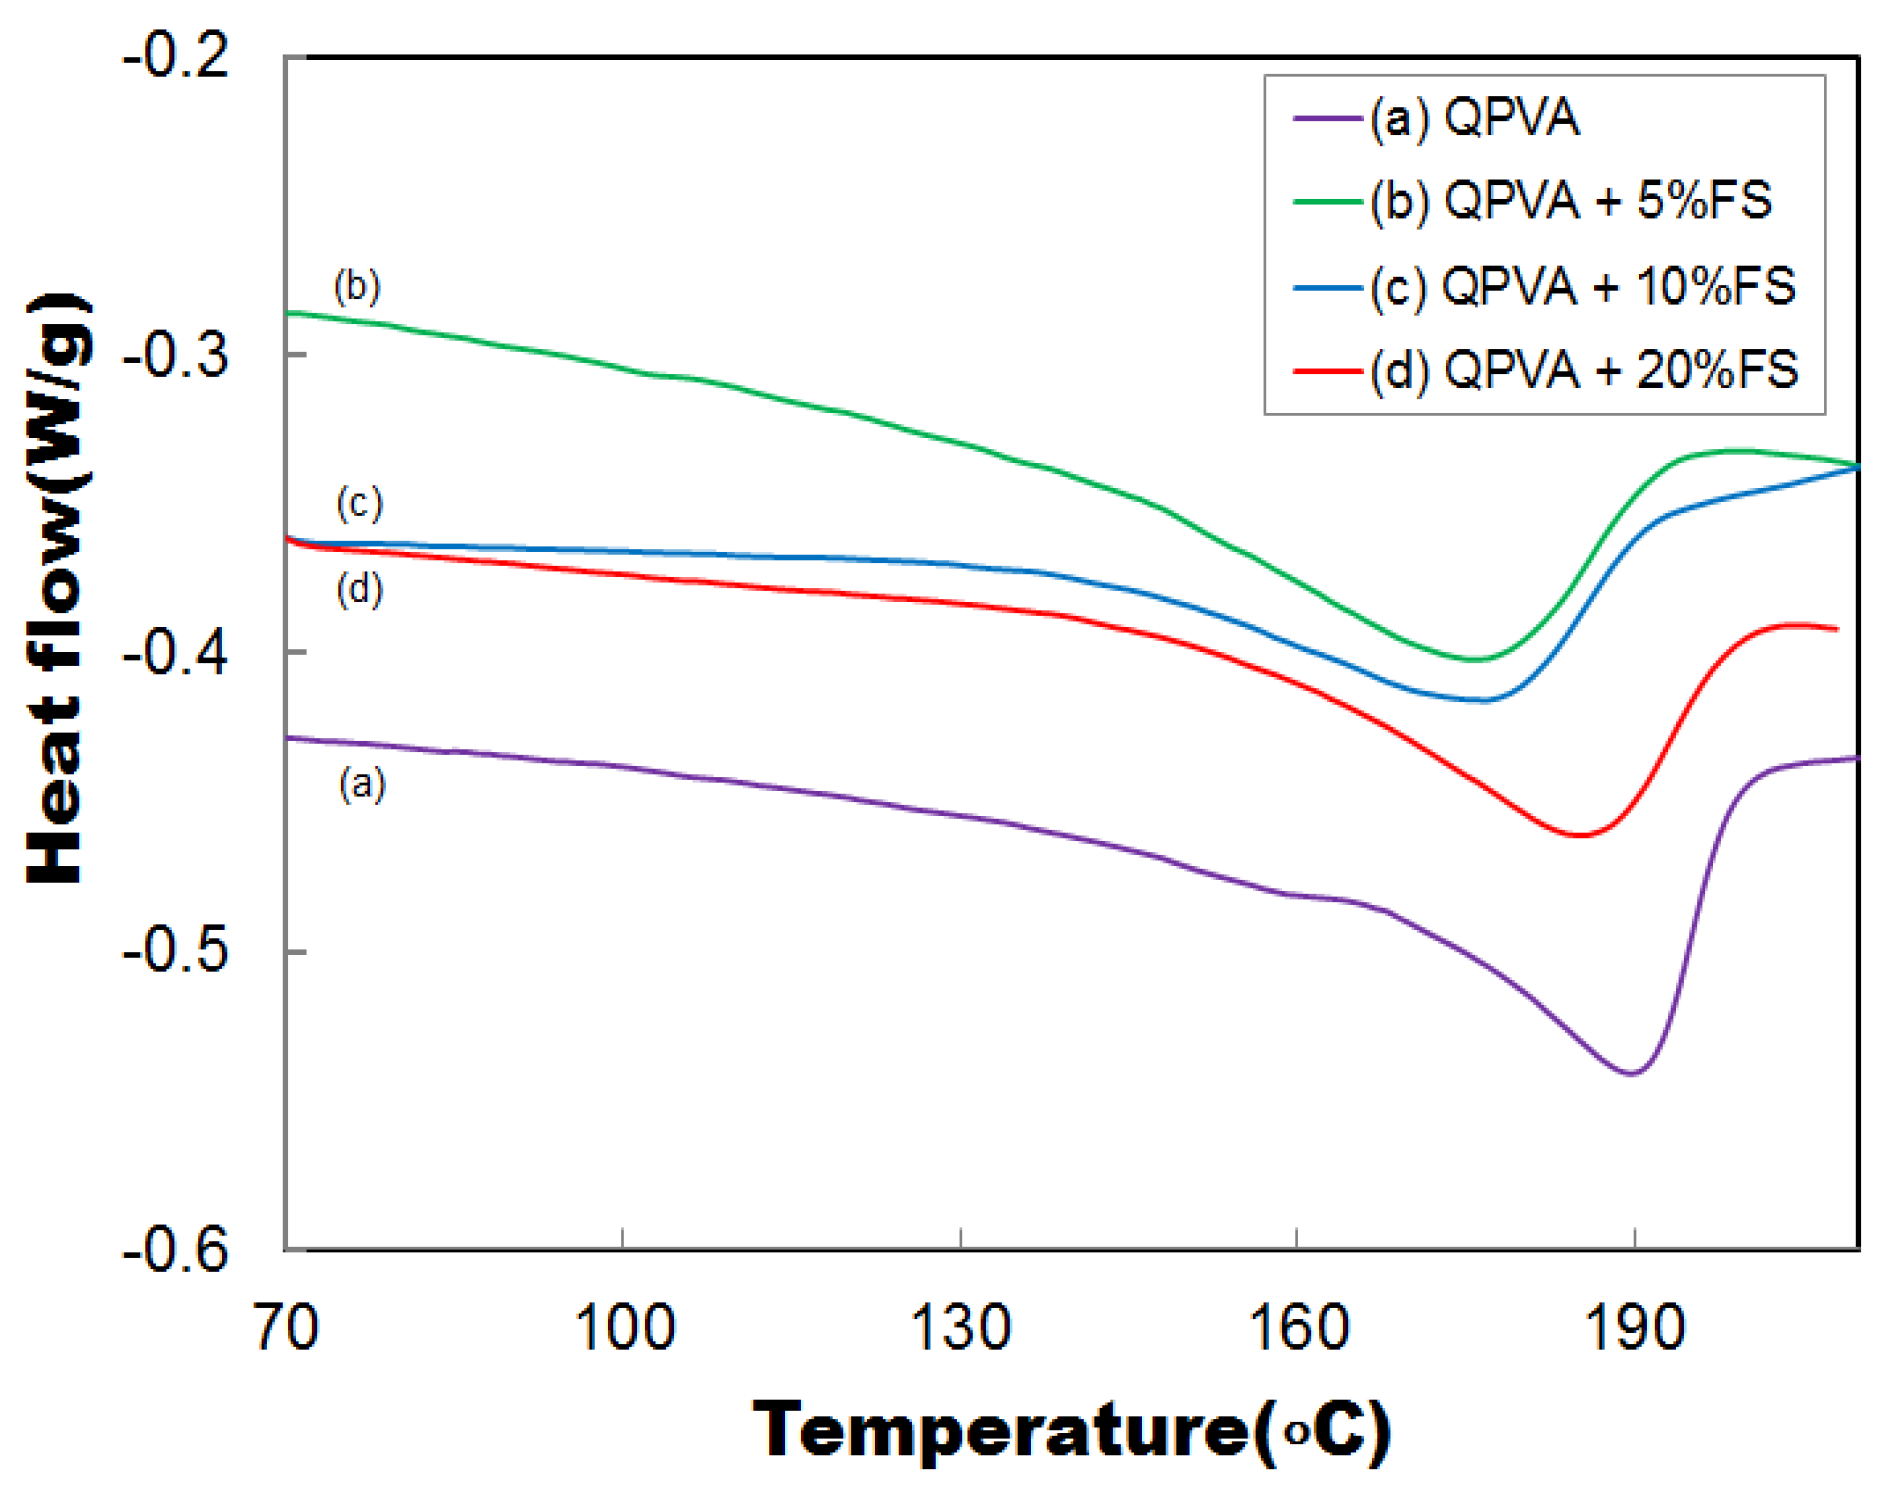
The X-ray diffraction (XRD) graphs corresponding to the pristine and various fumed silica-incorporated QPVA membranes are shown in Figure 2. The pristine QPVA film showed a low intensity XRD peak at 2θ of 19°–20°, corresponding to the (101) plane of the PVA crystal, as previously described [28,29,30]. After the addition of 5% fumed silica to the QPVA matrix, no well-defined, identical diffraction peak was observed, which confirms its noteworthy, amorphous behavior. After increasing the fumed silica concentration to 20%, the characteristic peak shifted to 2θ at 22°, possibly due to polymer nucleation between the fumed silica and QPVA matrix.
Figure 2. XRD graphs of (a) QPVA; (b) QPVA/5% FS; (c) QPVA/10% FS and (d) QPVA/20% FS.
Energies 09 00015 g002
To further quantify the nanocomposite crystallinity, differential scanning calorimetry (DSC) was used to determine the melting enthalpies of the polymer crystals during different heating cycles. The thermographs of the pristine and various fumed silica-incorporated QPVA nanocomposite membranes were studied by DSC as shown in Figure 3.
Figure 3. DSC graphs of (a) QPVA; (b) QPVA/5% FS; (c) QPVA/10% FS and (d) QPVA/20% FS.
Energies 09 00015 g003
The crystallinity and melting entropy values of the pristine and QPVA/FS nanocomposite membranes are shown in Table 1. The pristine QPVA shows a significant endothermic peak at 190 °C that corresponds to the QPVA crystallite melting temperature. The addition of 5%, 10% and 20% fumed silica into the QPVA matrix resulted in endothermic peaks at 176, 177 and 185 °C, respectively. The decrease in endothermic temperature in the fumed silica-containing QPVA matrix was related to its loosely aligned crystallite structure due to interruptions in polymer chain alignment caused by the presence of the fumed silica nanoparticles [17]. Therefore, the polymer chain diffusion and nucleation rates were responsible for the enhancement of crystallization. The melting entropy value of QPVA/5%FS decreased due to the decreased crystallinity of QPVA. The polymer crystallinity of QPVA/5%FS was 8.71%, which was significantly reduced relative to that of the pristine QPVA membrane, which was 10.56%. The fumed silica particles interrupted polymer chain alignment and reduced polymer crystallinity [31]. Increasing the amorphous phase of the polymer matrix in the nanocomposite might enhance the ionic conductivity in the free volume region [29]. However, when increasing the fumed silica percentage to 10% and 20%, the crystallinity of the nanocomposite increased to 10.03% and 12.31%, respectively. The fumed silica induced crystalline polymer nucleation, leading to increased entropic energy, as shown in Table 1. This trend correlated with the XRD data, as shown in Figure 2.
Table 1. Entropy and crystallinity values of pristine QPVA and QPVA nanocomposite membranes with different percentages of fumed silica.
Nanocomposite MembranesTm (°C)Entropy ΔH (J/g)Crystallinity (%)
QPVA189.8414.2610.56
QPVA/5% FS176.6811.188.71
QPVA/10% FS177.1712.1910.03
QPVA/20% FS185.2113.3012.31

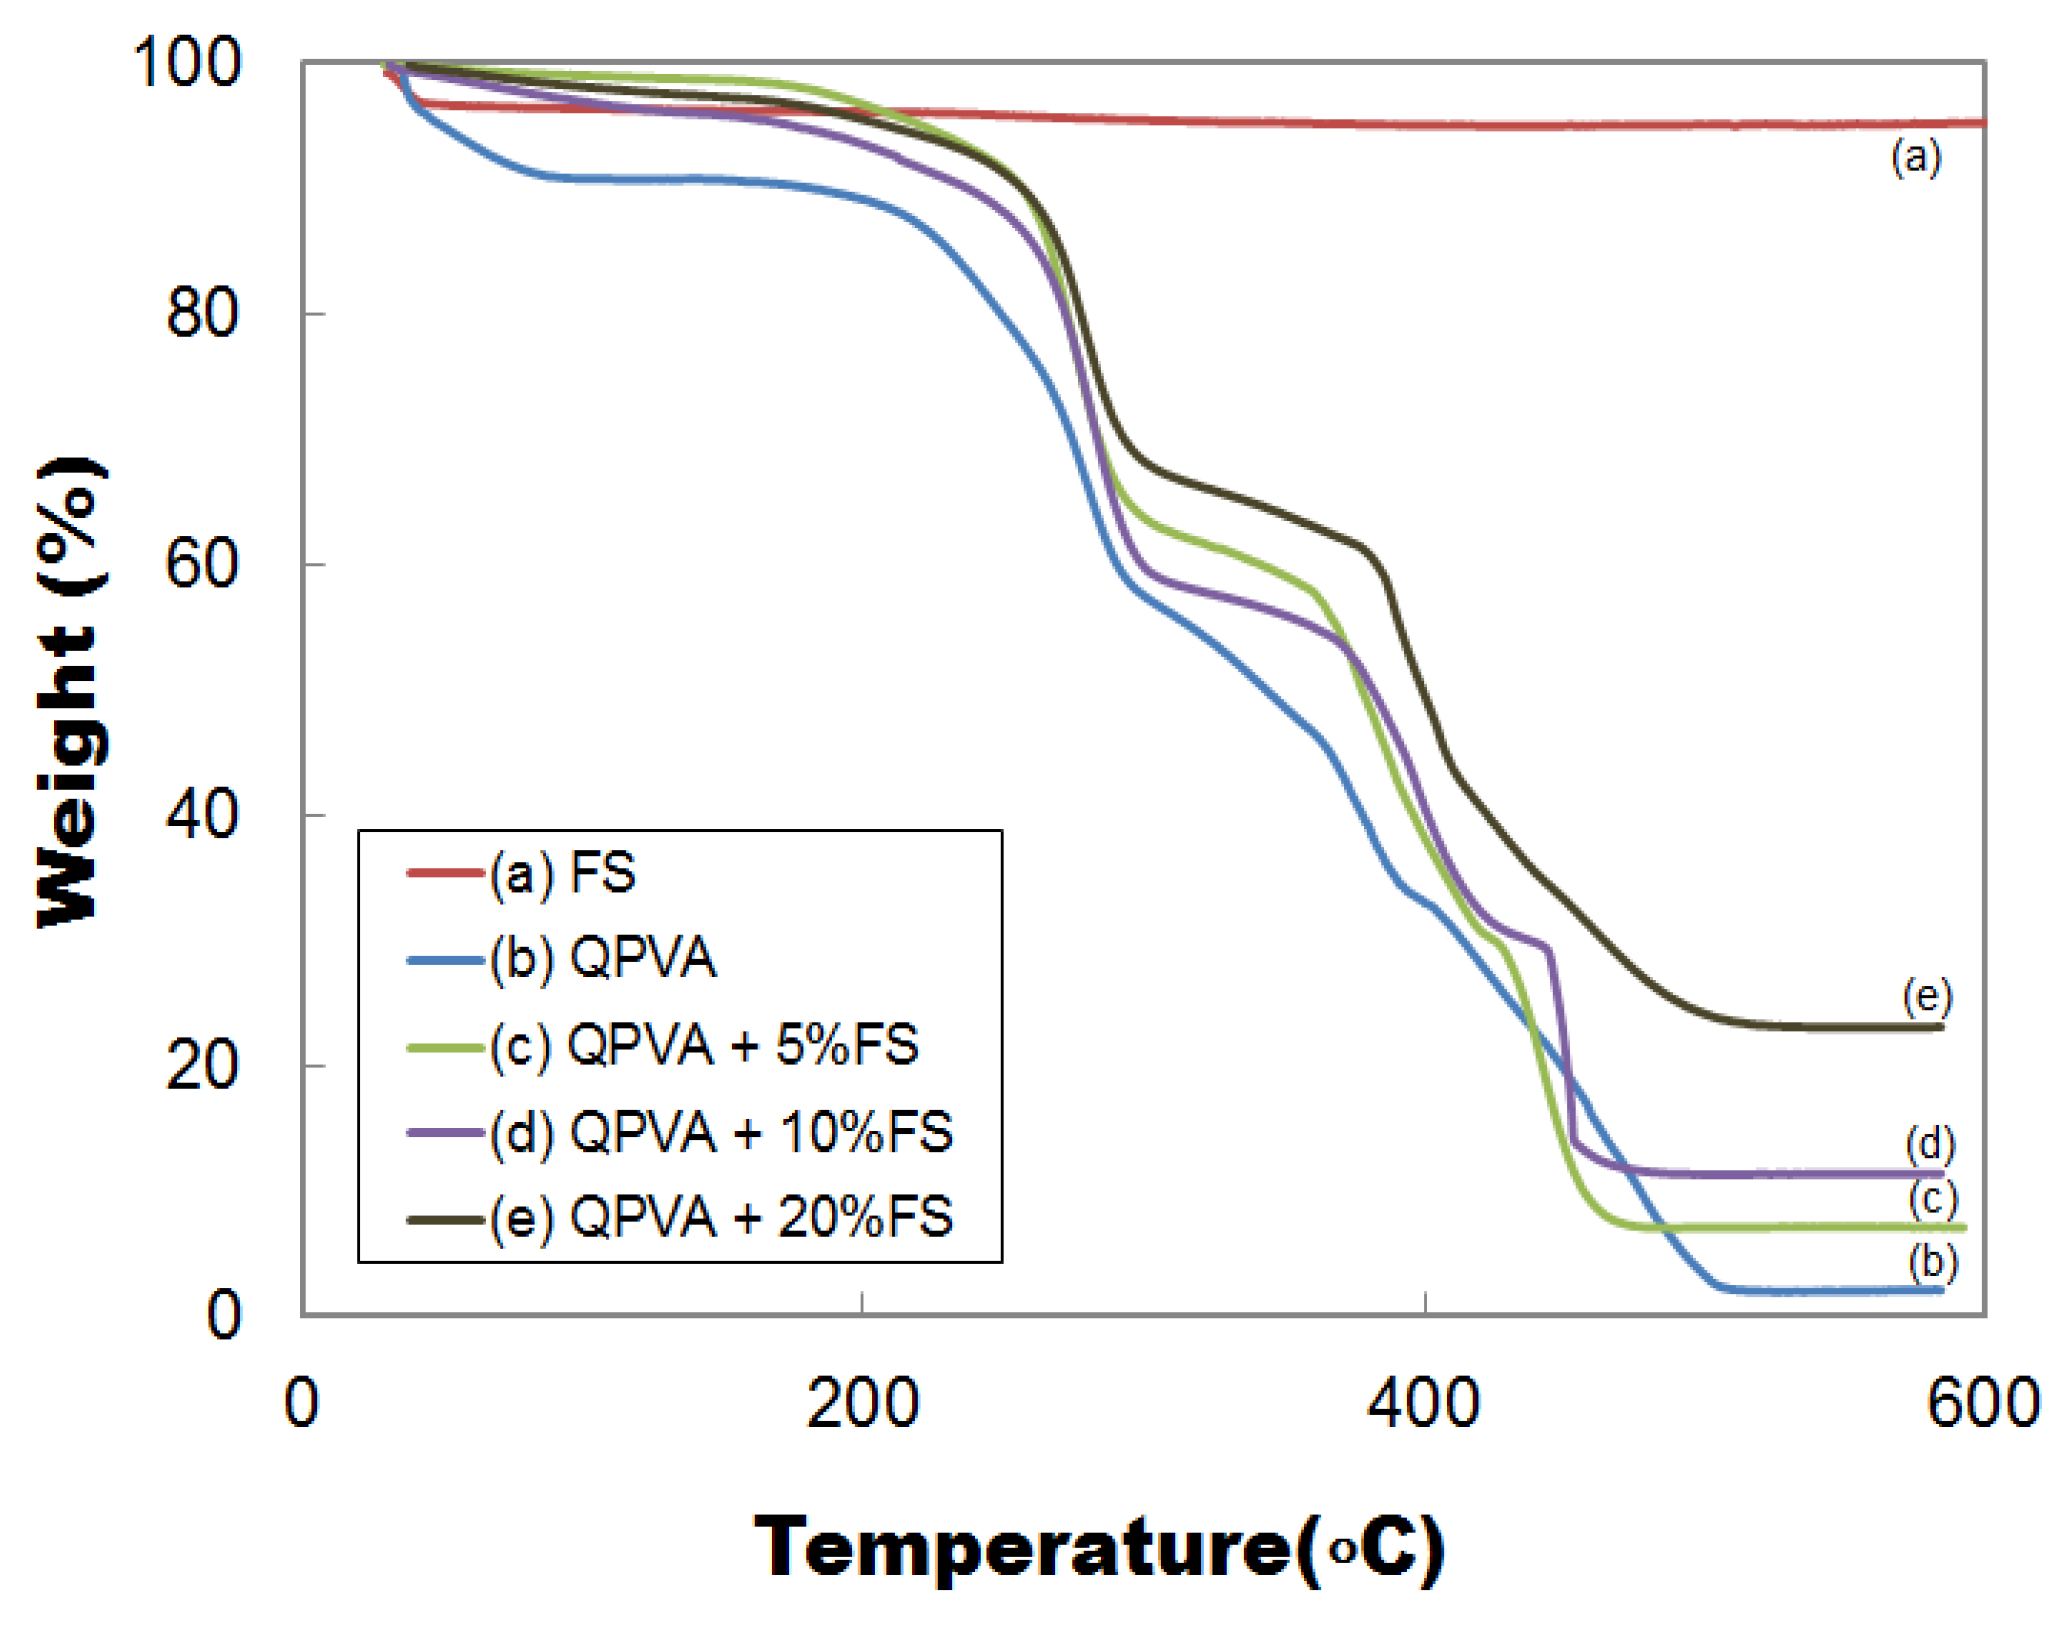
2.3. Thermal Analysis

The thermogravimetric analyses (TGA) of fumed silica, QPVA and the various fumed silica-incorporated QPVA matrixes (5%, 10%, 20%) are shown in Figure 4a–e. The TGA curve of fumed silica did not exhibit any significant weight loss up to 600 °C due to the high melting point of silica particles (Figure 4a). Three major weight loss regions were obtained when evaluating the QPVA and QPVA/FS nanocomposite membranes. The first weight loss of QPVA occurred at a temperature of 50–110 °C and was due to the evaporation of water molecules, which accounted for 6–7 wt %. The second transition region was at 220–300 °C, with a weight loss of approximately 30–40 wt % and occurred due to the degradation of the QPVA polymer matrix. This was due to the loss of an aliphatic group embedded in the backbone of the polymer, followed by the loss of OH ions from the PVA matrix [32]. The weight loss temperature of the third phase was between 350 and 560 °C and represented the main chain cleavage and side chain cleavage of the QPVA functional group due to a thermal cracking reaction. With the addition of fumed silica to the QPVA matrix, three weight loss stages were also observed, which were similar to those of pristine QPVA. However, the percentages of weight loss from the nanocomposites decreased by 5–10 wt % relative to those of pristine QPVA when the concentration of fumed silica in the QPVA matrix increased. Accordingly, the weight loss trends of the nanocomposites were less intense at higher temperatures and could be controlled by increasing the silica concentration. The suppression of thermal degradation was due to the use of fumed silica as a nanofiller, which restricted the mobility of the QPVA chain and prohibited free radical transfer [29]. Therefore, the thermal stability of the QPVA/FS nanocomposite membrane was improved relative to that of the pristine QPVA due to the addition of the fumed silica filler to the polymer matrix.
Figure 4. TGA graphs of (a) Fumed silica; (b) QPVA; (c) QPVA/5% FS; (d) QPVA/10% FS and (e) QPVA/20% FS.
Energies 09 00015 g004

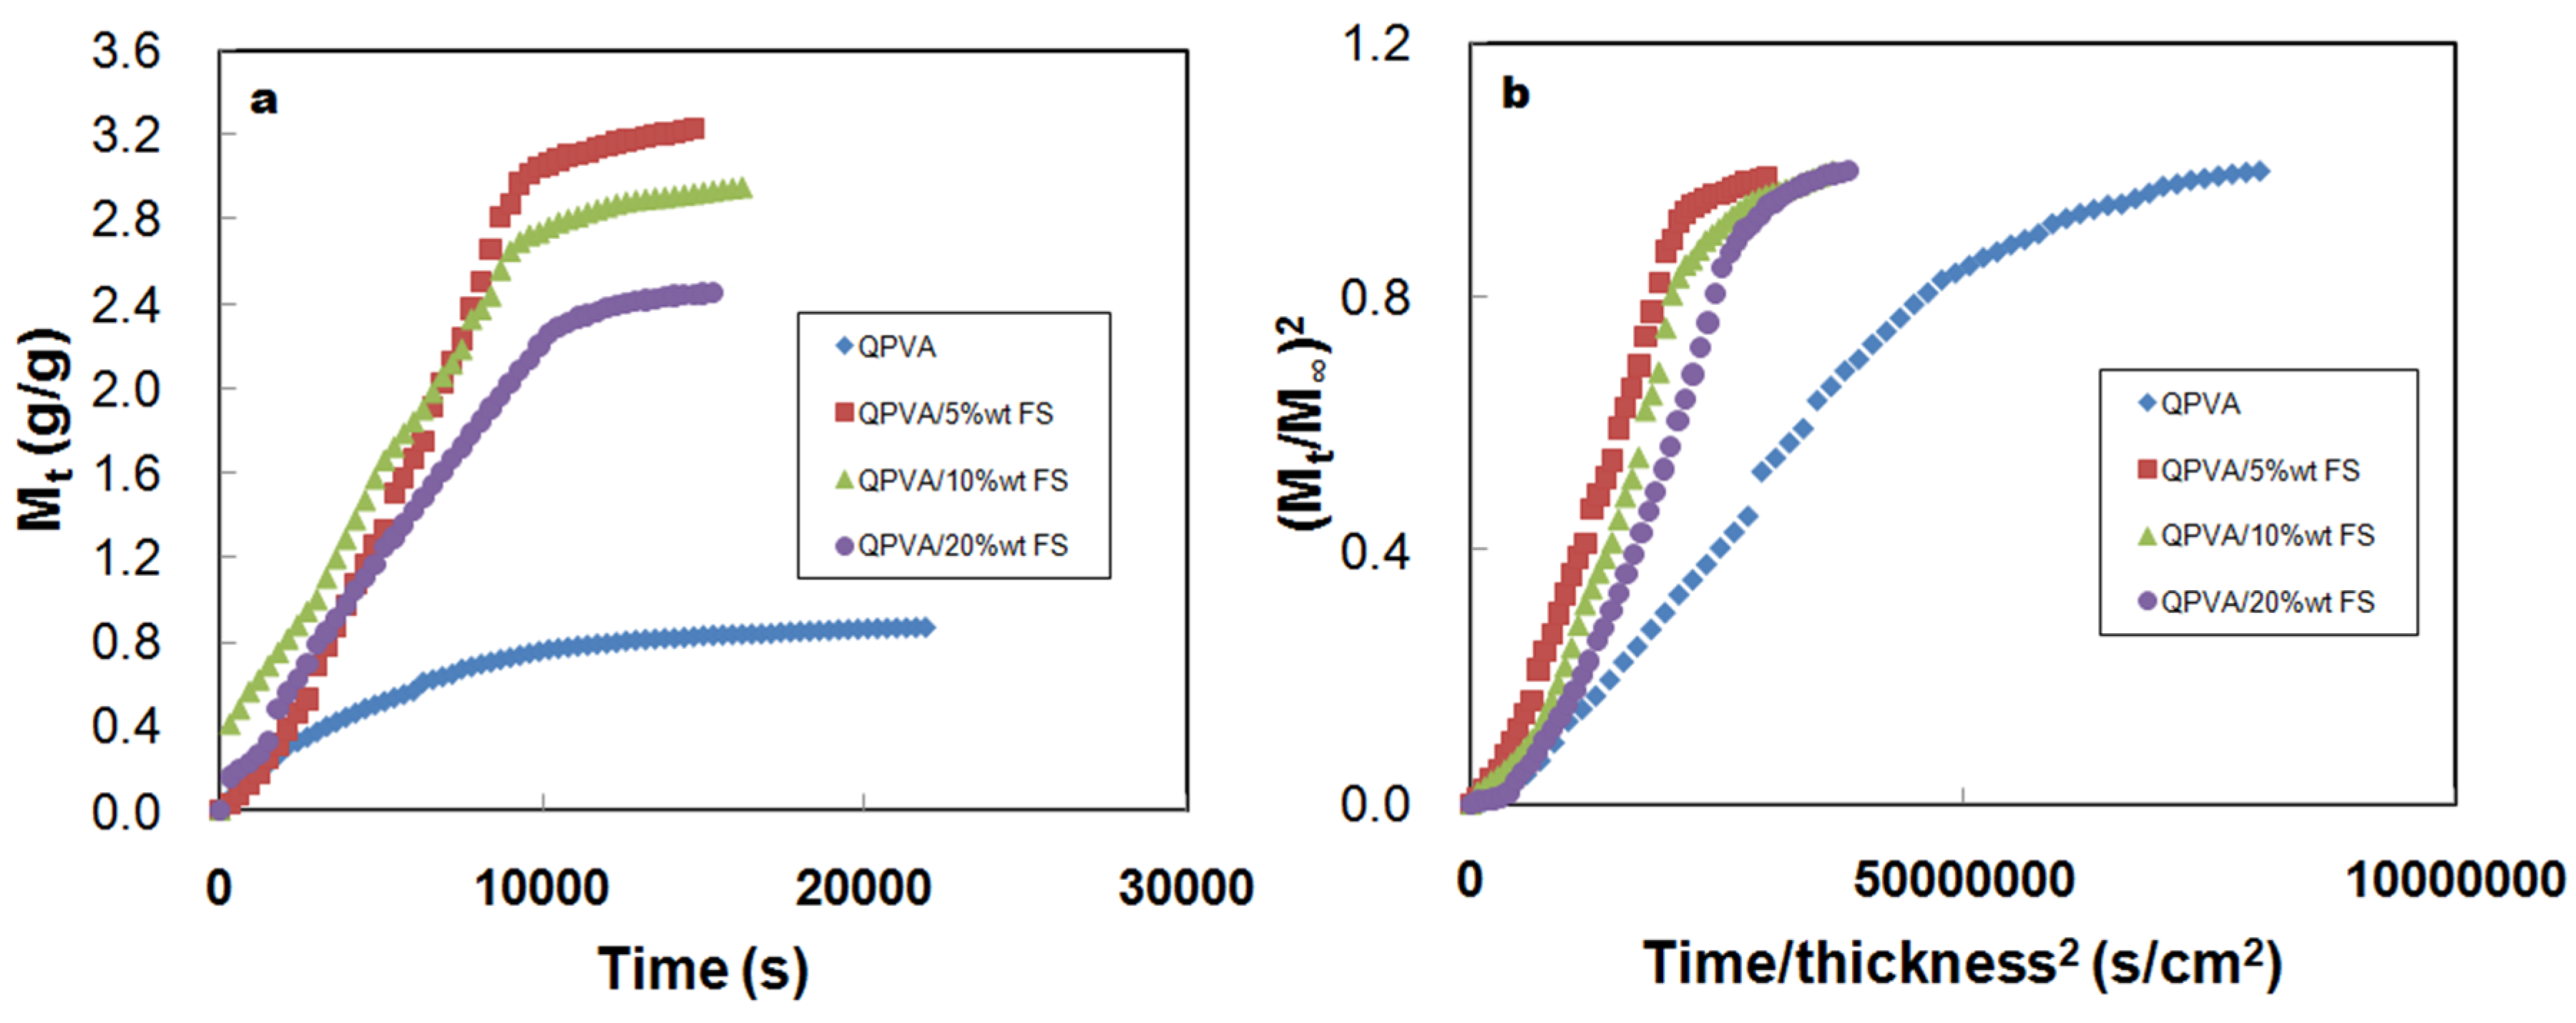
2.4. Water Vapor Uptake and Diffusion Coefficients

The water vapor uptake of pristine QPVA and the QPVA/FS nanocomposite membranes was studied at different elapsed times at room temperature, as shown in Figure 5a. Determining the water vapor uptake behavior of the nanocomposites was important for understanding the status of the water that was present in the membrane because it strongly affected ionic conductivity [13]. The average water vapor uptake of the pristine QPVA membrane was 0.867 g/g. However, the uptake increased to 3.22, 2.95 and 2.45 g/g for QPVA/5%FS, QPVA/10%FS and QPVA/20%FS, respectively. The membrane water uptake was mainly based on hydrophilicity and plasticization [26]. In the 5% fumed silica QPVA matrix, the fumed silica interrupted the PVA crystal alignment and led to an increased amorphous region. The high amorphous region of QPVA/5% could increase the fractional free volume and promote water vapor sorption. However, increasing the fumed silica concentration to 10% and 20%, resulted in a loss of chain mobility and unfolding, which led to higher crystallinity (Table 1) and lower sorption capacity. Therefore, there was increased efficiency of water vapor uptake in the QPVA/5%FS nanocomposite versus the pristine QPVA and other nanocomposite membranes. These results demonstrate that the water vapor uptake was related to isolated hydroxyl molecules and not an effect of diffusion coupling or polymer plasticization [31].
Figure 5. (a) Water vapor uptake at different elapsed times; and (b) water relative uptake studies as a function of the square root of time divided by membrane thickness for pristine QPVA, and the QPVA/5% FS, QPVA/10% FS and QPVA/20% FS nanocomposite membranes.
Energies 09 00015 g005
The transition regions of the relative water uptake plots are shown in Figure 5b. The diffusion rate of pristine QPVA was 3.86 × 10⁻⁶ cm2/s whereas the value was increased to 9.85 × 10⁻⁶ cm2/s for the QPVA/5%FS nanocomposite membrane. This diffusivity enhancement was due to the greater amorphous region in the polymer matrix in the QPVA/5%FS nanocomposite (Table 1). When increasing the fumed silica percentage to 10% and 20% in the QPVA matrix, the diffusion rate decreased to 9.63 × 10⁻⁶ cm2/s and 8.34 × 10⁻⁶ cm2/s, respectively. The decreasing diffusion rate in response to the increasing fumed silica percentage in the QPVA matrix resulted from a suppression of chain mobility, which induced a strong rigid structure in the polymer crystallite and prohibited the penetration of water molecules [24]. In addition, the water uptake not only occurred via Fickian diffusion but was also based on polymer chain relaxation [25]. However, increasing the fumed silica concentration induced the relaxation of the nanocomposite membranes. Therefore, the optimized QPVA/5%FS membrane not only exhibited increased diffusivity but also possessed an enhanced ionic transport pathway, which increased its ionic conductivity.

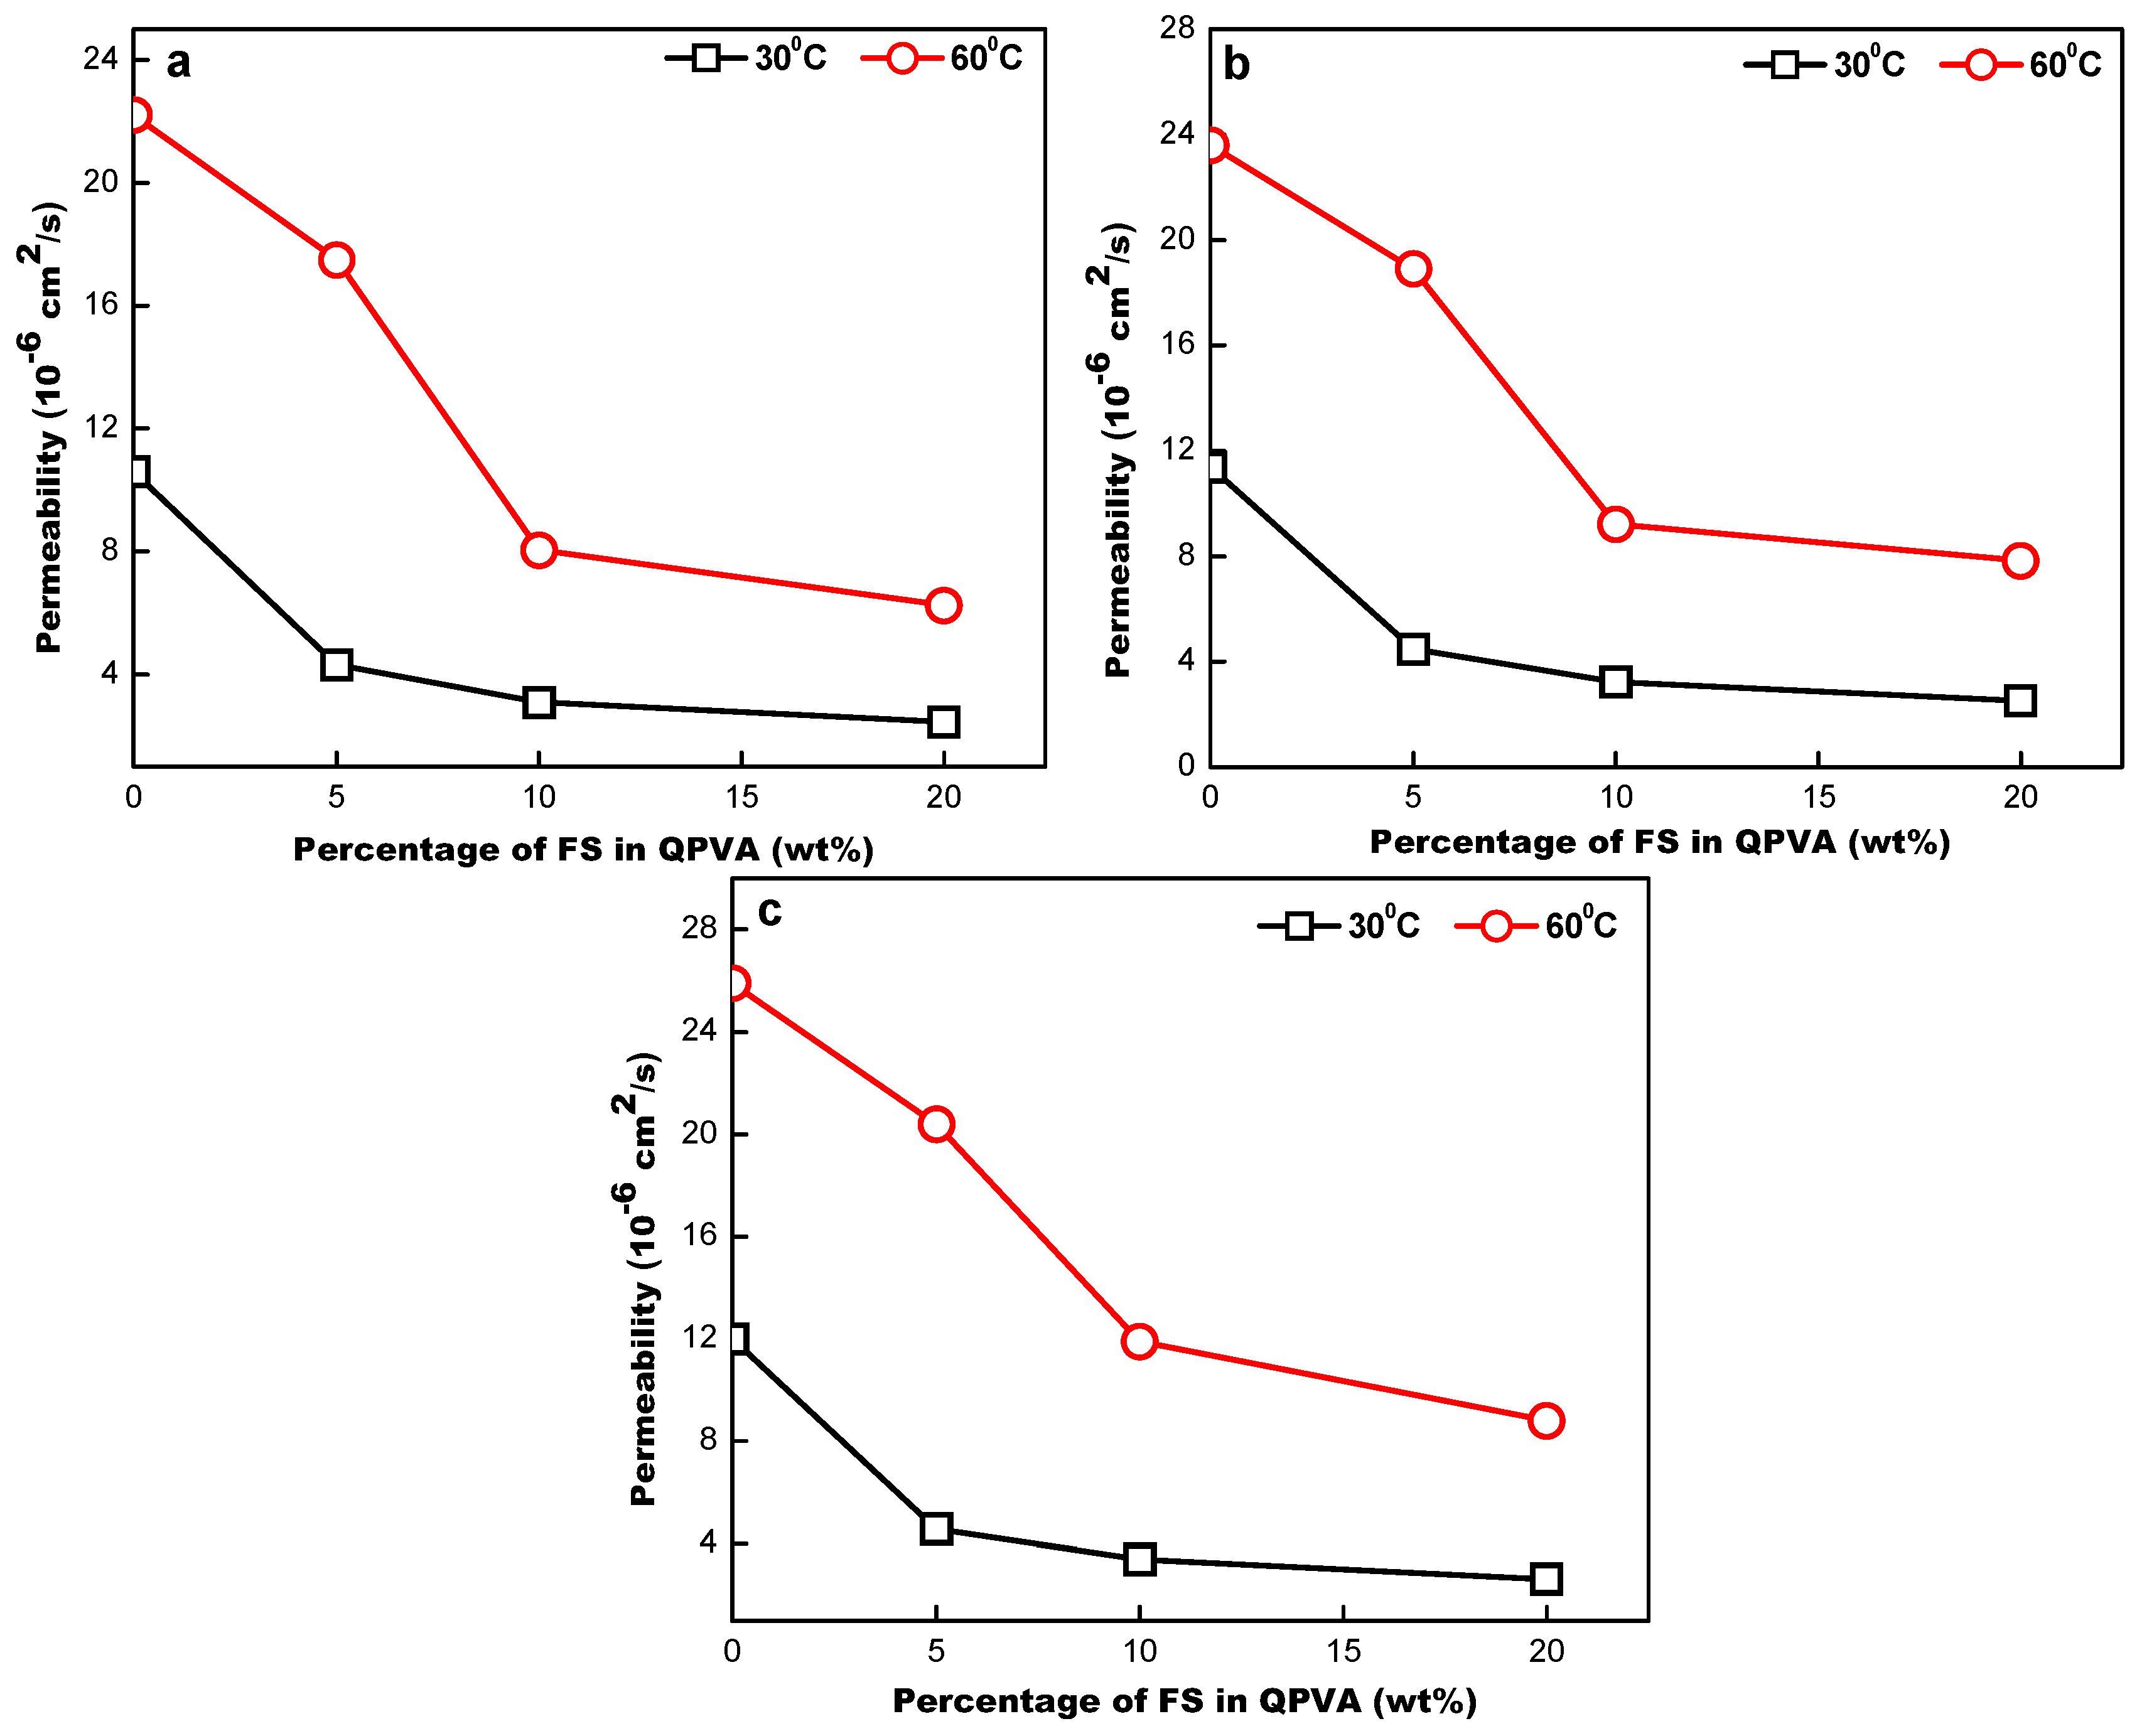
2.5. Methanol Permeability from Aqueous Solutions

Figure 6a–c show the methanol permeabilities of pristine QPVA and the QPVA/FS nanocomposite membranes. These were studied using different methanol concentrations (1 M, 2 M and 4 M) at 30 °C and 60 °C. Methanol permeability is a key factor that strongly affects fuel loss and oxygen reduction reactions during methanol oxidation [33]. At 30 °C, the methanol permeabilities of pristine QPVA were 10.6 × 10⁻⁶ cm2/s, 11.4 × 10⁻⁶ cm2/s and 12 × 10−6 cm2/s for 1 M, 2 M and 4 M methanol, respectively.
Figure 6. Methanol permeabilities of pristine QPVA and the QPVA/5% FS, QPVA/10% FS and QPVA/20% nanocomposite membranes at 30 °C and 60 °C at (a) 1 M; (b) 2 M and (c) 4 M methanol concentrations.
Energies 09 00015 g006
When increasing the methanol concentration, the permeability also increased due to enormous methanol swelling in the membrane, resulting in progressive methanol crossover. To reduce methanol permeability, different percentages of fumed silica were incorporated into the QPVA matrix. At the same temperature, the permeabilities of QPVA/5%FS were 4.33 × 10⁻⁶ cm2/s, 4.46 × 10⁻⁶ cm2/s and 4.58 × 10⁻⁶ cm2/s for 1 M, 2 M and 4 M methanol. After further increasing the concentration of fumed silica to up to 20% in the QPVA matrix, the permeability further decreased, with values of 2.47 × 10⁻⁶ cm2/s, 2.52 × 10⁻⁶ cm2/s and 2.62 × 10⁻⁶ cm2/s. These results confirm that fumed silica acted as a superior barrier to methanol. Although a more amorphous polymer matrix was obtained in the QPVA/FS composites, the free volume hole size was not sufficiently large to facilitate methanol transport. Furthermore, the tortuous path in the nanocomposite membrane resulted in an increased blockage of methanol transport and reduced the permeability due to the higher number of impermeable fumed silica particles per unit mass [34]. Kim et al., demonstrated the strong interaction between silica nanoparticles and polymer matrix, which remarkably reduced methanol permeability [35]. Our results clearly show that increasing the fumed silica percentage in the QPVA matrix suppressed methanol crossover due to the blocking of methanol transport channels. However, the methanol permeabilities of pristine QPVA and the QPVA/FS nanocomposites membranes increased when the temperature was increased to 60 °C, as shown in Figure 6a–c, because the methanol diffusion rate and polymeric free volume both increased at the higher temperature.

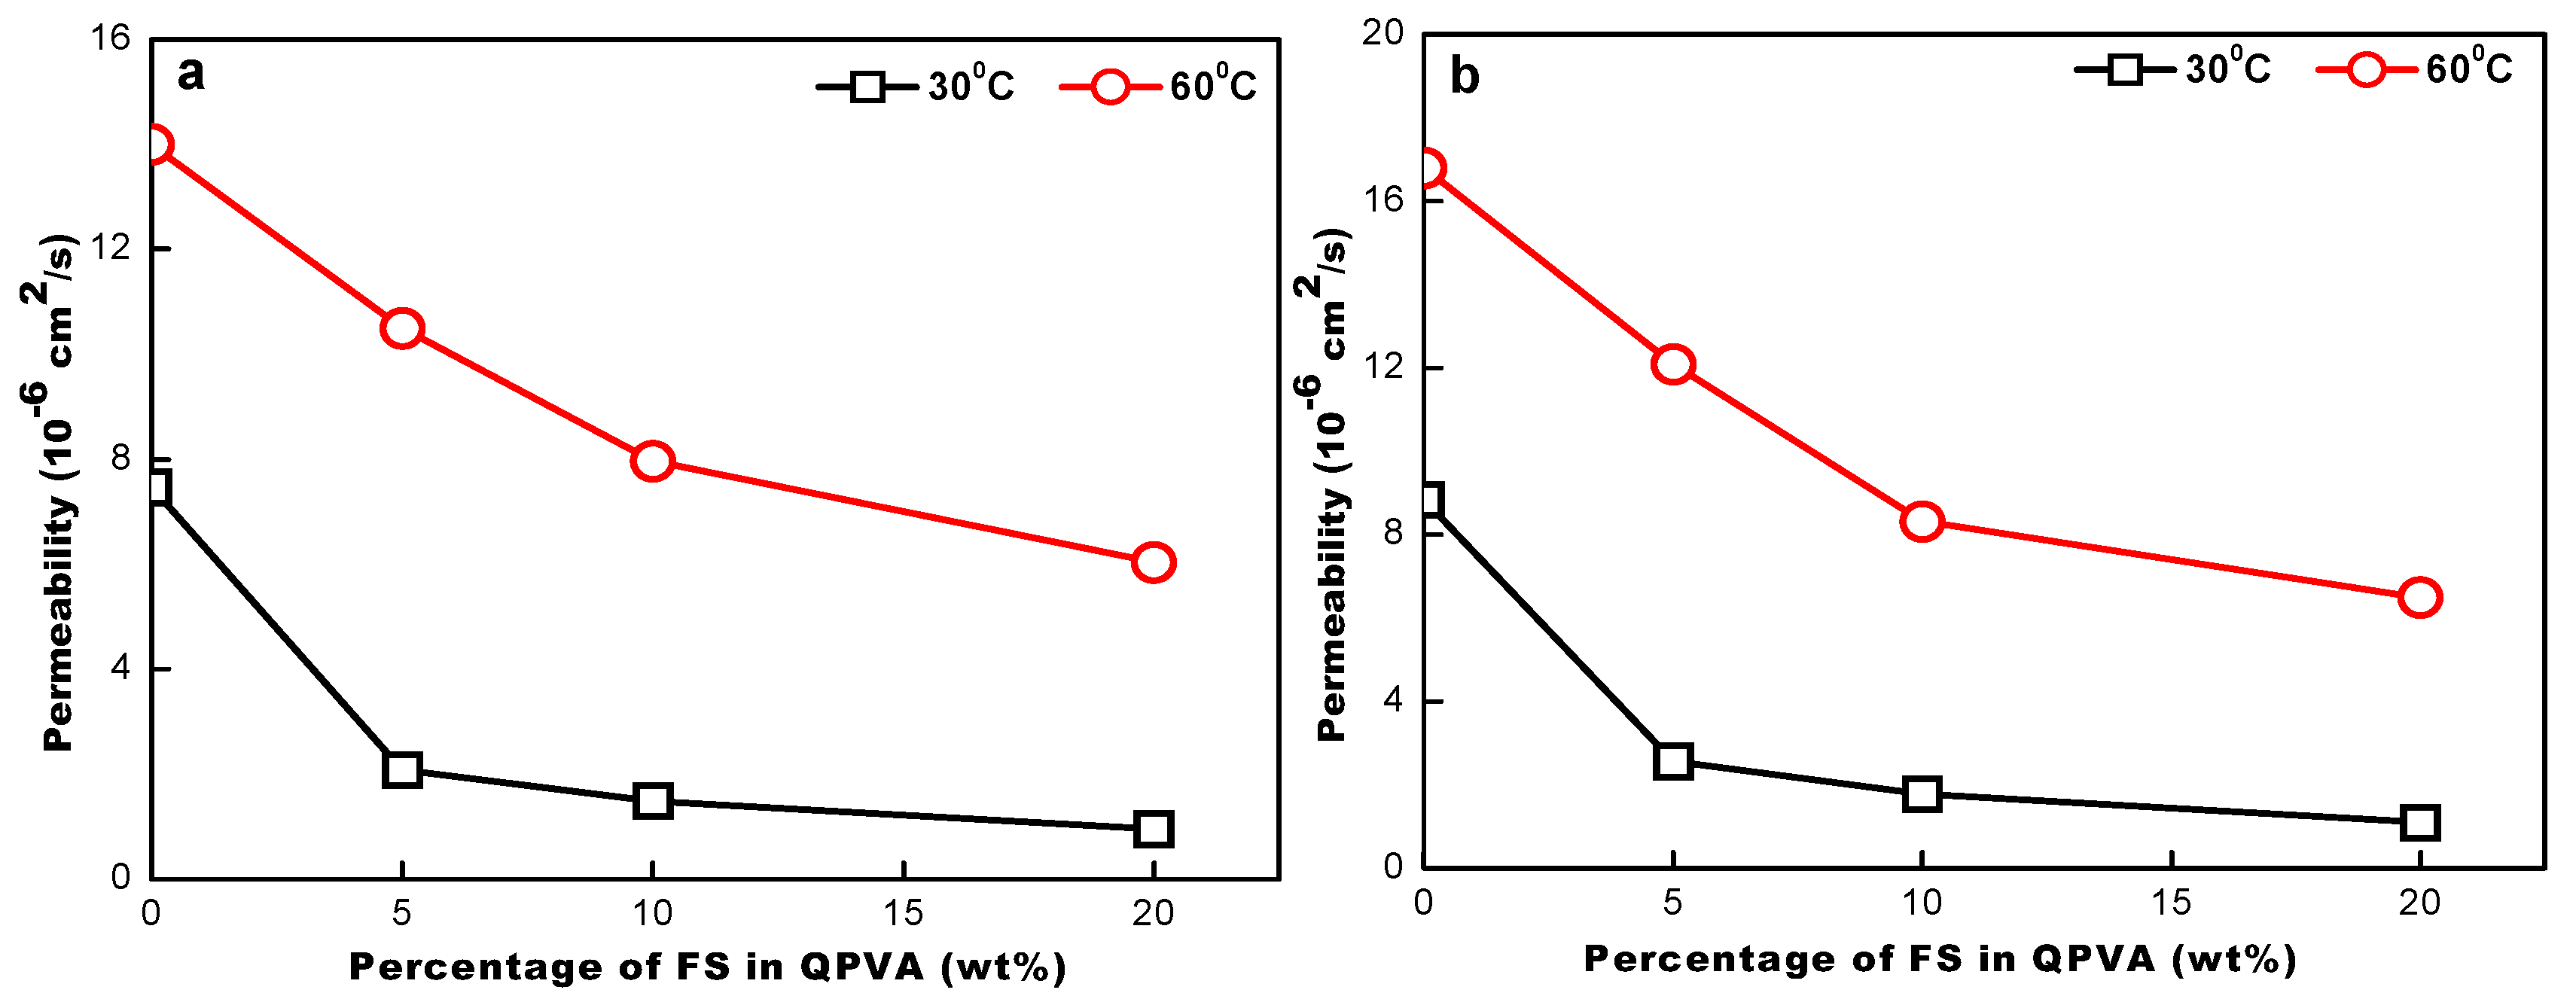
2.6. Ethanol Permeability from Aqueous Solutions

The ethanol permeability of pristine QPVA and the QPVA/FS nanocomposite membranes was studied at 3 M and 5 M ethanol concentrations at 30 °C and 60 °C, and the data are shown in Figure 7a,b. At 30 °C, the ethanol permeability of pristine QPVA was 7.47 × 10⁻⁶ cm2/s with a 3 M ethanol fuel feed, whereas the value increased gradually to 8.84 × 10⁻⁶ cm2/s with a 5 M ethanol fuel feed. When further increasing the temperature to 60 °C, the permeability doubled, with values of 14 × 10−6 cm2/s and 16.8 × 10⁻⁶ cm2/s for 3 M and 5 M ethanol, respectively. To reduce the permeability, different percentages of fumed silica were added to the QPVA matrix. The permeabilities were reduced to 2.08 × 10⁻⁶ cm2/s, 1.48 × 10⁻⁶ cm2/s and 0.95 × 10⁻⁶ cm2/s for QPVA/5%FS, QPVA/10%FS and QPVA/20%FS, respectively, when using 3 M ethanol at 30 °C. When increasing the ethanol concentration to 5 M or increasing the temperature to 60 °C, the permeability also increased for all of the samples, as shown in Figure 7b. The data imply that the addition of fumed silica to the QPVA matrix is effective in blocking the passage of ethanol and efficiently reduces ethanol crossover. Furthermore, ethanol permeability was lower than methanol permeability in a given membrane at the same temperature. Gomes et al. reported the preparation of PVA/phosphotungstic acid solutions with different percentages of diethylenetriaminepentaacetic acid to reduce ethanol permeability to 10−5–10−6 cm2/s [13]. Consistent with this study, the present results corresponding to QPVA/20%FS indicate its reduced ethanol permeability at 30 °C.
Figure 7. Ethanol permeabilities of QPVA, QPVA/5% FS, QPVA/10% FS and QPVA/20% FS at (a) 3 M and (b) 5 M ethanol concentrations at 30 °C and 60 °C.
Energies 09 00015 g007

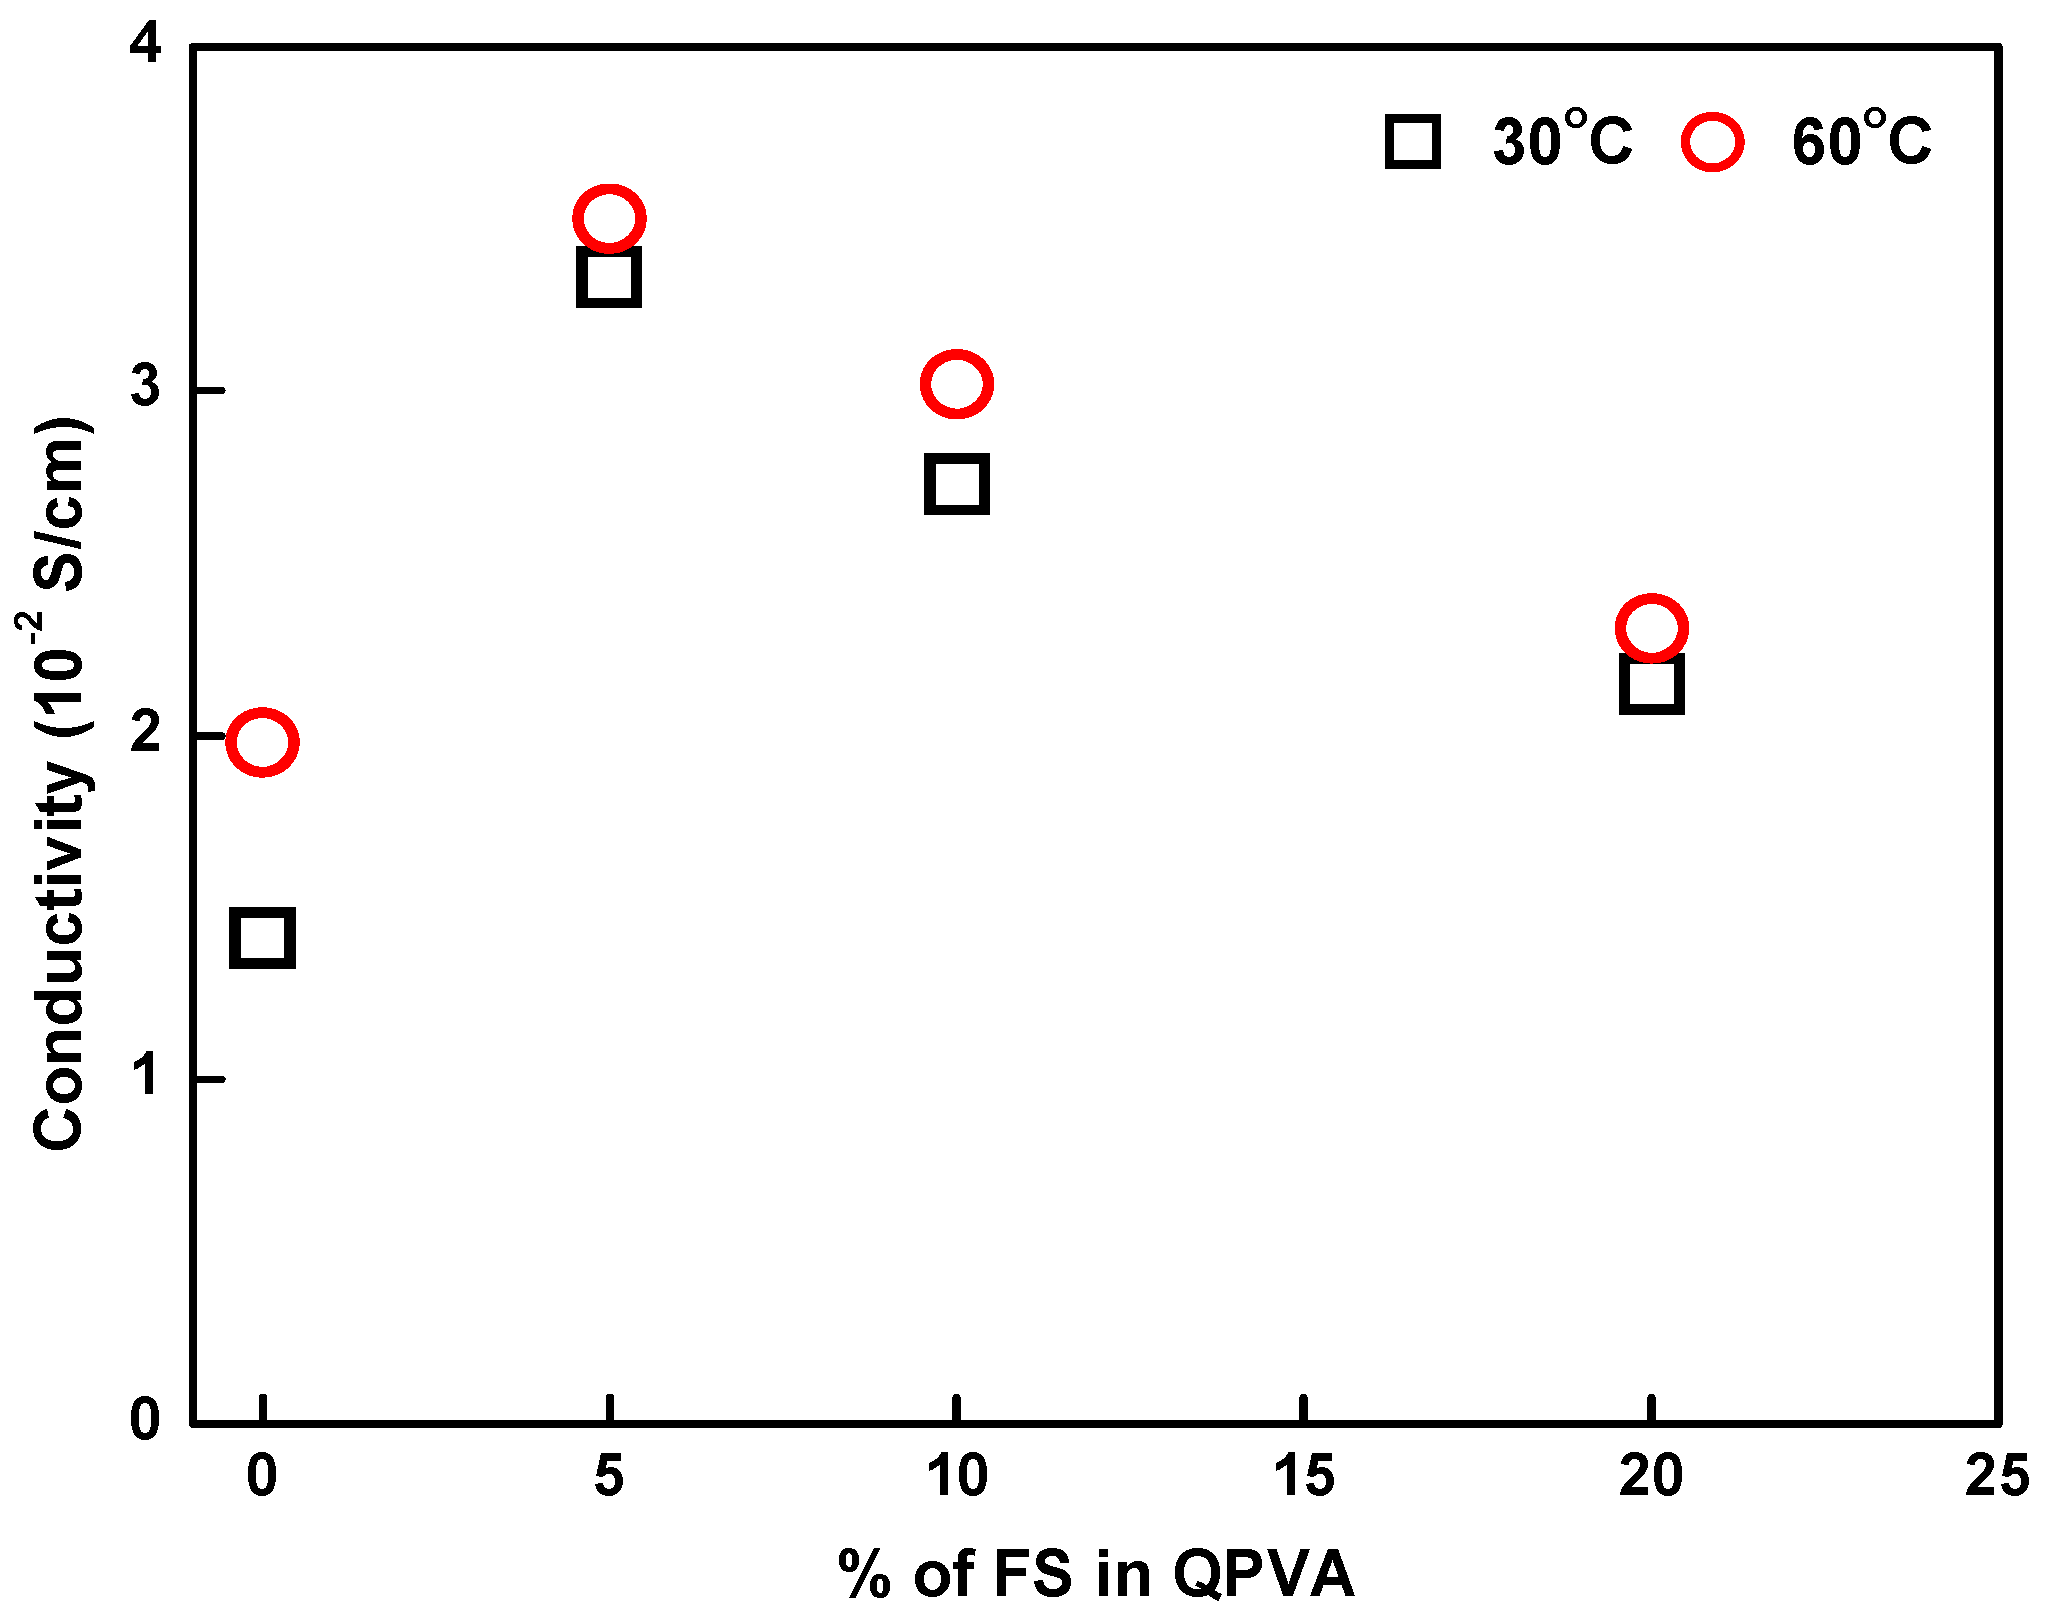
2.7. Alkaline Uptakes and Ionic Conductivity

The alkaline uptakes of the pristine QPVA and QPVA/5%FS nanocomposite membrane were analyzed by doping with 6 M KOH solution at 60 °C for 48 h. The alkaline uptake values were 0.826 g/g and 1.017 g/g for pristine QPVA and QPVA/5%FS nanocomposite membranes, respectively. The stability of the fumed silica and the prepared nanocomposite membrane in alkali was determined by immersing the sample in 6 M KOH solution and the dissolved silicon concentration in the solution was analyzed using ICP-OES. The solubility of the pristine fumed silica in 6 M KOH solution was found to be 17.3% and that of the incorporated fumed silica in the QPVA/5%FS nanocomposite film was 16%. These data confirmed that more than 80% of the fumed silica nanoparticles were stable in a basic environment and most of the fumed silica nanoparticles in the QPVA/5%FS nanocomposite membrane were intact after the KOH doping process. The chemical interaction such as hydrogen bonding and induction forces may occur between C-O and O-H groups of PVA and doped KOH molecules [36]. Hence, there would be no leachable incorporated KOH to further dissolve fumed silica nanoparticles, thus preventing fumed silica dissolution [37]. In addition, KOH doped similar composites have been already tested on long-term performance [17,34] and shown stable cell voltage over 200 h. The ionic conductivities of pristine QPVA and the fumed silica-incorporated QPVA nanocomposite membranes were measured at 30 and 60 °C after the membranes were doped with 6 M KOH. The ionic conductivity of the pristine QPVA membrane was 1.41 × 10⁻² S/cm at 30 °C. At the same temperature, the ionic conductivities of the QPVA/5%FS, QPVA/10%FS and QPVA/20%FS nanocomposite membranes were 3.33, 2.73 and 2.15 × 10⁻² S/cm, respectively (Figure 8). Comparatively, the highest ionic conductivity was observed in the QPVA/5%FS membrane due to its greater amorphous region relative to pristine QPVA and the other nanocomposite membranes. When further increasing the temperature to 60 °C, the ionic conductivities of pristine QPVA and the QPVA/FS nanocomposite membrane increased, as shown in Figure 8.
Figure 8. Ionic conductivity of pristine QPVA and QPVA membranes with different percentages of fumed silica at 30 and 60 °C.
Energies 09 00015 g008
It could be confirmed that increasing temperature led to increasing ionic conductivity, indicating that ionic conduction is a thermally activated process. Here, a higher ionic conductivity of 3.5 × 10⁻² S/cm was observed for QPVA/5%FS. At this concentration, the hydrophilic properties and increase in OH ions were responsible for increasing ionic conductivity. In addition, the strong interaction at the polymer-particle interface led to a greater adsorption of water molecules when the temperature was increased. When further increasing the fumed silica percentage (10% or 20%), ionic conductivity gradually decreased due to a reduction in free volume because of increased polymeric crystallinity. Water vapor diffusivity was reduced at 10%–20% FS loading, implying a reduced hydroxide diffusion coefficient, which was interconnected with ionic conductivity. As a result, the conductivity was strongly dependent on the suitable loading of fumed silica into the QPVA matrix. Furthermore, increasing the temperature accelerated the diffusivity and expanded the free volume in QPVA, improving ionic conductivity.

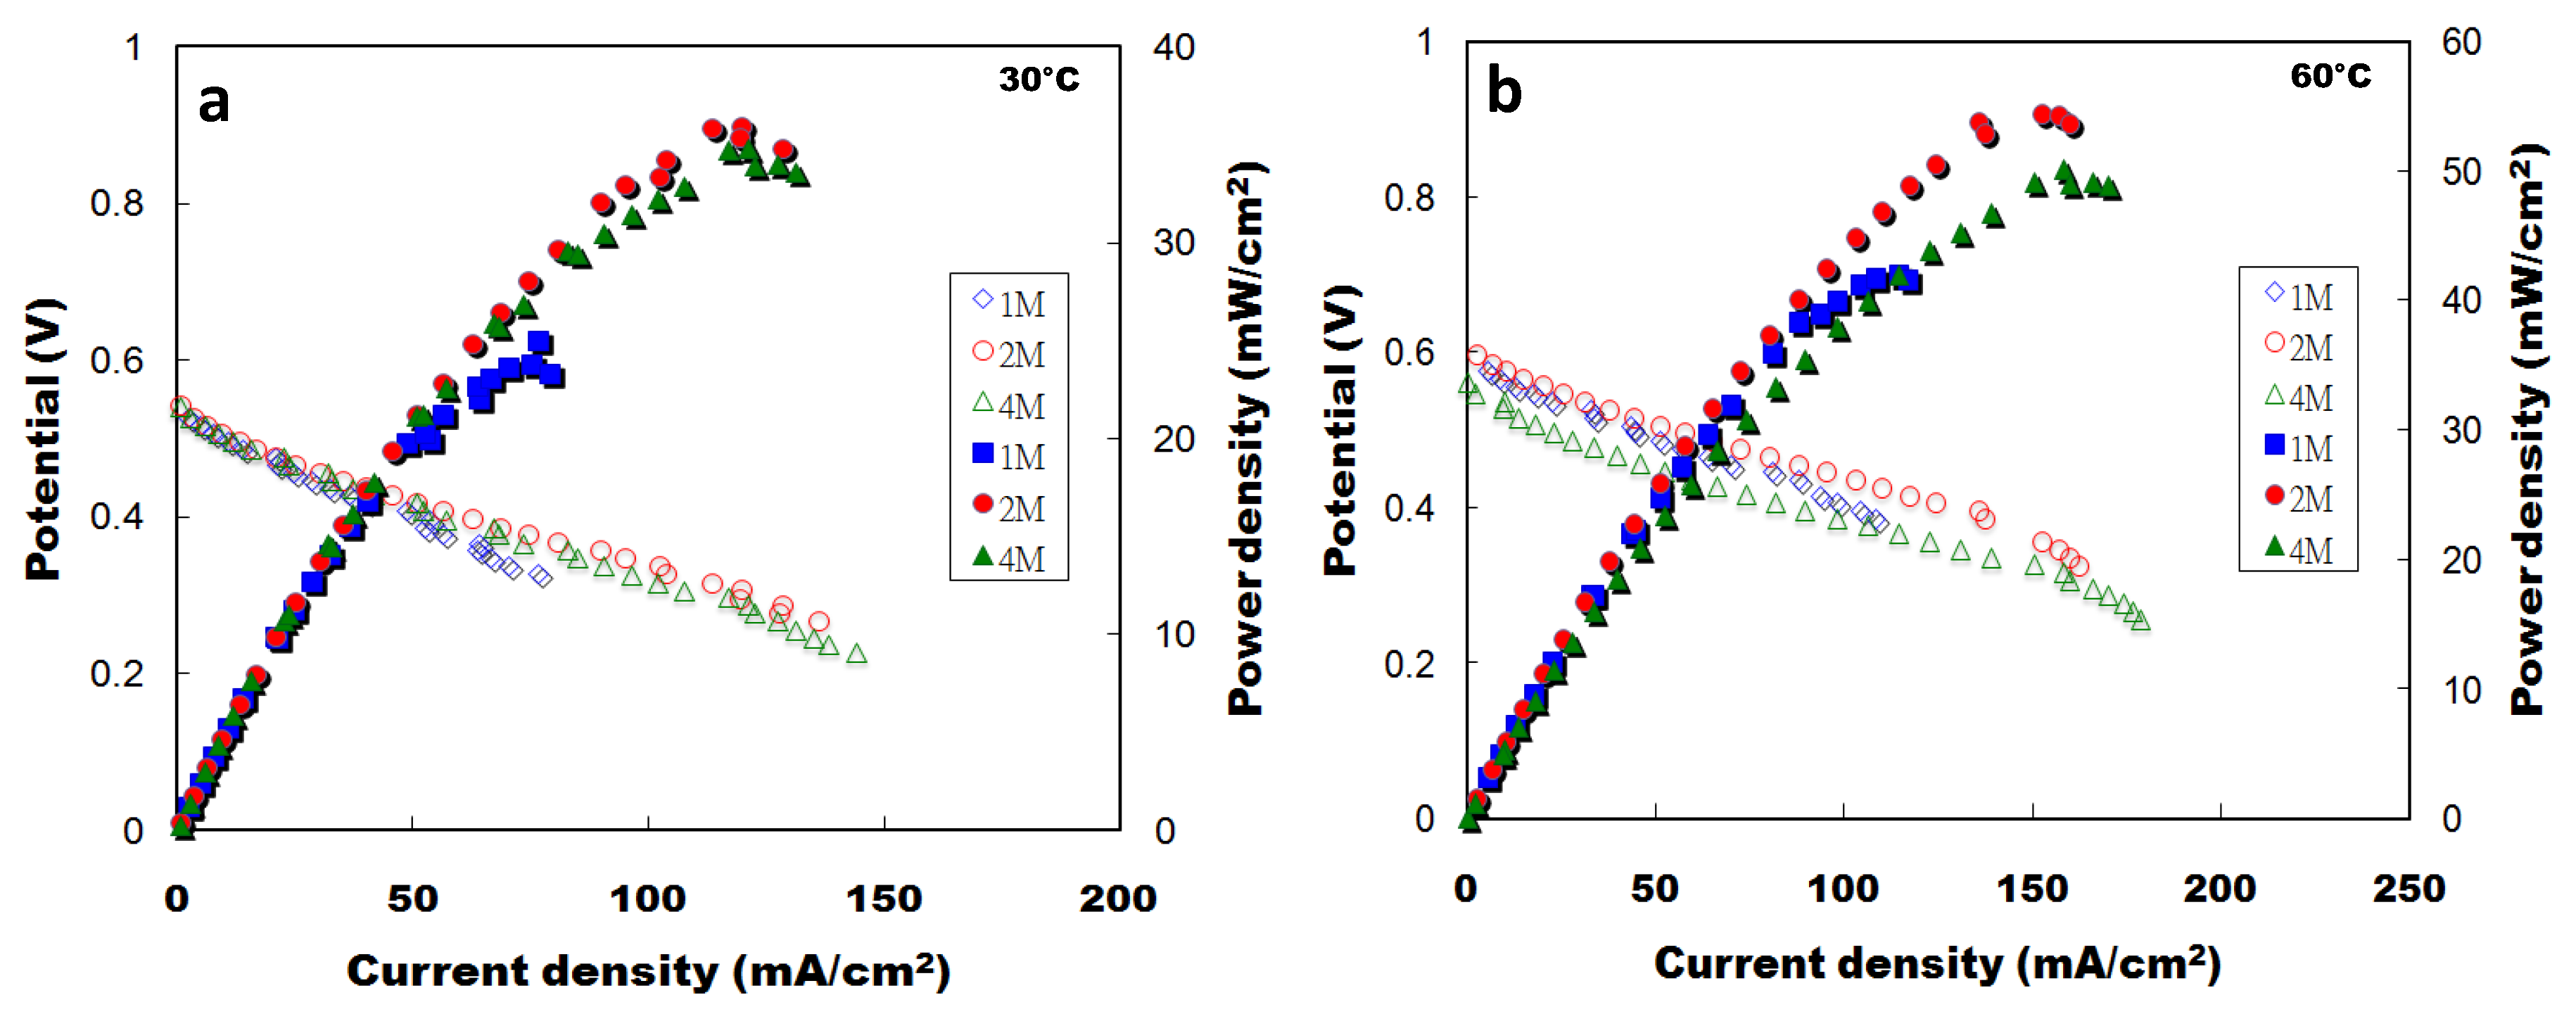
2.8. Direct Methanol Fuel Cell Performance of Pristine QPVA Membrane

Pristine QPVA and the QPVA/FS nanocomposite membranes were used to study fuel cell performance; a schematic of fuel cell operation is shown in Figure 9. Figure 10a shows the cell potential and power densities of pristine QPVA at different temperatures (30 °C and 60 °C). At 30 °C, the peak power density of pristine QPVA was 25.0 mW/cm2. When further increasing the methanol concentration (2 M and 4 M), the cell voltage gradually increased at a certain current density. Therefore, the peak power density increased significantly, to 35.9 and 34.7 mW/cm2 for 2 M and 4 M methanol, respectively.
Figure 9. Schematic diagram for the formation of QPVA/fumed silica nanocomposite membranes and their effects on fuel cell performance for direct alcohol alkaline fuel cell applications.
Energies 09 00015 g009
At 60 °C, the open circuit voltage in 4 M methanol was lower than that in 2 M methanol. Generally speaking, increasing the methanol concentration in fuel favors reaction kinetics and generates more electrons at the anode. Therefore, 2 M methanol (peak power density of 54.4 mW/cm2) exhibited better performance than 4 M methanol (peak power density of 50.1 mW/cm2). However, if the methanol concentration exceeded the catalytic capacity of Pt-Ru, the unreacted methanol would diffuse to the cathode and produce a mixed potential, which would reduce the cell voltage (Figure 10b) and peak power density.
Figure 10. Methanol cell performance of pristine QPVA membranes at (a) 30 °C and (b) 60 °C with 6 M KOH.
Energies 09 00015 g010
The results confirmed that higher cell performance was obtained at 60 °C than at 30 °C, probably due to the higher reaction kinetics at the electrodes and the lower electrical resistance of the single cells. Fu et al., reported higher conductivity and a power density of 6.04 mW/cm2 at 60 °C and 10.21 mW/cm2 at 90 °C using a PVA/KOH electrolyte membrane [38]. Recently, Ye et al. reported that a maximum power density of 18.5 mW/cm2 was obtained when using a PVA membrane with 2 M methanol and 5 M KOH at 60 °C [39]. Compared to previous studies, the present results show improved cell performance via methanol feeds and temperature effects due to the quaternization of the PVA matrix.

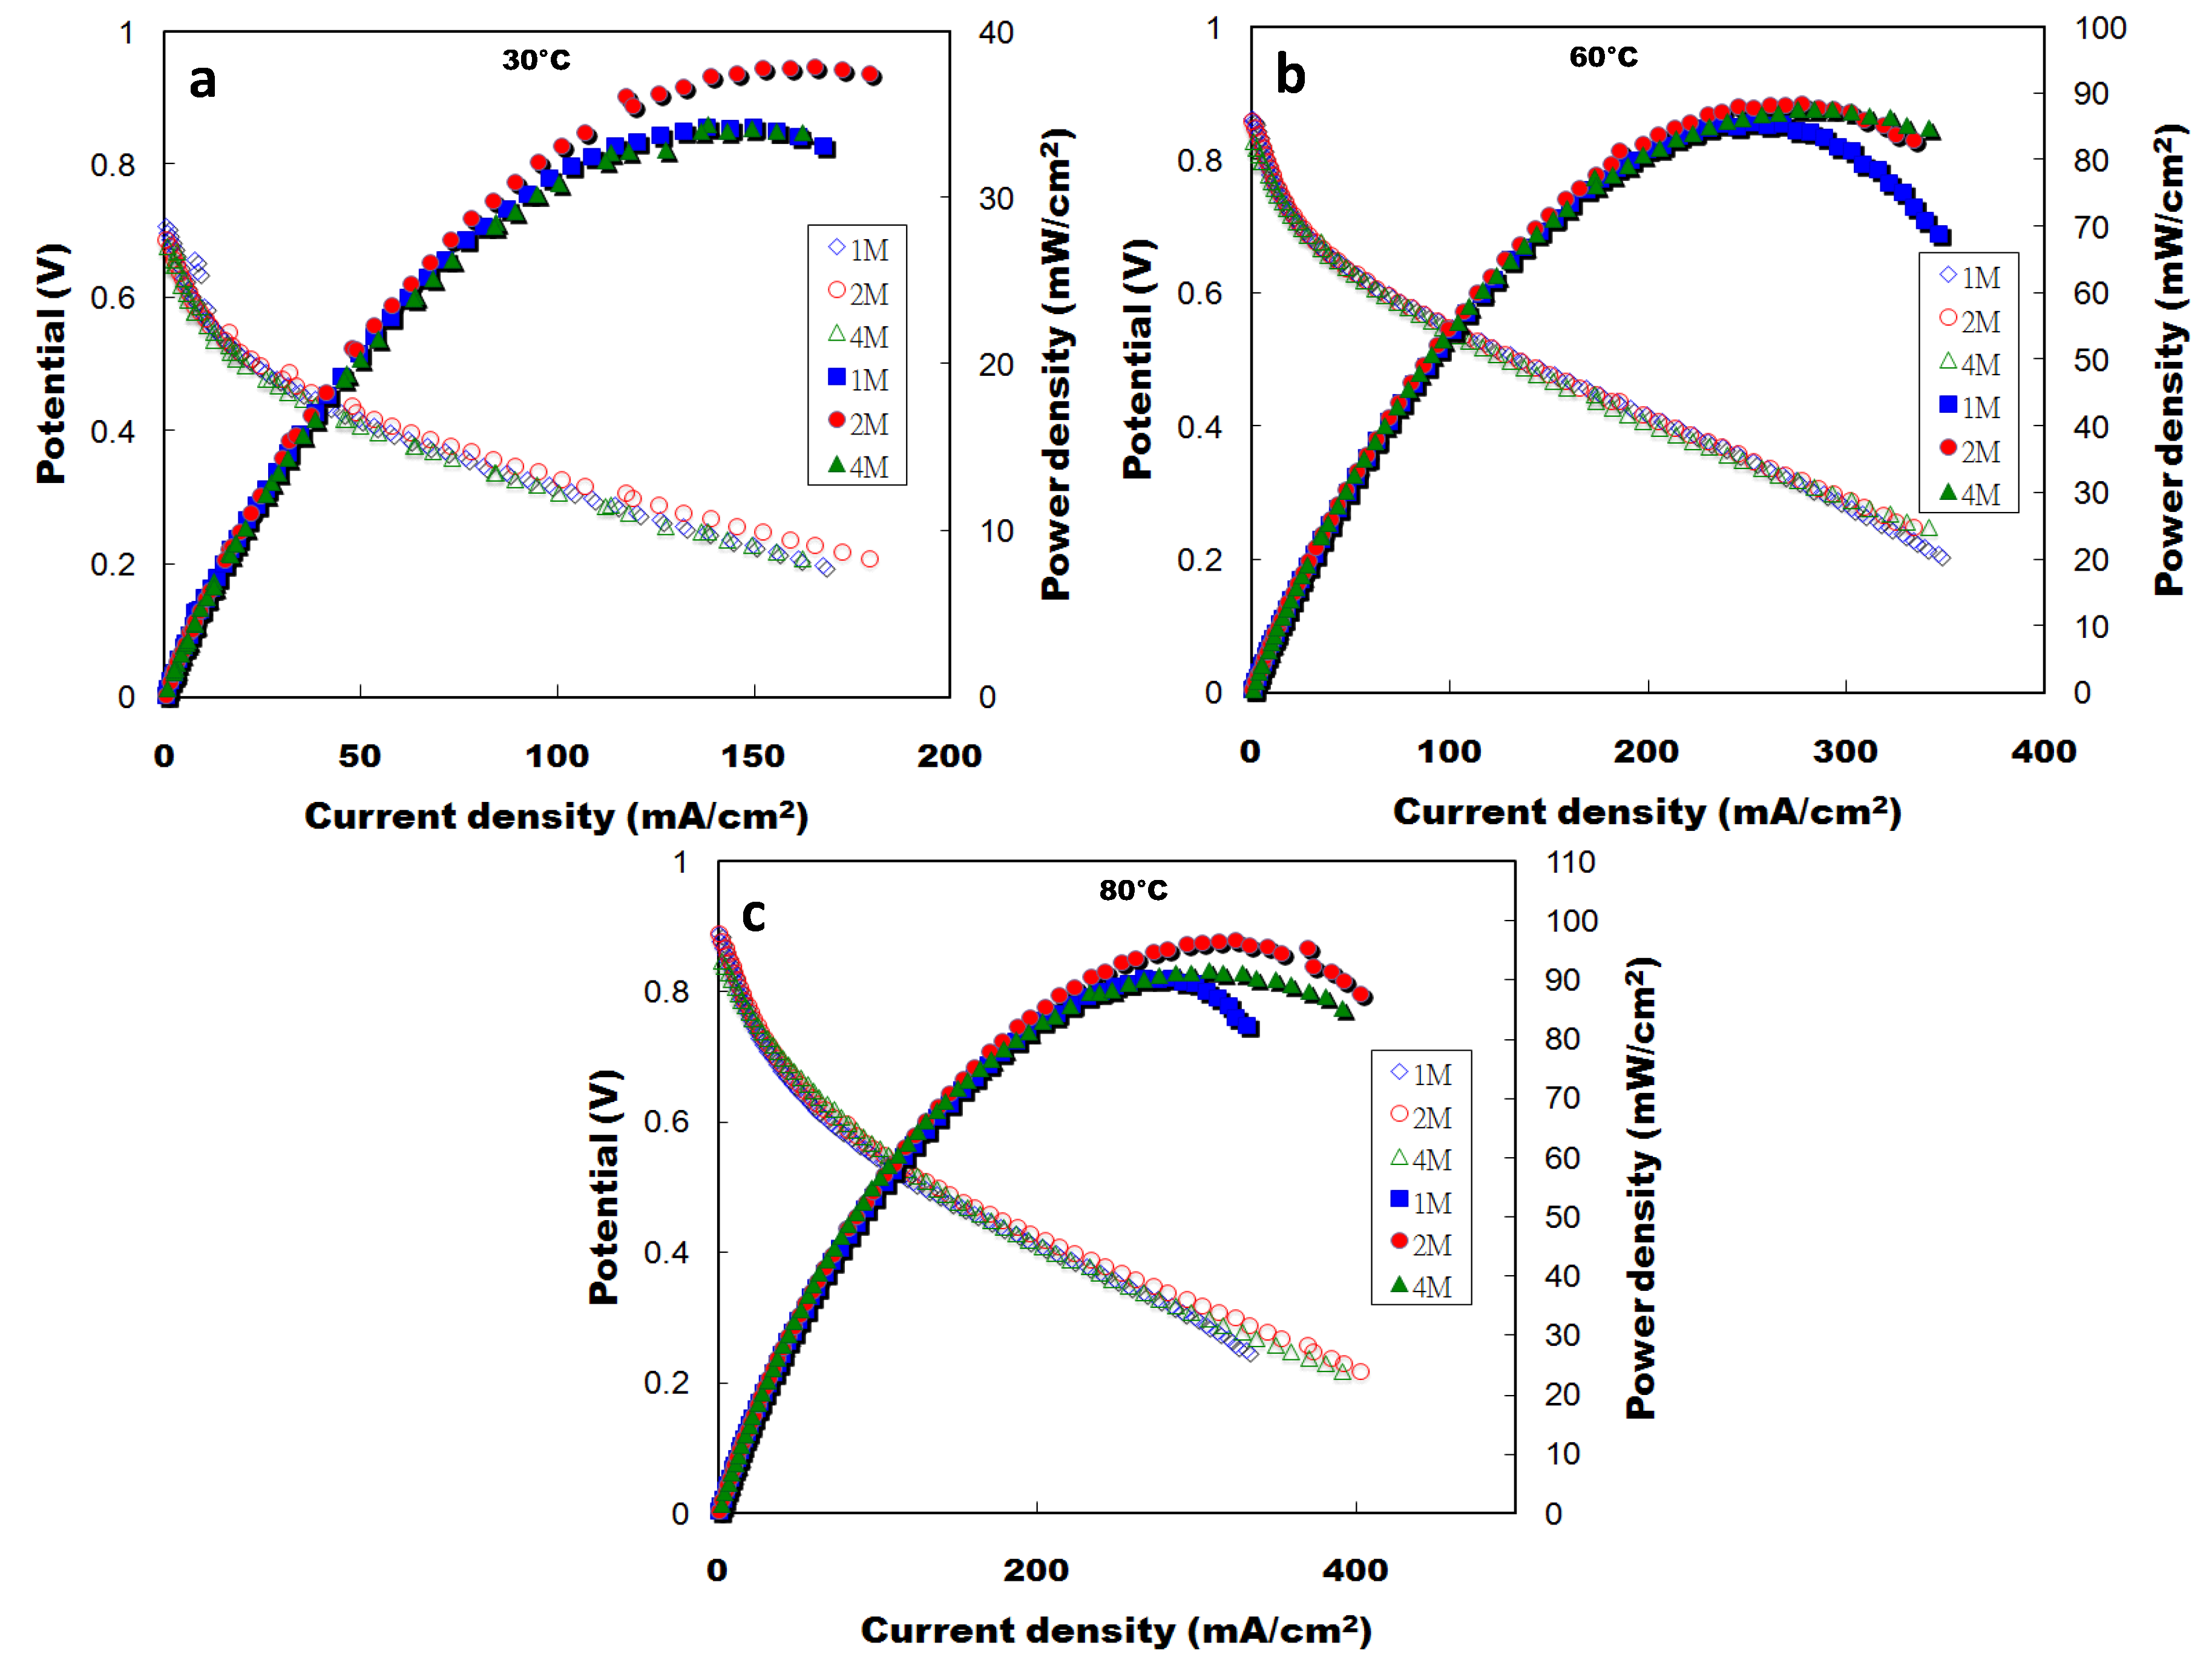
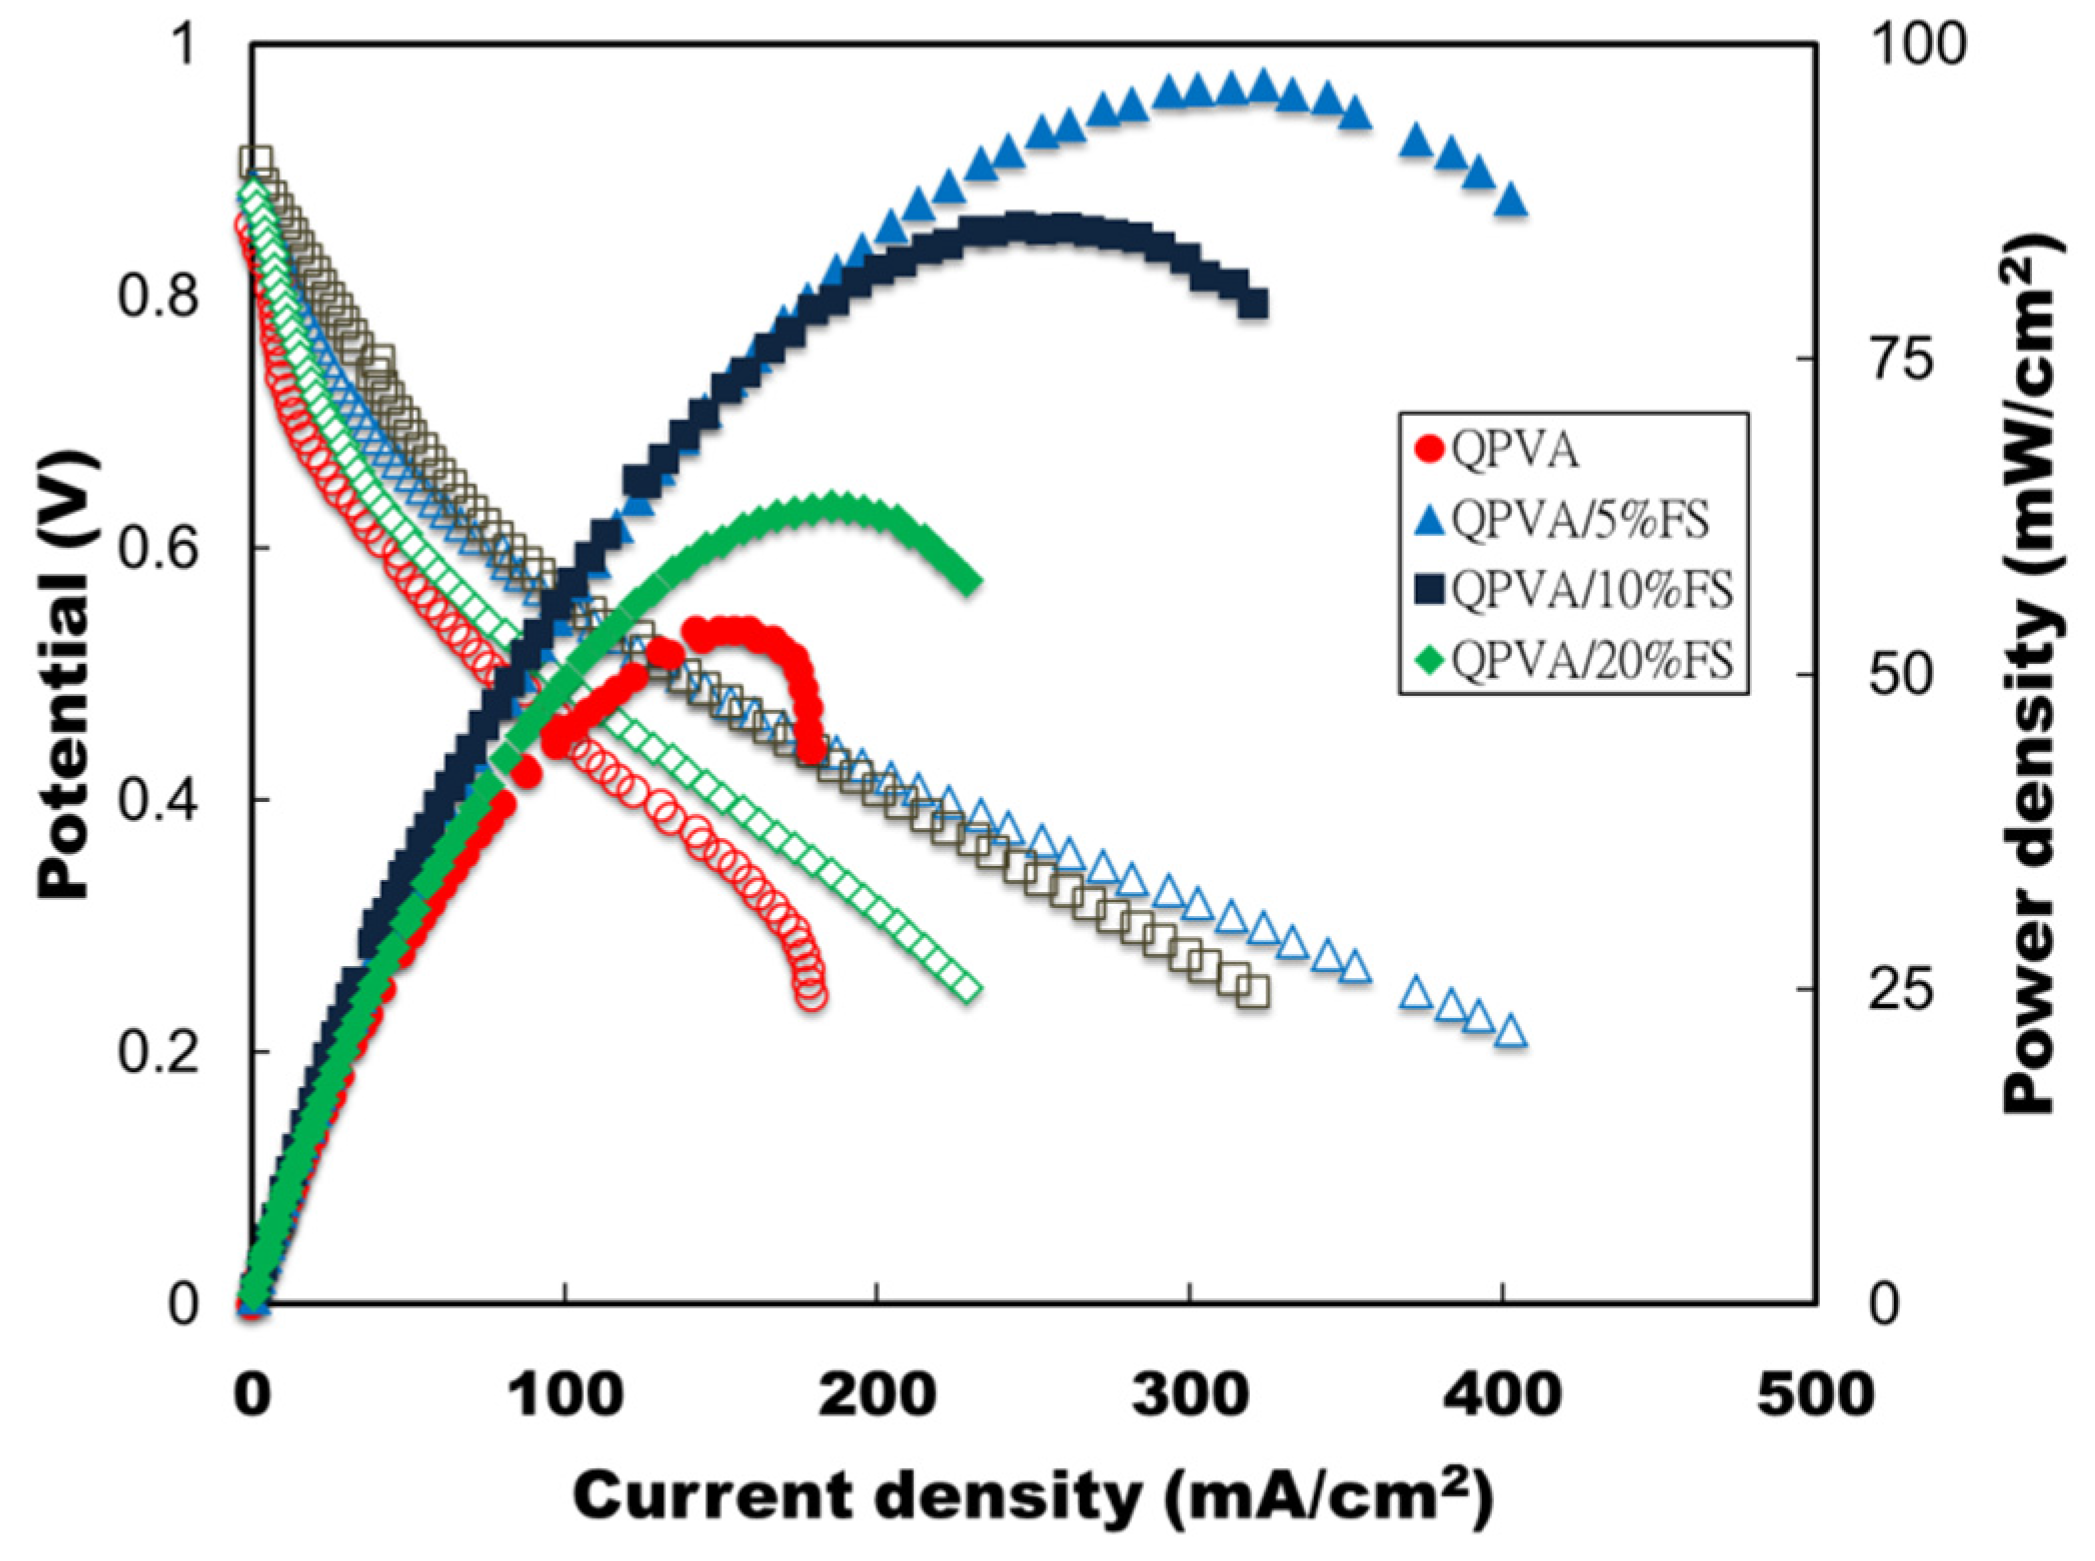
2.9. Direct Methanol Fuel Cell Performance of QPVA/FS Nanocomposites

Figure 11 shows the power density and cell potential curves for the DMAFC containing the QPVA/5%FS electrolyte using methanol (1 M, 2 M, 4 M) and 6 M KOH as a fuel feed at different temperatures (30–80 °C). A higher peak power density of 37.5 mW/cm2 was attained at a cell potential of 0.7 V at 30 °C when using a 2 M methanol feed versus a 1 M or 4 M feed. When increasing the temperature to 60 °C and 80 °C, peak power densities of 88.4 mW/cm2 and 96.8 mW/cm2 were reached at cell potentials of 0.89 V and 0.91 V, respectively. At 80 °C, the QPVA/5%FS electrodes showed higher conductivity due to a greater diffusivity of OH ions and improved reactant transfer rates at the electrodes via electrochemical reaction kinetics [24]. The faster catalytic kinetics as indicated in the open circuit voltage could induce a greater degree of methanol oxidation to produce more electrons and less ohmic loss in a single cell, which led to increased cell potential and power densities at higher temperatures. Additionally, the reduction reaction in the slope of the I-V curve at the cathode and the oxidation reaction at the anode could accelerate faster electrochemical kinetics to improve cell performance [11]. Therefore, when increasing the temperature, the single cell resistance decreased the electrode reactions, cell conductance and fuel crossover.
The cell potential and power densities obtained for the single cell performance using pristine QPVA and varying percentages of fumed silica (5%, 10%, 20%) in the QPVA matrix with 2 M methanol and 6 M KOH solution as fuel at 80 °C are shown in Figure 12. The peak power density of pristine QPVA was 53.5 mW/cm2, whereas for QPVA/5%FS, QPVA/10%FS and QPVA/20%FS it was 96.8 mW/cm2, 85.5 mW/cm2 and 63.2 mW/cm2, respectively, at a cell potential range of 0.84 V to 0.91 V. The nanocomposite electrolyte showed lower slopes in the ohmic over potential region and was more capable of activating high current density than the pristine QPVA membrane.
Figure 11. Methanol cell performance of QPVA/5%FS nanocomposite membranes at (a) 30; (b) 60 and (c) 80 °C with 6 M KOH.
Energies 09 00015 g011
Figure 12. Methanol cell performance of pristine QPVA and QPVA/FS nanocomposite membranes at 80 °C.
Energies 09 00015 g012
Moreover, the QPVA/5%FS electrolyte membrane exhibited the highest cell performance of the tested samples due to its higher free volume and hydroxide ion transfer phenomenon. As the fumed silica percentages increased to 10% and 20% in the QPVA matrix, the cell potential and power densities were not further enhanced. It is speculated that this is due to the excess of fumed silica leading to agglomeration and increasing the crystallinity, as shown in Table 1. The fumed silica particles also formed a tortuous passage and limited the movement of molecules, thereby affecting the electrolyte membrane’s OH ionic conduction. Therefore, higher percentages of fumed silica in the QPVA matrix lead to poorer ionic conductivities and therefore the fuel cell performance did not improve when using the nanocomposite with 5% fumed silica. Hence, the addition of 5% fumed silica to the QPVA matrix was optimal with respect to the nanocomposites that were under investigation.
Many studies have supported the idea of incorporating inorganic/organic nanofillers into PVA matrixes to enhance their power densities, as shown in Table 2. Yang et al., reported the preparation of a QPVA/Al2O3 nanocomposite membrane that improved the methanol cell performance to 36.25 mW/cm2 when increasing the feed to 4 M methanol. The higher cell performance was based on the improved ionic conductivity of 10−2 S/cm, and the reduced methanol permeability of 10−6–10−7 cm2/s due to the use of a quaternized polymer and an inorganic nanofiller [22]. Pan et al., reported the PVA/CNT/KOH electrolyte had a power density of 39 mW/cm2 when using 2 M methanol fuel in 6 M KOH at 60 °C, and cell performance was improved based on suppressed methanol permeability [40]. Lue et al., reported that the incorporation of higher percentages of fumed silica into PVA generates more fractional free volume due to the contribution of microchannels for hydroxide ion transport, resulting in improved ionic conductivity relative to pristine PVA [24]. In our previous report, a PVA/FS/KOH membrane had a peak density of 39 mW/cm2, which was higher than a pristine PVA/KOH membrane. The superior cell performance was due to the higher ionic conductivities and suppressed methanol crossover rates following the addition of fumed silica to the PVA matrix [34]. Yang et al., reported a QPVA/Q-SiO2nanocomposite that had a peak power density of 35.13 mW/cm2 and concluded that it was a low-cost option for a non-perfluorosulfonated polymer membrane, compared to the expensive Nafion membrane [16]. At 5% nanofiller load in the QPVA matrix, the FS nanocomposite membrane in this study had higher conductivity than QPVA/Q-chitosan composite [17]. The Pmax value at 60 °C using the FS nanofiller was higher than QPVA/Q-chitosan composite, as shown in Table 2.
Table 2. Comparison of peak power densities obtained for direct alkaline methanol fuel cells in previous studies.
ElectrolyteOperating ConditionsPeak Power Density (mW/cm2)References
Temperature °CFeed Methanol (MeOH) + Alkaline
QPVA/PECH/KOHambient4 M MeOH + 4 M KOH20.81Yang [10]
QPVA/Al2O3/KOHambient4 M MeOH + 4 M KOH36.25Yang et al. [22]
PVA/sodium alginate/KOH40 °C2 M MeOH + 2 M KOH29.2Yang et al. [14]
PVA/CNT/KOH40 °C2 M MeOH +6 M KOH30.1Lue et al. [11]
QPVA/Q-SiO2/KOH50 °C2 M MeOH + 8 M KOH35.13Yang et al. [16]
PVA/FS/KOH60 °C2 M MeOH + 6 M KOH15.3Lue et al. [24]
PVA/FS/KOH60 °C2 M MeOH + 6 M KOH39Lue et al. [34]
PVA/MCNTs/KOH60 °C2 M MeOH + 6 M KOH39Pan et al. [38]
QPVA/Q-chitosan60 °C2 M MeOH + 6 M KOH73Liao et al. [17]
QPVA/5%FS/KOH30 °C2 M MeOH + 6 M KOH37.5This work
QPVA/5%FS/KOH60 °C2 M MeOH + 6 M KOH88.4This work
QPVA/5%FS/KOH80 °C2 M MeOH + 6 M KOH96.8This work
The present work (QPVA/5%FS) shows that the maximum power density of the cell was 96.8 mW/cm2, which was much higher than values obtained in previous studies, as shown in Table 2. Therefore, the higher power densities and electrode potentials were due to increased hydroxide ion transfer and optimized electrochemical reactions, which were a result of using QPVA/5%FS nanocomposite membranes for superior methanol fuel cell applications.

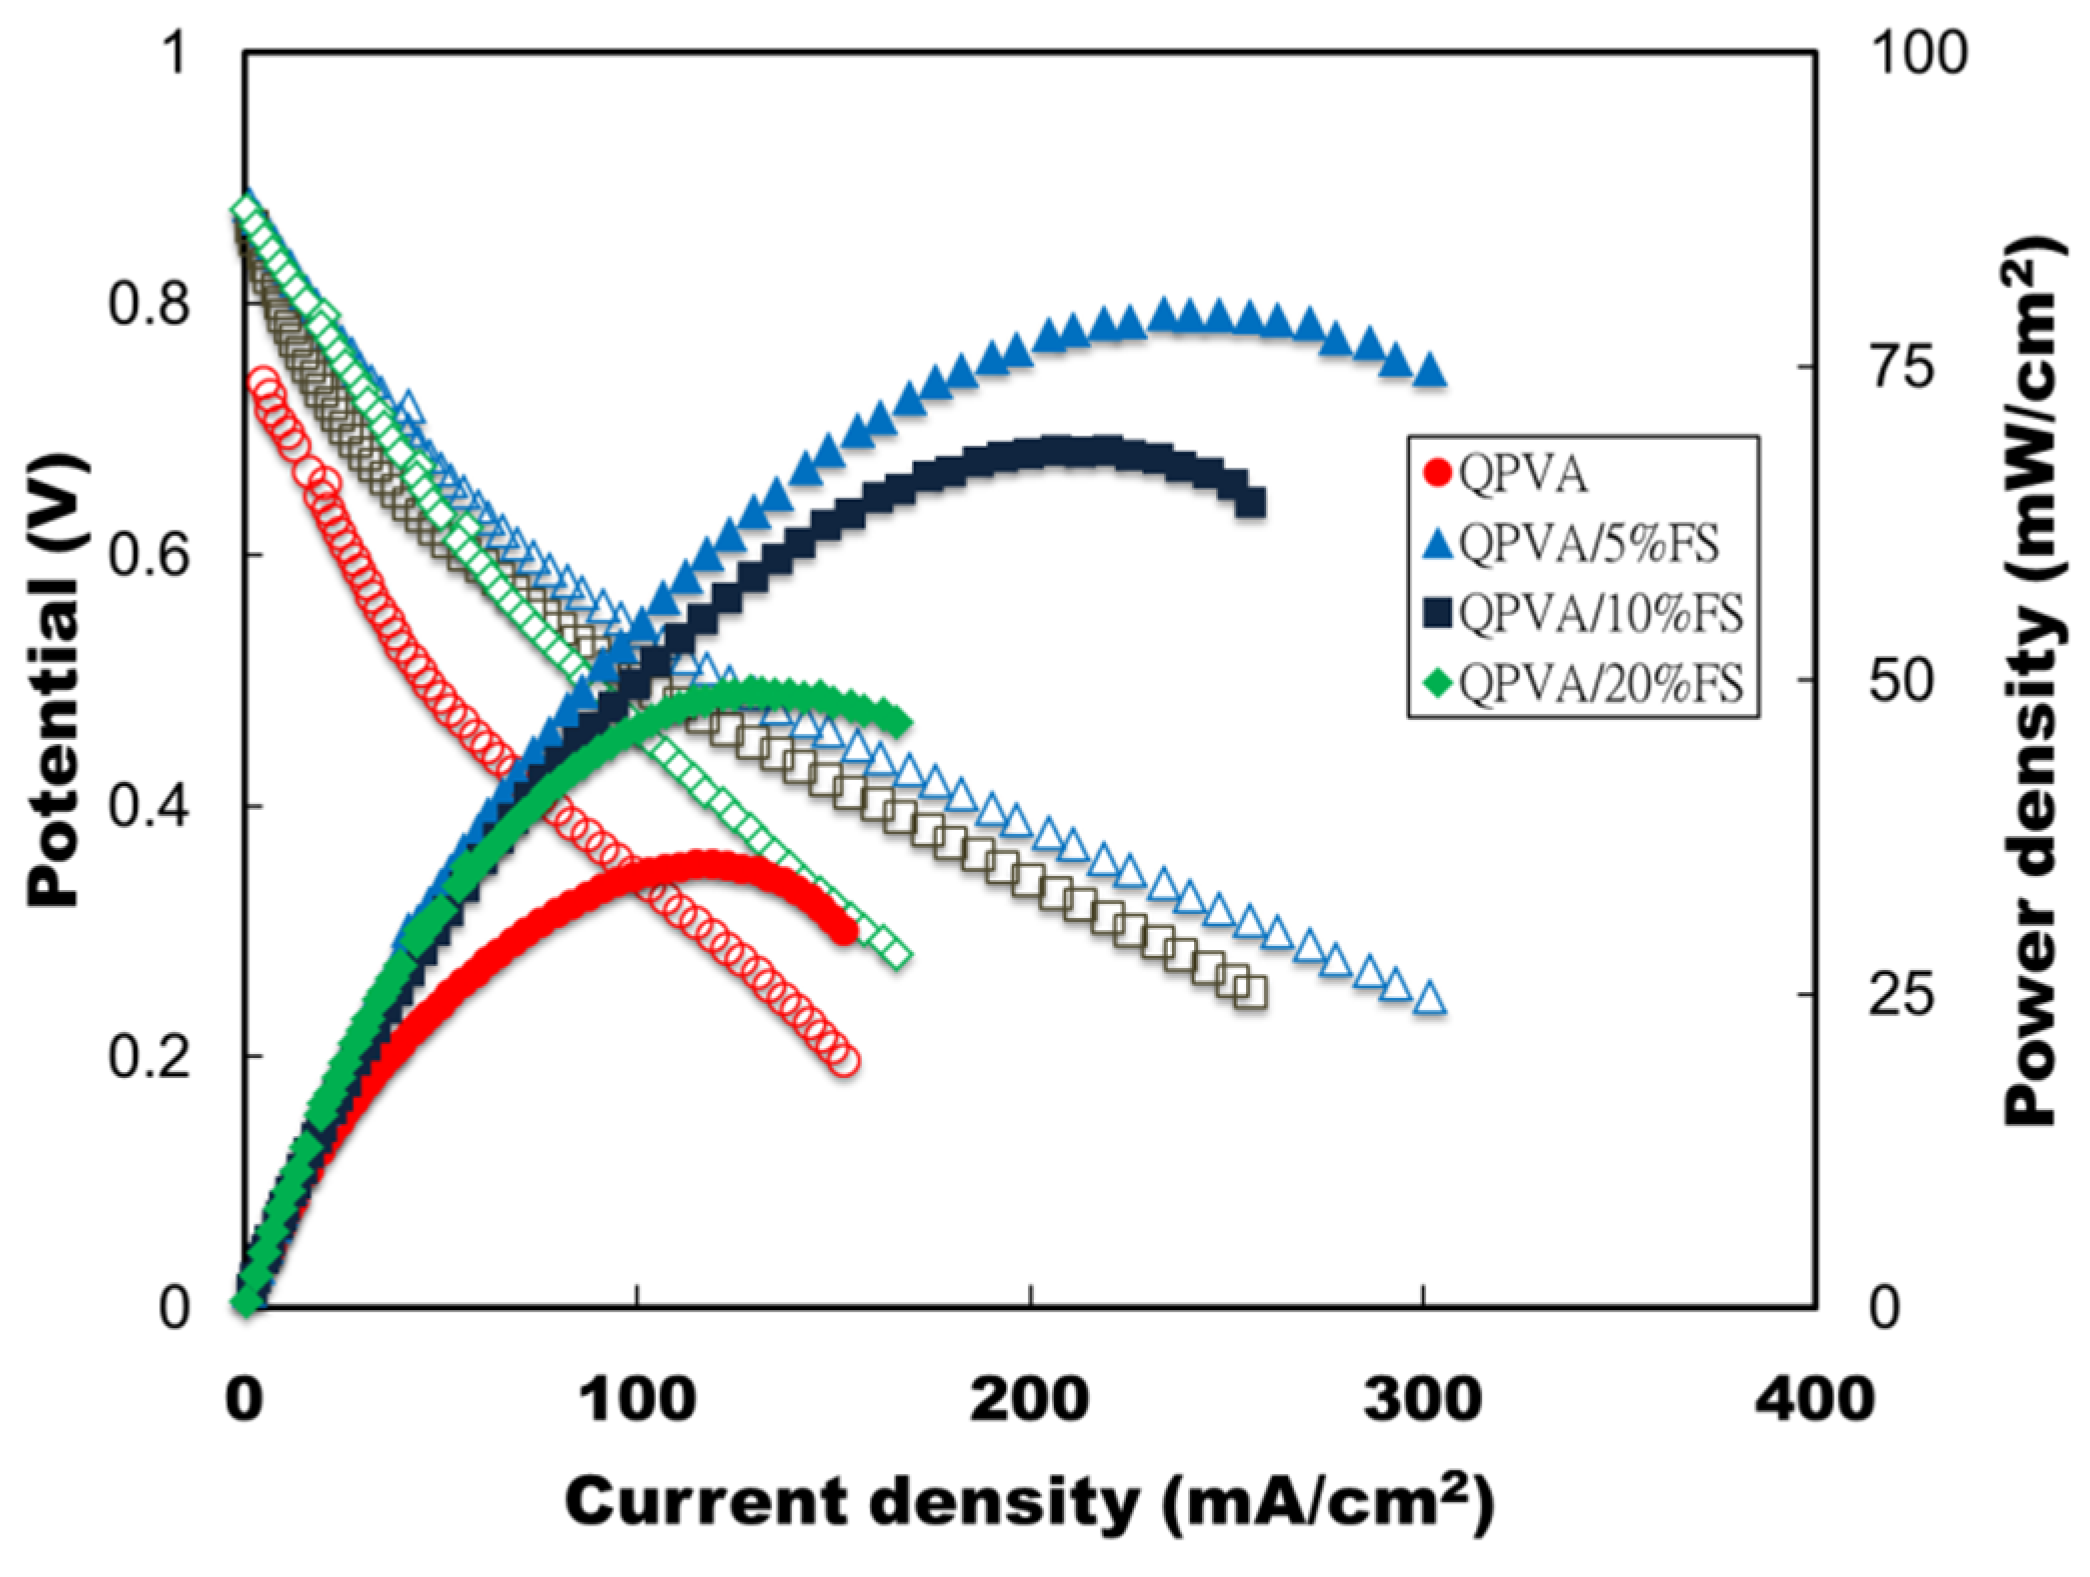
2.10. Direct Alkaline Ethanol Fuel Cell Performance

The cell potentials and power density peaks corresponding to ethanol fuel cell performance when using pristine QPVA, QPVA/5%FS, QPVA/10%FS and QPVA/20%FS electrolytes and 3 M ethanol and 5 M KOH as the anode feed at 60 °C are shown in Figure 13. The power densities and open circuit voltage of pristine QPVA were 35.3 mW/cm2 and 0.75 V, respectively. The power density increased to 79 mW/cm2 following the addition of 5% fumed silica to the QPVA matrix, with an open circuit cell potential of 0.87 V. Further increasing the fumed silica to 10% and 20% resulted in a decrease in power density to 68.3 mW/cm2 and 49.1 mW/cm2, respectively. The nanocomposites led to higher cell performance than pristine QPVA; the enhanced cell performance was due to the addition of fumed silica, which increased the OH ion conductivity and lowered the ethanol crossover relative to pristine QPVA. Compared with the methanol fuel cell, the peak power densities of the ethanol fuel cell were lower at the same temperature. This may be due fewer ethanol electro-oxidation reactions during the bond breaking of fuel molecules [4]. Lowering the cell temperature also reduced the peak power density: values of 21.7 mW/cm2, 31.2 mW/cm2, 26.3 mW/cm2, and 25.7 mW/cm2 were obtained for pristine QPVA, QPVA/5%FS, QPVA/10%FS and QPVA/20%FS electrolytes at 30 °C, respectively (data not shown). The power densities were higher when the operating temperature was increased from 30 °C to 60 °C. These results confirm that higher temperatures result in faster electrochemical kinetics, which improved the performance of both the ethanol fuel cell and the DMAFC. Wang et al., reported that PVA/3-(trimethylammonium) propyl-functionalized silica hybrid membranes can yield a maximum peak power density of approximately 50 mW/cm2 at 60 °C when using 3 M ethanol + 5 M KOH as fuel [30]. At the same temperature, a PVP/double layer composite membrane had a power density of 61.31 mW/cm2 when using 3 M ethanol + 1 M KOH as fuel, as reported by Zeng et al. [41]. The present results possess higher power densities than previous studies due to the high conductivities and superior ethanol barrier properties of the membranes.
Figure 13. Ethanol cell performance of pristine QPVA and the QPVA/FS nanocomposite membrane at 60 °C.
Energies 09 00015 g013

3. Experimental Section

3.1. Materials and Methods

Poly(vinyl alcohol) (average molecular weight 89,000–98,000 Da; over 99% hydrolyzed), potassium hydroxide (KOH), ethanol, methanol and glycidyltrimethylammonium chloride, which was used in the quaternization process, were purchased from Sigma–Aldrich (St. Louis, MO, USA). Fumed silica (FS) with a primary particle size of 14 nm was obtained from Cabot Corp. (Carbo-Sil M5, Tuscola, IL, USA) and used as a nanofiller. All of the chemicals were analytical grade (AR) materials that were used as received. Pure water with an 18 MΩ cm resistivity was produced using a Millipore water purifier (Elix 5/Milli-Q Gradient system, Millipore Corp., Bedford, MA, USA).

3.2. Preparation of QPVA

For the typical synthesis of QPVA, poly(vinyl alcohol) (PVA, 20 g) was dissolved in distilled water (DI, 180 g). The solution was continuously stirred at 90 °C for 4 h. Afterwards, the solution was allowed to cool to 65 °C, after which GTMAC (30 g) and KOH (10 g) were added to the mixture. The solution was stirred continuously for 4 h at 65 °C. After the reaction was complete, the solution was allowed to cool to room temperature. The final product was washed with pure ethanol using a peristaltic pump; a yellowish-white solid precipitate was produced. Finally, the product was subjected to vacuum filtration and dried at 60 °C for 24 h to obtain quaternized poly(vinyl alcohol) (QPVA) powders, which were stored in a desiccator for further use.

3.3. Preparation of Nanocomposite Membrane and Electrolytes

For the synthesis of nanocomposite membranes, quaternized poly(vinyl alcohol) (4.75 g) was dissolved in the required amount of DI water. Then, a predetermined amount of FS (5% to 20%) was added to the QPVA polymer matrix. The mixture was continuously stirred at 80 °C for 6 h. The resultant slurry was degassed in a heated ultrasonic bath for 15 min. The viscous polymer slurry was then casted onto a glass plate using an applicator knife (Model No. 3580, Elcometer Instruments Ltd., Edge Lane, UK). The casted film was initially placed in a hood for water evaporation at room temperature for 24 h and was then dried in a vacuum oven at 60 °C for 8 h. The resultant QPVA/FS nanocomposite film was gently peeled from the glass plate and stored in a desiccator. The thickness of the membrane was 200±5 µm, which was measured using a digital meter (Model 345, Elcometer Instruments Ltd., Edge Lane, UK). The membranes were denoted as QPVA/FS. They were then immersed in a 6 M KOH solution (being denoted as QPVA/KOH and QPVA/FS/KOH) for 24 h prior to the assessment of conductivity and cell performance.

3.4. Physico-Chemical Properties of Pristine and Nanocomposites Membranes

The crystalline behavior in the pristine and QPVA/FS nanocomposites was assessed by X-ray diffraction (XRD) with high intensity Cu-Kα1 radiation (k = 1.54178 Å, model D5005D, Siemens AG, Munich, Germany). The microstructures of the QPVA/FS nanocomposite membranes were observed using a field emission scanning electron microscope (FE-SEM, model JSM-7500F, Hitachi High-Technologies Corp., Tokyo, Japan). The elemental mapping and composition were analyzed using energy dispersive X-ray (EDX) analysis, which is a component of FE-SEM. Thermo-gravimetric analysis (TGA) was performed (TA-TGA Q-500, TA Instrument, New Castle, DE, USA) under a nitrogen atmosphere at a heating rate of 10 °C · min−1. The polymer crystallinity was quantified using a differential scanning calorimeter (DSC, Perkin Elmer Inc., Shelton, CT, USA) in an operating temperature range of 25 °C to 200 °C and a scanning rate of 5 °C · min−1 under a nitrogen atmosphere. The stability of pristine FS and QPVA/FS nanocomposite in alkaline solution was determined by mixing the tested specimen with 6 M KOH at 60 °C for 3 h. The solution was centrifuged and the supernatant solution was retrieved and diluted with 2% HNO3 + HCl (1:3) mixture to determine the silicon concentration using an inductively coupled plasma optical emission spectrometer (ICP-OES, Model 710-ES, Varian, Palo Alto, CA, USA).

3.5. Water Vapor Uptake and Diffusion Rate Coefficients

The pure water vapor sorption levels in pristine QPVA and in the QPVA/5%FS, QPVA/10%FS and QPVA/20%FS nanocomposite membranes were analyzed using a gravimetric method. Water vapor uptake was recorded after various times for each sample at room temperature. The relative mass uptake was calculated as the ratio of water uptake at time “t” to that at equilibrium diffusivity enhancement. The qualified uptake history was used to calculate the water diffusion coefficient in the nanocomposite membrane, as described in a previous study [28].

3.6. Methanol Permeability

Methanol permeability measurements using 1 M, 2 M and 4 M methanol were carried out for QPVA and the QPVA/5%FS, QPVA/10%FS and QPVA/20%FS nanocomposite membranes at different temperatures (30 °C and 60 °C) using a hand-made, double-jacked, glass permeation cell. The glass cell was divided into two compartments. One reservoir was filled with methanol (aqueous), and the other receiving reservoir was filled with DI water. Initially the membrane was placed between these two compartments to measure the permeability of methanol. The concentration of methanol that was transported through the membrane into the receiving reservoir was determined at regular time intervals using a density/specific gravity meter (model DA-130 N, Kyoto Electronics Manufacturing Co. Ltd., Kyoto, Japan). Similarly, permeability measurements of 3 M and 5 M ethanol were studied for pristine QPVA and the QPVA/5%FS, QPVA/10%FS and QPVA/20%FS nanocomposite membranes at different temperatures (30 °C and 60 °C) using a similar procedure as described above.

3.7. Ionic Conductivity Measurements

Ionic conductivity was measured for the pristine QPVA/KOH and QPVA/FS/KOH nanocomposite electrolytes using an alternating current (AC) impedance method. The electrolytes were sandwiched in a spring-loaded glass holder between two stainless steel electrodes with a surface area of 1.33 cm2. A thermocouple was kept in close contact with the tested membrane electrolytes for temperature measurements. Every sample was equilibrated in a KOH solution for at least 24 h prior to conductivity measurements. The AC impedance measurements were carried out using an Autolab PGSTAT-30ZN potentiostat (Eco Chemie B.V., Utrecht, The Netherlands). The resistance was recorded at AC frequencies from 10 to 100 Hz at an excitation signal of 10 mV. The resistance (Rb) of the composite was calculated from the impedance data and derived from the intercept on the real axis of the Nyquist plot. The conductivity (σ) was calculated with the L/(RbA) relation, where A is the area of the blocking electrode (cm2), and L is the composite thickness (cm). The electrolyte conductivity was determined at various temperatures, ranging from 30 to 60 °C. The temperatures were maintained within ±0.1 °C by a conventional oven (DO45, Deng Yng, Tainan, Taiwan) [24].

3.8. Fuel Cell Performance Measurement

The QPVA and the QPVA/5%FS, QPVA/10%FS and QPVA/20%FS nanocomposite membrane electrolytes were sandwiched between the sheets of gas diffusion electrodes (E-tek, 5 mg · cm−2 Pt for the cathode and 6 mg · cm−2 Pt-Ru for the anode) to obtain a membrane electrode assembly (MEA). The area of the MEA was 5 cm2. Two high-density carbon flow-field plates with carved flow paths (1 mm wide and 1 mm deep) were fixed next to the MEA. Two gold-plated copper end plates were used as current collectors and were assembled next to the flow field plates. Two heating tapes were adhered to the surfaces of the end plates. A thermocouple was inserted into the end plates, and the measured temperature was fed back to a controller to ensure that the cell temperature was at the set point. The thermostatted methanol/KOH or ethanol/KOH solution mixture was fed into the anode at a flow rate of 5 mL · min−1, while humidified oxygen gas was fed into the cathode at 100 mL · min−1. The current-voltage (I-V) curves and electrochemical measurements of the alkaline fuel cells were recorded as a function of current density with a potential scan rate of 5 mA · s−1 on an electrical load (PLZ164WA electrochemical system, Kikusui Electronics Corporation, Tokyo, Japan). The cell performance operating parameters included methanol or ethanol concentration, fumed silica loading and temperature.

4. Conclusions

Nanocomposite membranes composed of quaternized poly(vinyl alcohol) matrixes with fumed silica nanofillers were prepared by a solution casting method. XRD and DSC analyses confirmed that crystallinity was modified in response to increasing the percentage of fumed silica in the QPVA matrix. In addition, morphological evaluation indicated a uniform distribution of fumed silica in the QPVA matrix, which further confirmed the formation of a nanocomposite membrane. The ionic conductivities of the nanocomposite membranes were higher than that of the pristine QPVA membrane, and the optimal sample was the QPVA/5%FS membrane. The effects of cell potentials and power densities on pristine QPVA, QPVA/5%FS, QPVA/10%FS and QPVA/20%FS were studied by varying different parameters, such as temperature, and fuel (methanol or ethanol) concentrations. After evaluating many parameters, a maximum power density of 96.8 mW/cm2 was attained for a DMAFC consisting of a QPVA/5%FS nanocomposite electrolyte with 2 M methanol and 6 M KOH as the anode feeds at 80 °C. The superior cell performance of the QPVA/5%FS was due to its higher ionic conductivity and suppressed methanol permeability. With regard to ethanol fuel cell performance, the QPVA/5%FS nanocomposite electrolyte exhibited a peak maximum power density of 79 mW/cm2 using 3 M methanol and 5 M KOH as the anode feeds at 60 °C. The prepared QPVA/FS nanocomposite membrane shows superior kinetic properties, higher conductivity, reduced methanol permeability and an enhanced power density relative to pristine QPVA. The methanol and ethanol fuel cells evaluated in the current work showed better performance than those in previous studies using similar operation conditions. Therefore, the present results are a promising step towards new era of commercial methanol/ethanol fuel cell technology.

Acknowledgments

We acknowledge the financial support of the National Science Council Taiwan (NSC 101-2221-E-182-064-MY2 and MOST 103-2221-E-182-064-MY3) and Chang Gung Memorial Hospital (CMRPD2D0151).

Author Contributions

Selvaraj Rajesh Kumar, Cheng-Hsin Juan and Shingjiang Jessie Lue conceived and designed the experiments, the fuel cell performance and all data analysis; Selvaraj Rajesh Kumar and Shingjiang Jessie Lue wrote the paper; Guan-Ming Liao and Chun-Chen Yang contributes the preparation of QPVA polymer; Jia-Shiun Lin participated in FESEM analysis; Wei-Ting Ma and Jiann-Hua You performed the ICP-OES data analysis. All authors examined and approved the final manuscript.

Conflicts of Interest

The authors declare no conflict of interest.

References

  1. An, L.; Zhao, T.S.; Li, Y.S. Carbon-neutral sustainable energy technology: Direct ethanol fuel cells. Renew. Sustain. Energy Rev. 2015, 50, 1462–1468. [Google Scholar] [CrossRef]
  2. Kim, D.J.; Jo, M.J.; Nam, S.Y. A review of polymer–nanocomposite electrolyte membranes for fuel cell application. J. Ind. Eng. Chem. 2015, 21, 36–52. [Google Scholar] [CrossRef]
  3. Cho, E.-B.; Kim, H.; Kim, D. Effect of morphology and pore size of sulfonated mesoporous benzene-silicas in the preparation of poly(vinyl alcohol)-based hybrid nanocomposite membranes for direct methanol fuel cell application. J. Phys. Chem. B 2009, 113, 9770–9778. [Google Scholar] [CrossRef] [PubMed]
  4. Wang, B.-Y.; Tseng, C.K.; Shih, C.-M.; Pai, Y.-L.; Kuo, H.-P.; Lue, S.J. Polytetrafluoroethylene (PTFE)/silane cross-linked sulfonated poly(styrene-ethylene/butylene-styrene) (sSEBS) composite membrane for direct alcohol and formic acid fuel cells. J. Memb. Sci. 2014, 464, 43–54. [Google Scholar] [CrossRef]
  5. Lo, C.-F.; Wu, J.-F.; Li, H.-Y.; Hung, W.-S.; Shih, C.-M.; Hu, C.-C.; Liu, Y.-L.; Lue, S.J. Novel polyvinyl alcohol nanocomposites containing carbon nano-tubes with Fe3O4 pendants for alkaline fuel cell applications. J. Memb. Sci. 2013, 444, 41–49. [Google Scholar] [CrossRef]
  6. Fang, Y.; Yang, X.; Wang, L.; Liu, Y. An alkaline direct methanol fuel cell with a polymer fiber membrane and MnO2-catalyzed cathode. Electrochimica Acta 2013, 90, 421–425. [Google Scholar] [CrossRef]
  7. Peighambardoust, S.J.; Rowshanzamir, S.; Amjadi, M. Review of the proton exchange membranes for fuel cell applications. Int. J. Hydrog. Energy 2010, 35, 9349–9384. [Google Scholar] [CrossRef]
  8. Yu, E.H.; Krewer, U.; Scott, K. Principles and materials aspects of direct alkaline alcohol fuel cells. Energies 2010, 3, 1499–1528. [Google Scholar] [CrossRef]
  9. Wang, Y.-J.; Qiao, J.; Baker, R.; Zhang, J. Alkaline polymer electrolyte membranes for fuel cell applications. Chem. Soc. Rev. 2013, 42, 5768–5787. [Google Scholar] [CrossRef] [PubMed]
  10. Yang, C.-C. Alkaline direct methanol fuel cell based on a novel anion-exchange composite polymer membrane. J. Appl. Electrochem. 2012, 42, 305–317. [Google Scholar] [CrossRef]
  11. Lue, S.J.; Pan, W.-H.; Chang, C.-M.; Liu, Y.-L. High-performance direct methanol alkaline fuel cells using potassium hydroxide-impregnated polyvinyl alcohol/carbon nano-tube electrolytes. J. Power Sources 2012, 202, 1–10. [Google Scholar] [CrossRef]
  12. Wu, J.-F.; Lo, C.-F.; Li, L.-Y.; Li, H.-Y.; Chang, C.-M.; Liao, K.-S.; Hu, C.-C.; Liu, Y.-L.; Lue, S.J. Thermally stable polybenzimidazole/carbon nano-tube composites for alkaline direct methanol fuel cell applications. J. Power Sources 2014, 246, 39–48. [Google Scholar] [CrossRef]
  13. Gomes, A.D.S.; Dutra Filho, J.C. Hybrid membranes of PVA for direct ethanol fuel cells (DEFCs) applications. Int. J. Hydrog. Energy 2012, 37, 6246–6252. [Google Scholar] [CrossRef]
  14. Yang, J.-M.; Wang, N.-C.; Chiu, H.-C. Preparation and characterization of poly(vinyl alcohol)/sodium alginate blended membrane for alkaline solid polymer electrolytes membrane. J. Memb. Sci. 2014, 457, 139–148. [Google Scholar] [CrossRef]
  15. Qiao, J.; Fu, J.; Lin, R.; Ma, J.; Liu, J. Alkaline solid polymer electrolyte membranes based on structurally modified PVA/PVP with improved alkali stability. Polymer 2010, 51, 4850–4859. [Google Scholar] [CrossRef]
  16. Yang, C.-C.; Chiu, S.-S.; Kuo, S.-C.; Liou, T.-H. Fabrication of anion-exchange composite membranes for alkaline direct methanol fuel cells. J. Power Sources 2012, 199, 37–45. [Google Scholar] [CrossRef]
  17. Liao, G.-M.; Yang, C.-C.; Hu, C.-C.; Pai, Y.-L.; Lue, S.J. Novel quaternized polyvinyl alcohol/quaternized chitosan nano-composite as an effective hydroxide-conducting electrolyte. J. Memb. Sci. 2015, 485, 17–29. [Google Scholar] [CrossRef]
  18. Zhang, Q.G.; Liu, Q.L.; Zhu, A.M.; Xiong, Y.; Ren, L. Pervaporation performance of quaternized poly(vinyl alcohol) and its crosslinked membranes for the dehydration of ethanol. J. Memb. Sci. 2009, 335, 68–75. [Google Scholar] [CrossRef]
  19. Fang, J.; Shen, P.K. Quaternized poly(phthalazinon ether sulfone ketone) membrane for anion exchange membrane fuel cells. J. Memb. Sci. 2006, 285, 317–322. [Google Scholar] [CrossRef]
  20. Xiong, Y.; Fang, J.; Zeng, Q.H.; Liu, Q.L. Preparation and characterization of cross-linked quaternized poly(vinyl alcohol) membranes for anion exchange membrane fuel cells. J. Memb. Sci. 2008, 311, 319–325. [Google Scholar] [CrossRef]
  21. Xiong, Y.; Liu, Q.L.; Zhang, Q.G.; Zhu, A.M. Synthesis and characterization of cross-linked quaternized poly(vinyl alcohol)/chitosan composite anion exchange membranes for fuel cells. J. Power Sources 2008, 183, 447–453. [Google Scholar] [CrossRef]
  22. Yang, C.-C.; Chiu, S.-J.; Chien, W.-C.; Chiu, S.-S. Quaternized poly(vinyl alcohol)/alumina composite polymer membranes for alkaline direct methanol fuel cells. J. Power Sources 2010, 195, 2212–2219. [Google Scholar] [CrossRef]
  23. Vinodh, R.; Sangeetha, D. Efficient utilization of anion exchange composites using silica filler for low temperature alkaline membrane fuel cells. Int. J. Plast. Technol. 2013, 17, 35–50. [Google Scholar] [CrossRef]
  24. Lue, S.J.; Mahesh, K.P.O.; Wang, W.-T.; Chen, J.-Y.; Yang, C.-C. Permeant transport properties and cell performance of potassium hydroxide doped poly(vinyl alcohol)/fumed silica nanocomposites. J. Memb. Sci. 2011, 367, 256–264. [Google Scholar] [CrossRef]
  25. Khoonsap, S.; Supanchaiyamat, N.; Hunt, A.J.; Klinsrisuk, S.; Amnuaypanich, S. Improving water selectivity of poly (vinyl alcohol) (PVA)—Fumed silica (FS) nanocomposite membranes by grafting of poly (2-hydroxyethyl methacrylate) (PHEMA) on fumed silica particles. Chem. Eng. Sci. 2015, 122, 373–383. [Google Scholar] [CrossRef]
  26. Mondal, A.N.; Cheng, C.; Yao, Z.; Pan, J.; Hossain, M.M.; Khan, M.I.; Yang, Z.; Wu, L.; Xu, T. Novel quaternized aromatic amine based hybrid PVA membranes for acid recovery. J. Memb. Sci. 2015, 490, 29–37. [Google Scholar] [CrossRef]
  27. Xiong, Y.; Liu, Q.L.; Zhu, A.M.; Huang, S.M.; Zeng, Q.H. Performance of organic-inorganic hybrid anion-exchange membranes for alkaline direct methanol fuel cells. J. Power Sources 2009, 186, 328–333. [Google Scholar] [CrossRef]
  28. Lue, S.J.; Wang, S.F.; Wang, L.D.; Chen, W.W.; Du, K.-M.; Wu, S.Y. Diffusion of multicomponent vapors in a poly(dimethyl siloxane) membrane. Desalination 2008, 233, 277–285. [Google Scholar] [CrossRef]
  29. Jessie Lue, S.; Chen, J.Y.; Ming Yang, J. Crystallinity and Stability of Poly(vinyl alcohol)-Fumed Silica Mixed Matrix Membranes. J. Macromol. Sci. Part B 2007, 47, 39–51. [Google Scholar]
  30. Wang, E.D.; Zhao, T.S.; Yang, W.W. Poly (vinyl alcohol)/3-(trimethylammonium) propyl-functionalized silica hybrid membranes for alkaline direct ethanol fuel cells. Int. J. Hydrog. Energy 2010, 35, 2183–2189. [Google Scholar] [CrossRef]
  31. Lue, S.J.; Lee, D.-T.; Chen, J.-Y.; Chiu, C.-H.; Hu, C.-C.; Jean, Y.C.; Lai, J.-Y. Diffusivity enhancement of water vapor in poly(vinyl alcohol)-fumed silica nano-composite membranes: Correlation with polymer crystallinity and free-volume properties. J. Memb. Sci. 2008, 325, 831–839. [Google Scholar] [CrossRef]
  32. Ye, L.; Zhai, L.; Fang, J.; Liu, J.; Li, C.; Guan, R. Synthesis and characterization of novel cross-linked quaternized poly(vinyl alcohol) membranes based on morpholine for anion exchange membranes. Solid State Ion. 2013, 240, 1–9. [Google Scholar] [CrossRef]
  33. Zhou, T.; Zhang, J.; Qiao, J.; Liu, L.; Jiang, G.; Zhang, J.; Liu, Y. High durable poly(vinyl alcohol)/Quaterized hydroxyethylcellulose ethoxylate anion exchange membranes for direct methanol alkaline fuel cells. J. Power Sources 2013, 227, 291–299. [Google Scholar] [CrossRef]
  34. Lue, S.J.; Wang, W.-T.; Mahesh, K.P.O.; Yang, C.-C. Enhanced performance of a direct methanol alkaline fuel cell (DMAFC) using a polyvinyl alcohol/fumed silica/KOH electrolyte. J. Power Sources 2010, 195, 7991–7999. [Google Scholar] [CrossRef]
  35. Kim, D.S.; Park, H.B.; Rhim, J.W.; Moo Lee, Y. Preparation and characterization of crosslinked PVA/SiO2 hybrid membranes containing sulfonic acid groups for direct methanol fuel cell applications. J. Memb. Sci. 2004, 240, 37–48. [Google Scholar] [CrossRef]
  36. Zugic, L.D.; Perovic, M.I.; Nikolic, M.V.; Maslovara, L.S.; Marceta Kaninski, P.M. Enhanced Performance of the Solid Alkaline Fuel Cell Using PVA-KOH Membrane. Int. J. Electrochem. Sci. 2013, 8, 949–957. [Google Scholar]
  37. Fu, J.; Qiao, J.; Lv, H.; Ma, J.; Yuan, X.-Z.; Wang, H. Alkali doped poly(vinyl alcohol) (PVA) for anion-exchange membrane fuel cells-Ionic conductivity, chemical stability and FT-IR characterizations. ECS Trans. 2010, 25, 15–23. [Google Scholar]
  38. Fu, J.; Qiao, J.; Wang, X.; Ma, J.; Okada, T. Alkali doped poly(vinyl alcohol) for potential fuel cell applications. Synth. Met. 2010, 160, 193–199. [Google Scholar] [CrossRef]
  39. Ye, Y.-S.; Cheng, M.-Y.; Xie, X.-L.; Rick, J.; Huang, Y.-J.; Chang, F.-C.; Hwang, B.-J. Alkali doped polyvinyl alcohol/graphene electrolyte for direct methanol alkaline fuel cells. J. Power Sources 2013, 239, 424–432. [Google Scholar] [CrossRef]
  40. Pan, W.-H.; Lue, S.J.; Chang, C.-M.; Liu, Y.-L. Alkali doped polyvinyl alcohol/multi-walled carbon nano-tube electrolyte for direct methanol alkaline fuel cell. J. Memb. Sci. 2011, 376, 225–232. [Google Scholar] [CrossRef]
  41. Zeng, L.; Zhao, T.S.; Li, Y.S. Synthesis and characterization of crosslinked poly (vinylalcohol)/layered double hydroxide composite polymer membranes for alkaline direct ethanol fuel cells. Int. J. Hydrog. Energy 2012, 37, 18425–18432. [Google Scholar] [CrossRef]

