Abstract
Electricity consumption is often the hotspot of life cycle assessment (LCA) of products, industrial activities, or services. The objective of this paper is to provide a consistent, scientific, region-specific electricity-supply-based inventory of electricity generation technology for national and regional power grids. Marginal electricity generation technology is pivotal in assessing impacts related to additional consumption of electricity. China covers a large geographical area with regional supply grids; these are arguably equally or less integrated. Meanwhile, it is also a country with internal imbalances in regional energy supply and demand. Therefore, we suggest an approach to achieve a geographical subdivision of the Chinese electricity grid, corresponding to the interprovincial regional power grids, namely the North, the Northeast, the East, the Central, the Northwest, and the Southwest China Grids, and the China Southern Power Grid. The approach combines information from the Chinese national plans on for capacity changes in both production and distribution grids, and knowledge of resource availability. The results show that nationally, marginal technology is coal-fired electricity generation, which is the same scenario in the North and Northwest China Grid. In the Northeast, East, and Central China Grid, nuclear power gradually replaces coal-fired electricity and becomes the marginal technology. In the Southwest China Grid and the China Southern Power Grid, the marginal electricity is hydropower towards 2030.
1. Introduction
China has been becoming the world’s leading manufacturer. The population has exploded and the standard of life has increased over the past decades. All these activities have caused an increase in the energy consumption, especially regarding electricity. In order to meet the rapidly increasing electricity demands in China, the power capacity also has to be increased at a rapid pace. Power capacity changes are aimed at shutting down inefficient and highly polluting power plants and investing in new power plants based on both fossil fuels with high efficiency and renewable resources [1,2]. Fossil fuels, especially coal, are the dominant resource in the energy system and in power generation, which accounted for around 67% of total power capacity in 2014. Fossil fuels play a major role not only in the existing power generation but also in the newly installed power technology. In the meantime, national supports for renewable energies have also grown since the Renewable Energy Law was implemented in 2006 [3]. The Chinese Central Government intends to convert energy systems into sustainable systems due to climate change, and international and national environmental pressure. In 2016, the Chinese government signed the Paris Agreement with the goal to cut its carbon emissions per unit of Gross domestic product (GDP) by 60%–65% by 2030 from its 2005 levels, and was set for 40%–45% in 2020. It also aimed to increase non-fossil fuel sources in primary energy consumption to about 20% and peak its carbon emissions by 2030. The high CO2 emissions in China are mainly due to its huge dependency on fossil fuel. One major factor for substantial CO2 reductions is to shift from fossil fuel power generation to renewable energy sources. The Chinese government shut down coal power plants and now promotes renewable energy investment to meet the target for the end of the decade [4,5]. Hydropower represents the second largest power technology invested in from 2010 to 2014. The total capacity of hydropower was 201.37 GW [6,7]. After the Fukushima Daiichi nuclear disaster, the Chinese central government put off nuclear power projects. However, under the pressure of its emissions goal for 2020, nuclear power has been considered to be crucial in China’s strategy to decrease its reliance on fossil fuel after 2014. Not only were the suspended nuclear power projects restarted, but new nuclear projects have also been approved [8,9,10]. Wind power, another sustainable energy source, has been the fastest-growing power technology over the past years in China, which has increased from 51.94 GW in 2010 to 86.82 GW in 2014.
Local electricity consumption is mainly supplied by power generated from the regional power grids, namely (1) the North China Grid; (2) the Northeast China Grid; (3) the Central China Grid; (4) the East China Grid; (5) the Northwest China Grid; (6) the Southwest China Grid; and (7) the Southern China Power Grid. Owing to the large regional variation, potential resources for energy production, and variations in electricity consumption, renewable energy development has been given different roles and investments in different regions (Figure 1). Figure 1 shows the regional power generational trends from 2010 to 2014, which differ from the national generation trend. In the region of the North China Grid and Northeast China Grid, wind power and thermal power were the two main newly installed technologies. In the region of the Southwest China Grid and Southern China Grid, hydropower was almost twice as high as thermal power in terms of newly installed technology. Therefore, the national power demand changes do not reflect changes or impacts of power consumption in the regional power grids.
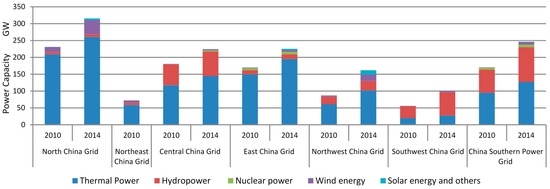
Figure 1.
Power capacity in the regional grids in China in 2010 and 2014; unit: GW. Source: Reproduced with permission from [6,11].
Energy consumption, especially electricity, is often identified as a hotspot for the outcomes of life cycle assessment (LCA) studies of different products, industrial activities, or services both inside and outside of China [12,13,14,15,16]. The electricity consumption is so important that many studies have conducted an LCA to address the CO2 emissions from electricity production itself [17,18,19,20]. The problem is not just the lack in knowledge of the electricity consumption, but also how electricity information in used in LCA models. In most of the LCA studies in China, the average electricity from the national grids or the electricity generated from coal is employed to analyze the environmental impacts [14,16]. It is a very inaccurate and arbitrary conclusion that China’s power and the energy consumption will be based on coal. Therefore, this paper aims to capture the electricity sources in the seven regions of China and provide a picture of consequences arising from increasing or decreasing electricity demands in these regions.
The main purpose of this paper is to identify the affected power technology when increasing or decreasing electricity consumption in different regions of China between now and 2030. The affected technology can be employed to conduct future LCA studies. The following six sections will attempt to achieve the objective. In the first section, the importance of this paper and the development of electricity generation are introduced. In the second section, the methodology for identifying marginal electricity technology is elaborated on and the national marginal electricity technology is reviewed and discussed. In the third section, current developments and achievements of the power generation are analyzed. The developments of the power grid in the next 10 years are discussed in this section too. In the fourth section, the marginal supply of electricity generation technology is identified in two scenarios considering grid capacity assumptions. In the fifth section, the uncertainty of identifying marginal power technology process is discussed. In the last section, the results and discussion of the fourth and fifth sections are concluded upon.
2. Method
2.1. Life Cycle Assessment
LCA examines environmental impacts throughout a product’s life cycle from cradle to grave, from raw material acquisition through production, use, and disposal [21]. The methodologies originated in the late 1960s, focusing on process use of energy and raw materials, but in the beginning of the 1990s, it took a great leap forward that led to standardization and development of many competing methods that now cover many different impact categories. The International Reference Life Cycle Data System (ILCD) handbook, which was developed by European Commission Joint Research Centre (EC-JRC), provides guidance for conducting an LCA [22]. Four mandatory phases and two optional phases are defined, which are the goal and scope definition, inventory analysis, impact assessment, interpretation, normalization, and weighting. These phases are also in consonance with the international standards on LCA [21,23].
“Electricity consumed” data used in LCA studies is a critical factor in modeling LCA and comparing LCA studies from different practitioners. The major task is to trace the power source from a power grid, which is normally mixed with different power generation technologies. The results of LCA analysis might have a big difference in choices of power technologies [19]. The methods for assessing the impacts of electricity consumed in the life cycle of a product have been, and remain to be, a highly debated question [24,25,26,27]. Two main approaches of modeling LCA try to address this question, named (1) attributional approach and (2) consequential approach [25]. The differences between the two methods are the result of the choice of goal and scope definition, and system modeling [25,27,28]. Attributional LCA addresses the physical material flows to and from a product or a process, while consequential LCA describes changes of environmental flows in response to potential demand changes or policy decisions. Average data and marginal data are used that correspond to attributional and consequential LCA studies.
2.2. Marginal Technology
In consequential LCA, in order to analyze changes, the technology, which is affected by a small change in demand, needs to be identified. This affected technology is called marginal technology. Thus, marginal technology is the technology that can respond to changes in demand on the market. The approach to identifying long-term marginal power technology is mainly based on the current and future power generation, energy regulation, and energy system development. In this paper, the marginal electricity will be identified considering both national power strategy, and regional electricity demand and energy resource availability. The process can be organized into five steps [29,30]. The functional unit of the analysis is 1 KWh electricity.
- What time horizon does the study apply to?
- Do the changes in production volume only affect specific processes or is a market affected?
- What is the trend in the volume of the affected market? If a market is affected, we must determine the relevant market segment.
- Does this technology have a potential to provide the desired capacity adjustment?
- Is this technology the preferred object of the desired capacity adjustment?
According to the methodology, step 1 is to define the time perspective. Based on the national planning and available data, the marginal electricity technology applies to 2030 for this paper. This methodology is also applied to verify the historical marginal electricity since 2000. With statistics of the historical electricity capacity with different technologies, the actual marginal technology is identified. Step 2 is to define the market boundary. Boundary conditions are important in LCA studies and energy system analyses and must be adequately taken into account. The system boundary is developed based not only on the physical product flow but also market information, i.e., information on alternative energy substitution in different market segments and regional markets, and market reaction to these choices. In this paper, both national and regional electricity markets are under analysis. Step 3 is to define the volume changes of the electricity markets. The trend of power capacity will be elaborated on and analyzed in Section 3. Step 4 is to define the technology with the capacity of providing demand adjustment. The proposed marginal technology should not be constrained, i.e., by resource available and political restraints. Step 5 is to define the technology that is the preferred technology based on the demand.
Marginal electricity is the most affected electricity generation technology if the demand for electricity changes either for long-term marginal technology or for short-term marginal technology. The short-term marginal technology is the effect of short-term electricity demand changes. It is the existing technology which responds to a small change in demand. The long-term marginal technology is the technology responding to the long-term electricity demand changes or planning. Long-term marginal technology compared with short-term marginal technology involves replacement of power generation equipment [29]. In the power sector, long-term technology was identified by the 2.0 report at the national perspective both in China and a number of other countries [31]. Short-term marginal power technology has been identified in Demark. The authors argued that long-term marginal power technologies need to be a part of the energy system in the end. In the energy system, marginal electricity production is based not only on the marginal change in power capacity, but also on the energy system [32,33]. Long-term marginal power technology does not have a direct relationship with short-term technology. For example, if electricity demands are increasing in one region, and it is decided that all future investment is to be in wind power, then the long-term marginal power technology will be wind power. After the wind power has gone into operation, the energy system would balance the electricity production from different energy resources. This is if we assume that the existing coal power plants with low efficiency are turned off during off-peak load electricity demand and turned on during peak load electricity demand. In this case, even though wind power is the long-term marginal technology for the current energy system, the short-term marginal technology will not be wind power; it will be the old coal power plants with low efficiency that still exist in a new energy system.
The increased power demand requires that the marginal technology has the ability to meet this increased demand. It should exclude constrained technology and resources. The constrained technologies include those subject to natural, political, or market constraints. The natural constrained technology cannot meet the demand adjustment due to technology limitations or constrained resources. The politically constrained technology is not the preferred technology that meets the demand adjustment by policy strategy. Renewables are politically preferred energy sources to meet electricity demands. The renewable power technologies are hydropower, wind power, biomass and waste power generation, solar energy, and other renewable energy. Biomass is mainly the byproduct of agricultural, forestry, or human activities. Biomass is therefore constrained by resources that do not have the potential to provide the desired electricity capacity adjustment. Wind power and solar energy are constrained by resources and the transmission capacity to the power grid for at least the next 10 years. Wind power and solar energy have the potential to become the marginal technologies with the development of energy storage technology and grid transmission capacity in the future. Therefore, the potential marginal power technology includes technologies that are coal power technology, hydropower, and nuclear power. Since some technologies cannot be adjusted to the potential demands, they are excluded marginal technologies, like wind power and solar power.
3. Power System
3.1. National Power Generation Technology and Planning
In China, the demand and consumption of energy and electricity have been increasing since the beginning of 20th century. The energy investments shifted from only fossil fuels in the beginning to both fossil fuels and renewable energies in the past 20 years. Even though fossil fuels, mainly coal, will continue to be the main energy source of China’s power generation, the increased energy resources are becoming more diverse than ever. Electricity production based on oil, gas, and geothermal are too small compared to other energy resources, as natural gas and oil are consumed mainly by transportation in China. By the end of 2014, among the coal power plants in operation, more than 70% of the coal-fired generators employed subcritical technology with the capacity of 300 MW [6]. Statistics and planning for the power productions from the Chinese energy authority are the main data source of electricity production. According to the National Energy Technology 12th Five-Year Planning, the total power capacity was planned to be 1437 GW by 2015. The actual installed power capacity is 15038 GW, which is higher than the planned power investment [11]. Thermal power capacity was planned to be 933 GW by 2015, which was actually 990.21 GW in 2015. The installed capacity was approximately the planned capacity. The planned thermal power capacity will reach 1160 GW by 2020. The capacity of hydropower was planned to be 284 GW, and was 319.37 GW in 2015. The total annual theoretical amount of energy output is 6082.9 TWh based on possible water resources within the limitations of current technology in China. The total gross theoretical capacity is 694.4 MW, and the technically exploitable capacity is 541.64 MW. Based on the water resources, the capacity of hydropower can reach about 350 GW by 2020 [34]. By 2030, the expected capacity would be 52 GW, and the remaining investment of hydropower is in the branches of the rivers situated in Sichuan and Yunnan (35.5 GW). By 2020, hydropower capacity would be 330 GW. By 2030, all water resources, except for those of Tibet, will be developed. The aim of promoting renewable power is to reduce the dependency on fossil fuels, because the electricity demand was expected to increase steeply. As the construction process of nuclear power plants might take decades, the capacity of nuclear power is predicted based on the nuclear plants which are currently being constructed or approved to build between 2020 and 2030. In 2010, electricity production was double or even triple compared to that in 2000. Wind power and nuclear power, as the new energy sources, began to come into the market between 2000 and 2010. In order to estimate power production, the average operation hours in 2015 was taken as the operation hours. The annual operation hours of thermal power was 4329 h, which decreased to 410 h compared with that in 2014. The annual operation hours for hydropower was 3429 h, which decreased to 48 h compared with that in 2014; the annual operation hours of nuclear power was 7350 h, and the annual wind power operation hours was 1728 h. The reason the operation hours of power generation decreased in 2015 is that Chinese economic growth slowed down, which was also the reason for lower electricity demand than expected. Electricity production from different technologies from 2000 to 2030 are shown in Table 1.

Table 1.
Electricity production in China in 2000, 2010, 2020, and 2030.
Table 1 shows that the changes among power technologies in China from 2000 to 2030. The largest increased power productions are expected during the period between 2010 and 2020, which is calculated as 3434 TWh in total. The electricity generated from thermal power plants accounts for the largest share of both power production and increased power productions since 2000 until 2030. The shares of electricity from thermal power are decreased from around 73% to 65% for the period of 2020 to 2030. On the contrary, the shares of renewable-based electricity are increased dramatically, especially wind power and nuclear power. With such data, the actual national marginal electricity is identified, which is coal, which means the electricity generated based on coal is employed in the LCA studies.
3.2. Regional Power Generation Technology and Planning
The demand determines the investments; however, the national electricity demand cannot represent the regional situation. National energy planning and power regulations are formulated by the central government. Regional energy planning, especially power generation planning following national planning, is created by local authorities based on the local potential energy resources. The power demand is not equal in different regions; normally the demand is higher in the east than in the west. This unequal power demand causes the reallocation of electricity generation investment. Due to the energy resource allocation, renewable energies are expanding both in terms of capacity and geographical spread. The most likely energy scenario in China is more diverse than before, and because economic development is slowing, the energy demand is getting lower than expected.
In order to increase coal utilization efficiency and cut the transportation distance, large coal-fired power plant bases are planned to be built up in the areas rich in coal resources, which can combine coal mining and coal power in the closest area. Coal is mainly located in the provinces of Inner Mongolia, Shaanxi, and Shanxi. These three provinces are situated in the North China Grid and Northwest China Grid, respectively. China still has great potential for hydropower in the next 10–20 years, as there are large hydropower resources in the western regions, where hydropower has not yet been explored. Therefore, hydropower is not a constrained technology, according to marginal technology methodology. The development of hydropower will be more focused in the regions of southwestern and central China in the next 10 years. By 2020, the hydropower resources in the eastern and central regions of China will be explored more than 95%; the hydropower resources in the western region will be explored more than 60% [11]. After 2020, the main hydropower development will be located in southwestern China. The national nuclear power projects and planning were postponed after Fukushima accident. However, due to the increasing concern about air quality and depletion of energy resources, the national central government approved new nuclear power projects and planning [8,9,10]. The new planned installations for nuclear power generation are mainly located in the East China Grid and China Southern Power Grid.
Nationally, coal-based power generation technology took the largest share of newly installed electricity generation from 2000 to 2010. The hydropower investment took the second place for power generation investment in China during that time period. When coming to the regional power grid market, it is a different picture compared to the national investment (Figure 2). From 2000 to 2010, coal-based electricity technology was the largest power investment technology in China’s regional power grid except for the Southwest China Grid; hydropower had been the main power technology in the Southwest China Grid since 2000. Hydropower power had been installed in the southwest region, where water resources are mainly located. The objective of this regional power grid is to increase the efficiency of hydropower utilization and transmission to the North China Grid and East China Grid. In the North and Northwest China Grids, coal-based electricity takes the largest share of newly installed electricity generation from 2000 to 2030, especially in the Northwest China Grid. These two regions are rich in coal reserves, but low energy consumption. In the Northwest China Grid, coal-based electricity technology accounts for 95% of the new investments from 2010 to 2020, which decreases to 70% between 2020 and 2030. In the North China Grid, coal-based electricity technology contributes around 50% of the increased power generation from 2000 to 2030. In the Northeast China Grid, the shares of newly coal–based power generation decrease gradually from 85% in 2000 to 24% in 2030. Wind power has the largest increase in electricity technology from 2020 to 2030. In the East China Grid, the investment mainly focuses on nuclear power and wind power after 2010. In the Central China Grid, nuclear power, replacing thermal power and hydropower, becomes the largest newly installed power technology after 2010. In the Southern China Power Grid, increased electricity generation is a mix of these three power technologies, which are coal-based power generation, hydropower, and nuclear power. The shares of nuclear power and hydropower increase gradually.

Figure 2.
The share of newly installed power generation in the regional grids in China from 2000 to 2030.
3.3. Power Grid Structure and Development
After years of development and reformation, the power industry established two large state-owned grid companies in 2002, namely the State Grid Corporation of China and the China Southern Power Grid Corporation. The State Grid Corporation of China included five regional power grids, which were the Northeast, North, Central, East, and Northwest China Grid at that time. The objective of the power reformation was to build a fair competitive electricity market and power grid connections. The two main reasons for grid connections are energy resource distribution and power demand differences in China. The coal mines are located mostly in the Northwest China Grid and the hydro potential mostly in the southwest, where the electricity load centers are in the coastal areas of eastern China. Thus, the long distance transmissions and interconnection between regional grids are needed. Since the reforms in the power sector, the National Grid Company has connected the provincial grids to the inter-regional grid [37]. The interconnection with the regional power grid started with the connection between the North China Grid and the Northeast China Grid in 2001. After the Three Gorges Dam started operation, the Central China Grid—where the biggest hydropower was located—became the main electricity deliverer to other regional power grids. In 2003, the Central China Grid was connected to the China Southern Power Grid and the East China Grid. The Central China Grid completed the nationwide grid interconnection after being connected to the Northwest Power Grid [38]. Later, with the completion of the Three Gorges Dam and transmission system, the Central China and Northwest China Grids were connected in June 2005 [39]. Considering the distribution of the energy resources of the country and the development strategy and analysis of the power demands, a new regional power grid, named the Southwest China Grid, was established in 2015, which covers Sichuan, Chongqing, and Tibet. These three provinces have the largest potential hydro resource. The main purpose of the new regional power grid is to transfer hydroelectricity to the neighbor grids more efficiently.
The main electricity receiver is the East China Grid, which gets electricity from the regional grids close to the region. In order to balance energy resources and energy consumption, the ideal development of the power grid is to build a large national power grid [39]. The Chinese government has increased investment in the regional transmission of various generation resources into the power grid with a long distance. The power grid interconnections in China become nationwide, but the inter-regional/province-connected power grid is still weak and the capacity of interconnection transmission is low (Figure 3). The electricity from the Northeast China Grid, mainly generated from coal and wind power plants, was transmitted to consumers in the North China Grid. Electricity generated from hydropower in the Central China Grid was transmitted to consumers in the South China Grid and East China Grid. Electricity generated from coal power plants in the Northwest China Grid was transmitted to meet the electricity demands of the regions in the Central and North China Grids. The electricity transmission was also carried between hydropower in the Central and Southwest China Grids, and thermal power in the Northwest and North China Grids. Based on the current grid transmission capacity, China has not built a strong nationally connected grid. In 2014, the total electricity transferred between regional grids was 270.76 TWh, which accounted for less than 4.8% of total electricity consumption (Figure 3). The largest electricity receiver is the East China Grid in 2014, which received 148.4 TWh from the North, Central, and Southwest China Grids. The power grid utilizations of the interconnection between regional grids were more than 50% of their design capacity, except the ultra-high voltage (UHV) power grid between the North and Central Grids. The power grid utilization between the Northeast China and North China Grids was 90% of the design capacity, which was 80% from the Northwest China Grid to the North China and Central China Grid. In order to manage the regional power grid, the Southwest China Grid was established in order to transfer green electricity to the East China Grid. The data showed that the transmission capacity between regional grids was lower compared to the electricity demand. Based on the current grid transmission capability between regional grids, it is unrealistic that the increased demand for electricity in one region relies on transmission from another region. The electricity transmission capability between inter-regional grids highly relies on the grid infrastructure.
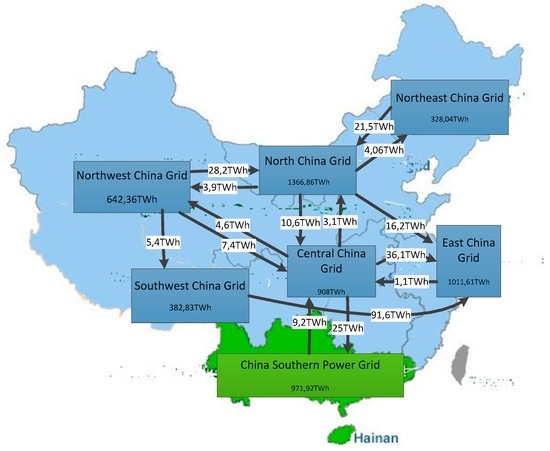
Figure 3.
The transmitted electricity between regional grids in 2014. Source: Reproduced with permission from [6].
3.4. Interconnections Power Grid Transmission Planning
Besides the exploitation of the huge potential hydropower mostly in the southwest, most coal deposits and large-capacity wind farms are located in the northwest of China. The energy consumption is concentrated in the more urbanized and highly populated eastern and southern regions of China. The unbalanced distribution of energy resource supply and demand requires regional power interconnection and a great amount of transmission. Electricity, generated from coal-rich regions in northern and western China is transmitted to developed regions in eastern and southern China, which is more efficient than physically transporting coal. The strength of transmitting electricity, instead of energy resources, can easily be seen from hydropower and wind power, where the energy resource cannot be transported. The UHV technology can overcome the mismatch between the geographic locations of major energy resources and the country’s main electricity load centers.
Based on the planning of the power grid network in China, China plans to build the seven regional power grids interconnecting with the UHV power transmission grid. The State Grid Corporation has focused its efforts on building up a UHV network to serve as the backbone for a system that will incorporate large-scale, intermittent, renewable power from remote sources [6]. The long-distance transmission networks and active power distribution networks can fully link the hydropower as well as wind and coal energy resource bases in western China with main electricity load centers in the east and south of the country. By 2020, China plans to build a strong power grid with UHV AC and UHV DC technology that joins the North, East, and Central Grids as the receiving electricity sides, and the Southwest and Northwest Grids as main sides for delivering electricity [40]. The plan of UHV AC line includes at least three “west–east” transmission lines and three “north–south” long-distance lines across the country (Figure 4). Accordingly, huge power flows are delivered from thermal power plants in the north and northwest and from hydropower plants from the southwest to the electricity load centers in the east and center of China, as shown in Figure 4. With significant enough installed capacity in a new coal-fired power plant, the North and Northwest China Grid would be in a position to export electricity to the East China Grid via existing UHV lines. Along with huge hydropower investment in the southwest of China, electricity generated from hydropower station in the Southwest China Grid would be transmitted to consumers in the South and East China Grid. If the smart grid with UHV technology can transmit electricity without obstacles among regional and local grids, this means these regional power grids will be connected completely.

Figure 4.
China’s national power grid plan for 2020. Source: Reproduced with permission from [41].
4. Results
Even though the transmission capacity will continue to be expanded according to market demand, the current boundaries between regional power grids in China will continue to exist for a very long time. Under this situation, the power grids do not have the capacity to transmit all of the demanded electricity, and the electricity exchanges within regional power markets are furthermore dependent on the price level and differences in electricity prices in the Chinese market, which makes it necessary to make two scenarios of electricity market boundary to identify marginal electricity technology according to the methodology of identifying marginal technology.
One scenario is based on the assumption that the UHV power grid and smart grid strategy can make the Chinese power grid highly connected. This means that electricity demands in one region of China can be supplied and transmitted from any other regions. In this scenario, the electricity market is a fully connected national market. Another scenario is based on the current electricity market and grid transmission capacity. After the power sector reforms, the principal management of electricity transmission is the unified dispatch and hierarchical management in China. The inter-regional/province connected power grid is still weak. In this scenario, the electricity market is based on the regional markets. The connection of the regional grids is just a way to use energy resources and optimize the electricity transmission system. Based on the resource ability in regional grids and energy resources distribution, the marginal power technology in the regional grid is presented in Table 2.
Table 2.
Marginal technology in China’s power generation sector towards 2030.
In the first scenario, the marginal electricity technology will be coal-fired electrical technology, which is the major power investment until 2030 (Table 2). The data of electricity consumption based on coal-fired technology can be employed to conduct consequential LCA of products. This is also how most of LCA studies collect data of electricity consumption in China. In the second scenario, the marginal technology is identified in the regional grids. The marginal technology is shown in Table 2. Coal-fired technology accounts for the major share of the newly installed electricity generation in the North, Northeast, Northwest, and East China Grids from 2000 to 2020, which defines coal-fired technology as the marginal technology in these regions for this period of time. From 2020 to 2030, nuclear power will replace coal-fired generation technology and become the marginal technology in the Northeast and East China Grids. In the Central China Grid, coal-fired technology was the marginal technology from 2000 to 2010. Marginal electricity technology shifts from coal-fired technology to nuclear power in the period from 2010 to 2030. In the Southwest China Grid, marginal electricity technology is hydropower from 2000 to 2030. In the China Southern Power Grid, marginal electricity technology shifts from coal-fired technology from 2000 to 2020 to hydropower of the period from 2020 to 2030. For the new investment of coal-fired technology, marginal supply technology would be cleaner coal technology (CCT). CCT would be a large capacity employing ultra-supercritical technology.
5. Discussion
Electricity consumptions are important and unique for LCA studies. However, it is impossible to trace the electricity generated in a given power plant through the transmission and distribution system to a specific electricity consumer. The consequence of increasing/decreasing electricity demands is to install new power capacity or to shut down the less efficient power plant in the long term. The newly installed power technology from increasing electricity demand scenario and the closed power technology from decreasing electricity demand scenario is identified as marginal technology. The Chinese energy demand is predicted (by International Energy Agency (IEA)) to peak around 2030 [2], so the marginal electricity technology is supposed to be the newly installed power technology, which is likely the most competitive technology. The national marginal technology is identified as coal-fired technology. The marginal technology in regional power grids is identified as the newly invested technology response to the increased electricity demands and green energy transition. Hydropower, which would normally be regarded as “constrained” from a resource availability point of view, could actually be regarded as the capacity installed in order to meet electricity demands until 2030. So, hydropower is identified as the marginal technology in the Southwest China Grid and the China Southern Power Grid. Nuclear power is also an alternative of power technology in the central and eastern regions, where there is lack of fossil fuels. In the North and East China Grids, the largest investment of power technologies is wind power from 2020 to 2030, but wind energy is not identified as the marginal technology because of technology constraints, as discussed in the methodology. Nowadays, the pressure of wind power curtailment is still the constrained factor for wind electricity to meet the electricity demand. In the future, the wind power curtailment situation will be improved with the strengthening of the power grid technology improvement in the two regions of China, particularly the completion of the UHV line as the main channel of wind power transmission [42,43,44]. In the long term prognosis of the power system, electricity generated based on renewables may meet the entire electricity demand ultimately.
It is still unpredictable how the power generation market is going to develop in the future. The uncertainty of identifying marginal electricity technology will be dominated from forecasting regarding the market trends, market constraints, and technology development. The changes in the market volume result from the accumulation of a large amount of individual power investment. The individual power investment is typically a continuous process influenced by several parameters, e.g., energy policy, prices of different energy sources, and technology development. The cost determines the competitiveness of electricity technology. In general, the depletion of fossil fuels will cause the cost increase. On the contrary, the cost of renewable energies will continue to fall because of technology development. However, the cost itself, like a black box, holds high uncertainty, especially referring to future energy resources cost, environmental costs, social costs, and other additional costs. The longer time horizon included, the higher the uncertainty introduced in the determination of market trends and cost.
Marginal changes cannot be isolated to a single regional or national market, since the electricity market is highly influenced by the national and international policy. Quotas, taxes, or subsidies that are exclusively politically motivated, and not reflecting an underlying resource constraint, are often temporary and may in some situations be influenced by changes in demand. The decision to increase nuclear power and renewable energies has already been made and is being implemented. The ultimate goal of energy development would be that the entire power demand is met by renewable energies. Not all plans and policies presented in the publications are implemented or the policies may turn out not to have the planned effect. External factors, such as future fuel prices and CO2 quota prices, also may affect the marginal capacity to be installed. The situation is complicated by the fact that the various phases frequently give way to each other within just a short time and above all the transitions are not entirely predictable. It is therefore recommended to apply a sensitivity analysis to constraints based on such political regulation.
6. Conclusions
This paper has addressed the marginal technology on the basis of consequential LCA methodology towards 2030. The objective of consequential LCA studies is to address the consequence of a possible decision or policy planning. Employing data based on marginal technology instead of average technology can help LCA studies to assess the impacts of the marginal changes. China covers a large geographical area with a supply grid, that is arguably equally or less integrated. Therefore, we suggest an approach to achieve a geographical subdivision of the Chinese electricity grid, corresponding to the seven interprovincial regional power grids, namely the Northeast, North, East, Central, Northwest, and Southwest China Grids and the South China Power Grid. The results from our analysis can help with data collection regarding the electricity consumed in the LCA studies in different regions of China. In this paper, the arguments for choosing coal as the national marginal technology is based on either the fact that coal is often the cheapest solution when new capacity is built or the fact that coal is the easiest energy source to obtain and convert compared to others.
The current situation is that the power transmission grid capacity is very limited compared to the national electricity demand. Due to the imbalanced economic development and energy resources from these regions, consequences of increasing electricity demands are not the same. Even more importantly, the technologies and energy sources used (fossil fuels, hydro, nuclear, etc.) are different on the different grids. Hydropower has been identified as a potential marginal electricity technology in the Southwest Power Grid since 2000, and therefore the increased electricity demand has been met by hydropower. In the Northeast, East, and Central China Grids, nuclear power will gradually become marginal technology by replacing coal between 2010 and 2030. In the Northwest and North China Grids, where main coal bases are located, coal will be the new power technology investment in response to electricity demand.
The methodology of identifying the marginal technology is based on current information to predict future planning. The challenge of future studies is the uncertainty both from policy and technology development. In any case, the sensitivity analyses are recommended in the future studies.
Acknowledgments
This Communication summarizes and reports on the research and observations of others, whose work is acknowledged in the text and references. It was not funded by any grant of other funding.
Author Contributions
The first author designed the study, carried out field work, data analysis and developed the manuscript. The second author did extensive reviews of the methodology, draft organization and editing of the work. The third author did data collection and editing of the work.
Conflicts of Interest
The authors declare that they have no conflicts of interest.
References
- International Energy Agency (IEA). World Energy Outlook 2012; International Energy Agency: Paris, France, 2012. [Google Scholar]
- International Energy Agency (IEA). World Energy Outlook 2015; International Energy Agency: Paris, France, 2015. [Google Scholar]
- National People’s Congress (NPC). The Renewable Energy Law of the People’s Republic of China; National People’s Congress: Beijing, China, 2006.
- Wang, Q.; Chen, X. Energy policies for managing China’s carbon emission. Renew. Sustain. Energy Rev. 2015, 50, 470–479. [Google Scholar] [CrossRef]
- Han, J.; Ouyang, L.; Xu, Y.; Zeng, R.; Kang, S.; Zhang, G. Current status of distributed energy system in China. Renew. Sustain. Energy Rev. 2016, 55, 288–297. [Google Scholar] [CrossRef]
- Editorial Board of China Electric Power Yearbook. China Electric Power Yearbook 2015; China Electric Power Press: Beijing, China, 2015. [Google Scholar]
- Kong, Y.; Wang, J.; Kong, Z.; Song, F.; Liu, Z.; Wei, C. Small hydropower in China: The survey and sustainable future. Renew. Sustain. Energy Rev. 2015, 48, 425–433. [Google Scholar] [CrossRef]
- Zeng, M.; Liu, Y.; Ouyang, S.; Shi, H.; Li, C. Nuclear energy in the Post-Fukushima Era: Research on the developments of the Chinese and worldwide nuclear power industries. Renew. Sustain. Energy Rev. 2016, 58, 147–156. [Google Scholar]
- Guo, X.; Guo, X. Nuclear power development in China after the restart of new nuclear construction and approval: A system dynamics analysis. Renew. Sustain. Energy Rev. 2016, 57, 999–1007. [Google Scholar] [CrossRef]
- The Current Statue of Nuclear Power Project in China [Internet]. Finance China. 2014. Available online: http://finance.china.com.cn/industry/energy/special/2014cqyhhd/index.shtml (accessed on 6 May 2015).
- Editorial Board of China Electric Power Yearbook. China Electric Powe Yearbook 2011; China Electric Power Press: Beijing, China, 2011. [Google Scholar]
- Lopes, E.; Dias, A.; Arroja, L.; Capela, I.; Pereira, F. Application of life cycle assessment to the Portuguese pulp and paper industry. J. Clean. Prod. 2003, 11, 51–59. [Google Scholar] [CrossRef]
- Guo, R.; Hanaki, K. Potential and life cycle assessment of biodiesel production in China. J. Renew. Sustain. Energy 2010, 2, 1–15. [Google Scholar] [CrossRef]
- Li, C.; Nie, Z.; Cui, S.; Gong, X.; Wang, Z.; Meng, X. The life cycle inventory study of cement manufacture in China. J. Clean. Prod. 2014, 72, 204–211. [Google Scholar] [CrossRef]
- Lundin, M.; Bengtsson, M.; Molander, S. Life cycle assessment of wastewater systems: Influence of system boundaries and scale on calculated environmental loads. Environ. Sci. Technol. 2000, 34, 180–186. [Google Scholar] [CrossRef]
- Wu, H.J.; Yuan, Z.; Zhang, L.; Bi, J. Life cycle energy consumption and CO2 emission of an office building in China. Int. J. Life Cycle Assess. 2012, 17, 105–118. [Google Scholar] [CrossRef]
- Zhao, G.; Chen, S. Greenhouse gas emissions reduction in China by cleaner coal technology towards 2020. Energy Strategy Rev. 2015, 7, 63–70. [Google Scholar] [CrossRef]
- Fan, J.; Kalnes, T.N.; Alward, M.; Klinger, J.; Sadehvandi, A.; Shonnard, D.R. Life cycle assessment of electricity generation using fast pyrolysis bio-oil. Renew. Energy 2011, 36, 632–641. [Google Scholar] [CrossRef]
- Curran, M.A.; Mann, M.; Norris, G. The international workshop on electricity data for life cycle inventories. J. Clean. Prod. 2005, 13, 853–862. [Google Scholar] [CrossRef]
- Kim, S.; Dale, B. Life cycle inventory information of the United States electricity system. Int. J. Life Cycle Assess. 2005, 10, 294–304. [Google Scholar] [CrossRef]
- International Organization for Standardization (ISO). Environmental Management—Life Cycle Assessment—Principles and Framework; 14040; International Organization for Standardization: Geneva, Switzerland, 2006. [Google Scholar]
- EC-JRC (European Commission-Joint Research Centre). International Reference Life Cycle Data system (ILCD) Handbook—The General Guide for Life Cycle Assessment—Detailed Guidance. 2010. Available online: http://publications.jrc.ec.europa.eu/repository/bitstream/JRC48157/ilcd_handbook-general_guide_for_lca-detailed_guidance_12march2010_isbn_fin.pdf (accessed on 10 September 2013).
- International Organization for Standardization (ISO). Environmental Management—Life Cycle Assessment—Requirements and Guidelines; 14044; International Organization for Standardization: Genava, Switzerland, 2006. [Google Scholar]
- Thomassen, M.A.; Dalgaard, R.; Heijungs, R.; de Boer, I. Attributional and consequential LCA of milk production. Int. J. Life Cycle Assess. 2008, 13, 339–349. [Google Scholar] [CrossRef]
- Ekvall, T.; Azapagic, A.; Finnveden, G.; Rydberg, T.; Weidema, B.P.; Zamagni, A. Attributional and consequential LCA in the ILCD handbook. Int. J. Life Cycle Assess. 2016, 21, 293–296. [Google Scholar] [CrossRef]
- Rehl, T.; Lansche, J.; Müller, J. Life cycle assessment of energy generation from biogas—Attributional vs. consequential approach. Renew. Sustain. Energy Rev. 2012, 16, 3766–3775. [Google Scholar] [CrossRef]
- Zamagni, A.; Guinée, J.; Heijungs, R.; Masoni, P.; Raggi, A. Lights and shadows in consequential LCA. Int. J. Life Cycle Assess. 2012, 17, 904–918. [Google Scholar] [CrossRef]
- Schmidt, J.H. System delimitation in agricultural consequential LCA. Int. J. Life Cycle Assess. 2008, 13, 350–364. [Google Scholar] [CrossRef]
- Weidema, B.P.; Frees, N.; Nielsen, A.M. Marginal production technologies for life cycle inventories. Int. J. Life Cycle Assess. 1999, 4, 48–56. [Google Scholar] [CrossRef]
- Ekvall, T.; Weidema, B.P. System boundaries and input data in consequential life cycle inventory analysis. Int. J. Life Cycle Assess. 2004, 9, 161–171. [Google Scholar] [CrossRef]
- Schmidt, H.; Thrane, D.R. Inventory of country specific electricity in LCA—China. Inventory report v2. Aalborg: 2.-0 LCA consultants. 2011. Available online: http://lca-net.com/files/IN_-_China_20110909.pdf (accessed on 20 October 2011).
- Mathiesen, B.V.; Münster, M.; Fruergaard, T. Uncertainties related to the identification of the marginal energy technology in consequential life cycle assessments. J. Clean. Prod. 2009, 17, 1331–1338. [Google Scholar] [CrossRef]
- Lund, H.; Mathiesen, B.V.; Christensen, P.; Schmidt, J.H. Energy system analysis of marginal electricity supply in consequential LCA. Int. J. Life Cycle Assess. 2010, 15, 260–271. [Google Scholar] [CrossRef]
- Qiang, G.; Yan, B. China’s hydropower resources and considerations for planning of major super hydropower stations. Northwest Hydropower 2008, 3, 4–8. [Google Scholar]
- Editorial Board of China Electric Power Yearbook. China Electric Power Yearbook 2002; China Electric Power Press: Beijing, China, 2002. [Google Scholar]
- The Energy Research Institute (ERI). China Wind Power Outlook 2030; The Energy Research Institute: Beijing, China, 2010. [Google Scholar]
- Zhou, X. Power System Development and Nationwide Grid Interconnection in China; Electric Power Research Institute: Palo Alto, CA, USA, 2002. [Google Scholar]
- Zhou, X.; Yi, J.; Song, R.; Yang, X.; Li, Y.; Tang, H. An overview of power transmission systems in China. Energy 2010, 35, 4302–4312. [Google Scholar] [CrossRef]
- Wu, Y. Unified Dispatch, Hierarchical Management. GUANG XI DIAN YE 2011, 137, 35–37. [Google Scholar]
- Xu, Z.; Xue, Y.; Wong, K.P. Recent advancements on smart grids in China. Electr. Power Compon. Syst. 2014, 42, 251–261. [Google Scholar] [CrossRef]
- China’s National Power Grid Plan for 2020 [Internet]. 2014. Available online: https://www.stratfor.com/image/chinas-national-power-grid-plan-2020 (accessed on 23 August 2015).
- Fan, X.; Wang, W.; Shi, R.; Li, F. Analysis and countermeasures of wind power curtailment in China. Renew. Sustain. Energy Rev. 2015, 52, 1429–1436. [Google Scholar] [CrossRef]
- Luo, G.; Li, Y.; Tang, W.; Wei, X. Wind curtailment of China’s wind power operation: Evolution, causes and solutions. Renew. Sustain. Energy Rev. 2016, 53, 1190–1201. [Google Scholar] [CrossRef]
- Sun, S.; Liu, F.; Xue, S.; Zeng, M.; Zeng, F. Review on wind power development in China: Current situation and improvement strategies to realize future development. Renew. Sustain. Energy Rev. 2015, 45, 589–599. [Google Scholar] [CrossRef]
© 2016 by the authors; licensee MDPI, Basel, Switzerland. This article is an open access article distributed under the terms and conditions of the Creative Commons Attribution (CC-BY) license (http://creativecommons.org/licenses/by/4.0/).