1. Introduction
Buildings are a strategic focus of European policies aiming to achieve a sustainable and competitive low-carbon economy by 2020. The European Commission encourages member states (MS) to decrease energy consumption in buildings and convert national building stocks from energy consumers to energy producers through retrofit measures and renewable energy sources (RES). EU Directives require that public authorities should adopt exemplary actions to achieve this target.
A key policy instrument towards this goal is the Energy Efficiency Directive (EED), which includes provisions to increase energy efficiency at the European level [
1]. In accordance with Article 24 (2) of the EED, MS are required from 2014, and then every three years, to submit National Energy Efficiency Action Plans (NEEAPs). NEEAPs shall cover energy efficiency improvement measures as well as expected and achieved energy savings, in view of attaining national targets referred to Article 3 (1).
Another central policy action is represented by the recast of the Energy Performance of Building Directive (EPBD) [
2], which establishes that all new buildings have to be nearly zero energy buildings (nZEBs) by 31 December 2020 (Article 9). An nZEB can be achieved by combining high efficient technologies with RES [
3].
Besides efforts to design new buildings having low energy demand and available RES [
4,
5,
6], it is essential to tackle the high energy consumption in existing buildings. The contribution of buildings to the total final energy consumption in the EU was 40% in 2012, making the building stock responsible for 38% of the EU’s total CO
2 emissions [
7]. Despite more stringent building codes and policies, which helped this value to decrease slightly in residential buildings since 2007, the final energy consumption in non-residential buildings remained quite stable in the last decade.
Improving and investing in energy renovation of the EU building stock is a key aspect not only for the derived savings and CO
2 emissions reduction, but also for the potential growth and employment that this sector can provide [
8]. According to the EPBD, MS have to consider cost-optimality to establish minimum energy performance requirements in buildings at the lowest costs. A methodology is provided by Delegated Regulation No. 244/2012 and its Guidelines to derive cost-effectiveness from a technical and economic perspective [
9,
10]. The methodology foresees a comparison in terms of costs [
11] and energy performance [
12] of construction alternatives to be taken into account both in new and existing buildings undergoing major or non-major renovation. The cost-optimal level is the solution that presents the lowest total costs and it can be located in the graph that reports global costs (€/m
2) and energy consumption (kWh/m
2y) (
Figure 1).
The cost-curve shape is influenced by different factors, such as building typology, variants, discount rate, energy price, and cost data. As a heterogeneous situation characterizes MS in relation to cost-optimal levels mainly depending on building types and climates [
13], there is the need to develop the methodology for different reference buildings, regulations and conditions. In particular, cost-optimal results depend on the selected reference buildings (size, shape, compactness, proportion of window area).
This paper illustrates the application of the cost-optimal methodology to identify long-term efficient solutions for the renovation of school buildings located in the Mediterranean area. The reference cases shown in this paper are existing buildings located in two towns in the province of Lecce: Sanarica e Squinzano (Puglia Region, Southern Italy). The two reference buildings are described in terms of physical characteristics, envelope and systems. Then, a set of several combinations of refurbishment measures are identified as possible variants for both reference buildings. Energy performance and global costs are evaluated for the obtained combinations. The cost-optimal solution is identified in both cases considering a financial and macroeconomic analysis. The initial and the selected configurations are compared to calculate the related energy and CO2 savings.
In conclusion, the main purpose of this paper is the identification of the strategies and optimal solutions for the renovation of existing buildings. The methodology presented helps the decisional and management process of the designers who want to guarantee comfort and cost-optimal solutions in school retrofitting, being a useful tool for municipalities at the same time. It shows how providing a reduction of energy consumption and greenhouse gas emission in a cost-effective way during building’s lifecycle. Furthermore, the article aims to compensate for the lack of studies applied to the Mediterranean climate on public buildings.
The project focuses on the development and application of a new strategy for conducting complete techno-economic studies for energy refurbishment policy plans of public buildings. This approach can be useful to address EU requirements and develop energy management plans for public buildings.
1.1. Cost-Optimal Studies Overview
The majority of papers related to cost-optimality in the literature are related to new buildings [
14]. In previous studies [
15,
16], the authors of this research investigate new mono and multi residential buildings as well as office buildings located in the Mediterranean climate [
17]. The research showed that cost-optimal solutions reduce primary energy consumption between 68% and 95% compared with the reference scenario. Obtaining nZEBs taking into account cost-optimality is still challenging and often limited to demonstration studies or pilot projects. However, the potential reduction of the environmental impact of new buildings is negligible compared to that of existing ones [
18,
19,
20,
21,
22]. The analysis of several energy renovation packages in a given building and the evaluation of the related costs in two different economic scenarios are useful to derive the optimal solution both in terms of energy performance and global costs [
23].
The design of a building energy retrofit is a challenging task that requires a holistic and integrated approach with the two main objectives of energy consumption minimization and economic benefits maximization [
24].
The increasing requirements of building quality improvement are the aim of many studies. New approaches are considered to quantify the added value created for the owners of the building by investment in renovation via energy-saving investments that produce positive externalities [
25].
Public buildings, such as offices and schools, are typically characterized by a higher lighting and electric demand, increased ventilation needs and heat gains due to occupants [
26]. As a consequence, heating, cooling, lighting and electric uses impact annual primary energy consumption, while in residential buildings space heating is usually the largest energy need. The challenge of designers implies major issues in retrofit project strategies, which has to take into account environmental, sociocultural and economic criteria at the same time.
A review of building energy retrofit is proposed by Ma et al. [
27]. The authors consider two buildings types that usually cover the majority of the stock of a country: residential and office buildings. They show the difference between the best energy retrofit packages in case of heterogeneous building types.
The Buildings Performance Institute Europe has published an overview on the implementation of the cost-optimal methodology in Austria, Germany and Poland [
28]. Multi-family and single-family buildings have been studied to demonstrate that energy performance requirements in buildings are ambitious but affordable. A study on cost-optimality in eight existing primary schools located in the Alps (Tyrol, Austria) was carried out in [
29]. The research demonstrates that building age and investment costs have an important impact on the results. In particular, the choice of the thermal insulation, thickness and conductivity, addresses the right selection of the thermal properties of windows, in order to reach a compromise between the performance and investment costs, which is still a debated issue at EU level.
In relation to public buildings and in particular schools, a study on energy consumption and potential savings has been carries out in Italy by National Energy Agency (ENEA) [
30]. This study has applied the cost-optimal methodology for retrofit interventions in virtual existing office and school buildings located in Rome (climatic zone D) and Milan (climatic zone E) [
31]. Results show that the heating demand is higher in Milan than in Rome so the cost saving is more effective in the first one, considering a 30-year calculation period.
1.2. Italian Policy Framework
Italy has implemented the EPBD and its recast at national level with Legislative Decree 192/05 and with the Decree Law 63/13, converted into law by Law 90/13. The Ministerial Decree of 26 June 2015 defines the methodologies for calculating energy performance and the minimum energy requirements in buildings [
32]. Furthermore, National Law 10/91 gives a comprehensive framework related to energy efficiency in buildings providing explicit regulations for a more efficient use of energy sources in all end-use sectors.
At national level, the measure of the energy performance of a building (Epi) indicates how much energy a building consumes during a year per square meter of treated floor area (TFA). The Epi of an existing building built before national Law 10/91 is generally between 200 and 300 kWh/m2y with fuel consumption between 10 and 30 L oil/m2y. The Epi of a building designed and built according to current legislation is between 15 and 130 kWh/m2y with fuel consumptions between 1.5 and 13 L oil/m2y.
At regional level, the Puglia Region promotes environmental sustainability and energy saving in urban renovation as well as in the construction of public and private buildings with the Legislative Decree No. 13 of 10 June 2008. This law defines the tools, techniques and construction methods both for new and existing buildings. The promotion of the requalification of existing buildings is the goal of the Regional Regulation No. 10 of 10 February 2010. It contains the methodology for calculating energy performance of buildings and energy certification. An energy performance certificate includes the reference performance of a building and other reference values. As regards climate, Italy is divided into six climatic zones (from A, having up to 600 degree days, to F, having more than 3001 degree days).
Italy submitted its report on cost-optimality, coordinated by the Ministry for the Economic Development, in August 2013 [
30]. The methodology has been applied to new and existing (from 1946 to 1976 and from 1977 to 1990) residential and non-residential buildings located in three cities of different climatic zones: Milan (climatic zone E), Rome (climatic zone D) and Palermo (climatic zone B). Moreover, the climatic zone C, where the buildings of this study are located, is not included in the previous study. This climate is characterized by a Mediterranean climate with non-extreme winters and high aridity in summer (Lecce has 1153 heating-degree-days).
1.3. School Buildings in Italy
1.3.1. The National School Stock
Non-residential buildings represent around 13% of the Italian building stock [
7]. In particular, there are around 51,000 buildings entirely or partly used as schools [
33]. With regard to their location, 30% of school buildings are concentrated in 10 provinces, such as Rome, Milan and Naples, and more than half (51%) are situated in 24 provinces. Furthermore, about 29% of schools are located in very small municipalities (up to 5000 inhabitants), and roughly the same percentage are in medium sized municipalities. The overall floor area of school buildings is 73.2 million m
2 and their total volume is around 256.4 million m
3. The largest share of school buildings (39%) has a floor area between 1000 and 3000 m
2, with an average area of 1819 m
2. In more detail, 43% of school buildings can be broken down by floor area as follows: 16% have a floor area between 751 and 1000 m
2 (average 899 m
2), 14% between 501 and 750 m
2 (average 631 m
2) and 13% between 351 and 500 m
2 (average 435 m
2).
The majority of existing school buildings present inefficient systems and technologies. They often use traditional heating systems, in particular radiators for heat distribution and gas/oil-fired boilers for generation [
34]. Space heating is still the main end-use with 43% of heating needs met using natural gas in 2012.
It is estimated that Italian public school students number about 7.5 million with 0.9 million teachers. Considering students, teachers and parents, more than a quarter of the Italian population attends a school building daily [
35].
Existing schools and the majority of refurbished schools are not provided with HVAC (Heating ventilation and air conditioning), leading to inadequate air change rates, representing a critical problem, because poor indoor air quality leads to loss attention and health within classrooms [
36,
37]. School holidays in Mediterranean countries are mainly in summer and this is why the majority of schools do not have a cooling system, presenting frequent comfort issues. Therefore, a key aspect in Southern European countries is maintaining proper air quality and comfort levels. The most commonly used technologies to reduce cooling energy demand in the Mediterranean area are: solar control features (e.g., mobile or fixed shading devices and structures, including verandas); night ventilation; ground-coupled heat exchanger for pre-cooling of ventilation air; ventilation systems with summer mode (bypass of heat exchanger). Reversible heat pumps are a common solution where mechanical cooling is needed. To reduce heating needs, buildings need to be insulated and heating systems replaced with efficient technologies, and RES encouraged if feasible.
Possible strategies to reduce energy consumption in public schools have also been investigated in [
38]. The environmental benefit achievable over 20 years through refurbishment actions on plants and envelopes have been estimated. The research also compares the costs of standard retrofit interventions to the benefits achievable in terms of energy and money saving through a payback time analysis that identifies priorities of intervention.
1.3.2. Potential Savings from School Buildings
Energy saving that can be derived from improvements to existing school buildings are potentially large because of their typical high energy consumption linked to inefficient systems and poor thermal insulation thickness. With the aim of improving energy efficiency in public buildings (e.g., offices, schools, health facilities, infrastructures), energy services companies (ESCOs) are being more common nationally.
A study has been carried out on the potential savings deriving from energy retrofit in schools in compliance with the EED [
39]. Potential savings refer to the saving achievable if, in the period 2014–2020, energy efficiency actions would be put into practice with a cost-optimal approach to achieve saving of 60% in the public sector and 40% in the private sector. To assess these potential savings, the Italian school building stock has been analyzed. The floor area of public and private schools that can be renovated each year has been estimated at 6 million m
2 (about 3800 buildings). This total includes about 1 million m
2 private schools and 5 million m
2 public schools (
Table 1).
For this stock, the study considers actions differentiated by climatic zone and applicability. Among them there are: thermal insulation of roof and heat-dispersing external walls, thermal insulation of stilt floors or floors/ceilings bordering on unheated spaces, replacement of existing windows with high-energy performance windows, upgrading heating/cooling control systems, replacement of heat generators, use of high-efficiency heat recovery systems, installation of automation systems or a building energy management system (BEMS), replacement of lighting and external solar screens.
Specifically, the total energy savings achievable from schools by 2020 are estimated as follows: 617 GWh/y for private schools (0.05 Mtoe/y) and 5821 GWh/y for public schools (0.5 Mtoe/y). The difference in energy saving percentages between public and private sectors stems from the fact that public buildings are mainly constructed prior to 1980 and their starting energy performance is poorer. The estimated investments for these retrofit projects amount to around 6.54 billion €/y, and should yield potential energy savings of 6.438 GWh/y, equivalent to 0.55 Mtoe/y, by 2020. At European level, the added value deriving from specialized construction activities that include renovation work and energy retrofits has been estimated as 283 billion € in 2011, 66% of this value is linked to the EU building sector. In particular, specialized construction activities supported 7.84 million jobs in the EU building sector, and 1.55 million in Italy. In more detail, activities linked to building envelope (e.g., roofing, walls and floor covering, glazing) have been quantified at 166 billion in the same year [
33].
1.3.3. Financial Instruments to Renovate School Buildings
Schools are among the most common spaces in which various users coexist. Therefore, schools have to ensure a suitable environment, also for health, comfort and productivity concerns.
In the last few years, relevant funding opportunities have been allocated for school buildings by the EU. Many projects have been funded, such as the EU FP7 projects School of the Future and the IEE ZEMedS [
40,
41].
In relation to financial instruments dedicated to schools in Italy, the Decree Law No. 104/2013 (
http://www.gazzettaufficiale.it/eli/id/2013/09/12/13G00147/sg) and the Economy and Finance Document (DEF) of 2014 have introduced some measures to enable Italian regions to establish loans with the European Investment Bank (EIB) and other banks [
42]. To encourage investments in school buildings, 40 million € per year are available from 2015. Moreover, the structural funds 2014–2020 also includes a budget for renovating and upgrading schools. The Ministry of Education, University and Research has allocated 38 million € for new schools and it will cover up to 25% of their construction costs. The same Ministry has assigned 150 million € for renovation and safety upgrading of schools. As at the end of March 2014, 462 projects had been funded. Projects focused on promoting energy efficiency in schools are increasing in Italy. The National Registry of School Buildings is collecting data and procedures while an observatory verifies the projects effectiveness and planning.
Among these projects, there are: “Energy saving starts at school” in the Piedmont Region, and “Learning about energy saving and the development of renewable sources—New ideas in the classroom”, involving 147 middle schools (children aged 11–13). This project included a survey to collect information on initiatives implemented in secondary schools for energy saving and RES. It also includes a competition of suggestions, such as “Tell me about your energy”. Sixteen hundred middle school children participated, submitting essays on this theme. Environmental sustainability awareness is also promoted in schools via the “Smart School” plan, which aims to engage the education system in the building of a “smart city”. Many other projects in schools related to the installation of photovoltaic plants, heat pumps and geothermal energy systems or the promotion of a more rational energy use.
Specific actions targeting schools are related to initiatives to increase energy-awareness in daily behaviors. These actions are aimed at strengthening communication on energy efficiency and the improvement of the user-friendliness and transparency of information as part of an integrated plan for the uptake of energy efficiency.
2. Methodology
The study presented in this paper has been carried out in accordance with the EPBD recast [
2] the Delegated Regulation [
9] and its Guidelines [
10]. The methodology is based on a comparative framework that comprises existing buildings undergoing major and non-major renovation of structural and technical components. In particular, the methodology consists of several steps that include:
Definition of reference buildings;
Establishment of energy efficiency measures (measures based on energy from RES and/or packages and variants of such measures for each reference building);
Calculation of primary energy demand resulting from the application of the previously selected measures and/or packages of measures;
Calculation of global costs in terms of net present value for each reference building;
Sensitivity analysis related to cost data;
Identification of cost-optimal levels in each reference building.
2.1. The Reference Buildings
In relation to reference buildings, MS can select different types of non-residential buildings as listed in Annex I (paragraph 5) of the EPBD recast [
2]. For each category, at least one reference building has to be defined for new buildings and two for existing buildings undergoing complete renovation. The latter ones can be selected on the basis of subcategories (e.g., size, age, costs, construction materials, use or climatic zone) taking into account national building stock characteristics.
The reference scenario is a reference building with the boundary conditions that characterize the object of the study. In particular, it represents a typical and average building stock in a given Member State, because it is impossible to calculate the optimal situation under the cost profile for each individual building. For this reason, the reference buildings will define as closely as possible the actual national building stock, so that the calculation methodology provides representative results. Reference buildings have to respect existing or planned energy performance requirements.
In this paper, two existing school buildings have been investigated. As previously stated, the Mediterranean area to which they belong is characterized by mild winters and hot dry summers [
42,
43]. This climate is common in Southern Italy (e.g., Puglia, Sicily, and Calabria regions) and Southern Europe (e.g., Cyprus, Greece, Spain, and Portugal). At national level, the area falls within the climatic zone C that has not yet been addressed in [
30]. In this area, the indoor design temperature of a building is 20 °C during the heating period, running from 15 November to 31 March, and 26 °C during the cooling period [
44]. The structures of the case studies are different depending on period of construction, size and final users (
Table 2).
The first reference building, REF1, is a nursery school located in Sanarica (province of Lecce). Its main facade is oriented towards the Northeast. The gross heated volume is equal to 1728.07 m3 and the dissipating area is 1066.56 m2, with a shape factor of 0.62. The envelope of the building has the typical features of the period in which it was built (presumably between 1950 and 1960). In particular, the masonry consists of tuff blocks (and/or limestone) with an average thickness of 60 cm. The roof is characterized by typical star and barrel vaults. The window frames (including doors) are in aluminum with single glazing without shutters. Heating is provided by two natural gas boilers with a power of 36 kW (each) with fancoils. Hot water is produced exclusively by three electric boilers placed in bathrooms and utility rooms. There are cooling and ventilation systems. The building can accommodate 125 users, considering nine months (from September to May) of activity. Internal heat gains, sensible and latent heat emitted within an internal space by occupants, are estimated to 4 W/m2.
The second reference building, REF2, is a kindergarten school located in Squinzano (province of Lecce). It is oriented in a northeasterly direction and it was built around 1977 (
Table 3).
The bearing structure of the building consists of pillars and beams in reinforced concrete. The external walls have perforated bricks in cement and expanded clay with a thickness of about 27 cm while internal walls are about 10 cm thick. The cover consists of reinforced concrete slabs having a thickness of about 25 cm, supplied with a waterproof bituminous sheath. The external and internal window frames are made of a special colored steel of double glazing in the external part and single glazing in the internal. The heating system consists of a black steel piping, radiators are cast iron and the natural gas generator has an output power of 127 kW. For all areas, the air and light supply is directed and cover at least 1/8 of the floor area. Generally, the nursery opening hours range from 6 to 8 h per day, so air conditioning systems have a working period of about 1500 h per year. There is no mechanical ventilation system, therefore the air change is exclusively natural and manual. The building can accommodate 367 users with internal heat gains of 4 W/m2 per person.
2.2. Retrofit Variants and Combinations
Different types of energy efficiency measures (EEMs) have been selected both for the envelope and technical systems; the combination of EEMs, derived from a matrix calculation, has defined several solutions for each reference building.
The first analysis has been carried out for the reference building located in Sanarica (REF1) with 288 combinations. Then 96 combinations have been analyzed for the reference building located in Squinzano (REF2). The solutions have been obtained combining the considered variants for each building. In particular, the analysis has been made taking into account the substitution of the old windows, metal frames without thermal breaks and single glazing, and the application of an insulation and a thermal plaster for the external walls. The efficiency of the envelope has been included in the cover slab and the floor. In
Table 4 the variants for the envelope of both buildings are reported.
Twelve types of insulation for external walls have been considered for REF1 and two types for REF2. The insulation has been distinguished by material types and thickness.
For both reference buildings, two windows variant types have been included in the analysis. These consist of a metal frame with thermal break and wood, having a double glazing with shutters. As regards technical systems, the analysis includes the substitution of the old generation and emission systems, considering different variants of heat pumps and other emission systems (
Table 5).
For REF1, the largest number of variants relates to the envelope, in particular for insulation. This approach was adopted in order to investigate the effect of different materials and thickness of the insulation as well as the effect of different efficiencies of the generation system. For REF2, eight generation systems have been considered to identify the best configuration taking into account the performance variability of the thermal energy production.
A controlled mechanical ventilation has been considered in the analysis to guarantee proper indoor air quality and comfort, a fundamental aspect for school buildings. In particular, the ventilation variants include for each reference building: CMV with static heat recovery combined with fancoils and/or radiant panels with fancoils for dehumidification, and a static heat recovery in the air handle unit to control the indoor conditioned air. RES systems have been included in order to reduce energy consumption and CO2 emissions. In particular, for both buildings, solar collector panels and photovoltaic systems have been included in order to ensure 35% coverage of the total energy demand.
2.3. Energy Performance and Global Costs Assessment
After the definition of the reference buildings and the selection of energy efficiency retrofit measures, primary energy demand and global costs have been derived for all variants using the software ProCasaClima2015 v.2.0 (KlimaHaus, Agentur für Energie Südtirol, Bozen, Italy), based on an Excel workbook. It is useful to calculate the building performance from an energetic, environmental and economic point of view, showing a clear sensitivity of the climate data compared to the most popular dynamic software [
44]. Heating, cooling, ventilation, domestic hot water, lighting and auxiliary demands have been estimated in accordance with the Standard UNI TS 11300 (part 1 and 2) [
12]. The characteristics of energy production, distribution, emission and control, as well as the energy carrier, have been inserted to derive final uses energy consumption. UNI EN ISO 13370 [
45] is incorporated in the software to calculate the heat exchange with the ground, as well as the global efficiency of building plants and CO
2 emissions. Furthermore, it is possible to evaluate global costs in compliance with UNI EN 15459 [
11]. The calculation of the net energy requirements in terms of primary energy consumption is divided into the following phases:
- (1)
Calculation of the net thermal energy needs to meet the users’ requirements: in winter the energy demand is calculated as the energy loss through the envelope and ventilation minus the internal gains and natural energy earnings (passive solar heating, passive cooling, natural ventilation, etc.);
- (2)
Subtraction from the first point of the thermal energy obtained from renewable sources and used in situ (for example the energy obtained from solar collectors);
- (3)
Calculation of energy consumption, in terms of energy carriers (electricity, fuel) for each use (heating and cooling of environments, hot water, lighting, ventilation), taking into account the characteristics (seasonal efficiency) of production, distribution, emission and control systems;
- (4)
Subtraction of energy produced from renewable sources and used in situ from electricity consumption (for example the energy produced by photovoltaic panels);
- (5)
Calculation of energy supplied for each energy carrier as sum of energy consumption (not covered by the energy from renewable sources);
- (6)
Calculation of primary energy associated with supplied energy, using national conversion factors;
- (7)
Calculation of primary energy associated with energy exported to the market (for example the energy generated from renewable sources or co-generators in situ);
- (8)
Calculation of primary energy as the difference between the two previous amounts (6) and (7).
For the calculation of energy consumption for heating, cooling environments, and the production of hot water it is necessary to consider the seasonal efficiency of the systems and perform a dynamic simulation accordingly.
The global cost has been estimated in terms of net present value for each combination. The regulation suggests to carry out both a macroeconomic and a financial calculation. In the second case, taxes, VAT, charges and subsidies are included.
The global cost calculation also considers initial investment cost CI, an annual cost for each component or system, and a final value derived by a linear depreciation of the initial investment until the end of the calculation period, τ.
The final replacement cost (that includes the price for products,
RP), the discount rate at the end of the calculation period (
Rd), and the real interest rate (
RR, that depends on the market interest rate R and on the inflation rate
RI) have been included in the evaluation of global costs with calculation a period of 20 years. The following formula is used for the global costs calculation:
where:
τ is the calculation period;
is the global cost (referred to starting year ) in the calculation period τ;
is the initial cost of the measure or set of measures j;
represents the annual cost, during year i, for measure or set of measures;
represents the residual value of measure or set of measures j at the end of the calculation period;
is the discount factor for year i.
The assessment is dynamic, and takes into account the annual changes in the discount rate and annual variations in the growth rate of prices for any one of the annual costs considered (energy, operating, periodic, replacement, maintenance and additional costs). The final value of a component (
) is determined by straight-line depreciation of the initial investment until the end of the calculation period and referred to the beginning of the calculation period. If the calculation period τ exceeds the lifespan of a component
j(
), it is considered the last replacement cost in the linear depreciation. The residual value (
) is assessed using the following formula:
where:
is the last replacement cost taking into account the growth rate of the product price ;
represents the total number of element j replacement at the end of the period of calculation;
represents the linear depreciation of the last replacement cost (calculated as the remaining lifetime of the component j last replacement at the end of the calculation period, divided by the lifespan of component j);
represents the discount rate at the end of the calculation period:
represents the real interest rate and it depends on the market rate of interest
R and the annual inflation rate (
) as shown in the following formula:
A sensitivity analysis has been also carried out. This is an ex ante evaluation of the results that depends upon key parameters whose future trends can affect final results.
A sensitivity analysis is suggested in relation to different national energy prices both for the financial and for the microeconomic analysis. The discount rate has to be included in the calculation of cost-optimal levels.
Although the future trend of technology prices has no impact on the initial investment costs, evaluated at the beginning of the calculation period and referring to the prices drafted by the Puglia Region and a market survey, it represents a fundamental factor for the review of the calculations of cost optimal levels.
3. Results and Discussion
The first reference building (REF1, the kindergarten school in Sanarica) presents 288 combinations that show a huge variation of primary energy demand compared to the reference scenario. This has a primary energy consumption of 613 kWh/m
2y and179 kgCO
2/m
2y greenhouse gas emissions, falling within national energy class F.
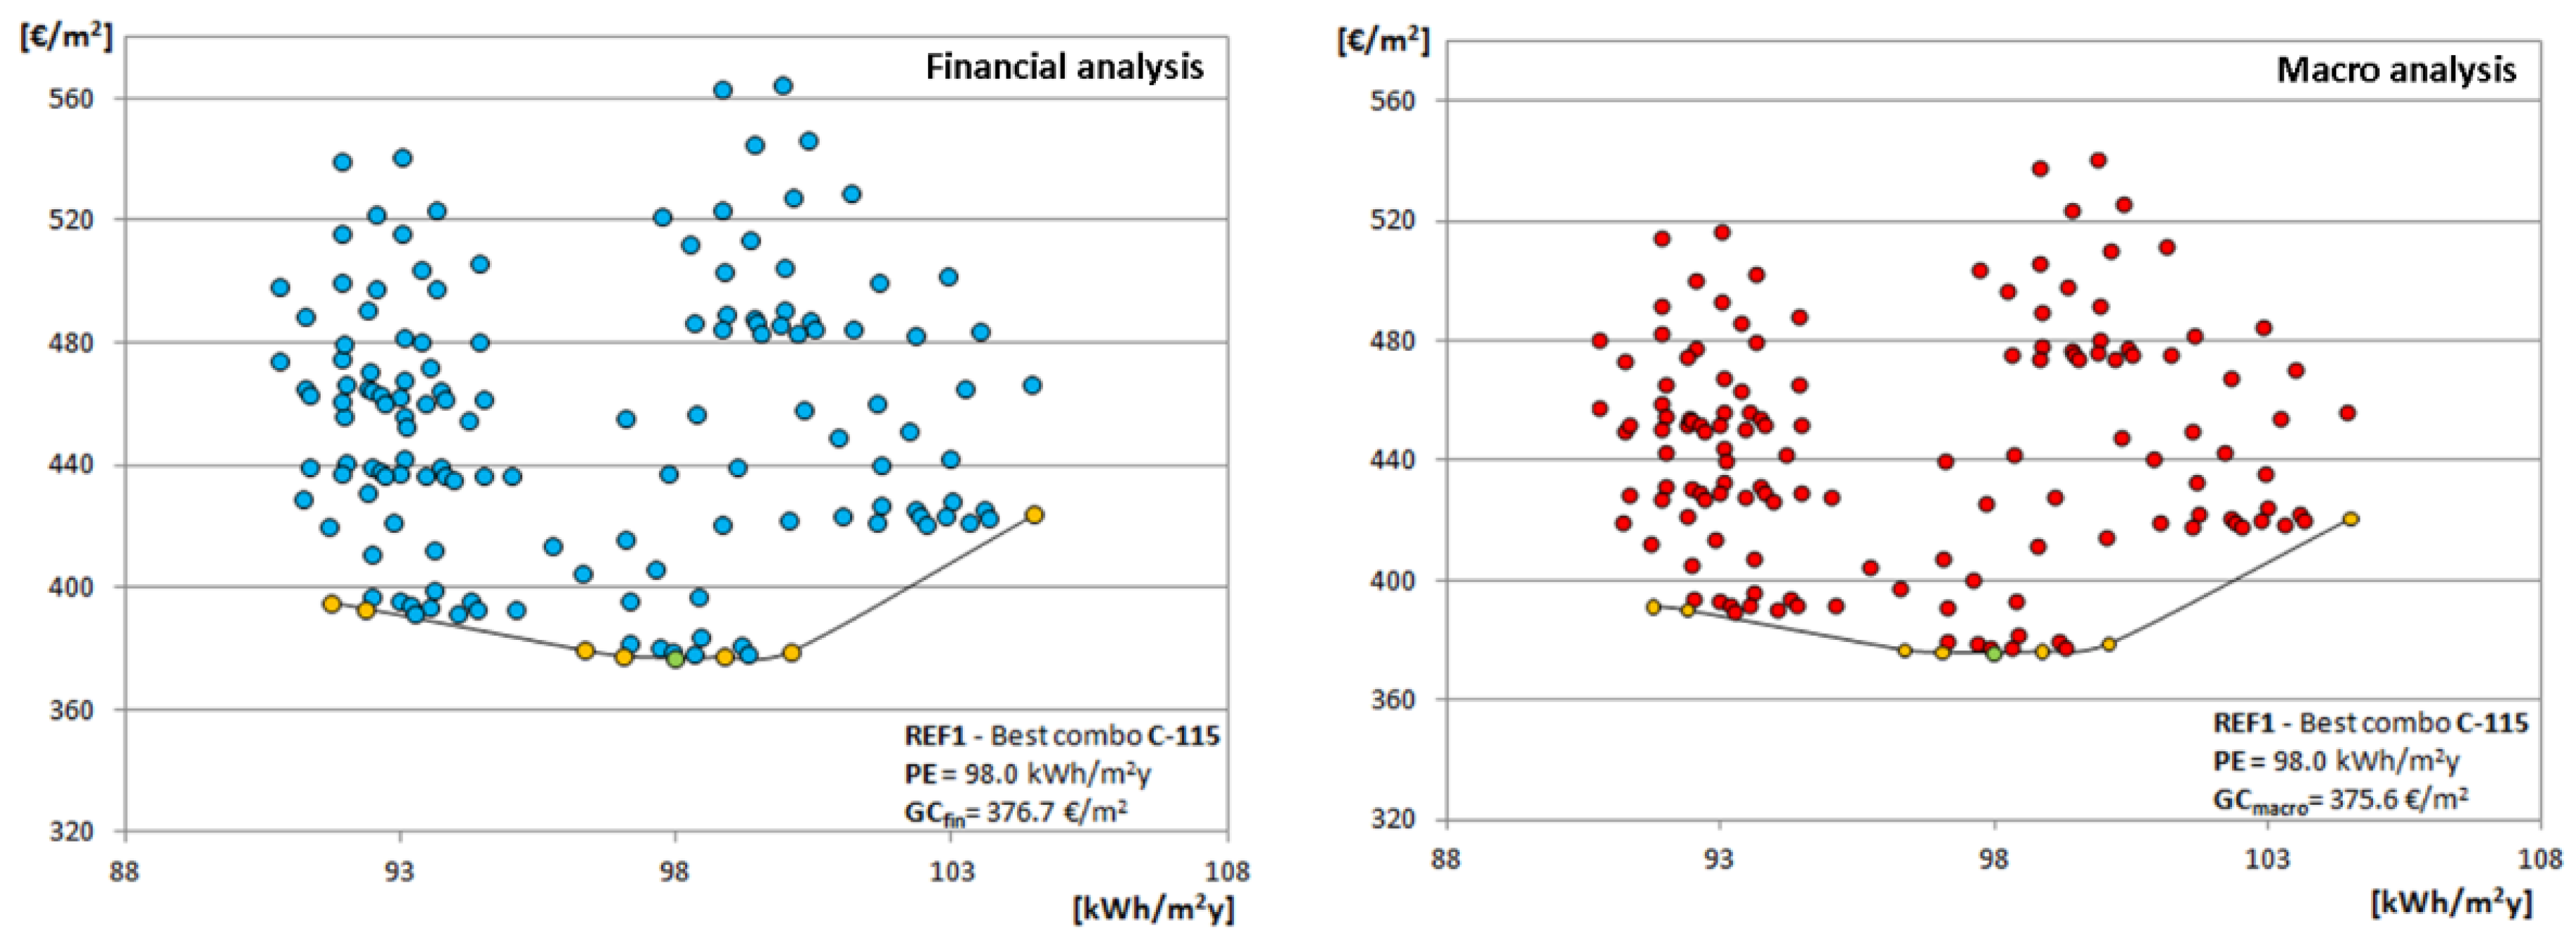
Figure 2 shows the cost-optimal level, both for the financial and the macroeconomic analysis, of the most performing group of combinations which have PV02 as photovoltaic system variant.
The best combination falls within energy class B with a primary energy consumption of 98.0 kWh/m2y and 32 kgCO2/m2y greenhouse gas emission, having a financial and macroeconomic global cost of 376.7 €/m2 and 375.6 €/m2, respectively. This solution has been obtained through the combination of the following measures: hemp fibers panels with 6 cm thickness (REF1_INS07, average transmittance value of external walls: 0.33 W/m2K), wood frame for windows (REF1_WI02, Uframe = 1.3 W/m2K), centralized heat pump with air heat source (REF1_GEN01), fancoils for emission (REF1_EM01) with controlled mechanical ventilation (REF1_VENT01), and photovoltaic system (REF1_PV02) consisting of 18 panels with 4.5 kW peak power and 17% efficiency. The best performing solution shows 84% reduction of primary energy consumption and 82% reduction of CO2 emissions compared to the reference building.
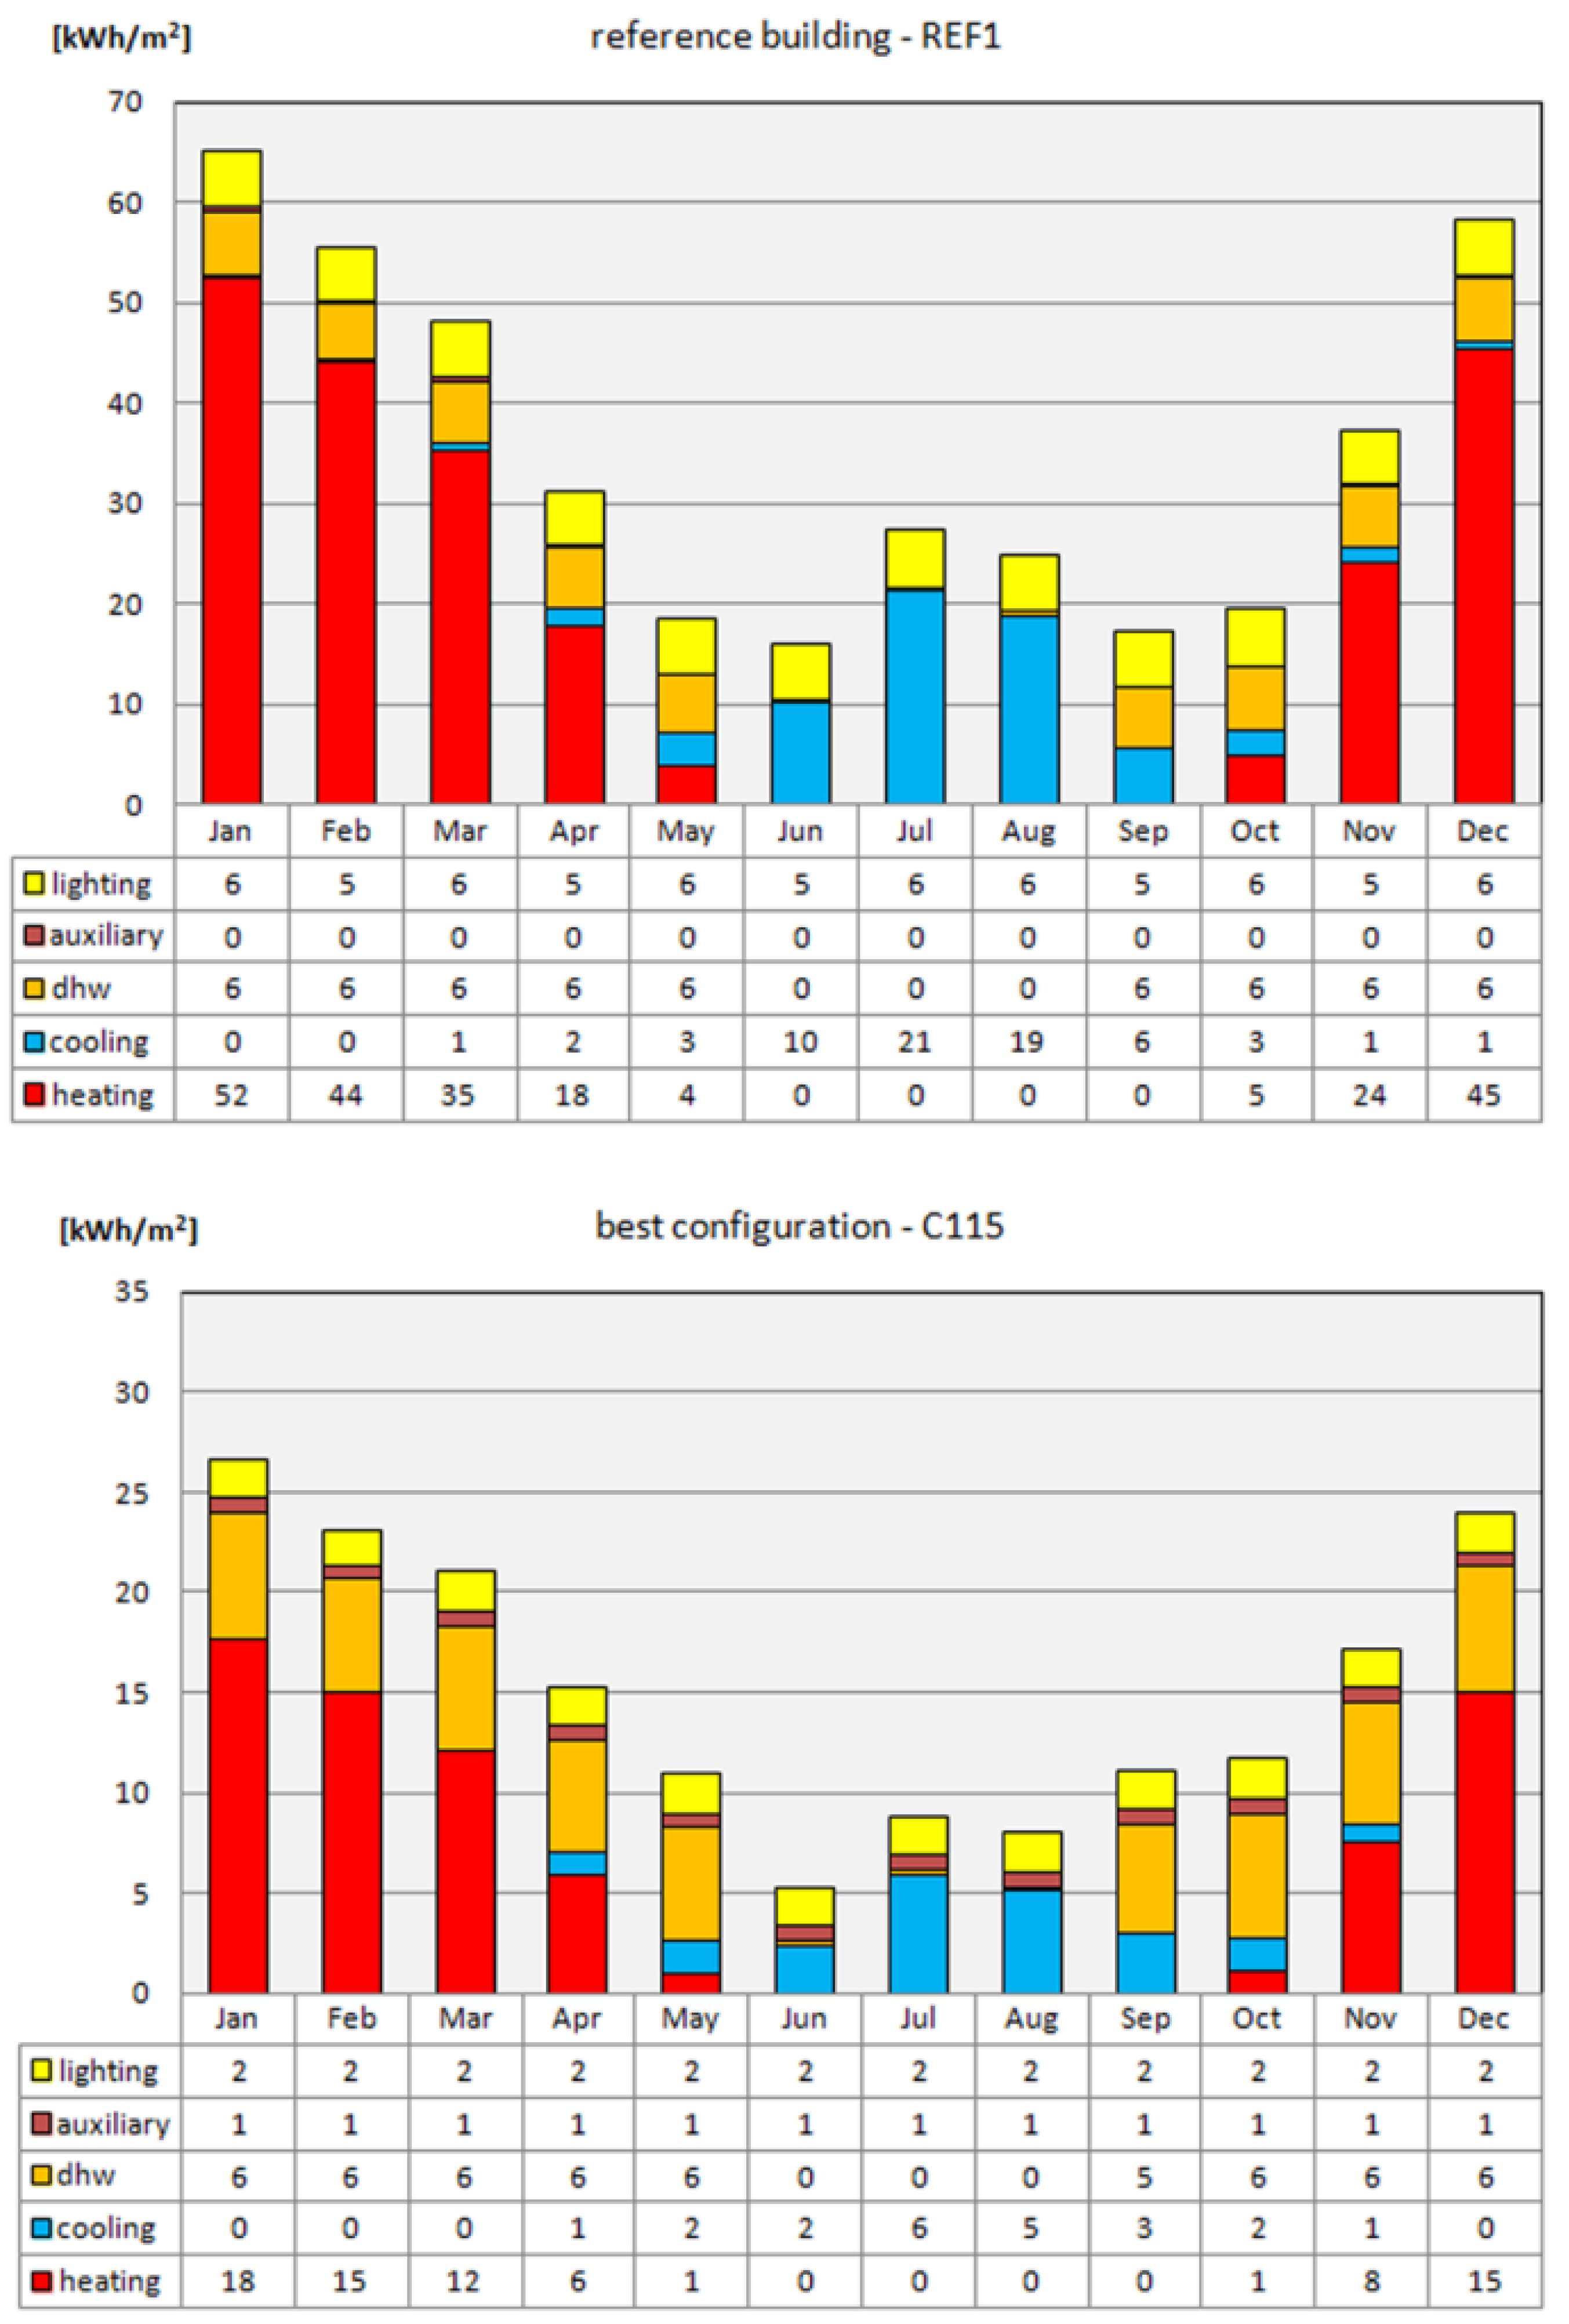
Figure 3 shows the comparison between the output values of monthly energy demand for heating, cooling, domestic hot water, lighting and auxiliary energy of the reference building (REF1) and the best combination (C-115).
It is possible to note that the variants included in this combination reduce the heating demand from the highest value of 52 to 18 kWh/m2 with a reduction of about 65% compared to the reference case. In the hottest month, the cooling energy demand is not as high as the heating energy demand in the coldest month. However, it decreases significantly, passing from 21 to 6 kWh/m2, providing a reduction of about 71%. Although both energy demands are reduced, auxiliary energy demand increases by about 10%. Furthermore, the lamps selected for lighting give a lower consumption compared to the reference building. In particular, this energy demand passes from 6 to 2 kWh/m2.
Ninety-six combinations have been performed in the analysis for REF 2 (in Squinzano), pointing out the variation of primary energy consumption in comparison with the reference scenario.
In accordance with the national energy performance classification, the nursery belongs to class G, with a consumption of primary energy of 418 kWh/m
2y and 113 CO
2/m
2y.
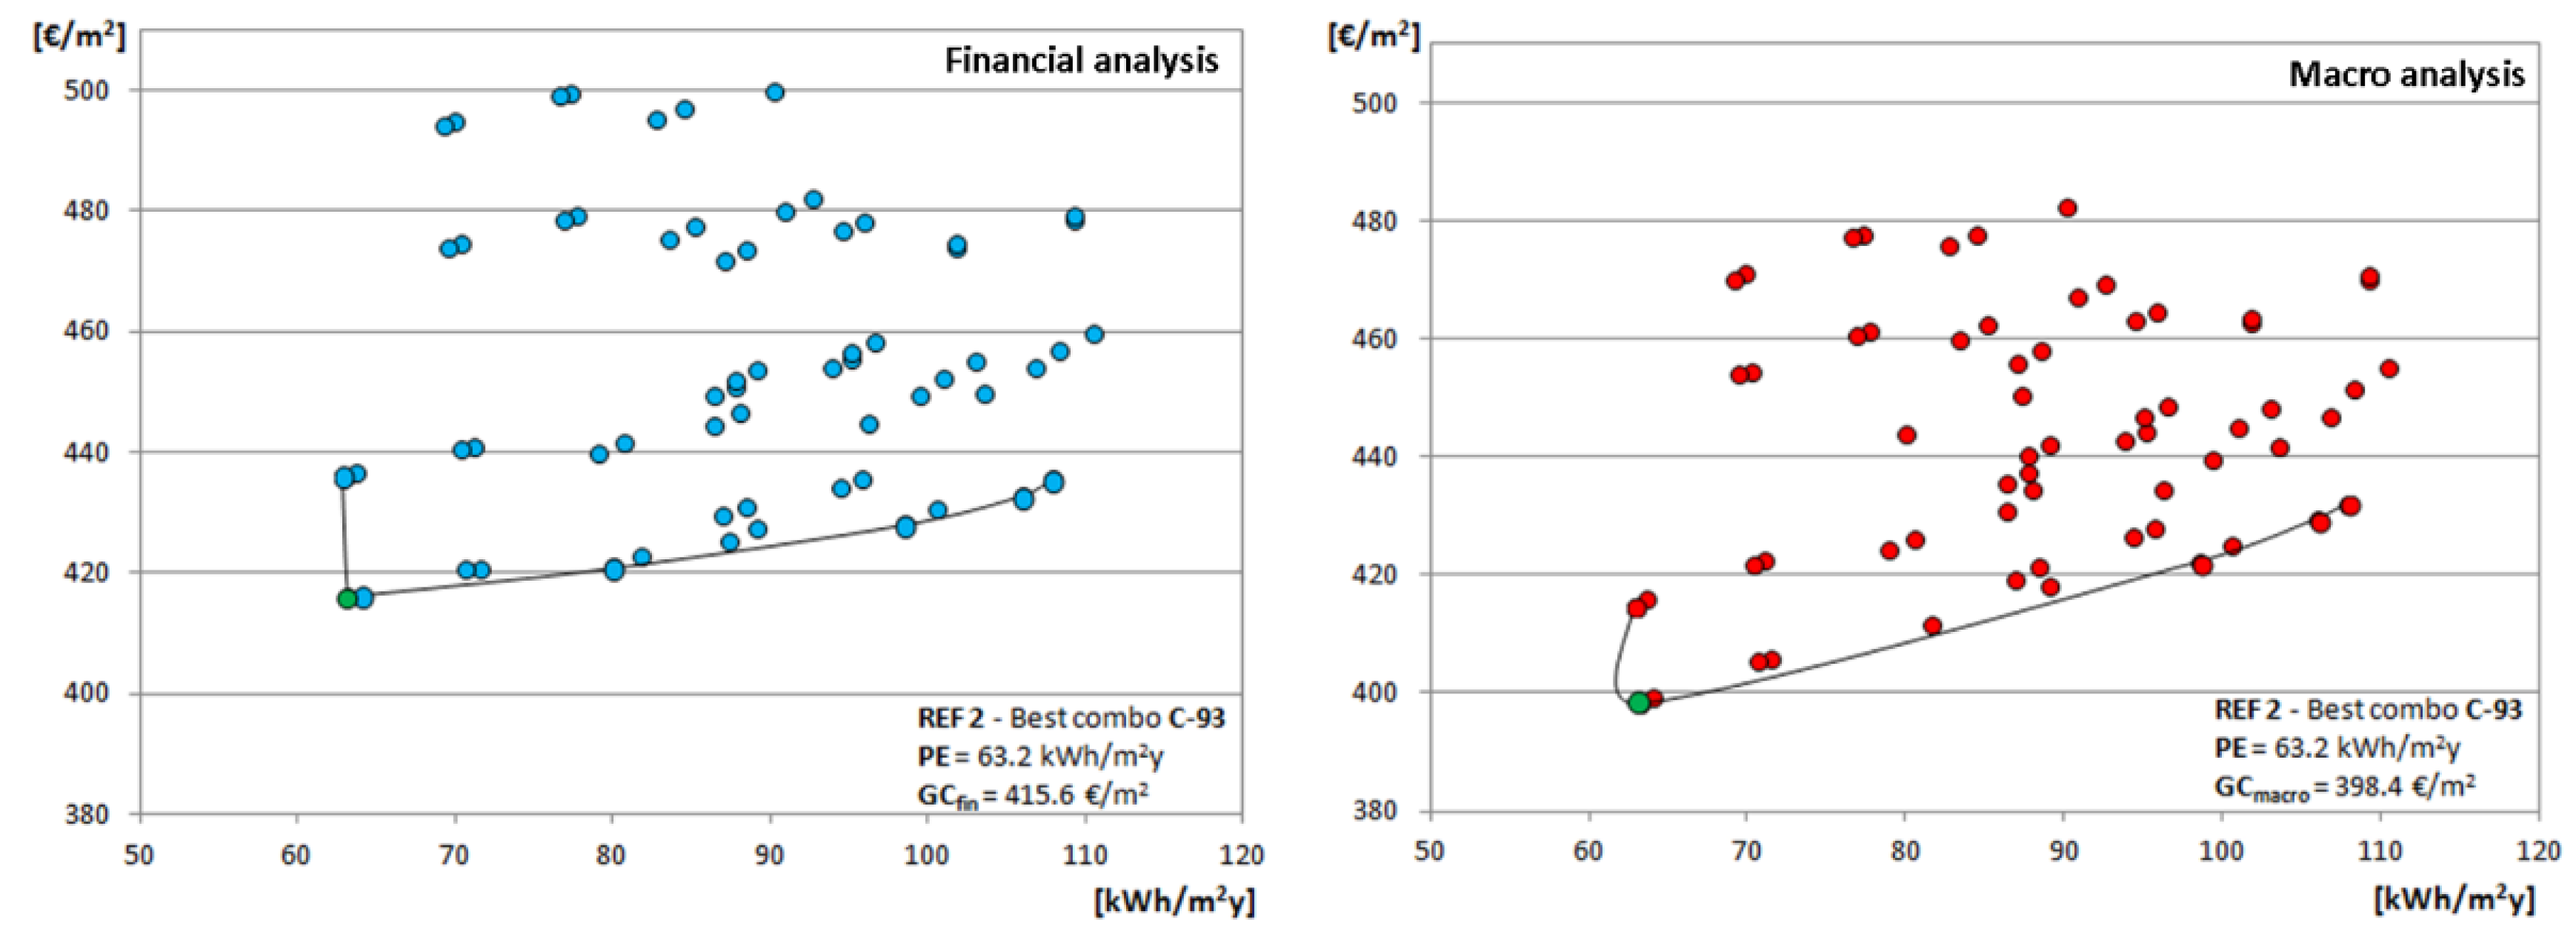
Figure 4 shows the global costs and the primary energy consumption for the financial and microeconomic analyses of all combinations.
The best performing solution, found at the minimum point of the cost optimal curve in both analyses is the combination C93 (PE = 63.2 kWh/m2y, GCfin = 416.6 €/m2, GCmacro = 398.4 €/m2). This combination has an external envelope of hemp fiber panels (REF2_INS02, average transmittance value of external walls equal to 0.33 W/m2K), windows with stratified double insulated glazing, solar coating and wood frame (REF2_WI02, Uframe =1.3 W/m2K), geothermal heat pump (REF2_GEN03), emission system with fancoils and radiant panels (REF2_EM03), controlled mechanical ventilation (REF2_VENT02) and 68 photovoltaic modules (REF2_PV02). The lowest point of the curve gives savings of primary energy consumption and CO2 emissions equal to 85% and 82%, respectively.
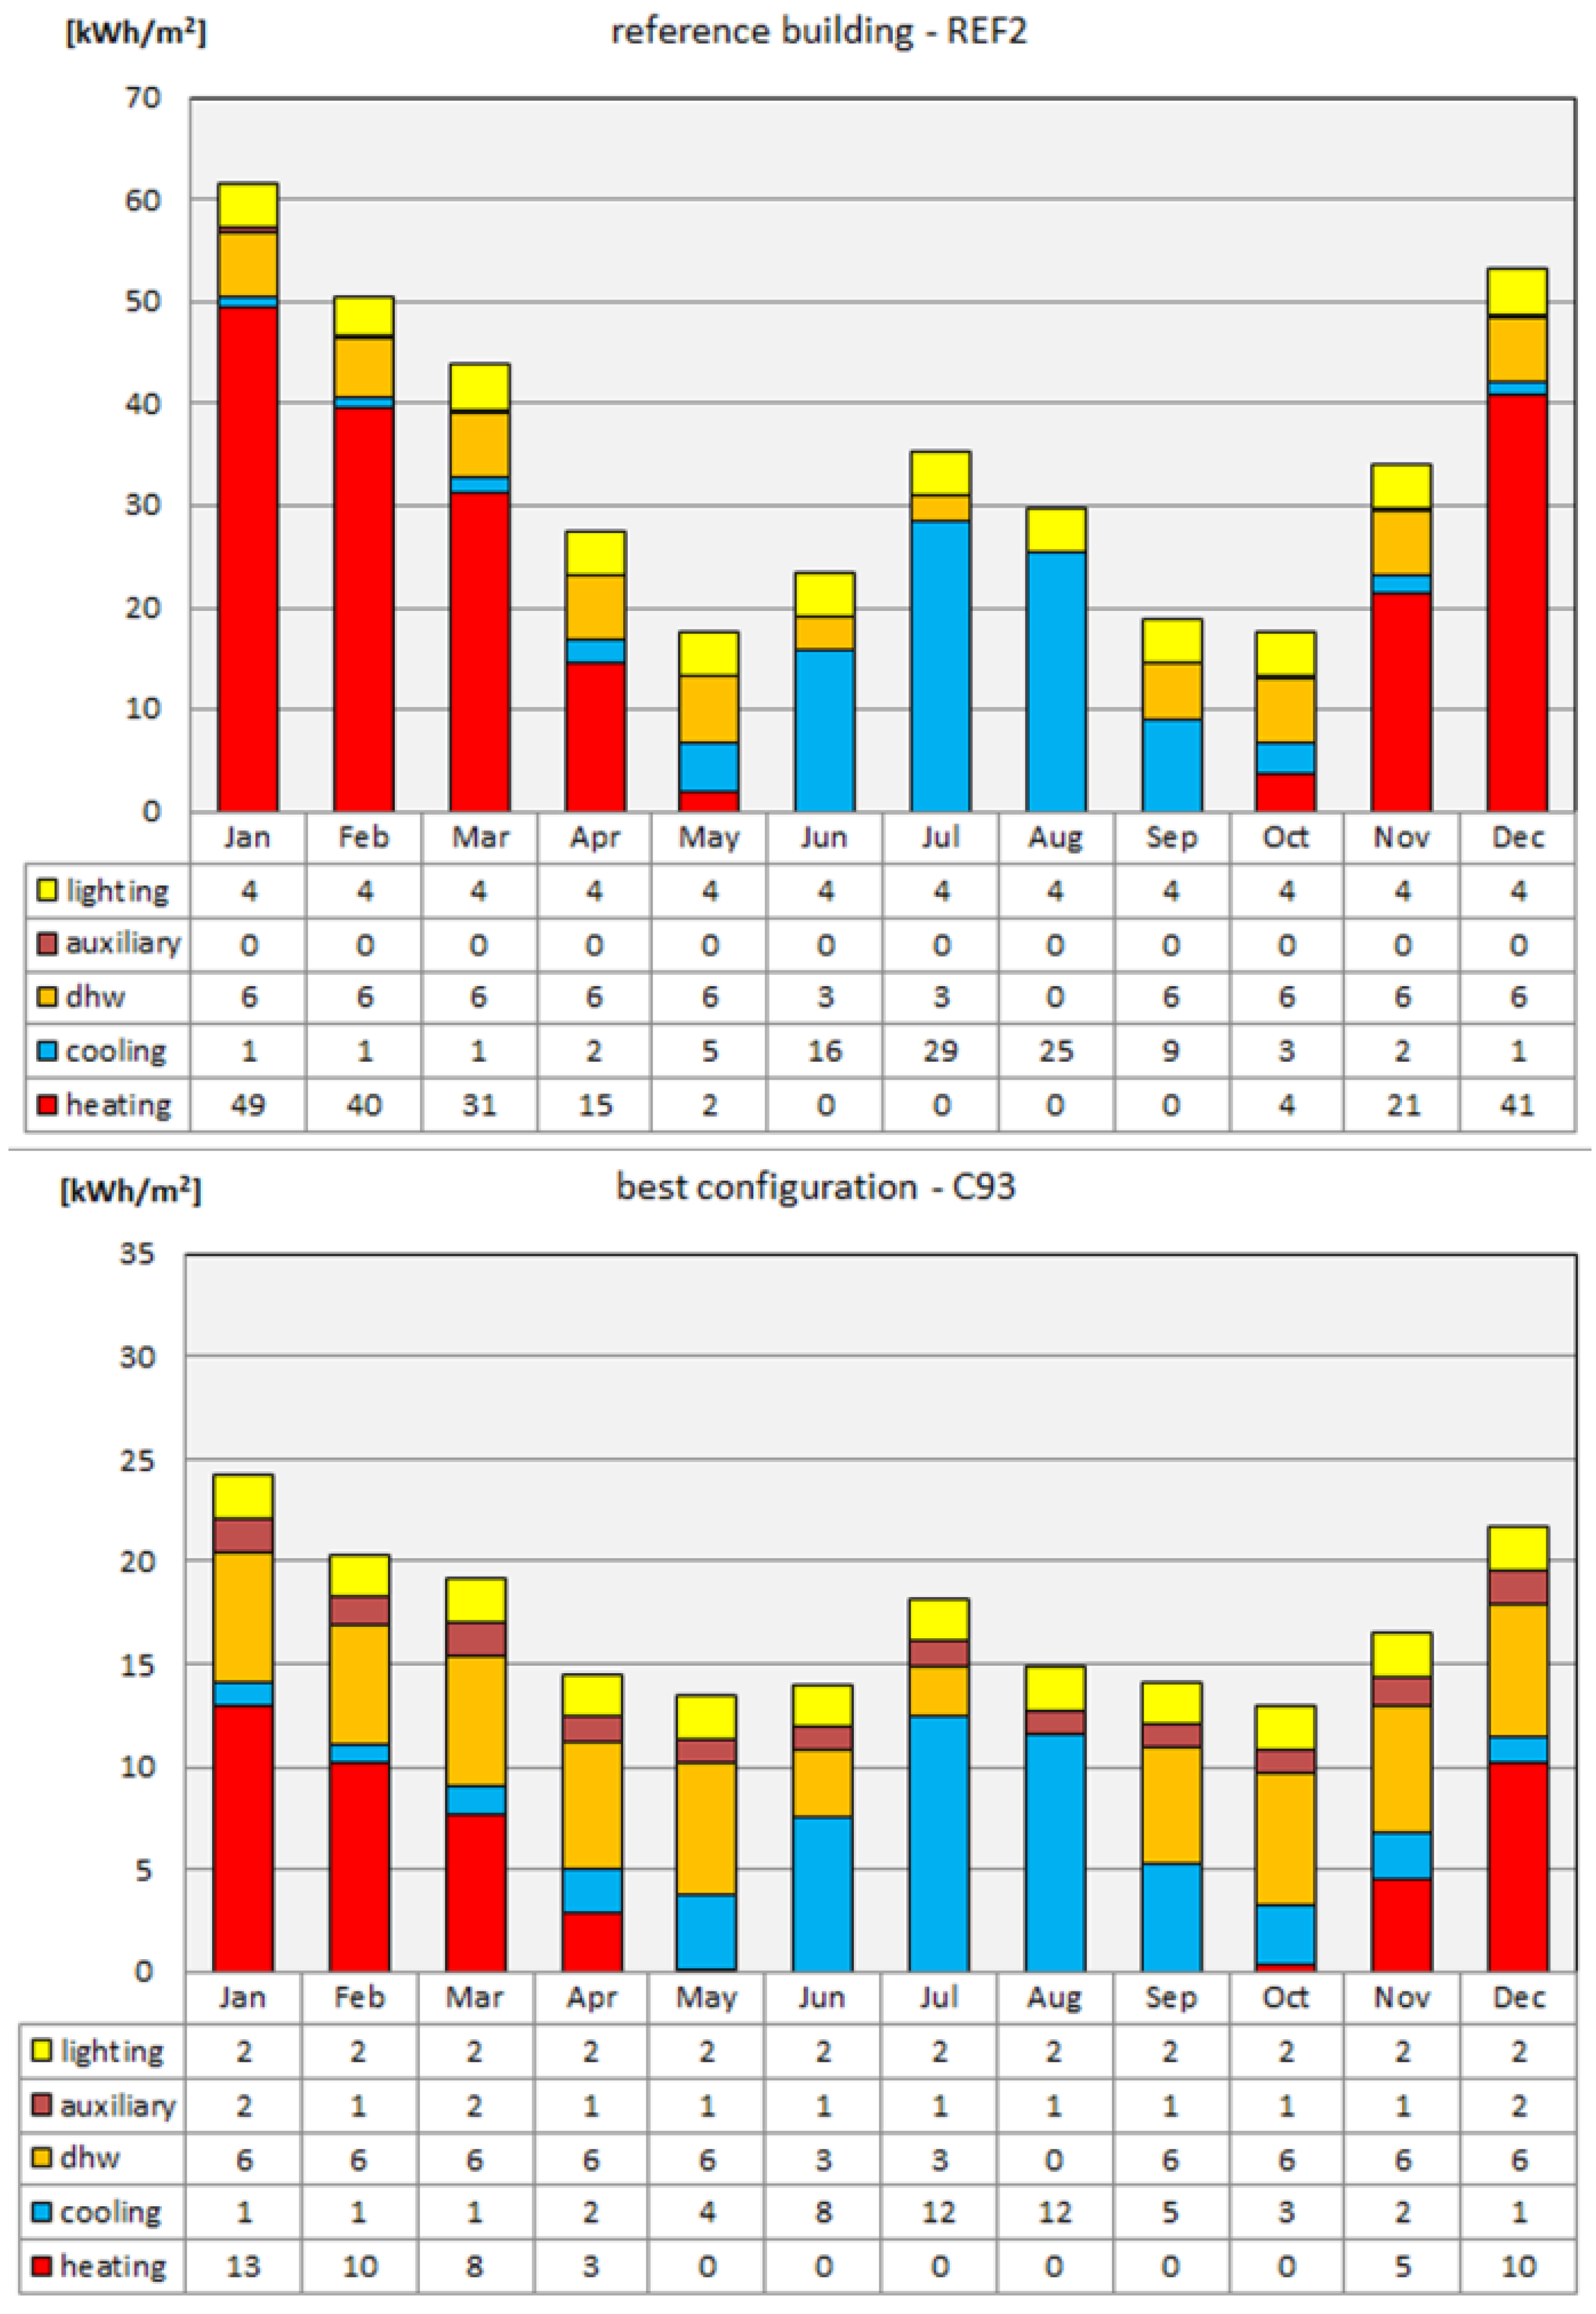
Figure 5 shows the comparison between the values of monthly energy demand for heating, cooling domestic hot water, lighting and auxiliary energy, of the reference building and the best performing solution (C93).
In the coldest month (January), heating demand decreases from 49 to 13 kWh/m
2, with a reduction of 73% compared to the reference building. In the hottest month (July) the cooling demand decreases from 29 to 12 kWh/m
2, showing a 58% reduction from the reference scenario. The monthly lighting demand increases by 50% compared to base case, as well as the auxiliary demand that increases to 2 kWh/m
2 in the coldest months (December and January) and to 1 kWh/m
2 in the remaining months.
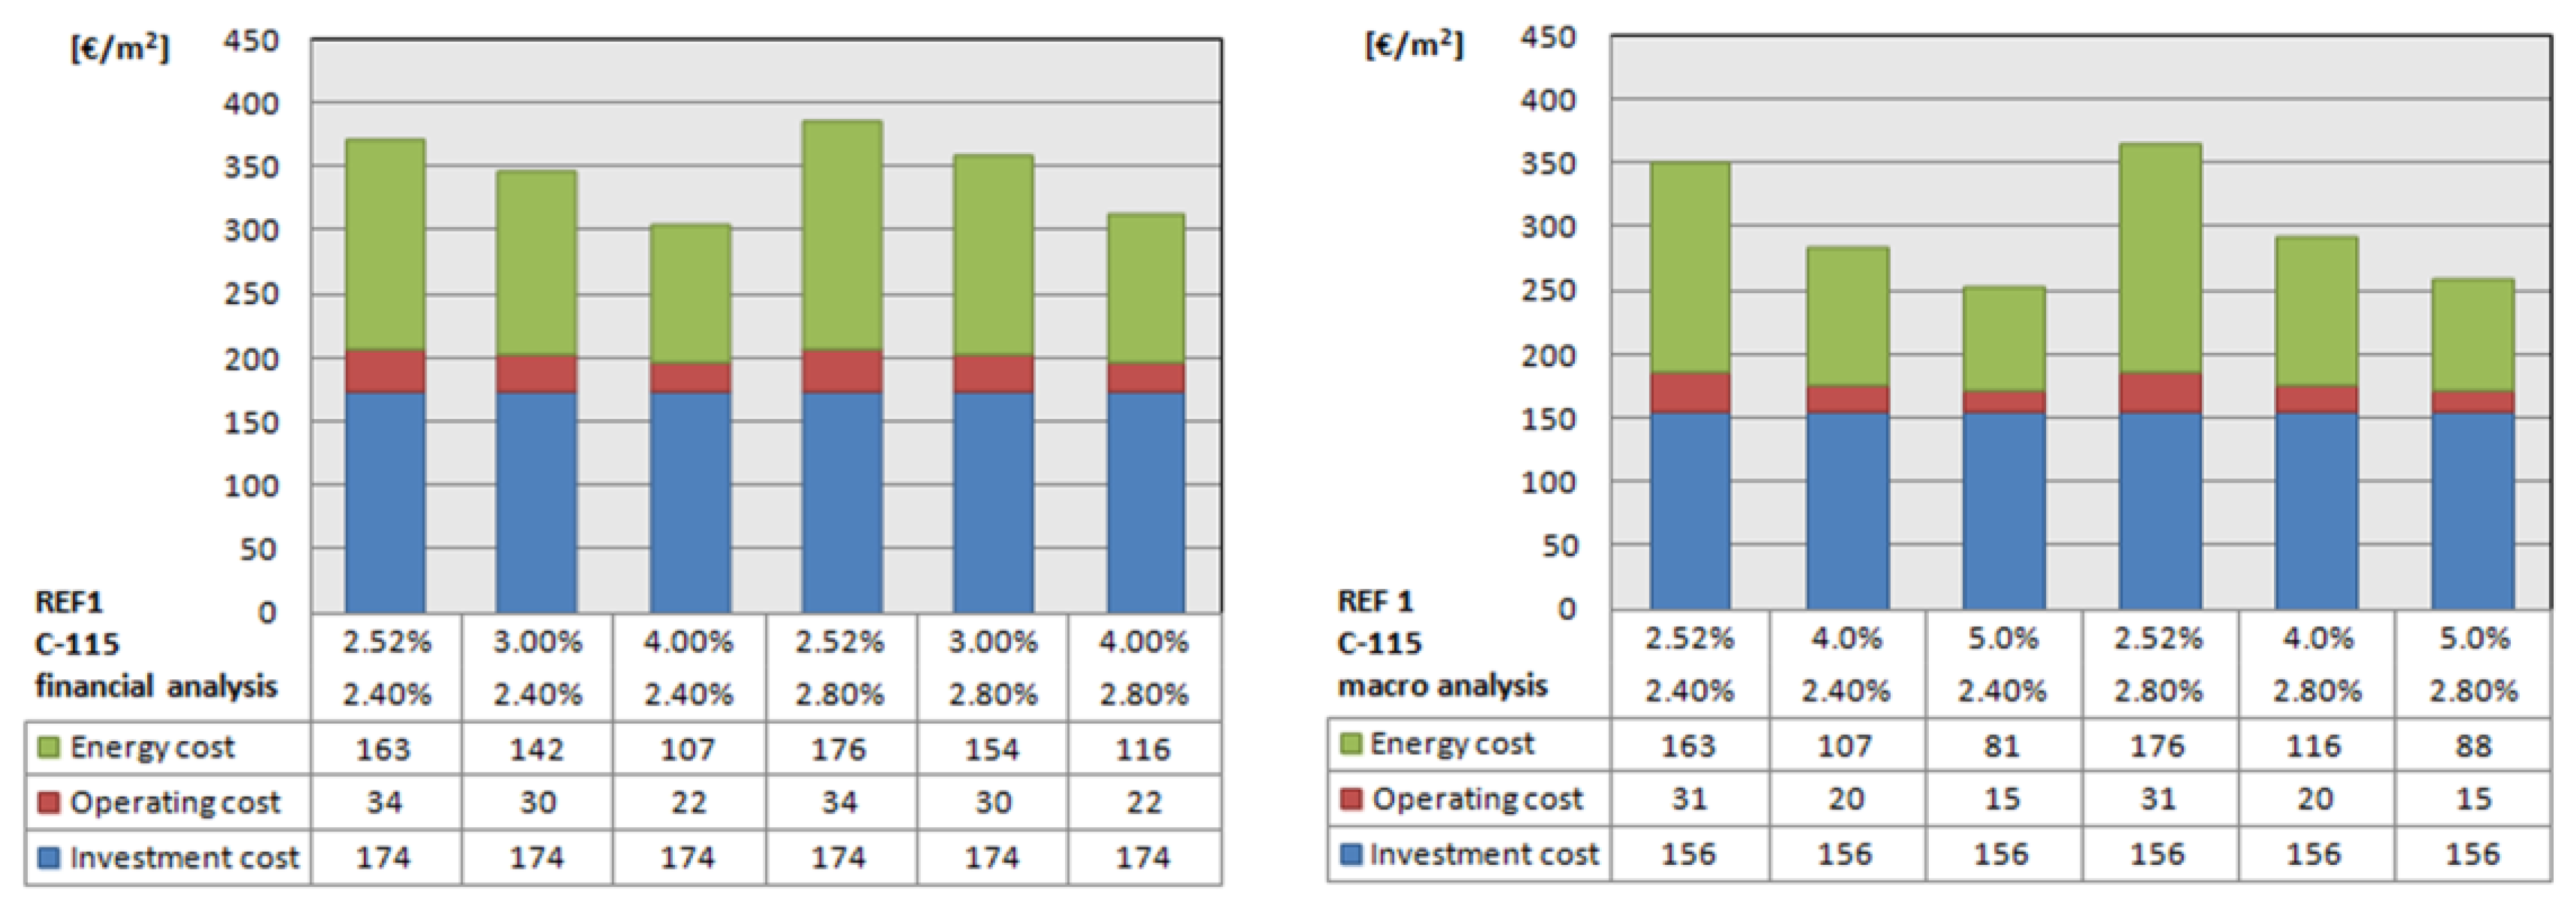
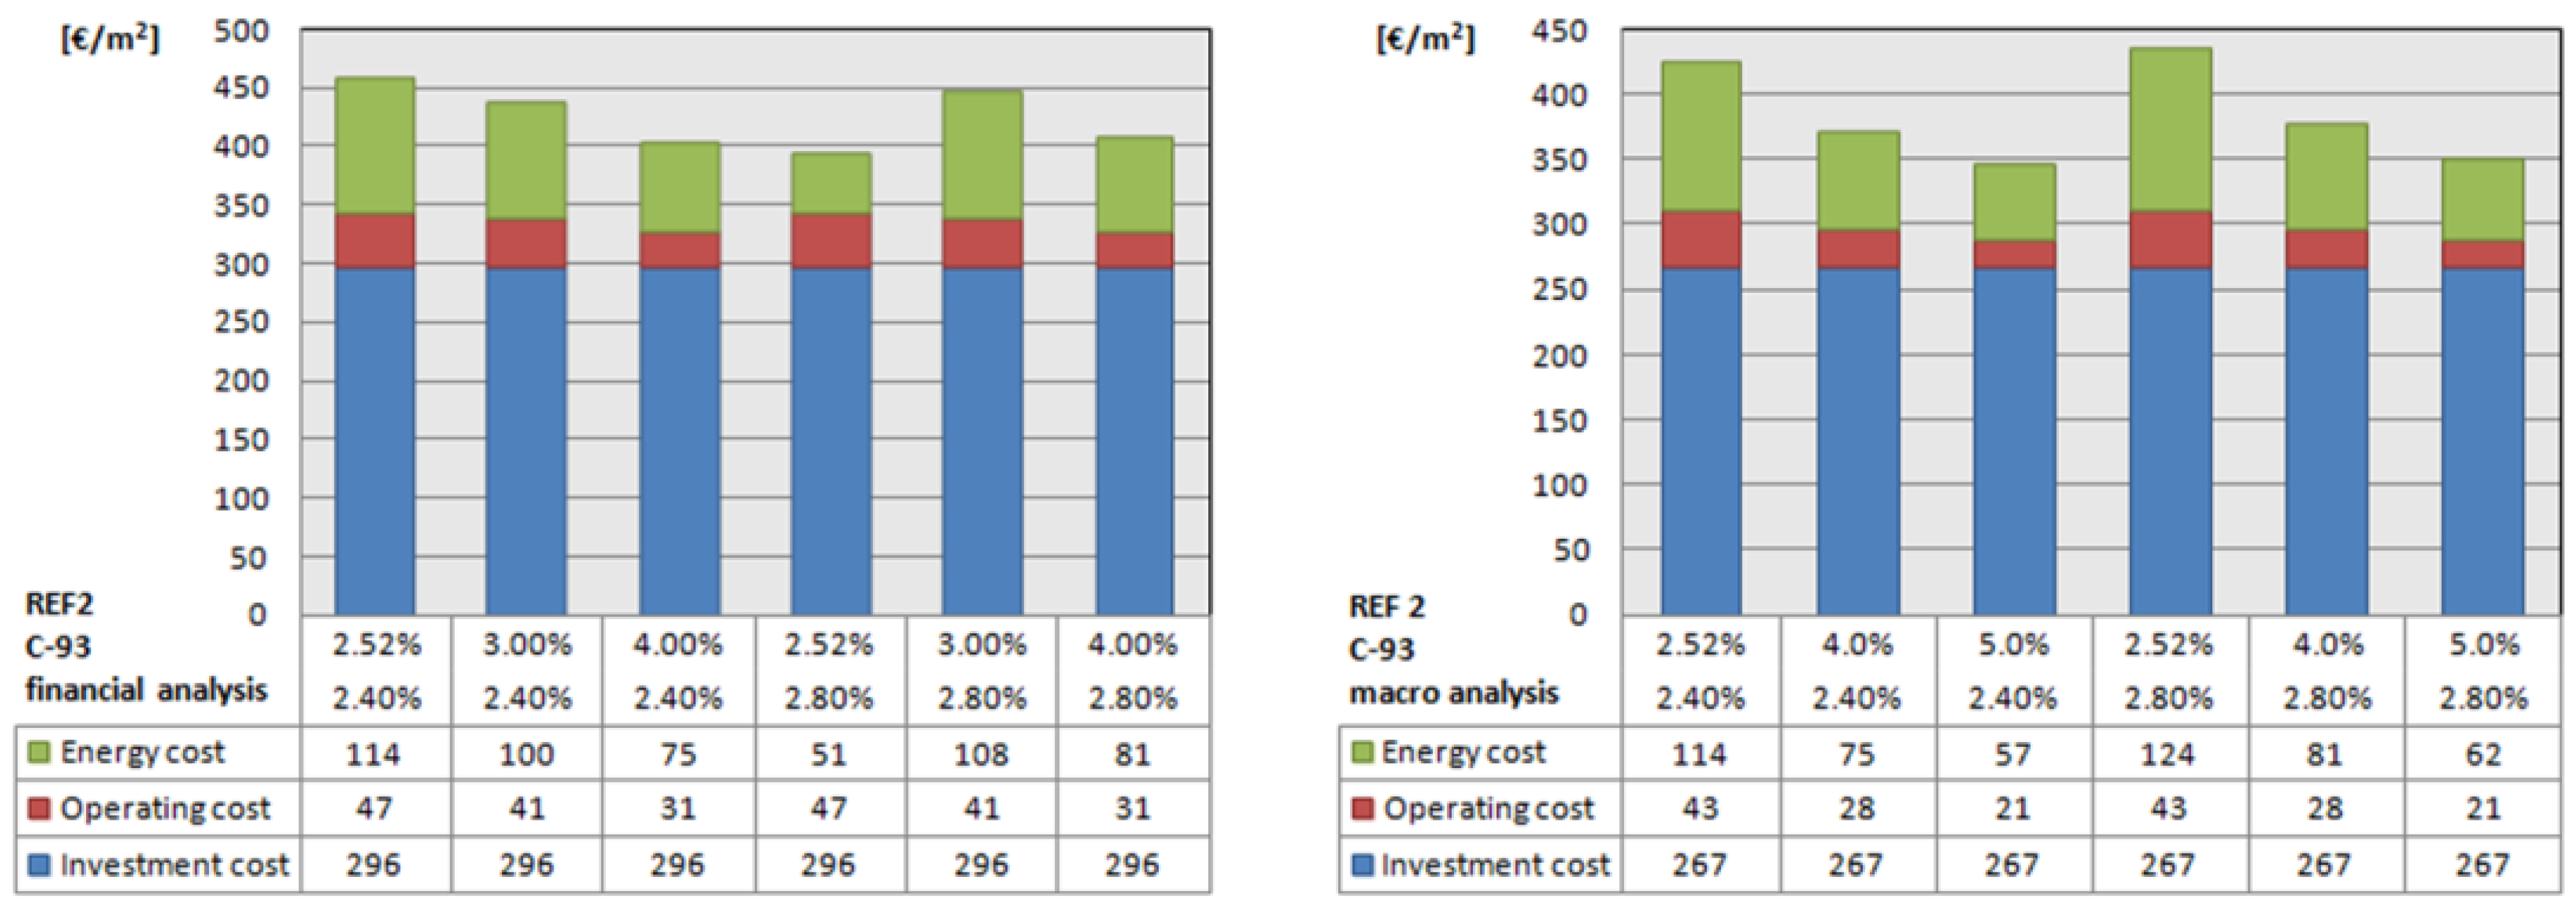
Figure 6 and
Figure 7 show the sensitivity analysis of the best combinations of REF1 and REF2 in terms of macroeconomic and financial analyses.
They have been obtained considering real interest rates of: 2.52%, 3%, 4% for the financial analysis, and of 2.52%, 4%, 5% for the macroeconomic analysis. It is assumed that the rate of increase of the electricity price goes from 2.4% to 2.8% in both analyses.
All possible combinations of rates have been taken into account in order to have a more complete description of cost trends.
Table 6 and
Table 7 show different groups of solutions obtained by grouping the combinations according to the related primary energy consumption reduction.
The results obtained from the analysis of the two reference buildings justify the different performance after the application of the methodology. The construction period of the building structures defines the reason why the values in reduction of primary energy consumption and the CO2 gas emissions are higher for the oldest building then for the other one. The initial status of the analyzed building affects the performance of the applied optimal solution. At the same time, the global cost, depending on the primary energy consumption is also reduced compared to a more recent building.
The results obtained for REF1 from a financial and a macroeconomic analysis show that considering thickness as a variant for insulation has a specific impact on cost-optimal levels. Although the envelope performance increases with the thickness, the investment costs and the global costs increase too. For this reason, it is useful to consider the material thermal properties together with the investment cost. The most performing variant of REF1 has been obtained through the thinnest hemp fiber panel considered. Furthermore, increasing the number of photovoltaic panels leads to a reduction of both primary energy consumption and global costs. This means that, despite investment cost increases, the energy demand decreases because of the highly efficient technical systems. A variation of the number of photovoltaic panels has been considered both for REF1 and REF2. The variant PV02 led REF2 to improve its cost optimal level, considering that the increasing number of photovoltaic panels has been included to optimize some combinations falling within national energy class C.
The best solution related to REF2 includes the geothermal heat pump (GEN03) with the best performance in heating and cooling, and the highest COP and SEER compared to the other heat pumps of the analysis. This indicates that the electrical power consumption is the lowest and, for this reason, the primary energy and the CO2 emission have the highest reduction (85% and 82%, respectively), although the energy demand generated is the same for all combinations. The most performing solution has been obtained through the application of a high efficiency heat pump. Although the energy demand increases for auxiliary and domestic hot water, total monthly energy demand of the best solution is still lower than the energy requirement of the reference building. This means that the analysis has to carefully consider heating and cooling demands as the crucial parameters that can impact results in order to derive the highest primary energy savings in existing buildings.
It has to be pointed out that this study is based on cost assumptions that can change over time. As an example, fluctuations of energy prices as well as the relation with the discount rate influence global cost calculation and may slightly shift the cost-optimal point. Energy costs, inflation rate during the calculation period, and energy requirements can also vary and impact results.
4. Conclusions
While designing buildings as nZEBs seems to be feasible in many projects mainly in relation to new buildings or where RES are more available, rehabilitating the EU existing stock into efficient buildings is one of the main issues to be overcome in the near future [
46]. Member States have to improve their national plans for a gradual transformation of existing buildings into nZEBs and provide their long-term strategies for mobilizing investment in renovation [
47]. Despite their importance, school buildings are often characterized by high energy consumption and poor indoor air quality and thermal discomfort, without any air changing system.
This paper presents a set of solutions for two reference buildings: a kindergarten school and a nursery school located in the Mediterranean area (Southern Italy).
This paper shows how the cost-optimal methodology is useful in searching for the most appropriate retrofit measures for the renovation of existing public buildings. The requirements of primary energy consumption and RES have to take into account the resulting costs. It might be difficult to have the same level of minimum energy requirements in new and renovated buildings with equivalent timelines, because the cost-efficiency curve is different. The application of the methodology can practically drive the market demand towards a targeted energy retrofit. Life cycle assessment seems the most suitable approach in compliance with the EPBD requirements for existing buildings, which refer to the need for continuous policy and financial support.
In school buildings, it is crucial to find the best balance between cost reduction and high comfort for a good student and user’s performance. Improving comfort conditions and energy performance reducing operation costs appeared to be feasible in the presented case study.
The results obtained can be also used to highlight the differences between two kinds of building typologies, masonries and reinforced concrete structures not recently constructed. In order to obtain optimal conditions for old structures it is necessary to compare several solutions, obtaining global cost values slightly higher compared to more recent constructions. On the other hand, the renovation of historical buildings in Italy must be done considering the importance of such buildings for its cultural heritage. Moreover, the application of highly efficient solutions that reduce primary energy consumption and CO2 emissions is more significant in older buildings compared with the newest ones, since the scope for improvements is larger.
This research highlights the potential energy improvement that the cost-optimal analysis is able to provide in retrofit projects with respect to the baseline scenarios. The renovation procedure analyzed in this paper is not intended to be as single case-study as the obtained results can be spread to other similar projects in need of renovation. It stresses the importance of municipalities in the renovation of public buildings such as schools.
It also suggests further research effort on refurbishment optimization studies. Efficient control systems for air temperature, humidity, air quality and air change rate are among the fundamental solutions that should characterize schools in near future. School buildings should play a leading role towards the EU 20-20-20 goals for their capacity to spread a living style focused on environmental responsibility amongst future generations.


 ,
, 


