Article

Determination of Optimized Parameters for the Flexible Operation of a Biomass-Fueled, Microscale Externally Fired Gas Turbine (EFGT)

1
Deutsches Biomasseforschungszentrum gemeinnützige GmbH, Torgauer Straße 116, 04347 Leipzig, Germany
2
School of Natural Resources Engineering and Management, Department of Energy Engineering, German-Jordanian University, PO Box 35247, Amman 11180, Jordan
3
Faculty of Agricultural and Environmental Sciences, Department Waste Management and Material Flow, University of Rostock, Justus-von-Liebig-Weg 6, 18051 Rostock, Germany
*
Authors to whom correspondence should be addressed.
Energies 2016, 9(10), 856; https://doi.org/10.3390/en9100856
Submission received: 2 August 2016 / Revised: 29 September 2016 / Accepted: 12 October 2016 / Published: 22 October 2016
(This article belongs to the Special Issue Economics of Bioenergy 2016)

Abstract

:
Biomass as a source of renewable energy is a promising solution for current problems in energy supply. Olive waste is considered as an interesting option, especially for Mediterranean countries. Within this paper, a microscale externally fired gas turbine (EFGT) technology is presented as a decentralized power plant, within the range of 15 kWth, based on olive residues. It was modeled by Aspen Plus 8.6 software to provide a sufficient technical study for such a plant. Optimized parameters for pressure ratio and turbine air-mass flow have been mapped for several loads to provide information for process control. For all cases, mechanical output, efficiency curves, and back-work ratio have been calculated. Using this information, typical plant sizes and an example of power production are discussed. Additionally, achievable energy production from olive waste is estimated on the basis of this data. The results of this study show that such a plant has an electrical efficiency of 5%–17%. This variation is due to the examination being performed under several combustion temperatures, actual load, heat exchanger temperatures, and heat transfer efficiency. A cost estimation of the discussed system showed an estimated capital cost of 33,800 to 65,300 € for a 15 kWth system.

1. Introduction

Using biomass as an energy source is considered to be one of the main options to supply renewable power and heat, thus reducing carbon dioxide emissions as well as consumption of imported fuels. Especially, the use of agricultural residues and other wastes from food industry is a good option to provide bioenergy with low additional carbon dioxide emissions. Biomass is a perfect investment, especially when hybridized with other unstable sources like wind and solar energy [1]. From several types of biomass, we chose olive residues for this research due to the abundant availability in Mediterranean countries.
Olive-processing residues are considered as a promising source of biomass due to the energy utilization property shown based on its characteristics [2]. For 2015/2016, the worldwide production is 2,742,500 tons, produced mainly by Mediterranean countries (approximately 97%) [3,4]. Olive oil-extracting technologies are mainly traditional pressing and the centrifugation method with either two- or three-phase schemes [1,5]. Solid residues (rich in water) are approximately 40% from pressing, and 30%–50% and 60%–70% for three and two phases, respectively [6,7]. Each olive tree can produce an average of 10–30 kg/year of pruning residues; these are mostly burned in the field with a small portion used for animals feeding [5].
The produced water contains organic acids, lipids, alcohols, and phytotoxic materials that are dangerous for the environment; however, its organic matter and nutrients make it valuable for fertilizing soil [8]. Roughly, solid dry residues can be estimated at 25% of the mass of the processed olive [9], thus it can be estimated that 685,625 tons is available worldwide for 2015/2016, with 97% in Mediterranean countries.
The chemical composition of olive waste generally differs from one sample to another because it depends on several factors like olive mill processing pressure and temperature, but also olive type, soil, and growing conditions. When the process is handled in normal conditions, the fat percentage is between 8% and 16%; the nucleus presence is approximately 40%, which is rich in minerals like calcium and copper, and has a high percentage (up to 40%) of fibers [10]. The variability in the chemical composition of olive waste for two prototype samples, a Spanish and a Jordanian sample, is shown in Table 1. However, the effect of sample composition on electrical efficiency and plant operation will be investigated in a future study. For the present study, the Aspen modeling calculations were performed with the Jordanian sample. A noticeable difference is clear in fixed carbon and ash contents, in addition to the relatively high values for higher heating value (HHV).
The most common thermochemical energy conversion processes used to convert solid biomass combined heat and power are direct combustion, pyrolysis, and gasification of biomass [12]. To achieve electricity from a combustion process, it is necessary to select a suitable power plant technology that meets biomass distribution due and countries’ conditions. For these reasons, small power plants are more practical than large ones, especially when concerned with developing distributed generation concepts.
Typical combined heat and power technologies in the range below 1 MWel are Stirling engines, steam engines, microgas turbines, gas engines (combined with gasification), or fuel cells. For solid fuels, the most suitable systems are based on combustion in combination with Stirling and steam engines, or with organic Rankine cycle (ORC) turbine technology [13]. Another suitable system is the so-called externally fired gas turbine (EFGT) as shown in Figure 1, while gasification processes could also be used, as discussed in other research such as that conducted by Link et al. [14].
Being able to process a wide variety of fuels, including those with suboptimal combustion properties, EFGT is considered to be a promising option for small- to medium-scale plant sizes [15,16]. The literature shows that technical and economic studies have been done for plants in the range of 30–100 kWel, mainly for microscale. Typically, the discussion is about the use of EFGT in heat recovery, dealing with high-temperature heat exchangers, and thermal analysis for either biomass direct combustion or gasification [15,16,17,18,19,20,21,22]. Such technology has some advantages over the other systems; for example, greater flexibility in fuel type and lower cleaning and maintenance costs when compared with internal combustion gas turbines [23,24]. Additionally, there is no need for water as a medium or for cooling in the condenser, which can be an advantage in arid regions [19]. There is no liquid working medium, as in steam turbines or engines; therefore, the startup, shutdown, and transient period of EFGT systems are mainly limited by the combustion process itself since the turbine has a relatively fast response [25,26]. Systems based on gasification (e.g., in combination with gas engines or fuel cells), as discussed in the past [27,28], are not considered within this study. This is because such existing systems are mostly designed for woody fuels and there are still unresolved questions regarding gas cleaning of the gas produced from agricultural residues like olive waste. Additionally, a comparison between EFGT and a gasification-based gas turbine system has been published for a 30 kWel plant fueled by olive tree leaves and prunings [29].
Typical electrical efficiencies for systems like ORC and EFGT are in the range of 10%–20%. Although higher efficiencies of 25% for EFGT have been reported [30], for the relevant size within this study, we expect an electrical efficiency below 20% [13,15,22,30]. Actually, there is no exact definition for EFGT classes with respect to the plant size, so we defined microscale, based on other researches, as being up to 200 kWel [31,32,33,34]. An overview of existing research on EFGT is given in Table 2.
For analyzing the thermal operation of the gas turbine, Joule-Thomson or (as in other references) Brayton cycles are the best and ideal selections for calculating the efficiency of the gas turbine [40], since the working fluid (air) is compressed and then expanded by the operation of the gas turbine after heat addition from the combustion process.
Turbines are generally defined as rotating machines dependent on the flow of liquid or gas materials at a certain pressure and temperature, resulting in rotation of a connected shaft with an electrical generator. The ideal thermal efficiency by the means of temperature or pressure is given by Equation (1) (see also [41]):
η th = 1 T 1 T 2 = 1 ( p 1 p 2 ) k 1 k
The heat exchanger (HE) is a key component in an EFGT biofuel-based plant due to the high combustion temperature (combined with elevated pressure) and the aggressive behavior of the flow gases that cause oxidation, surface corrosion, and erosion [42]. There are several classifications and types for the heat exchanger depending on the specific application. In this research, shell-and-tube HE was selected (as in [22,23]), since shell-and-tube type is the most suitable due to its ability to operate in high-temperature conditions, the design can withstand fouling caused by combustion, and its thermal stress reluctance [38].
In a recent study on EFGT technology based on woody biomass [43], the resultant electrical cost was found to be 0.33 euro/kWh at a utilization factor of 0.8 (7000 h/year) with an assumed power output of 60 kWel. Another study was performed on the thermoeconomics of an EFGT cycle with two firing schemes—natural gas and biomass—with the plant designed to provide 100 kWel with the possibility of adjusting percentages of energy sources (natural gas (NG) and biomass) from 0% to 100%. The capital cost was determined to be 471,000 euros with operating costs (including biomass supply, ash discharge, and maintenance) of 69,750 euro/year when the biomass quota is 100% [21].
In [44], an economic analysis of advanced and EFGT cycles was made by estimating the capital, operating, and maintenance specific costs. The specific capital cost of a power plant of 1 MWel size was calculated to be 540 £ (ca. 733.5 euro) per kWel.
While previous research on power production with EFGT technology concentrated on higher nominal power, as shown in Table 2, the following study aims to evaluate the use of a very small system (15 kWth) and provide suitable parameters for the operation of such a system. The expected efficiency values and parameter mappings for nominal operation are presented.
At the beginning of the Methodology section, the design of the proposed system is described, followed by the models for the combustion process and the thermodynamic cycle. In the Results and Discussion section, suitable parameters for an EFGT of this small size are specified for olive waste as an exemplary biomass. Finally, a cost estimation of the proposed system is given.

2. Methodology

2.1. System Design

For the study, an EFGT has been designed on the basis of Figure 1. This includes a direct biomass combustion system, a turbine, a compressor for turbine air, and a high-temperature heat exchanger.
Considering plant size, a 15 kWth EFGT cycle is suggested in order to illustrate the idea of decentralized power generation from olive waste for the modeling part. Noting that, it is also applicable for other biomass resources, including mixtures, which could be provided internationally since the moving parts (especially the turbine) are separated from the flue gas stream by the heat exchanger.

2.2. Combustion Model

Referring to the schematic diagram in Figure 1, the complete process of the EFGT cycle is based on biomass pellets. The burning process is performed at a 15 kWth burner where the stoichiometric combustion equation (based on the composition of Jordanian sample 2 from Table 1) is calculated by Equation (2):
C H 1.6046 O 0.5627 N 0.014 S 0.0016 + 1.1206 ( O 2 + 3.76 N 2 ) y i e l d s C O 2 + 0.8023 H 2 O + 4.2205 N 2 + 0.0008 S O 2
For energy and mass balance calculations, the flow sheet software Aspen Plus has been used. In Aspen Plus, olive residues are considered as a nonconventional component. The combustion reaction is performed by using two reactors RYield and RGibbs as in Figure 2. RYield reactor is commonly used when the stoichiometric reaction is not known (i.e., no need to clarify the stoichiometric reaction and its kinetics). RGibbs reactor performs the chemical equilibrium by minimizing the Gibbs free-energy, and the heat-transfer balance is done by connecting a heat stream between both reactors in order to maintain the energy balance. Since olive residues are considered as a nonconventional component, RGibbs reactor is not suitable for energy calculations. As a solution, the RYield reactor is placed before RGibbs to convert olive residues to constituent elements [45]. SSPLIT is used to separate ash from the total flow. The residues’ component yields (mass basis) are shown in Table 3 for RYield reactor.
The flow gas components are performed by specifying the expected products in RGibbs reactor; the components are C (pure solid), CO2, N2, H2O, O2, H2, CO, and SO2. For both reactors the pressure is 1 bar.

2.3. Thermodynamic Cycle Model

Figure 2 shows the complete plant modeled by Aspen Plus 8.6.
To study the cycle behavior for different operational cases, it is necessary to have a reference case. The general parameters for the reference case are given in Table 4. Both compressor and turbine follow the isentropic operation, and the main parameters to set are pressure difference and efficiency. The temperature difference on heat exchanger terminals (HED, TCO–THI) will be mainly discussed a value of 20 K, while results for a difference of 100 K will also be included for comparison of cases with suboptimal heat exchanger operation (e.g., due to fouling). In literature, the values for this temperature difference are in the range of 10–150 K and 50–200 K (see Table 2) [29]. It is important to notice that this study is on open-loop cycle, which means lower efficiency values are expected due to heat loss; in addition, 90% electrical generator efficiency is assumed for all calculations.
The sensitivity property in Aspen is used for finding the net power output from the cycle, then assigning the pressure and air flow in the compressor where the maximum power is found. This procedure is used for parameter mapping for the maximum benefit from the plant in general, under different operational conditions. Modeling parameters are shown in Table 4.

3. Results and Discussion

3.1. Technical Evaluation

In comparison to the reference case with nominal operation conditions, the behavior of the cycle with variating pressures, temperatures, and mass flow parameters is evaluated in this section. Table 5 shows the pressure and temperature values, taking into consideration the pressure drop on HE terminals.
Flow gas components in the exhaust streams hot stream input (HI) and hot stream output (HO) at an air-to-fuel ratio (AFR) of 20 are shown in Figure 3.
After combustion, the hot flue gas (stream HI in Figure 2) has a temperature of about 1088 K. For the reference case, AFR was adapted to reach this temperature to avoid overheating of the heat exchanger. As a result, turbine inlet temperature (TIT) is limited, too. The effect of changing TIT, especially due to different flue gas temperatures, is discussed later in this study.
The results show that for the normal situation (taking parameters in Table 4), the compressor consumes around 3.2 kWm while the gas turbine delivers 4.9 kWm, resulting in 1.7 kWm generated from the whole process. The delivered power is related mainly to the pressure variation and combustion temperature. Figure 4 shows the net mechanical output power with respect to pressure variation at m ˙ a = 0.017   k g / s .
The output power change with respect to mass flow through the compressor at p = 4 bar is given in Figure 5.
The results in Figure 4 show that the output power increases with increasing pressure until 4 bar, after which it starts to decay. This refers to high compressor consumption while the turbine starts to show a lower increase in power generation; in this case the maximum output when varying pressure is 1.7 kWm. This can be compared to Figure 5 where the maximum net power output is found at 0.017 kg/s turbine air-mass flow.
The electrical efficiency is affected by the combustion, and as a result, by the air stream temperature entering the turbine. As shown in Figure 6, lower temperature values result in lower efficiencies, noting that the variation for both efficiency and AFR is calculated for maximum power output at each turbine inlet temperature (TCO).
The resulting graphs for the reference case are generated by variating one variable (p or m ˙ a ) at a combustion temperature of 1088 K. Figure 7 shows the output power with respect to combustion temperature for both 100% and 50% fuel consumption and at two values for HED (heat exchanger temperature difference: TCO–THI) Whereas the lower value of 20 K represents good operation, the higher value of 100 K is considered to be incomplete heat exchange (e.g., due to fouling). It is clear that higher electrical output values are reachable when increasing the temperature of combustion for both cases. For the case of 100% fuel feed, the net output electrical power is around 0.5 kWel at flue gas temperature of approximately 700 K and HED of 20 K, at the same time; this value does not exceed 0.4 kWel at 100 K HED. The increase in the electrical power output seems to be fast until 1300 K, after which it slows down with closing behavior for both 20 and 100 K HED. The same explanation is applicable to 50% fuel-feed diagrams but with lower values: nearly 0.25 kWel as a starting point for 20 K HED and 0.2 kWel for 100 K HED. The electrical output power can reach 2.5 and 1 kWel at 1750 K for both 100% and 50% of fuel feed, respectively. However, the limitations in temperature values for HE and turbine should be taken into consideration. The HED has a slight effect on power output for higher temperature values, while HED effect starts to increase for lower combustion temperatures.
The sensitivity tool in Aspen was used in an optimization process. At each flue gas temperature (or turbine inlet temperature at 20 or 100 K HED), m ˙ a was varied within the range from 0.001 to 0.03 kg/s with steps of 0.001 kg/s, and at each step p is also changed within the range from 1.4 to 8 bar (abs) with steps of 0.3 bar, taking the maximum net output power from the cycle and then registering both p and m ˙ a , and so on, until about 1850 K flue gas temperature.
The electrical output power shown in Figure 7 is at the maximum point for flue gas temperature. This is achieved by optimizing both p and m ˙ a , as explained above, and mapping both parameters in order to get the maximum power point as a function of flue gas temperature (see Figure 8).
In Figure 8, the mapping diagram for both pressure and turbine air-mass flow shows the optimum values for both parameters at each turbine inlet temperature. It is shown that at low TIT values, it is necessary to keep low pressure and high   m ˙ a ; this is explained by the compressor power consumption, which depends on pressure value. Optimum pressure values for both 100% and 50% of nominal power are strongly dependent on turbine inlet temperature, while only a small correlation to nominal power and HED has been found.
As can be expected, optimized turbine air-mass flow shows different results. For the case of 50% fuel feeding, the optimized value is reduced nearly linearly. Considering changes in heat exchanger efficiency, it is increased to compensate for lower heat transfer.
The importance of mapping presented in Figure 8 is related to the plant controlling for load variations, whatever the biomass used. Thus, THI is the relative temperature value that needs to be measured in order to assign both p and m ˙ a . It should be noted that sensitivity analysis in Aspen produces small changes in HED to reach numerical stability and to conserve mass and energy balances.
Electrical efficiency is highly affected by the TIT as shown in Figure 9. While for 1060 K it reaches 10% at 4 bars, it is significantly lower at TIT of 938 K and 988 K. It should also be noted that optimal pressure changes with TIT.
To have an overview on the rotational speed of a suggested radial flow turbocharger, a micro size turbocharger with a blade radius of 0.03 m is assumed to be installed. Assuming no exit swirl at the turbine output; the specific work w can be calculated according to Equation (3) (see [46]):
w = U 2 V u 2 = U 2 2
where U2 and V2 are the blade and axial flow speeds respectively. Once finding the specific work (dividing turbine power by m ˙ a ), the blade speed is calculated from Equation (3), then the rotational speed is found by converting the linear velocity to an angular one. The speed variation in rpm with inlet turbine temperature is shown in Figure 10.
This is an expected value for such turbocharger size; a value of 72,000 rpm is reached for larger sizes, as in [23]. The back-work ratio (BWR) (that is, the ratio between power consumed by the compressor and mechanical power produced by the turbine), as seen in Figure 11, decreases with higher temperature values entering the turbine, thus leading to more efficient operation.

3.2. Cost Estimation

As discussed, literature on EFGT cycle economics have not handled EFGT ranges of 15 kWth (around 1.5–3 kWel). By using economical capital scaling [47], capital costs can be calculated from different installations while considering scaling effects as in Equation (4):
C C 0 = ( M M 0 ) s
where C is the capital cost of a plant of a capacity M, C 0 , M 0 are the base capital cost and capacity (consider [21]), and s is the dimensionless scale factor (0.6 ≤ s ≤ 0.8). Due to the low number of installed systems for externally fired gas turbines, the scaling factor cannot be estimated at a higher precision, currently. Thus, the estimated capital cost of a 15 kWth power plant with about 1.6 kWel net output (including generator efficiency) is estimated to be 33,800–65,300 Euro, considering the reference data from [21].

4. Conclusions

Combined heat and power (CHP) technology based on biomass in general is a promising way to reduce fuel import dependency, improve the electrical grid as a distributed generation technology, and reduce carbon dioxide emissions. Using biomass as a fuel has advantages compared to solar and wind power, since its availability is not dependent on weather conditions. Solid olive waste can be stored as briquettes or as pellets, so power can be produced on demand. Also, the wastes are already available at centralized places (olive mills) which reduce transport costs and emissions. Usage of adequate technology (e.g., EFGT) makes it possible to have higher fuel flexibility, which provides more options (e.g., under changing agricultural situations).
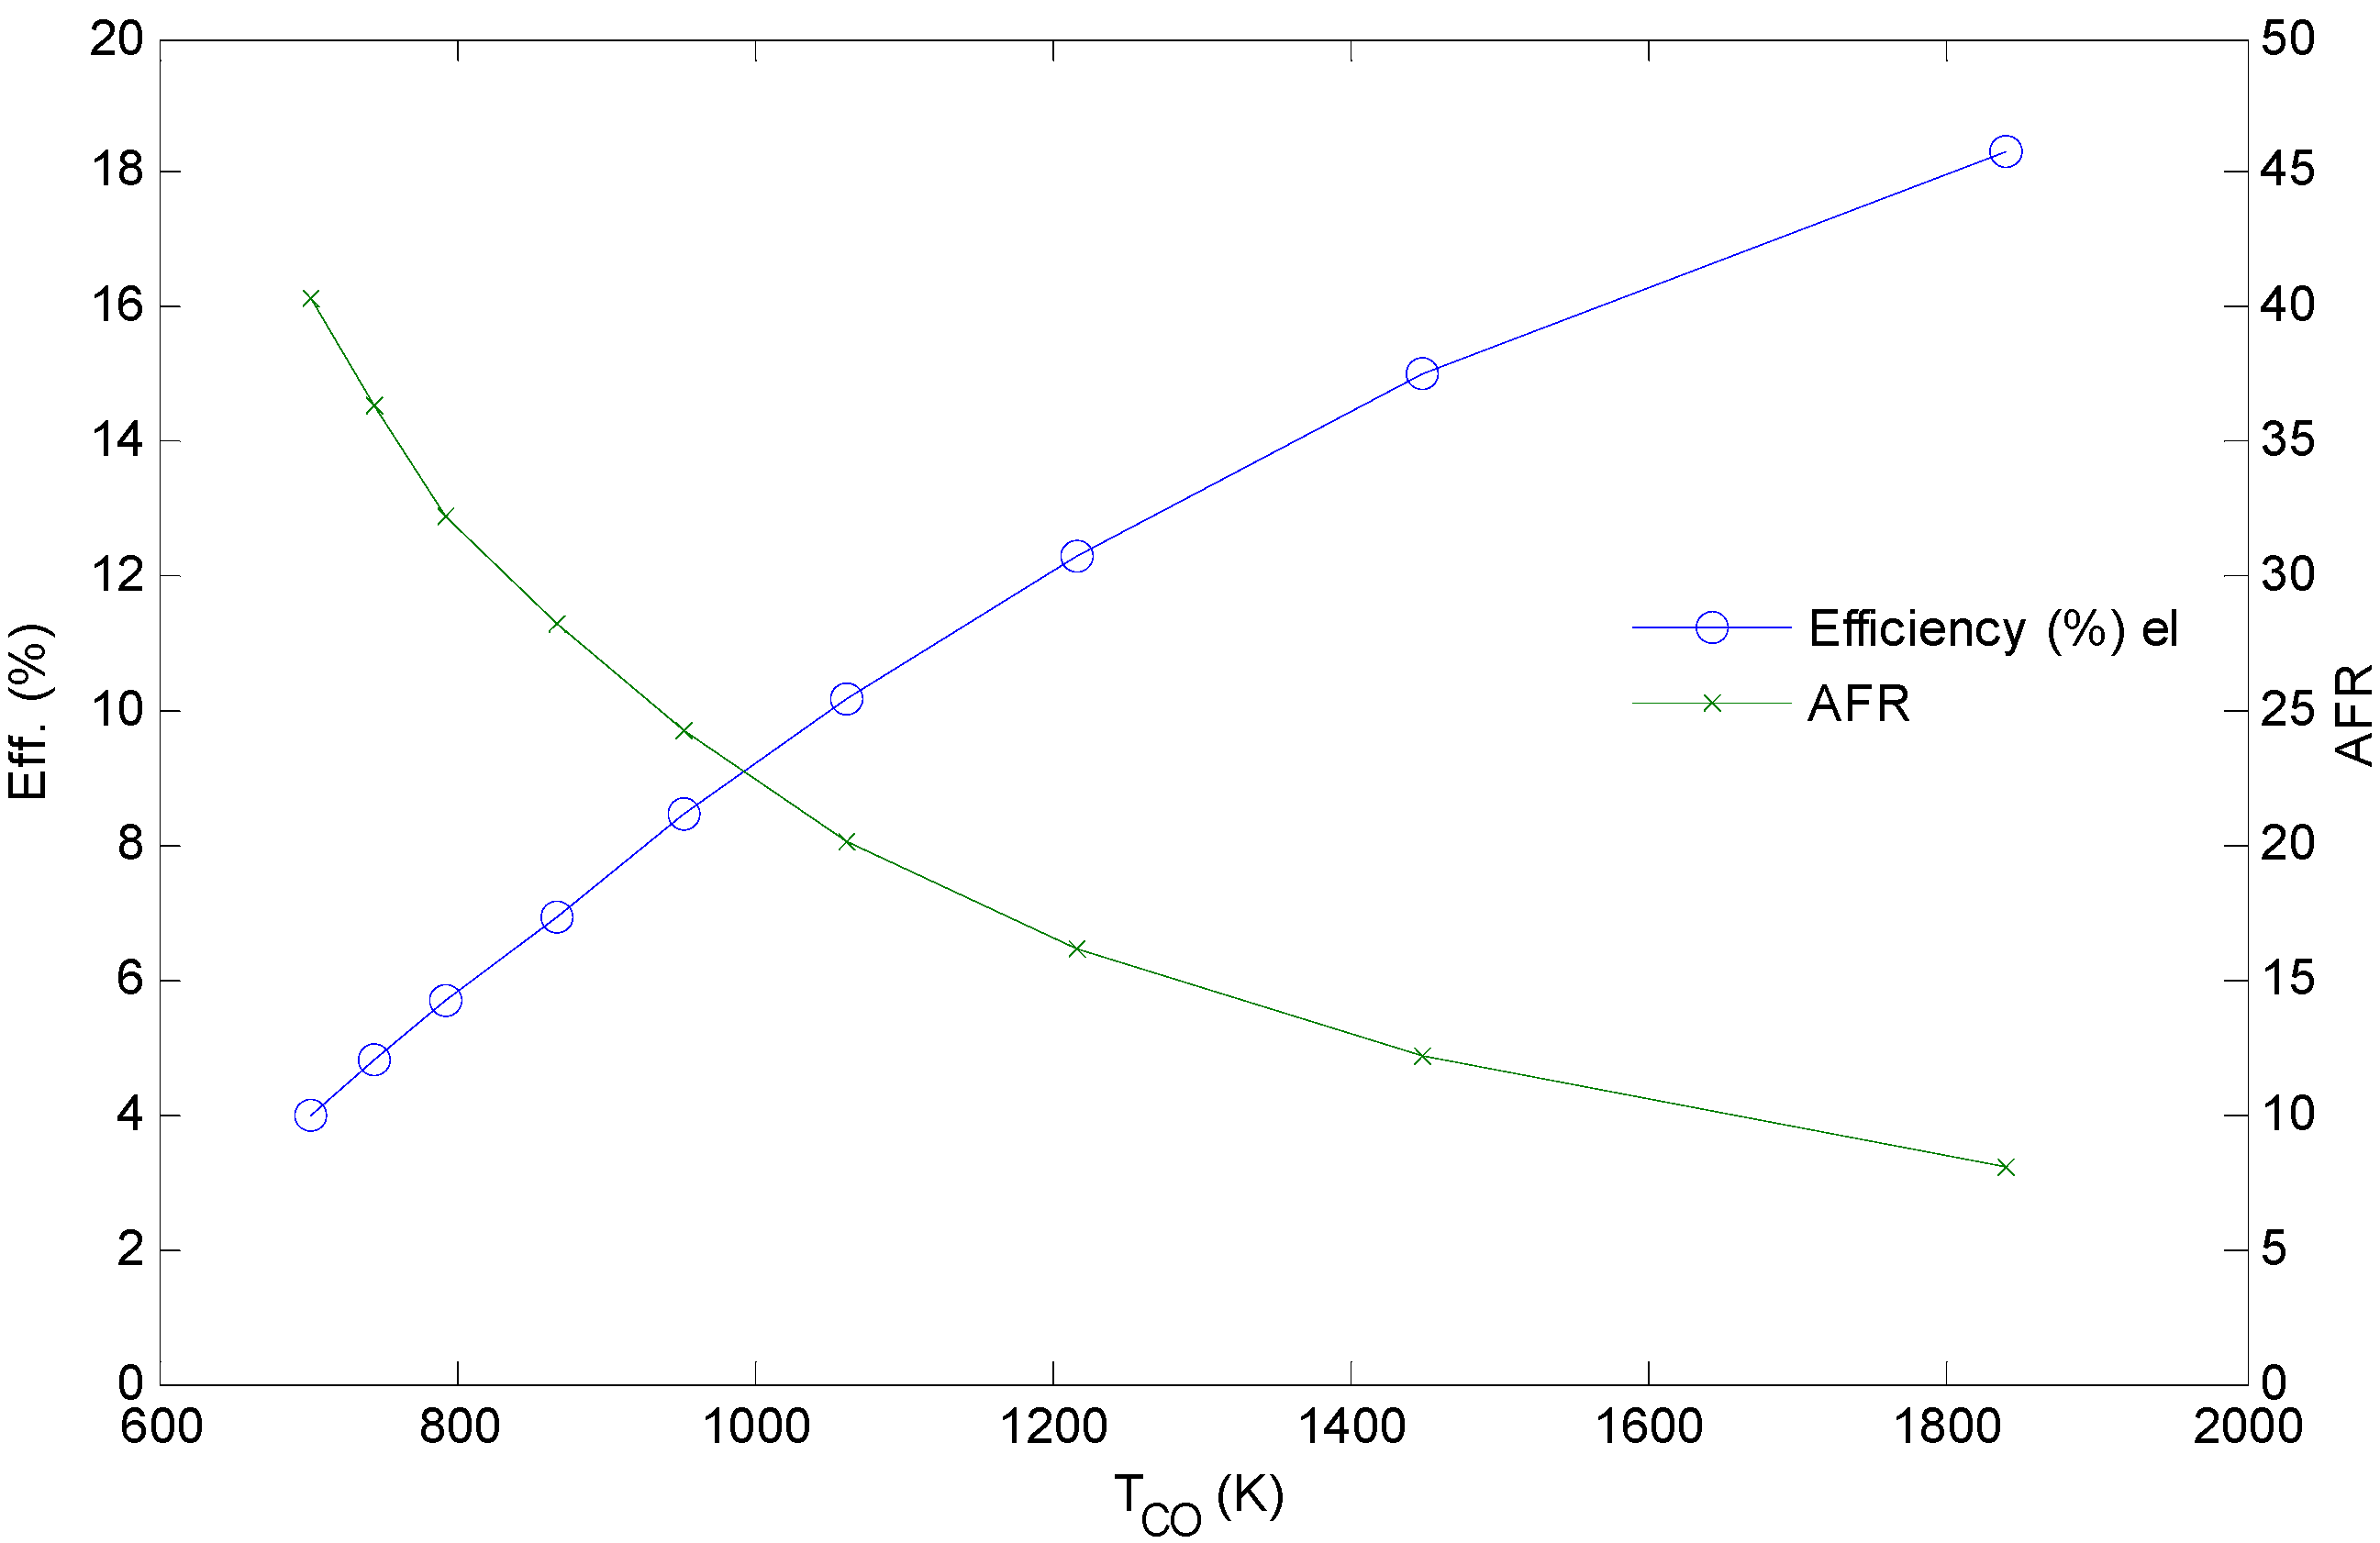
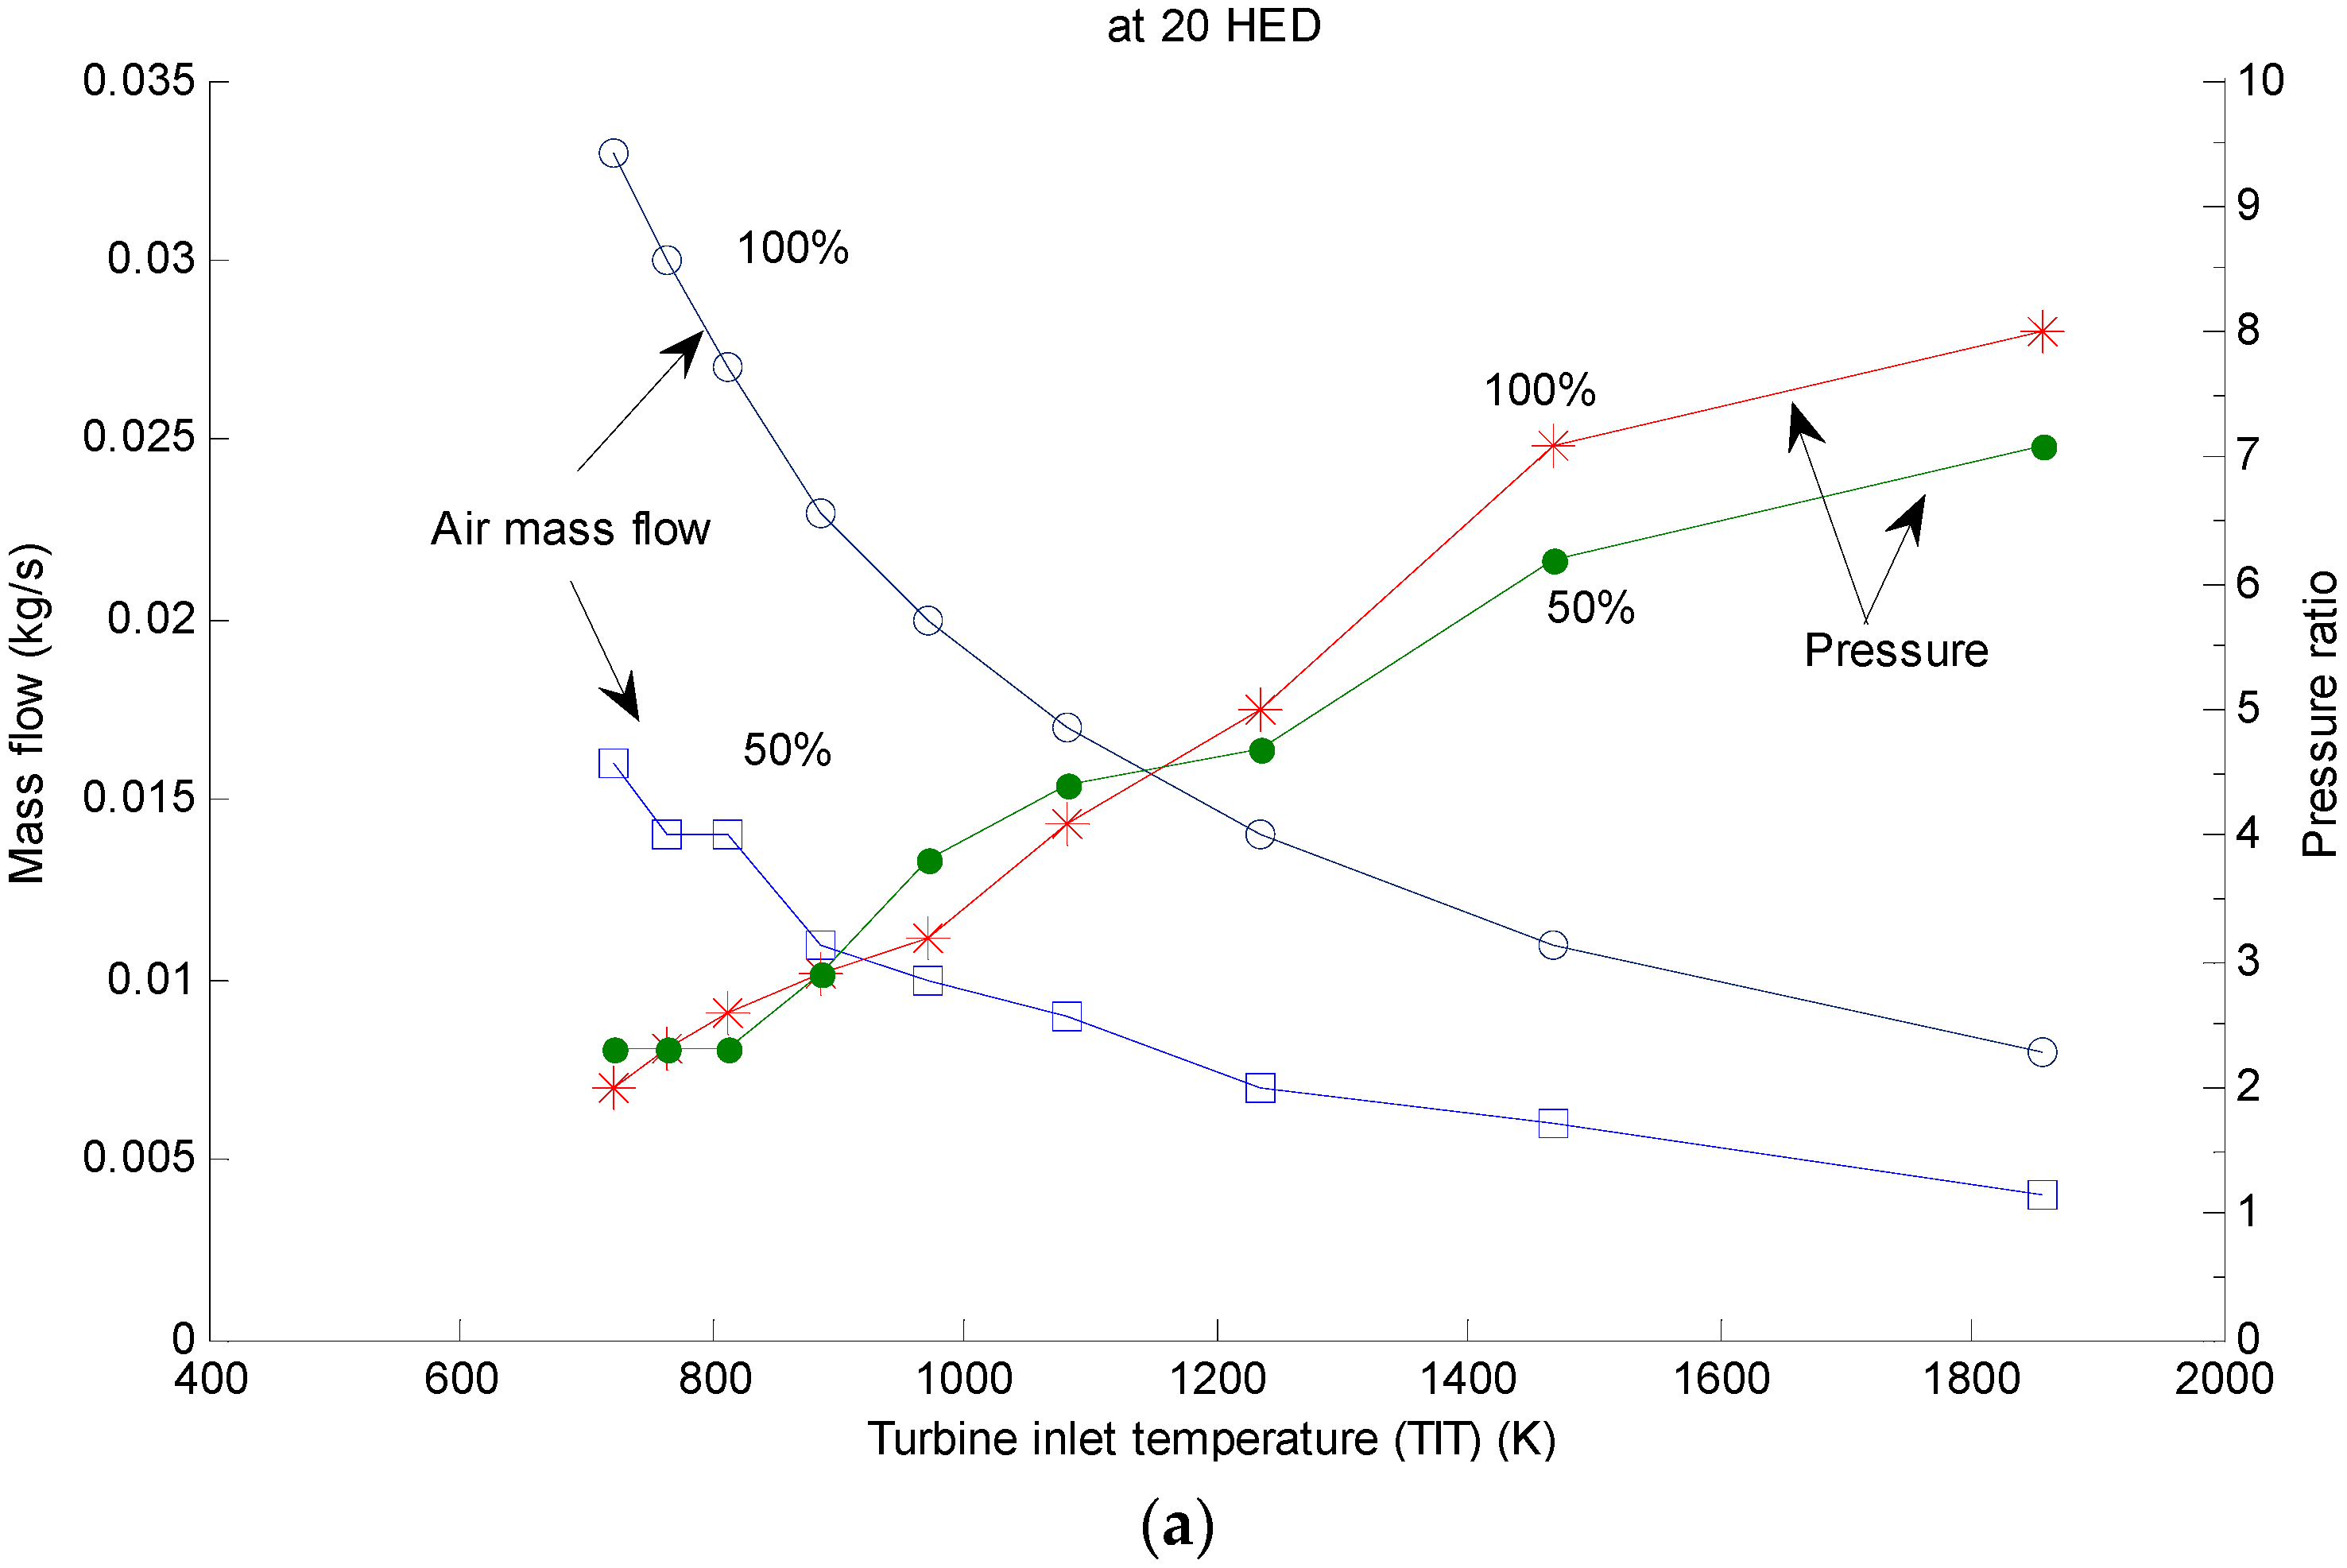
For the current study, an EFGT with a nominal thermal power of 15 kW has been investigated to map optimized pressure and turbine air-mass flow for several conditions. The plant electrical efficiency is in the expected range based on the literature. The results show that plant efficiency between 5% and 17% is realizable, taking into consideration that the nominal state is around 10%, which depends on temperature limits for the setups. Noting that, efficiency could be improved when using a more efficient compressor and gas turbine, in addition to the potential of waste heat recovery. Application of the CHP concept is possible for domestic heating; as a result, the heating from olive residues is applicable beyond electrical generation applications.
Turbine inlet temperature is a dominant factor in the electrical efficiency, so higher temperature values in combustion flue gas could provide a more efficient operation. To this point, it is important to develop high-temperature standing material for a pressurized heat exchanger and turbine, which is also required to get the maximum benefit.
It is also shown that the plant tends to be less efficient at low input power percentages when the back-work ratio is more than 70%, while moving to higher flue gas temperatures leads to higher efficiency.
Further research is currently running to describe a detailed technical operation including practical findings, controls, transient behavior, and results of testing further biomass types on a real combustion system combined with a hardware-in-the-loop (HIL) system.

Acknowledgments

The research conducted within this study has been supported by the German Federal Ministry of Food and Agriculture (BMEL) as well as by the German-Jordanian University in Amman, Jordan.

Author Contributions

Mathhar Bdour and Andreas Ortwein designed the study and the simulation. Mathhar Bdour performed the simulation and data analysis. Michael Nelles and Mohammad Al-Addous contributed substantially to the design of the study, the simulation and the paper. Mathhar Bdour wrote the paper, with assistance and editing from Andreas Ortwein, Mohammad Al-Addous and Michael Nelles.

Conflicts of Interest

The authors declare no conflict of interest. The founding sponsors had no role in the design of the study; in the collection, analyses, or interpretation of data; in the writing of the manuscript, and in the decision to publish the results.

Abbreviations

AFRAir to fuel ratio
BWRBack work ratio
CCapital cost
CHPCombined Heat and Power
EFGTExternally fired Gas Turbine
HEHeat Exchanger
HEDHeat exchanger terminals temperature difference (THI–TCO)
HHVHigher heating value
HILHardware-in-the-Loop
kThe ratio of the specific heats
m ˙ a Air mass flow for enters the compressor
ORCOrganic Rankine Cycle
pPressure (absolute)
TTemperature
TITTurbine inlet temperature (or stated as TCO)
UBlade speed
VAxial flow speed
wSpecific work
CCold stream
elElectrical
HHot stream
iInput
mmechanical
oOutput
thThermal

References

  1. Khalsa, J.; Döhling, F.; Berger, F. Foliage and grass as fuel pellets-small scale combustion of washed and mechanically leached biomass. Energies 2016, 9, 361. [Google Scholar] [CrossRef]
  2. Christoforou, E.; Fokaides, P.A. A review of olive mill solid wastes to energy utilization techniques. Waste Manag. 2016, 4, 346–363. [Google Scholar] [CrossRef] [PubMed]
  3. Pagnanelli, F.; Toro, L.; Vegliò, F. Olive mill solid residues as heavy metal sorbent material: A preliminary study. Waste Manag. 2002, 22, 901–907. [Google Scholar] [CrossRef]
  4. International Olive Council. World Table Olive Figures. Available online: http://www.internationaloliveoil.org/estaticos/view/132-world-table-olive-figures (accessed on 7 July 2016).
  5. Pantaleo, A.; Pellerano, A.; Carone, M. Olive residues to energy chains in the Apulia region. Part I. Biomass potentials and costs. J. Agric. Eng. 2009, 1, 1–11. [Google Scholar] [CrossRef]
  6. Azbar, N.; Bayram, A.; Filibeli, A.; Muezzinoglu, A.; Sengul, F.; Ozer, A. A Review of Waste Management Options in Olive Oil Production. Crit. Rev. Environ. Sci. Technol. 2004, 34, 209–247. [Google Scholar] [CrossRef]
  7. Caputo, A.C.; Scacchia, F.; Pelagagge, P.M. Disposal of by-products in olive oil industry: Waste-to-energy solutions. Appl. Therm. Eng. 2003, 23, 197–214. [Google Scholar] [CrossRef]
  8. Toscano, P.; Montemurro, F. Olive Mill By-Products Management. In Olive Germplasm-The Olive Cultivation, Table Olive and Olive Oil Industry in Italy; Muzzalupo, I., Ed.; InTech: New York, NY, USA, 2012. [Google Scholar]
  9. Annual Report. Ministry of Agriculture Jordan. Available online: http://www.moa.gov.jo/ar-jo/agriinformationar.aspx (accessed on 2 August 2016).
  10. Jordan Biogas Company. Available online: http://www.jordanbiogas.com/about.html (accessed on 2 August 2016).
  11. Garcı́a-Ibañez, P.; Cabanillas, A.; Sánchez, J.M. Gasification of leached orujillo (olive oil waste) in a pilot plant circulating fluidised bed reactor. Preliminary results. Biomass Bioenergy 2004, 27, 183–194. [Google Scholar] [CrossRef]
  12. Dahlquist, E. Technologies for Converting Biomass to Useful Energy; CRC Press: Boca Raton, FL, USA, 2013. [Google Scholar]
  13. Karl, J. Dezentrale Energiesysteme: Neue Technologien im Liberalisierten Energiemarkt; Oldenbourg: München, Germany, 2006. [Google Scholar]
  14. Link, S.; Arvelakis, S.; Paist, A.; Martin, A.; Liliedahl, T.; Sjöström, K. Atmospheric fluidized bed gasification of untreated and leached olive residue, and co-gasification of olive residue, reed, pine pellets and Douglas fir wood chips. Appl. Energy 2012, 94, 89–97. [Google Scholar] [CrossRef]
  15. Al-attab, K.A.; Zainal, Z.A. Externally fired gas turbine technology: A review. Appl. Energy 2015, 138, 474–487. [Google Scholar] [CrossRef]
  16. Traverso, A.; Massardo, A.F.; Scarpellini, R. Externally Fired micro-Gas Turbine: Modelling and experimental performance. Appl. Therm. Eng. 2006, 26, 1935–1941. [Google Scholar] [CrossRef]
  17. Datta, A.; Ganguly, R.; Sarkar, L. Energy and exergy analyses of an externally fired gas turbine (EFGT) cycle integrated with biomass gasifier for distributed power generation. Energy 2010, 35, 341–350. [Google Scholar] [CrossRef]
  18. Cordiner, S.; Mulone, V. Biomass Energy Conversion in EFGT (Externally Fired Gas Turbine): An Experimental-Numerical Analysis; American Society of Agricultural and Biological Engineers: St. Joseph, MI, USA, 2012. [Google Scholar]
  19. Cocco, D.; Deiana, P.; Cau, G. Performance evaluation of small size externally fired gas turbine (EFGT) power plants integrated with direct biomass dryers. Energy 2006, 31, 1459–1471. [Google Scholar] [CrossRef]
  20. Soltani, S.; Mahmoudi, S.M.S.; Yari, M.; Rosen, M.A. Thermodynamic analyses of an externally fired gas turbine combined cycle integrated with a biomass gasification plant. Energy Convers. Manag. 2013, 70, 107–115. [Google Scholar] [CrossRef]
  21. Pantaleo, A.M.; Camporeale, S.M.; Shah, N. Thermo-economic assessment of externally fired micro-gas turbine fired by natural gas and biomass: Applications in Italy. Energy Convers. Manag. 2013, 75, 202–213. [Google Scholar] [CrossRef]
  22. Kautz, M.; Hansen, U. The externally-fired gas-turbine (EFGT-Cycle) for decentralized use of biomass. Appl. Energy 2007, 84, 795–805. [Google Scholar] [CrossRef]
  23. Al-attab, K.A.; Zainal, Z.A. Turbine startup methods for externally fired micro gas turbine (EFMGT) system using biomass fuels. Appl. Energy 2010, 87, 1336–1341. [Google Scholar] [CrossRef]
  24. Loeser, M.; Redfem, M. Micro-Scale Biomass Generation Plant Technology: Stand-Alone Designs for Remote Customers. In Proceedings of the 16th Eoropean Biomass Conference and Exhibition, Valencia, Spain, 2–6 June 2008.
  25. Lu, F.; Wang, Y.; Huang, J.; Huang, Y. Gas Turbine Transient Performance Tracking Using Data Fusion Based on an Adaptive Particle Filter. Energies 2015, 8, 13911–13927. [Google Scholar] [CrossRef]
  26. Anheden, M. Analysis of Gas Turbine Systems for Sustainable Energy Conversion. Ph.D. Thesis, The Royal Institute of Technolgoy (KTH), Stockholm, Sweden, 2000. [Google Scholar]
  27. Vera, D.; Jurado, F.; Margaritis, N.K.; Grammelis, P. Experimental and economic study of a gasification plant fuelled with olive industry wastes. Energy Sustain. Dev. 2014, 23, 247–257. [Google Scholar] [CrossRef]
  28. Vera, D.; Jurado, F.; Carpio, J. Study of a downdraft gasifier and externally fired gas turbine for olive industry wastes. Fuel Process. Technol. 2011, 92, 1970–1979. [Google Scholar] [CrossRef]
  29. Vera, D.; Juradoa, F.; de Menab, B.; Schoriesb, G. Comparison between externally fired gas turbine and gasifier-gas turbine system for the olive oil industry. Energy 2011, 36, 6720–6730. [Google Scholar] [CrossRef]
  30. Schmid, M. Dezentrale Stromerzeugung Mit Feststoffbiomasse; Ökozentrum Langenbruck: Langenbruck, Switzerland, 2007. [Google Scholar]
  31. Vidal, A.; Bruno, J.C.; Best, R.; Coronas, A. Performance characteristics and modelling of a micro gas turbine for their integration with thermally activated cooling technologies. Int. J. Energy Res. 2007, 31, 119–134. [Google Scholar] [CrossRef]
  32. Pilavachi, P.A. Mini- and micro-gas turbines for combined heat and power. Appl. Therm. Eng. 2002, 22, 2003–2014. [Google Scholar] [CrossRef]
  33. Do Nascimento, M.A.R.; de Oliveira Rodrigues, L.; dos Santos, E.C.; Gomes, E.E.B.; Dias, F.L.G.; Velásques, E.I.G.; Carrillo, R.A.M. Micro Gas Turbine Engine: A Review. In Progress in Gas Turbine Performance; Benini, E., Ed.; InTech: New York, NY, USA, 2013. [Google Scholar]
  34. Costamagna, P.; Magistri, L.; Massardo, A.F. Design and part-load performance of a hybrid system based on a solid oxide fuel cell reactor and a micro gas turbine. J. Power Sour. 2001, 96, 352–368. [Google Scholar] [CrossRef]
  35. Biomass Combustion Gas Turbine Chp. Available online: http://collection.europarchive.org/tna/20000607122935/http:/www.berr.gov.uk/files/file14922.pdf (accessed on 2 August 2016).
  36. Biomass Fuelled Indirect Fired Micro Turbine. Available online: http://ukerc.rl.ac.uk/pdf/DTI_BT1008090000_file14923.pdf (accessed on 2 August 2016).
  37. BM/367/92-BE Project. In A Fluidized Bed Air Biomass Gasification CHP Plant with An Externally Fired Evaporative Gas Turbine Cycle; Vrije Universiteit Brussel: Brussel, Belgium, 1992.
  38. Al-attab, K.A.; Zainal, Z.A. Performance of high-temperature heat exchangers in biomass fuel powered externally fired gas turbine systems. Renew. Energy 2010, 35, 913–920. [Google Scholar] [CrossRef]
  39. De Mello, P.E.B.; Monteiro, D.B. Thermodynamic study of an EFGT (externally fired gas turbine) cycle with one detailed model for the ceramic heat exchanger. Energy 2012, 45, 497–502. [Google Scholar] [CrossRef]
  40. Moran, M.J. Fundamentals of Engineering Thermodynamics, 7th ed.; Wiley: Hoboken, NJ, USA, 2011. [Google Scholar]
  41. Borgnakke, C. Fundamentals of Thermodynamics, 8th ed.; Wiley: Hoboken, NJ, USA, 2013. [Google Scholar]
  42. Aquaro, D.; Pieve, M. High temperature heat exchangers for power plants: Performance of advanced metallic recuperators. Appl. Therm. Eng. 2007, 27, 389–400. [Google Scholar] [CrossRef]
  43. Cordiner, S.; Mulone, V. Experimental—Numerical analysis of a biomass fueled microgeneration power-plant based on microturbine. Appl. Therm. Eng. 2014, 71, 905–912. [Google Scholar] [CrossRef]
  44. Ilett, T.; Lawn, C.J. Thermodynamic and economic analysis of advanced and externally fired gas turbine cycles. Proc. Inst. Mech. Eng. A J. Power Energy 2010, 224, 901–915. [Google Scholar] [CrossRef]
  45. Aspen Plus. Getting Started Modeling Processes with Solids. Available online: http://docs.chejunkie.com/wp-content/uploads/sites/2/2014/11/AspenPlusSolidsV8_4-Start.pdf (accessed on 18 April 2016).
  46. Korpela, S.A. Principles of Turbomachinery; Wiley: Hoboken, NJ, USA, 2011. [Google Scholar]
  47. Jenkins, B.M. A comment on the optimal sizing of a biomass utilization facility under constant and variable cost scaling. Biomass Bioenergy 1997, 13, 1–9. [Google Scholar] [CrossRef]
Figure 1. Schematic diagram for the externally fired gas turbine (EFGT) cycle.
Energies 09 00856 g001
Figure 2. Combustion model in Aspen plus.
Energies 09 00856 g002
Figure 3. Exhaust stream gases flow.
Energies 09 00856 g003
Figure 4. Compressor, turbine, and net output power as a function of pressure.
Energies 09 00856 g004
Figure 5. Compressor, turbine, and net output power as a function of turbine air mass flow.
Energies 09 00856 g005
Figure 6. Electrical efficiency and air-to-fuel ratio (AFR) with respect to the turbine inlet temperature at 100% of fuel consumption and 20 K heat exchanger temperature difference (HED).
Energies 09 00856 g006
Figure 7. Net output power variation with the turbine inlet temperature for four cases.
Energies 09 00856 g007
Figure 8. Pressure and air mass flow where the maximum mechanical output power could be achieved at (a) 20 and (b) 100 K HED for 50% and 100% of nominal power.
Energies 09 00856 g008aEnergies 09 00856 g008b
Figure 9. Electrical efficiency as a function of pressure at selected turbine inlet temperature (TIT) at 20 K HED.
Energies 09 00856 g009
Figure 10. Rotational speed with inlet temperature at 100% fuel feed and 20 K HED.
Energies 09 00856 g010
Figure 11. Back-work ratio (BWR) at different turbine inlet temperatures at 100% fuel feeding and 20 K HED.
Energies 09 00856 g011
Table 1. Typical chemical composition of olive waste [11].
Chemical ComponentSpanish Sample, [11]Jordanian Sample, Own Research
Proximate analysis (as received)
Fixed carbon (%, mass based)15.616.25
Volatile matter (%, mass based)67.572.2
Ash (%, mass based)7.74.98
Water content (%, mass based)8.96.55
Total (%, mass based)99.799.98
Ultimate analysis (dry, ash-free)
Carbon (%, mass based)52.752.5
Hydrogen (%, mass based)7.27.02
Oxygen (%, mass based)38.139.39
Nitrogen (%, mass based)1.60.86
Sulfur (%, mass based)0.070.23
Total (%, mass based)99.67100
Higher Heating value (HHV) (MJ/kg)19.921.66
Table 2. Overview on previous studies on biomass-fueled EFGT.
ReferenceTIT (K)Pressure RatioFuelPowerEfficiencyHEDRPM
Z. A. Zainal et al. [15] and original research is in [35,36]10734.5Biomass50 kWel15% elect.n.an.a
Z. A. Zainal et al. [15] and original research is in [37]1073n.aBiomass500 kWel14% elect.n.an.a
Traverso et al. [16]1023n.an.a15-50 kWeln.an.a68,000
Pantaleo et al. [21]1173 maxn.aBiomass66 kWel19% elect.n.an.a
Kautz and Hansen [22]11732–8Biomass (gasification)100 kWel16% and 30% with recuperator10–150n.a
Z. A. Zainal et al. [38]967n.aBiomass (gasifier)57 kWth transferred by the HEn.an.an.a
Cocco et al. [19]12233.5Biomass100 kWel22%–33% using drier50–200n.a
Vera et al. [29] 2–6Olive tree prunings and leaves30 kWel19.1% elect.50–200n.a
Detta et al. [17]1050–1350 K2–8Biomass (gasifier)100 kW16%–34% thermal200–300n.a
De Mello and Monterio [39]12234.5Biomass100 kWel20%–30% elect.n.an.a
Table 3. RYield reactor components yield values.
ComponentsYield (Mass %)
N20.00756945
O20.34847505
H2O0.0655
C0.4644465
S0.0020559
H20.06214425
Ash0.04980885
Total1
Table 4. Reference case simulation parameters.
General Parameters
Ambient temperature300 K
Operating pressure4 bar
Air10.017 kg/s (for reference case)
Thermal power input15 kW
Compressor isentropic efficiency0.78 (approximated from [22])
Turbine isentropic efficiency0.82 (approximated from [22])
Electrical generator efficiency0.90 [29]
Temperature of HE terminals diff. (HED)(20 K for reference case)
Table 5. Stream results.
Stream Name (see Figure 2)FuelStream HOStream CIStream CO
Total mass flow (kg/s)0.74331 × 10−30.0157060.01700.0170
Temperature (K)2984914901062
Pressure (bar)10.9999343.99995

