Article

Exergy and Thermoeconomic Analyses of Central Receiver Concentrated Solar Plants Using Air as Heat Transfer Fluid

1
CNR Institute of Environmental Geology and Geoengineering, c/o Department of Mechanical and Aerospace Engineering, “Sapienza” University of Rome, Rome 00184, Italy
2
Politecnico di Milano, Milan 20156, Italy
*
Author to whom correspondence should be addressed.
Energies 2016, 9(11), 885; https://doi.org/10.3390/en9110885
Submission received: 28 June 2016 / Revised: 19 October 2016 / Accepted: 24 October 2016 / Published: 28 October 2016
(This article belongs to the Special Issue Exergy Analysis of Energy Systems)

Abstract

:
The latest developments in solar technologies demonstrated that the solar central receiver configuration is the most promising application among concentrated solar power (CSP) plants. In CSPs solar-heated air can be used as the working fluid in a Brayton thermal cycle and as the heat transfer fluid for a Rankine thermal cycle as an alternative to more traditional working fluids thereby reducing maintenance operations and providing the power section with a higher degree of flexibility To supply thermal needs when the solar source is unavailable, an auxiliary burner is requested. This configuration is adopted in the Julich CSP (J-CSP) plant, operating in Germany and characterized by a nominal power of 1.5 MW, the heat transfer fluid (HTF) is air which is heated in the solar tower and used to produce steam for the bottoming Rankine cycle. In this paper, the J-CSP plant with thermal energy storage has been compared with a hybrid CSP plant (H-CSP) using air as the working fluid. Thermodynamic and economic performances of all the simulated plants have been evaluated by applying both exergy analysis and thermoeconomic analysis (TA) to determine the yearly average operation at nominal conditions. The exergy destructions and structure as well as the exergoeconomic costs of products have been derived for all the components of the plants. Based on the obtained results, the thermoeconomic design evaluation and optimization of the plants has been performed, allowing for improvement of the thermodynamic and economic efficiency of the systems as well as decreasing the exergy and exergoeconomic cost of their products.

Graphical Abstract

1. Introduction

1.1. Concentrated Solar Power Technology

The second half of the 20th century underwent a rapid and worldwide increase of atmospheric pollution levels, which has forced many countries to invest in eco-friendly energy conversion processes. This motivation lies behind the development and industrialization of several low-pollution novel technologies. Solar energy is an unlimited, clean, and safe source of energy, therefore, it is one of the most promising candidates to displace non-renewable fossil energy [1]. Concentrated solar power (CSP) technology is recognized by the literature as one possible candidate for electricity generation [2].
The most popular optical reflecting surfaces for CSP applications are parabolic troughs [3], dish concentrators [4], linear Fresnel reflectors [5,6], and solar central receivers [7]. Each of these configurations requires a specific type of solar receiver.
Central receiver solar power plants can play an important role in the future of concentrating solar power [8,9]. A central receiver CSP plant is composed by a high-temperature solar receiver placed atop of a central tower and a field of heliostats which concentrates the direct solar irradiation on the receiver. In the receiver the heat transfer medium absorbs (by convection/radiation effects) the reflected and focused solar power, and the heat is made available for a downstream power thermal cycle which is usually, a Rankine plant. Current solar towers use water/steam, air, or molten salt to transport the heat to the heat-exchanger/steam turbine (ST) system. Depending on the receiver design and the working fluid, the upper working temperatures will range from 250 °C to 1000 °C for future plants, although temperatures of around 600 °C will be the norm with current molten salt designs. The main advantages of solar central receiver plants are related to the higher temperatures that can potentially allow greater efficiency of the steam cycle and reduce water consumption for cooling the condenser. The higher temperature also makes the use of thermal energy storage more attractive in order to schedule the electric generation and will also allow greater temperature differentials in the storage system, thereby reducing costs or allowing for greater storage for the same economic cost.
Energy analysis and performance evaluations of solar central receiver thermal power systems and components can be found in the literature [10,11,12,13,14]. Based on simple energy balances, Yao et al. [10] developed basic models for the main components of a central receiver CSP plant located in China with the objective of predicting the transient behavior of the thermodynamic variables associated to the external disturbances and the change in operational inputs. In [12], the thermodynamic and economic performances of an integrated solar combined cycle system (ISCCS) driven by a solar tower were investigated. They identified the great integration potential of the ISCCS from a thermodynamic and economic perspective and they also pointed out the following areas that need additional research attention: the investigation of the effect of tower height on the levelized cost of electricity (LCoE) of ST-ISCCS, the effect of ST-ISCCS on the ambient air around the plant, and the techno-economic evaluation of the ST-ISCCS in operation. The energy and exergy analysis of a solar tower power plant using molten salt as the heat transfer fluid (HTF) was developed in [15]. The energy and exergy losses in each component and in the overall power plant have been evaluated to identify the causes and locations of the exergy losses in the solar tower power plant. The thermodynamic and economic performance of a combined-cycle solar tower power plant with thermal energy storage for a variety of operating conditions and superstructure layouts are presented in [16]. They concluded that, when properly designed, solar thermal power plants based on combined-cycles are both economically and thermodynamically promising, with levelized energy costs competitive with those for other solar thermal power plant configurations.
The above literature review indicates that a comprehensive analysis of both resources consumption and costing structure of a central receiver CSP has not been reported till now. Thus, the present study proposes a possible benchmark as an exergy based method for future analysis about the thermodynamic and economic performances of alternative CSP plant configurations.

1.2. Aim of the Work

In this paper, thermodynamic and economic performances of two alternative CSP power plants are comparatively assessed and improved by means of exergy-based methods. More specifically, exergy cost analysis and exergoeconomic cost analysis are here adopted to analyze two different central receiver CSP plants using air as the main medium fluid: the Julich plant with thermal energy storage (J-CSP) [17] and a hybrid central receiver plant with an auxiliary burner (H-CSP). Off-design performances of the two plants have been assessed by modelling their operative phase for a typical year of operation, thus considering seasonal changes in solar radiation and off-design changes in thermodynamic performances of the plants. Moreover, average plant performances have been quantified assuming the same amount of yearly electricity production. The obtained structures of exergy and exergoeconomic costs of products for the two analyzed systems are finally compared with the results of the same analyses applied to a conventional natural gas combined cycle power plant (CCPP), here adopted as a benchmark. Finally, the thermoeconomic design evaluation and optimization of the plants was performed [18], leading to a change in operative design parameters of the systems that allows for the reduction in both the exergy and the exergoeconomic costs of products.
The rest of the article is arranged as follows: Section 2 describes the layout of each plant configuration introducing the main design data and the adopted assumptions; in Section 3 an exergy analysis is performed; in Section 4 the exergy and exergoeconomic cost analyses are applied, and the results of the thermoeconomic design evaluation and optimization are finally presented and discussed.

2. Plant Layouts, Simulations, and Economic Analysis

In this section, the layout of each analyzed plant configuration is presented together with their main data, operative parameters, and specifications: solar power tower Julich (J-CSP); hybrid concentrated solar power plant (H-CSP); conventional CCPP.
Both the J-CSP and the H-CSP configurations here analyzed are based on a solar central receiver installed upon a central tower where sunrays are reflected. The design of the receiver depends on the heat transfer medium and on the maximum allowable external surface temperature. The heat transfer medium flows through the receiver and absorbs the irradiation power; its sensible heat can then be used either to energize the working fluid in the power cycle via a secondary heat exchanger medium or directly exploited in the power cycle. Molten salt or water are generally used as heat transfer media; both can be stored in thermal energy storage tanks to buffer the daily solar energy variations. Molten salts have some disadvantages though: they need a secondary heat exchanger, have a minimum working temperature (250–280 °C), and must be evacuated from pipes, tanks or receivers before maintenance operations. Unlike molten salts, water can be directly heated in the receiver to superheated steam without using another medium, which reduces installation and maintenance costs. Air can be used as medium as well, since it presents several advantages: it is free, abundant, and it is not a polluting substance. Moreover, unlike molten salt, it remains in a gaseous state at atmospheric conditions. On the other hand, in this case, an auxiliary burner is needed to extend the operation during off-sunshine hours. 
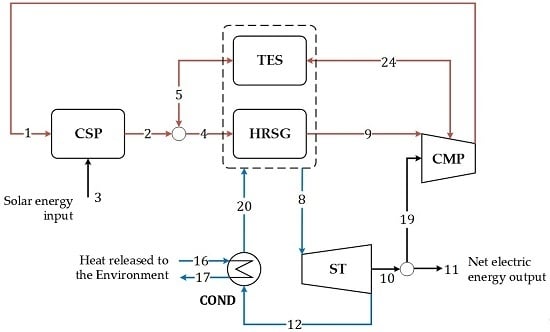
Figure 1 shows the working principle of a CSP steam plant.
The electric nominal power output has been set to 1.5 MW for all the plants. Technical specifications of the simulated J-CSP plant are shown in Table 1. A latitude of 31° north (northern African countries) has been conventionally chosen for all the simulations. The climate data, such as the global irradiance (kW/m2), daylight hours, and ambient temperature for the selected area have been obtained from the National Aeronautics and Space Administration (NASA) database [19].
All the simulations of the power plants were performed using the CAMEL-Pro™ (Calculation with Modular Elements) process simulator [20]. This software has been developed at the Department of Mechanical and Aerospace Engineering of the University of Roma Sapienza. The modularity of CAMEL enables users to expand the code by adding new components or by modifying the model of the existing ones. The code has been developed for the simulation of energy conversion systems, and in particular, thermal power plants. CAMEL-Pro™ is equipped with a library of thermodynamic properties for the calculation of thermo-physical properties of fluids [21]. Models for the calculation of thermodynamic and transport properties of steam and organic fluids are implemented according to literature [21]. CAMEL has proved itself as a useful tool for analyzing both new and existing plants, and to support the design of new plants [22,23,24,25].

2.1. Solar Power Tower Julich

This layout is under investigation by the German Aerospace Centre (Deutsches Zentrum für Luft- und Raumfahrt—DLR) and no commercial plant uses this kind of process yet. The J-CSP [17] is a high temperature central receiver plant where the primary cycle working fluid is air at atmospheric pressure that is heated up to temperatures of about 700 °C. The solar heat then feeds a steam generator, producing steam at 7 bars and 650 °C and driving a 1.5 MWel turbine-generator set. Thermal energy storage (TES) is integrated into the power cycle to ensure longer availability of energy production beyond daylight hours. It consists of a vessel filled with porous ceramic bricks. To charge the storage, the hot air passes through the vessel from top to bottom and heats up the storage material; while to discharge the storage, cold air from the steam generator is circulated in reverse flow from bottom to top through the storage vessel and back to the steam generator. According to literature [26], the installed TES reaches 2.4 MWth (air temp 680–640 °C) during charge and 2.2 MWth during discharge (air temp 680 °C) within 1.5 h.
The simulated layout of the Julich plant is presented in Figure 1. Air (Stream #1) flows into the CSP plant (in a volumetric central receiver) and it is heated by absorbing solar energy. This air flow is then used to produce steam (Stream #8) in the heat recovery steam generator (HRSG). The produced steam is then expanded into a ST, producing electric energy (Stream #11).
During the operation of the plant, a portion of the heated air (Stream #5 at 680 °C) charges the TES by flowing through it. After the HRSG, the air is passed through two compressors (CMPs) to increase the air pressure. In the absence of sunlight, the CSP is excluded from the process, and the air flows from the hot side of the TES (Stream #5) to the cold side (Stream #24, 4 kg/s at 120 °C), passing through the HRSG. The charge/discharge of the TES takes about 1.5 h. Detailed specifications of the Julich plant are resumed in Table 1 and are available in technical literature [27].
Thermo-physical properties of all the material and energy flows within the J-CSP plant have been calculated for the average monthly values of solar radiation. As expected, the operation of the J-CSP is fully dependent on solar radiation: for the analyzed case study, it produces a net amount of electricity of 8834 MWh/year, working at nominal conditions for about 5889 h/year.

2.2. Hybrid Concentrated Solar Power Plant (H-CSP)

As explained in the previous paragraph, in the J-CSP plant a TES system has been installed to ensure longer availability of the production. In order to make the CSP plant more flexible, a second option is to replace the TES with a gas burner which guarantees the power requirement during night hours and completes the air heating when the solar irradiation is lower. This solution guarantees a continuous operation of the plant.
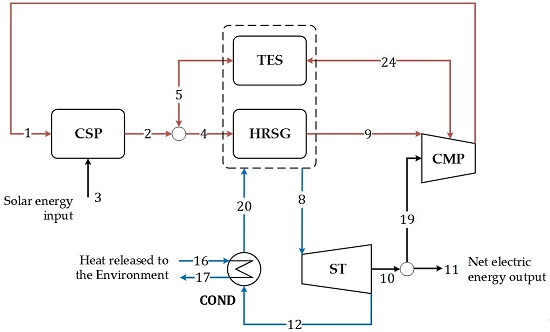
The simulated layout of this second configuration, named H-CSP, is reported in Figure 2. The air flow (Stream #1) is compressed to face pressure drops and then is heated by both the CSP plant and the combustion chamber (CC), reaching a temperature of about 600 °C (Stream #25). The air then feeds a steam generator, producing steam at 7 bars and 675 °C (Stream #6) and drives a 1.5 MWel turbine. During night hours, the fuel (Stream #19) in the auxiliary burner guarantee the electric production (fixed to 1.5 MWel). The H-CSP plant and the CC work complementarily: during night hours, the CSP is turned off and air heating is obtained by the CC, while during summer days, when the solar irradiation is higher, the air is fully heated by the CSP and the CC is turned off. Technical specifications of the simulated H-CSP plant are shown in Table 2. The heliostat field has been sized by requiring that in the sunniest month (August) the plant was exclusively driven by solar energy, that is, the degree of hybridization is equal to zero.
Thermo-physical properties of all the material and energy flows within the H-CSP have been calculated for all the average monthly values of solar radiation. Solar and fossil fuel inputs in percentage for all the months of the year have been calculated as well; the H-CSP plant has a hybridization degree that spans from a minimum value of 0 in August and September, to a maximum value of 18% in December.

2.3. Conventional Combined Cycle Power Plant

A conventional CCPP is here adopted as a benchmark to compare thermodynamic and economic performances of J-CSP and H-CSP. The layout of the simulated CCPP is presented in Figure 3. This plant is composed of a gas turbine (GT), a CMP, an HRSG, a ST, and a water-cooled surface condenser. The net electric total power output is 1.5 MW: 0.5 MW are produced by the ST and 1 MW by the GT. Technical specifications of the simulated combined plant are shown in Table 3.

2.4. Investment and Operative Economic Costs of the Plants

The estimation of the investment costs in plants has been performed as a fundamental prerequisite for the exergoeconomic cost analysis. Based on the work of Augsburger [28], direct and indirect costs related to the heliostats field; the solar tower and receiver; and the power conversion unit have been calculated for the J-CSP and the H-CSP. The investment costs of the heliostat field include the land costs and the heliostat costs. The land costs are divided into the investment cost of purchasing the terrain and the cost of land improvements such as levelling, roads, and civil works in general. The direct heliostat costs include the parts and materials such as the support structure, the drives and the mirrors, and take the labor costs into account, such as the shop fabrication and the installation. The investment cost of the solar tower depends on its height, but also on the type of structure it features, be it steel lattice or concrete. For the receiver, the investment cost directly depends on its area as well as on the selected technology (i.e., materials and HTF).
The obtained results are presented in Table 4, which also includes the investment cost for CCPP [29]. As a result, the investment cost of the heliostat field accounts for the highest share, with 7.70 M$ for the J-CSP and 6.19 M$ for the H-CSP, exceeding about 25% of the total cost of investment (TCI) for both. Average European natural gas price has been assumed here as the reference [30]:
Z i n v = T C I c r f Z i n v = T C I [ i ( 1 + i ) n ( 1 + i ) n 1 ]
Once the TCI (including operating and management costs) has been evaluated for all the considered systems, the annual levelized cost is calculated through the capital recovery factor (CRF) method in Equation (1), based on an estimated plant lifetime n of 20 years and on an interest rate of capitals i of 5%, equal for all the analyzed plants. The results of the economic analysis collected in Table 4 are in line with the analyzed literature, confirming that the majority of the capital costs of the CSP plants resides in the purchase and installation of the solar tower, receiver, heliostat field, and storage system.
Notice that the cost of investment for many components has been derived as functions of the main design parameters [29] allowing us to derive, in a simple but approximated way, the sensibility of investment costs to changes in system design.

3. Exergy Analysis

Exergy analysis of the three simulated power plants has been performed considering their yearly average operating conditions. In order to perform a fair comparison among such different systems, the average operative conditions have been considered for the CSP plants, while the nominal load conditions have been selected for the CCPP.
The application of exergy analysis at the highest aggregation level allows for the evaluation of the overall performance of the analyzed systems. It basically consists in the application of the exergy balance Error! to each plant, enclosing all their components in one unique control volume. Elements of the exergy balance represent the non-renewable (NR) and renewable (R) inlet contributions (F), products (P), losses (L), and exergy destructions (D):
E x F , N R , i + E x F , R , i = E x P , i + E x L , i + E x D , i η e x = E x P , i E x F , N R , i + E x F , R , i   ;   c e x = 1 η e x
The exergy equivalents of fuel, losses, and destructions have been derived and reported in Table 5, as well as their average yearly exergy efficiencies ηex and the average yearly specific exergy cost of products cex. Notice that the Szargut et al. [31] environment has been assumed as the reference to account for exergy equivalents of material and energy interactions. As can be inferred from the results in Table 5, the thermodynamic efficiency of the CCPP plant is greater than that of the CSP plants. Based on the performed plant simulations, the yearly average exergy efficiency of the plants results are 22% for the J-CSP, 21% for the H-CSP, and 47% for the CCPP.
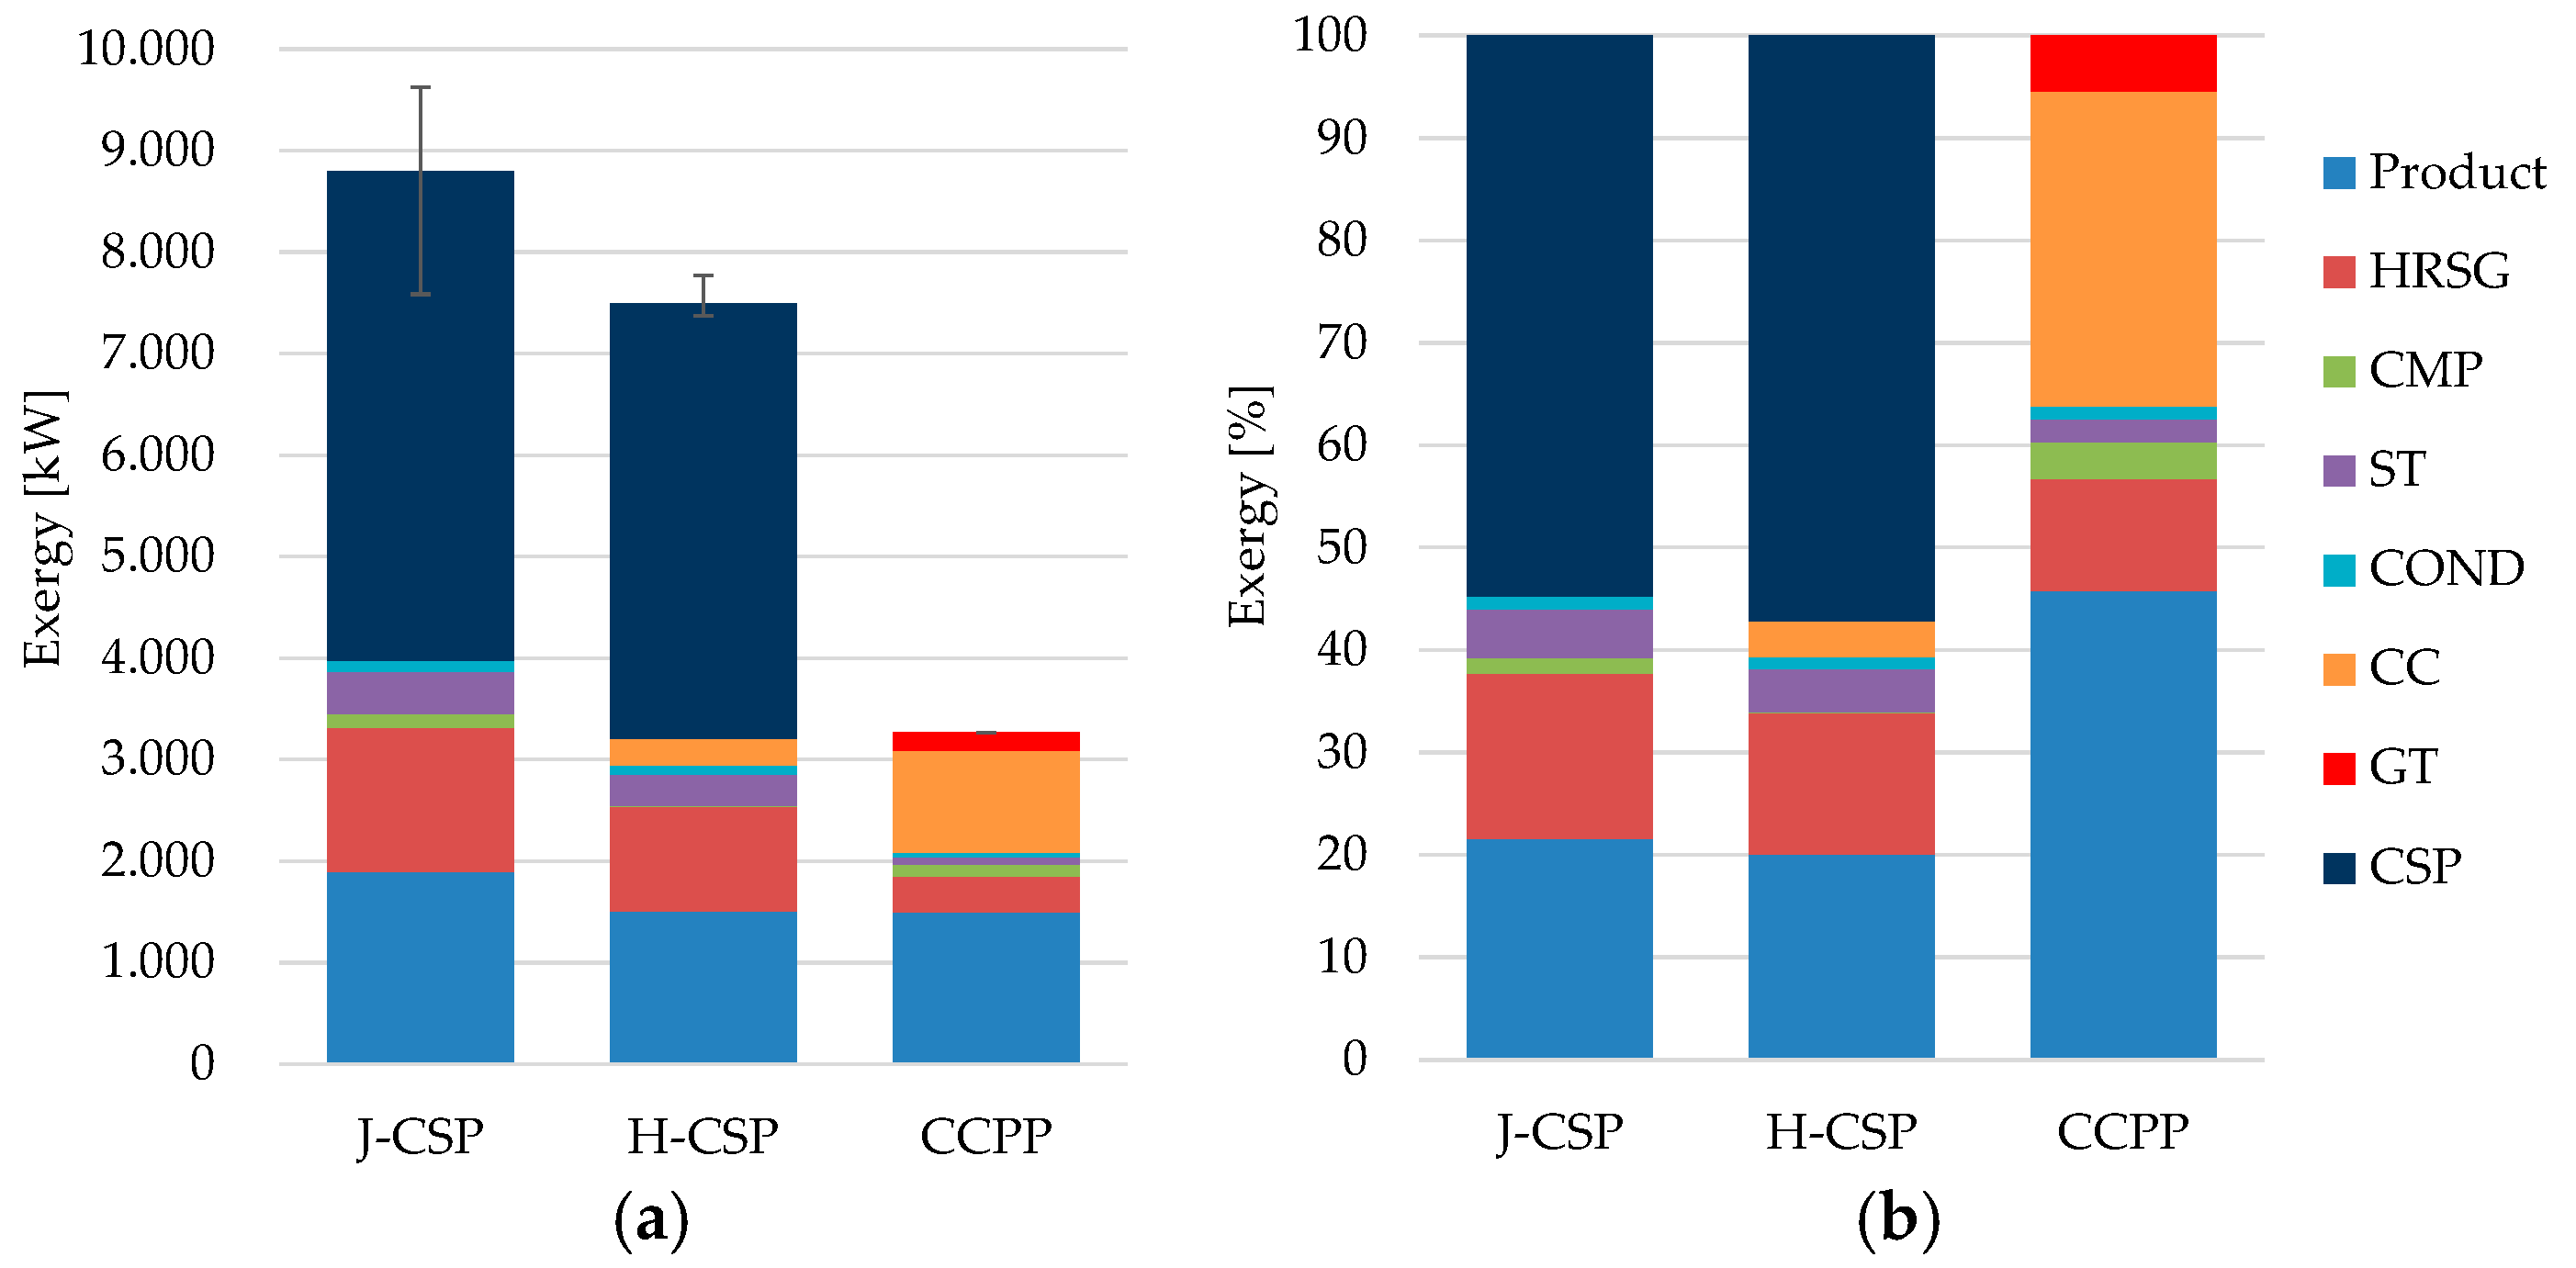
To better understand the sources and the magnitude of the thermodynamic inefficiencies of each plant, a more detailed application of exergy analysis is required. Exergy destructions of all the plant components have been evaluated and collected in the bar graphs of Figure 4: the first category in the bottom (in light blue) represents the electricity production of each system, while other categories represent the exergy destructions that occur in all the components of the plants. Therefore, the sum of products and exergy destructions are equal to the total exergy required by each plant. The largest exergy destructions of the J-CSP and the H-CSP occurs in the CSP which is composed by the solar tower, the receiver, and the heliostats field. Such irreversibilities represent more than 50% of the total irreversibilities caused by the operation of the plants. For the same plants, the HRSG and the ST are the other relevant sources of irreversibilities, accounting for more than 30% of the total exergy destructions. In the H-CSP, the irreversibilities produced by the CC and the ST have the same numerical relevance. Notice that the total values for the J-CSP and H-CSP are enclosed within maximum and minimum values, depending on the seasonal variations of the solar radiation.
The total exergy consumption of the CCPP is about one half of the exergy destructions of the other two systems. As expected, the irreversibilities of the CCPP are mainly caused by the CC, followed by the HRSG, and the GT. Even if the CSP (solar tower, receiver, and heliostats field) turns out to be the most critical component in terms of exergy destruction, it should be considered that its exergy input is derived solely from a renewable source and, thus, it does not affect the consumption of the primary non-renewable resources (i.e., fossil fuels).

3.1. Thermoeconomic Analysis

According to the literature, thermoeconomic analysis (TA) can be defined as the joint application of exergy analysis as economic principles [32,33,34,35]. TA can be adopted to account for different types of costs and to allocate such costs among multiple products according to a consistent thermodynamic basis. Beside cost accounting and cost allocation purposes, one of the main goals of thermoeconomics is the evaluation of the cost structure of the system products by understanding the cost formation process and thus introducing criteria and indicators for system design evaluation and optimization [36,37]. More specifically, the cost structure of system products allows for the understanding and quantification of the role that thermodynamic irreversibilities have in generating such costs [25,38,39].
TA has been developed in the literature in two main ways: the exergy cost analysis and the exergoeconomic cost analysis. These methods are distinguished based on the kind of cost to be accounted for, respectively, exergy or monetary ones. The exergy cost analysis, introduced by Valero through the exergy cost theory (ECT) [40], accounts for the costs of products as the amount of exergy required by the system to produce such products (cex, measured in J/J) [34,41]; on the other hand, the exergoeconomic cost analysis accounts for the economic cost of the system products (ceco, measured in $/J) [42,43].
Let us consider an energy conversion system formed by n components, connected to each other and with the environment by a number, l, of energy and bulk flow interactions. Application of exergy and exergoeconomic cost analyses to such a system requires the definition of n system of equations, as in Equation (3), composed by the exergy balance, the cost balance and by a number n–l auxiliary relations:
exergy cost : { E x F = E x P + E x L + E x D C e x , F = C e x , P + C e x , L C e x , j = c e x , j E x j ; exergoeconomic cost : { E x F = E x P + E x L + E x D C e c o , F + Z i n v = C e c o , P + C e c o , L C e c o , j = c e c o , j E x j
For all the n components, exergy and cost balances are written according to the fuel-product-loss (FPL) criterion; this lead to the definition of the so-called functional diagram, an essential representation of the exergy flows of the system useful to describe the function of its components. With reference to Equation (4), thanks to the exergy costing principle, all the exergy/economic cost balances can be rewritten as a function of the exergy of each inlet and outlet flow of the analyzed component and its specific cost per unit of exergy (notice that the cost of loss flows disappears because of the implicit assumption that the cost is not allocated to loss flows, that is, cL = 0):
exergy cost : { c e x , F E x F = c e x , P E x P + c e x , L E x L c e x , P = c e x , F + c e x , F E x L + E x D E x P ; exergoeconomic cost : { c e c o , F E x F + Z i n v = c e c o , P E x P + c e c o , L E x L c e c o , P = c e c o , F + c e c o , F E x L + E x D E x P + Z i n v E x P
Values of specific costs of products and their structure are finally derived. The unit exergy/economic cost of each product is the sum of the costs of fuel, destructions and losses, and component investment (the latter appears only for the exergoeconomic cost analysis).
To evaluate the thermodynamic/economic performances of each component within the analyzed system, the essential parameters are the exergy/economic cost of irreversibilities and the relative exergy/economic cost difference, as defined by Equation (5). The thermodynamic and economic improvement of the system should be focused on the components with the highest values of such indicators:
exergy cost : { E x e x , D L = c e x , F E x L + E x D E x P r e x = c e x , P c e x , F c e x , F ; exergoeconomic cost : { E x e c o , D L = c e c o , F E x L + E x D E x P r e c o = c e c o , P c e c o , F c e c o , F
More details about the use of FPL criterion, the definition of cost balances, and the closure of the thermoeconomic problem through an appropriate definition of auxiliary relations are available in the literature [35,44].

3.2. Exergy and Exergoeconomic Cost Analyses of the Power Plants

In this section, exergy and exergoeconomic cost analyses are applied to the simulated power plants at the lowest aggregation level, which reflects more information of cost formation with high accuracy. The functional diagrams of each plant have been derived and are depicted in Figure 5: components are represented by the squares; black arrows represent endogenous flows of exergy that connect all the components and exergy flows of losses discharged into the environment; while red and blue arrows represent the exergy flows of fuel and products of the system, respectively.
Based on the functional diagram of Figure 5, the thermoeconomic system of equations can be defined for each of the following analyzed components: unit exergy/exergoeconomic costs of each exergy flow and structures of such costs and thermoeconomic performance indicators. The most relevant numerical results are shown in Figure 6 and Figure 7, considering only the most relevant component. Detailed numerical results are reported in Table A1 and Table A2 (Appendix A). Notice that in the functional diagrams the junctions (J) are fictitious components that are essential to establish structural equations to form a part of exergy/exergoeconomic cost models. Junctions are represented by straight lines, and they are required in case products of multiple components are used as fuels of other components.
Results of the exergy cost analysis are reported in Figure 6; exergy destructions and exergy costs of irreversibilities are graphed for the most relevant components considering their yearly average nominal operating conditions. Error bars have been reported for the J-CSP and the H-CSP in order to account for the seasonal variations of the operative conditions. As expected, large errors result for the CSP units, since they are directly affected by the monthly changes in solar radiation.
As can be inferred from the graphs, results of CCPP are always lower compared with the J-CSP and H-CSP. Absolute values of irreversibilities of the CCPP are relevant only for the CC, since the other components are one order of magnitude lower, and the same trend holds for the exergy cost of irreversibilities. Regarding the solar plants, large amounts of irreversibilities occur in the CSP unit, followed by the HRSG and the ST. Notice that the costs of exergy destructions in the CSP and in the CC are numerically equal to the exergy destructions, since the components receive exergy directly from the environment. On the other hand, the exergy costs of irreversibilities in the other components are greater than their exergy destructions; therefore, according to the defined thermoeconomic models, the effects of the reduction of a unit of irreversibilities in such components return a larger thermodynamic benefit in the whole plant. In this perspective, the HRSG is the most relevant component for J-CSP and H-CSP, since the reduction of 1 Joule of thermodynamic irreversibilities would result in very high reduction of the fuel absorbed from the environment (respectively, about 2.4 and 4.3 Joules). The same trend holds for the ST and for the CMP. According to the thermoeconomic models, to enhance the thermodynamic performance of the solar plants, it is necessary to focus on the HRSG and on the ST, rather than on the CSP units.
Results of the exergoeconomic cost analysis have been represented in Figure 7. Economic costs due to irreversibilities, economic costs of investment, and relative cost differences are graphed for the most relevant components of each plant. Considering the CCPP, the highest increase of the cost of the product is mainly caused by the irreversibilities of the CC. The most effective way to enhance the economic efficiency of the plant seems to be by increasing the thermodynamic efficiency of the CC, HRSG, and ST, which result in the highest values of relative cost differences.
The formation of the economic cost of the solar plants products is mainly caused by the investment costs of the CSP, followed by the thermodynamic irreversibilities occurring in the HRSG and in the ST. Relative cost differences for the CSP components are equal to 1; however, this value has no practical meaning, since the fuel of the plant is solar radiation provided at zero cost. Both the economic cost of irreversibilities and the relative cost difference is higher for the HRSG with respect to the ST.
Based on such considerations, the most effective ways to increase the thermodynamic and the economic efficiencies of the analyzed solar plants seems to be by decreasing the investment cost of the CSP unit, while increasing the thermodynamic efficiencies of HRSG and ST. Other components of the solar plants are not relevant in a thermodynamic and economic perspective.

3.3. Design Evaluation and Optimization of the Analyzed Systems

Results provided by the TA allow for the optimization of the selected systems in terms of exergy and exergoeconomic costs.
For the J-CSP and the H-CSP, as highlighted in Figure 6 and Figure 7, the HRSG presents a high Cex_D which means that an improvement of its efficiency allows for a substantial reduction of its impact on the exergy cost of the final products. Moreover, as shown in Figure 7, the Cex_D is responsible for about 85% of the total economic cost of the HRSG. The improvement of the HRSG efficiency has been obtained reducing the temperature difference between the hot and cold side, while increasing the maximum cycle pressure. The new values of average exergy efficiencies of the optimized J-CSP and H-CSP are 24% (+2%) and 23% (+2%), respectively. For the CCPP, the optimization has been obtained as well by increasing the compressor ratio and the bottoming Rankine cycle maximum temperature and pressure, leading to a new value of exergy efficiency equal to 48% (+1%).
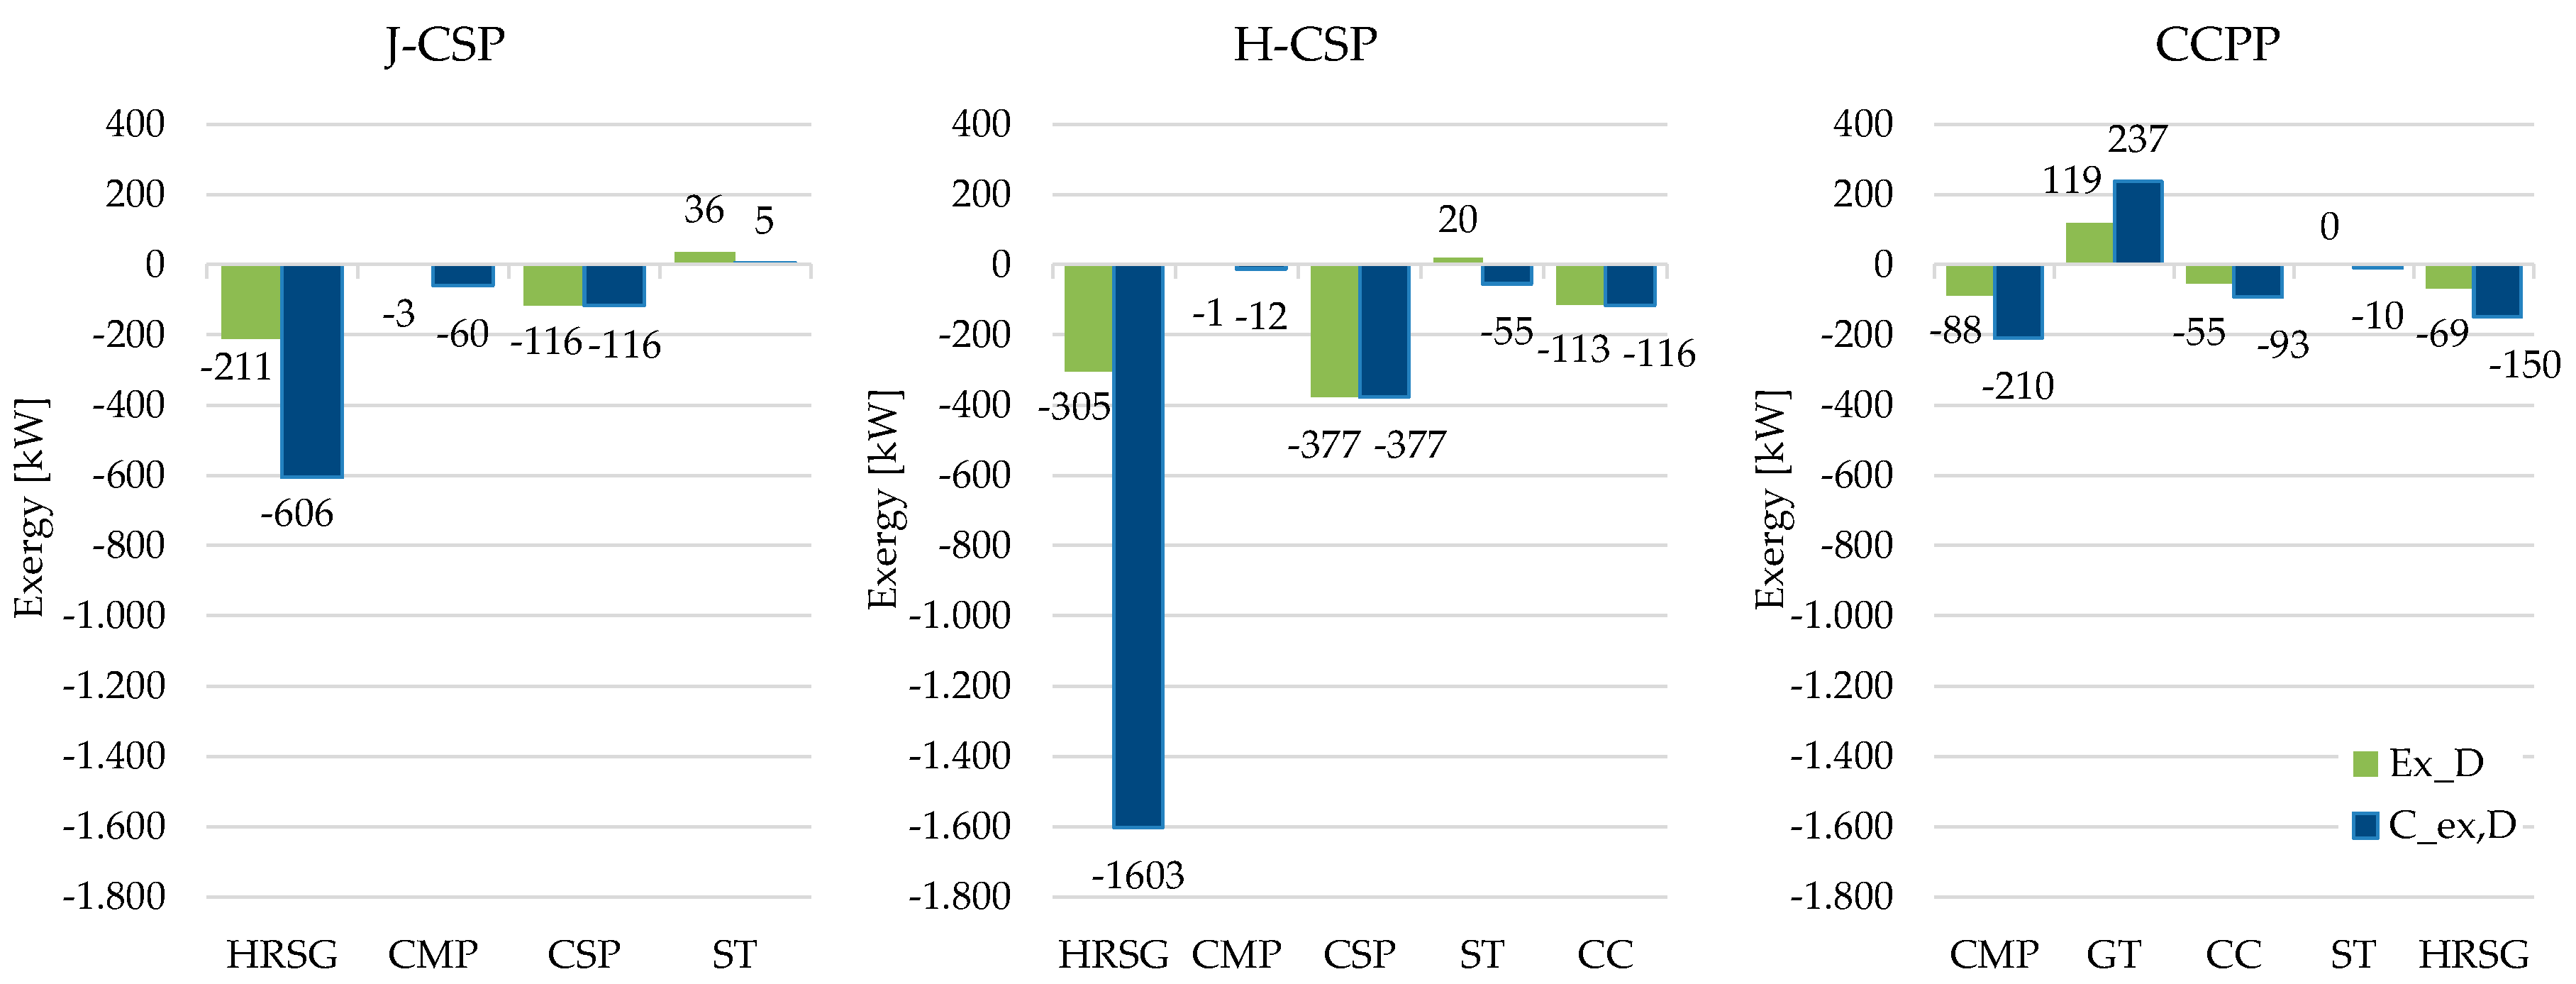
The new HRSG operative parameters affect all the other system components. Figure 8 collects the differences of exergy destructions (green bars) and exergy cost of exergy destructions (blue bars) between the improved and the original plant layouts. In a similar fashion, Figure 9 depicts the difference of exergoeconomic cost of exergy destructions for the same layouts. The results of the two figures present the same trends, revealing that the actions undertaken to improve all the plant configurations provide benefits from both the thermodynamic and the economic standpoint. In particular, larger benefits are obtained in the HRSG and in the CSP. The improvement of the HRSG operative conditions allows for the reduction in the CSP heliostatic field magnitude and a decrease in the flow rate in the turbine whose positive effects are balanced out by the increase of the pressure difference between inlet and outlet.
As can be inferred from Figure 10, the specific exergy and exergoeconomic costs of system products have been slightly reduced in the improved plant configurations.

4. Conclusions

In this paper, two alternative configurations of CSP plants have been modelled and analyzed through exergy and thermoeconomic analyses. J-CSP plant with thermal energy storage has been simulated and compared with a H-CSP plant using air as the working fluid. The two configurations have been compared with a conventional CCPP in order to quantify benefits and drawbacks of CSP technology in terms of thermodynamic and economic performances. Exergy and exergoeconomic cost analyses have been performed for all the simulated plants at the lowest level of aggregation, considering the average year of nominal operation and the same electricity produced by all the technologies.
Results of the exergy analysis reveals that from a purely thermodynamic perspective, the J-CSP plant is the least efficient solution, followed by the H-CSP, and the CCPP. However, it should be noted that the J-CSP and H-CSP provide the largest environmental benefits compared to the CCPP in the terms of fossil energy displacement. More specifically, the highest values of irreversibilities are caused by the solar towers, receivers and heliostats fields, followed by the HRSG. On the other hand, exergoeconomic cost analysis reveals that the CCPP plant is the least expensive solution, followed by J-CSP, and the H-CSP. This is mainly due to the increase in investment costs that are not compensated for by the benefits due to the consumption of a renewable resource with no economic cost.
Results of the detailed thermoeconomic analyses applied to the three analyzed plants at lower levels of aggregation allow for the determination of the exergy and exergoeconomic cost structure of the products of plant components, thereby quantifying the role of investment cost and irreversibilities in generating the cost of system products. Finally, improved plant configurations have been proposed and analyzed based on the results of the thermoeconomic analyses, leading to a slight reduction in both exergy and exergoeconomic costs of system products.

Nomenclature

cSpecific exergy/exergoeconomic cost (J/J-$/kWh)
CTotal exergy/exergoeconomic cost (kW-$/h)
CCCombustion chamber
CCPPNatural gas combined cycle power plant
CMPCompressor
CSPConcentrated solar power
ECTExergy cost theory
ExExergy (kWh, J)
GTGas turbine
H-CSPHybrid central receiver plant with an auxiliary burner
HRSGHeat recovery steam generator
ISCCSIntegrated solar combined cycle system
JJunction
J-CSPJulich plant with thermal energy storage
LCoELevelized cost of electricity
O&MOperating and maintenance
PPressure
pPressure (bar)
rRelative cost difference
STSteam turbine
TTemperature
TITTurbine inlet temperature (K)
TCITotal cost of investment ($)
TESThermal energy storage
ZInvestment cost ($)

Subscripts

DDestruction
ecoEconomic
ExExergy
FFuel
invInvestment
LLoss
NRNon-renewable
PProduct
RResource/Renewable

Appendix A

Table A1. Results of the exergy cost analysis at the lower aggregation level for the initial and the optimized plant configurations. (Only results for relevant components have been reported, considering the average yearly operative conditions).
PlantInitial ConfigurationImproved ConfigurationDifferences
J-CSPExDCex.DExDCex.DΔExDΔCex.D
kWkWkWkWkWkW
HRSG1414.93381.81203.52775.5−211.4−606.3
CMP136.6635.4133.8575.3−2.8−60.1
CSP4814.94814.94699.24699.2−115.7−115.7
ST415.11611.4451.41616.936.35.5
COND112.30.0107.10.0−5.20.0
H-CSPExDCex.DExDCex.DΔExDΔCex.D
kWkWkWkWkWkW
HRSG1034.14417.4729.02813.9−305.1−1603.4
CMP12.262.210.749.9−1.5−12.3
CSP4286.24286.23909.53909.5−376.7−376.7
ST312.01332.7331.81277.819.8−55.0
CC262.7261.5149.3145.7−113.4−115.8
COND85.20.075.80.0−9.40.0
CCPPExDCex.DExDCex.DΔExDΔCex.D
kWkWkWkWkWkW
CMP117.5271.829.562.1−88.0−209.7
GT177.0373.3296.5610.6119.5237.3
CC1006.21464.4951.11371.6−55.1−92.8
ST72.3163.472.7153.80.4−9.6
HRSG186.9366.6118.2217.1−68.7−149.5
COND42.30.076.40.034.20.0
Table A2. Results of the exergoeconomic cost analysis at the lower aggregation level for the initial and the optimized plants configurations. (Only results for relevant components have been reported, considering the average yearly operative conditions).
PlantInitial ConfigurationImproved ConfigurationDifferences
J-CSPZinvCeco.DZinvCeco.DΔZinvΔCeco.D
$/h$/h$/h$/h$/h$/h
HRSG12.33381.811.479.1−0.9−3302.7
CMP0.0635.40.019.50.0−615.9
CSP247.24814.9229.20.0−18.0−4814.9
ST24.91611.424.950.40.1−1561.0
COND12.40.012.50.00.00.0
H-CSPZinvCeco.DZinvCeco.DΔZinvΔCeco.D
$/h$/h$/h$/h$/h$/h
HRSG10.6139.69.485.0−1.3−54.6
CMP0.02.10.01.60.0−0.5
CSP195.60.0177.00.0−18.60.0
ST18.042.116.738.5−1.3−3.6
CC1.810.51.55.8−0.3−4.6
COND9.00.08.30.0−0.70.0
CCPPZinvCeco.DZinvCeco.DΔZinvΔCeco.D
$/h$/h$/h$/h$/h$/h
CMP6.112.77.93.01.7−9.8
GT4.716.74.827.70.211.0
CC0.858.90.855.2−0.1−3.8
ST5.78.05.37.6−0.4−0.4
HRSG0.320.30.311.30.0−9.0
COND2.90.02.70.0−0.20.0

References

  1. Giampietro, M.; Martin, J.R.; Ulgiati, S. Can we break the addiction to fossil energy? Energy 2012, 37, 2–4. [Google Scholar] [CrossRef]
  2. Viebahn, P.; Lechon, Y.; Trieb, F. The potential role of concentrated solar power (CSP) in Africa and Europe—A dynamic assessment of technology development, cost development and life cycle inventories until 2050. Energy Policy 2011, 39, 4420–4430. [Google Scholar] [CrossRef]
  3. Fernández-García, A.; Zarza, E.; Valenzuela, L.; Pérez, M. Parabolic-trough solar collectors and their applications. Renew. Sustain. Energy Rev. 2010, 14, 1695–1721. [Google Scholar] [CrossRef]
  4. Schiel, W.; Keck, T. Parabolic dish concentrating solar power (CSP) systems A2—Lovegrove, Keith. In Concentrating Solar Power Technology; Stein, W., Ed.; Woodhead Publishing: Sawston, UK, 2012; pp. 284–322. [Google Scholar]
  5. Abbas, R.; Montes, M.J.; Piera, M.; Martínez-Val, J.M. Solar radiation concentration features in Linear Fresnel Reflector arrays. Energy Convers. Manag. 2012, 54, 133–144. [Google Scholar] [CrossRef]
  6. Rovira, A.; Barbero, R.; Montes, M.J.; Abbas, R.; Varela, F. Analysis and comparison of Integrated Solar Combined Cycles using parabolic troughs and linear Fresnel reflectors as concentrating systems. Appl. Energy 2016, 162, 990–1000. [Google Scholar] [CrossRef]
  7. Vant-Hull, L.L. Central tower concentrating solar power (CSP) systems A2—Lovegrove, Keith. In Concentrating Solar Power Technology; Stein, W., Ed.; Woodhead Publishing: Sawston, UK, 2012; pp. 240–283. [Google Scholar]
  8. Renewable Energy Technologies: Cost Analysis Series-Concentrating Solar Power; International Renewable Energy Agency: Bonn, Germany, 2012.
  9. Technology Roadmap Solar Thermal Electricity; International Energy Agency (IEA): Paris, France, 2014.
  10. Yao, Z.; Wang, Z.; Lu, Z.; Wei, X. Modeling and simulation of the pioneer 1 MW solar thermal central receiver system in China. Renew. Energy 2009, 34, 2437–2446. [Google Scholar] [CrossRef]
  11. Wei, X.; Lu, Z.; Wang, Z.; Yu, W.; Zhang, H.; Yao, Z. A new method for the design of the heliostat field layout for solar tower power plant. Renew. Energy 2010, 35, 1970–1975. [Google Scholar] [CrossRef]
  12. Okoroigwe, E.; Madhlopa, A. An integrated combined cycle system driven by a solar tower: A review. Renew. Sustain. Energy Rev. 2016, 57, 337–350. [Google Scholar] [CrossRef]
  13. Schwarzbözl, P.; Buck, R.; Sugarmen, C.; Ring, A.; Marcos Crespo, M.J.; Altwegg, P.; Enrile, J. Solar gas turbine systems: Design, cost and perspectives. Sol. Energy 2006, 80, 1231–1240. [Google Scholar] [CrossRef]
  14. Larrouturou, F.; Caliot, C.; Flamant, G. Influence of receiver surface spectral selectivity on the solar-to-electric efficiency of a solar tower power plant. Sol. Energy 2016, 130, 60–73. [Google Scholar] [CrossRef]
  15. Xu, C.; Wang, Z.; Li, X.; Sun, F. Energy and exergy analysis of solar power tower plants. Appl. Therm. Eng. 2011, 31, 3904–3913. [Google Scholar] [CrossRef]
  16. Spelling, J.; Favrat, D.; Martin, A.; Augsburger, G. Thermoeconomic optimization of a combined-cycle solar tower power plant. Energy 2012, 41, 113–120. [Google Scholar] [CrossRef]
  17. Koll, G.; Schwarzbözl, P.; Hennecke, K.; Hartz, T.; Schmitz, M.; Hoffschmidt, B. The Solar Tower Jülich—A Research and Demonstration Plant for Central Receiver Systems. In Proceedings of the Solar Power and Chemical Energy Systems Conference (SolarPACES) 2009, Berlin, Germany, 15–18 September 2009.
  18. Piacentino, A.; Cardona, E. Scope Oriented Thermoeconomic analysis of energy systems. Part II: Formation Structure of Optimality for robust design. Appl. Energy 2010, 87, 957–970. [Google Scholar] [CrossRef]
  19. (National Aeronautics and Space Administration) NASA. Surface Meteorology and Solar Energy. Available online: https://eosweb.larc.nasa.gov/sse/ (accessed on 1 March 2016).
  20. Amati, V.; Coccia, A.; Sciubba, E.; Toro, C. CAMEL-Pro Users Manual, Rev. 4. Available online: http://www.turbomachinery.it (accessed on 1 March 2016).
  21. Colonna, P.; van der Stelt, T. FluidProp: A Program for the Estimation of Thermo Physical Properties of Fluids. Energy Technology Section, Delft University of Technology, The Netherlands. 2004. Available online: http://www.FluidProp.com (accessed on 1 March 2016).
  22. Toro, C. Modeling, Simulation and Exergy Analysis of Solide Oxide Fuel Cell-Gas Turbine Hybrid Systems; Spienza Università di Roma: Rome, Italy, 2010. [Google Scholar]
  23. Esposto, S.; Sciubba, E.; Toro, C. Process simulation and exergy analysis of a reverse osmosis desalination plant powered by photovoltaic panels in Basra (IRAQ). In Proceedings of the ASME 2010 10th Biennial Conference on Engineering Systems Design and Analysis, Istanbul, Turkey, 12–14 July 2010; pp. 61–71.
  24. Amati, V.; Sciubba, E.; Toro, C. Exergy analysis of a solid oxide fuel cell-gas turbine hybrid power plant. In Proceedings of the ASME 2008 International Mechanical Engineering Congress and Exposition, Boston, MA, USA, 31 October–6 November 2008; pp. 721–731.
  25. Colombo, E.; Rocco, M.V.; Toro, C.; Sciubba, E. An exergy-based approach to the joint economic and environmental impact assessment of possible photovoltaic scenarios: A case study at a regional level in Italy. Ecol. Model. 2015, 318, 64–74. [Google Scholar] [CrossRef]
  26. Zunft, S.; Hänel, M.; Krüger, M.; Dreißigacker, V.; Göhring, F.; Wahl, E. Jülich solar power tower—Experimental evaluation of the storage subsystem and performance calculation. J. Sol. Energy Eng. 2011, 133, 031019. [Google Scholar] [CrossRef]
  27. El-Dessouky, H.T.; Ettouney, H.M. Fundamentals of Salt Water Desalination; Elsevier Science B.V.: Amsterdam, The Netherlands, 2002; p. IV. [Google Scholar]
  28. Augsburger, G. Thermo-Economic Optimisation of Large Solar Tower Power Plants; École Polytechnique Fédérale De Lausanne: Lausanne, Switzerland, 2013. [Google Scholar]
  29. Roosen, P.; Uhlenbruck, S.; Lucas, K. Pareto optimization of a combined cycle power system as a decision support tool for trading off investment vs. operating costs. Int. J. Therm. Sci. 2003, 42, 553–560. [Google Scholar] [CrossRef]
  30. Eurostat. Available online: http://ec.europa.eu/eurostat/statistics-explained/index.php/Energy_price_statistics (accessed on 1 March 2016).
  31. Szargut, J.; Valero, A.; Stanek, W.; Valero, A. Towards an International Reference Environment of Chemical Exergy. In Proceedings of 18th International Conference on Efficiency, Cost, Optimization, Simulation and Environmental Impact of Energy Systems (ECOS 2005), Trondheim, Norway, 20–22 June 2005; Elsevier: Amsterdam, The Netherlands, 2005; Volume 1, pp. 409–417. [Google Scholar]
  32. Bejan, A.; Tsatsaronis, G.; Moran, M.J. Thermal Design and Optimization; Wiley: New York, NY, USA, 1996. [Google Scholar]
  33. Valero, A.; von Spakovsky, M.; Frangopoulos, C.; Tsatsaronis, G. CGAM problem: Definition and conventional solution. Energy 1994, 19, 279–286. [Google Scholar] [CrossRef]
  34. Valero, A.; Serra, L.; Uche, J. Fundamentals of exergy cost accounting and thermoeconomics. Part I: Theory. J. Energy Resour.Technol. 2005, 128, 1–8. [Google Scholar] [CrossRef]
  35. Valero, A.; Usón, S.; Torres, C.; Valero, A. Application of thermoeconomics to industrial ecology. Entropy 2010, 12, 591. [Google Scholar] [CrossRef]
  36. Ahmadi, P.; Dincer, I. Thermodynamic analysis and thermoeconomic optimization of a dual pressure combined cycle power plant with a supplementary firing unit. Energy Convers. Manag. 2011, 52, 2296–2308. [Google Scholar] [CrossRef]
  37. Abusoglu, A.; Kanoglu, M. Exergoeconomic analysis and optimization of combined heat and power production: A review. Renew. Sustain. Energy Rev. 2009, 13, 2295–2308. [Google Scholar] [CrossRef]
  38. Cassetti, G.; Colombo, E. Minimization of local impact of energy systems through exergy analysis. Energy Convers. Manag. 2013, 76, 874–882. [Google Scholar] [CrossRef]
  39. Rocco, M.V.; Colombo, E.; Sciubba, E. Advances in exergy analysis: A novel assessment of the Extended Exergy Accounting method. Appl. Energy 2014, 113, 1405–1420. [Google Scholar] [CrossRef]
  40. Erlach, B.; Serra, L.; Valero, A. Structural theory as standard for thermoeconomics. Energy Convers. Manag. 1999, 40, 1627–1649. [Google Scholar] [CrossRef]
  41. Usón, S.; Valero, A.; Agudelo, A. Thermoeconomics and industrial symbiosis. Effect of by-product integration in cost assessment. Energy 2012, 45, 43–51. [Google Scholar] [CrossRef]
  42. Rivero, R.; Rendón, C.; Gallegos, S. Exergy and exergoeconomic analysis of a crude oil combined distillation unit. Energy 2004, 29, 1909–1927. [Google Scholar] [CrossRef]
  43. Petrakopoulou, F.; Boyano, A.; Cabrera, M.; Tsatsaronis, G. Exergoeconomic and exergoenvironmental analyses of a combined cycle power plant with chemical looping technology. Int. J. Greenh. Gas Control 2011, 5, 475–482. [Google Scholar] [CrossRef]
  44. Keshavarzian, S.; Gardumi, F.; Rocco, M.; Colombo, E. Off-Design modeling of natural gas combined cycle power plants: An order reduction by means of thermoeconomic input–output analysis. Entropy 2016, 18, 71. [Google Scholar] [CrossRef] [Green Version]
Figure 1. Layout of the solar power tower julich (J-CSP). Notice that minor components have not been represented. TES: thermal energy storage; CSP: concentrated solar power; HRSG: heat recovery steam generator; CMP: compressor; COND: condenser.
Energies 09 00885 g001
Figure 2. H-CSP plant layout.
Energies 09 00885 g002
Figure 3. Natural gas conventional combined cycle plant (CCPP).
Energies 09 00885 g003
Figure 4. Results of the exergy analysis: (a) the total values of exergy; (b) the same values in percentage.
Energies 09 00885 g004
Figure 5. Functional diagram of the three analyzed plants, defined based on the Fuel (F)-Product (P)-Loss (L) criterion. Numbers represent the material/energy interactions among components (square blocks), expressed by means of exergy and grouped based on their purpose.
Energies 09 00885 g005
Figure 6. Exergy destructions (green bars) and exergy costs of exergy destructions (blue bars) for the most relevant components of the analyzed plants.
Energies 09 00885 g006
Figure 7. Economic costs of investment (black bars) and irreversibilities (grey bars) for the most relevant components of the analyzed plants.
Energies 09 00885 g007
Figure 8. Change in exergy destructions (green bars, kW) and exergy cost of exergy destructions (blue bars, kW) between the improved and the original plant layouts.
Energies 09 00885 g008
Figure 9. Change in the sum of E = exergoeconomic cost of exergy destructions and investment costs ($/kWh) between the improved and the original plant layouts.
Energies 09 00885 g009
Figure 10. Results of the thermoeconomic design evaluation and optimization process.
Energies 09 00885 g010
Table 1. Solar power tower Julich (J-CSP) technical specifications. HTF: heat transfer fluid; ST: steam turbine.
DataValueUnit
Number of heliostats2153-
Heliostat aperture8.2m2
Reflecting area17,650m2
HTFAir-
HTF temp out680°C
Storage1.5h
Turbine power1.5MW
ST adiabatic efficiency88%
Table 2. Hybrid concentrated solar power plant (H-CSP) technical specifications. TIT: turbine inlet temperature.
DataValueUnit
Number of heliostats1800-
Heliostat aperture8.2m2
Reflecting area14,760m2
HTFAir-
HTF temp out680°C
Turbine power1.5MWel
ST adiabatic efficiency88%
FuelCH4-
Table 3. Combined cycle technical specifications. GT: gas turbine; CC: combustion chamber.
DataValueUnit
GT Polytropic Efficiency88%
ST Adiabatic Efficiency88%
CMP Polytropic Efficiency85%
CC Efficiency95%
TIT-gas1400K
TIT-steam680–700K
HRSG Efficiency95%
FuelCH4-
Table 4. Results of the economic cost analysis for all the systems. TCL: total cost of investment.
ComponentsSymbolJ-CSP M$ (2016)H-CSP M$ (2016)CCPP M$ (2016)
Solar towerCSP1.341.340.00
ReceiverCSP6.826.820.00
Heliostats fieldCSP7.706.190.00
StorageCSP2.290.000.00
CMPsCMP0.000.000.45
GTGT0.000.000.34
CCCC0.000.130.06
ST + CondenserST + COND2.741.980.63
HRSGHRSG0.900.780.02
TCITCI21.7817.251.50
Annual levelized cost (M$/year)-1.751.380.12
Table 5. Results of the exergy analysis applied to the yearly operation of each system.
PlantExF,NRExF,RExPExLExDηexcex,P
MWh/yearMWh/yearMWh/yearMWh/yearMWh/year-J/J
J-CSP039,4428834030,6080.224.46
H-CSP12,68028,6278833105331,4200.214.68
CCPP18,9390881864894730.472.15

