
Analysis of Power Network for Line Reactance Variation to Improve Total Transmission Capacity


Abstract
:1. Introduction
2. Formulation of Total Transfer Capability
- The and curves can be provided by RPF for voltage stability.
- The method for adjusting the control variables is relatively easy in RPF compared to OPF methods.
- The implementation of RPF is much easier than CPF and the convergence time is relatively shorter than for CPF.
2.1. Repeated Power Flow
- Maximize λ
- Subject to:
- λ : Scalar parameter representing the increase in load or generation of the buses
- , : Real and reactive power generation at bus i,
- , : Real and reactive loads at bus i
- , : Voltage magnitude at bus i and bus j
- = − : The voltage phase angle difference between bus i and bus j
- n : Total number of buses.
- , : Lower and upper limit of the voltage magnitude at bus i
- : Apparent power flow in
- : Thermal limit of
- : Initial active power generated at bus i in the source area.
- , : Initial real and reactive power demand at bus i in the sink area.
- , : Constants used to indicate the change rate in the generation and load as λ alters.
- TTC is calculated as follows:
- is the total load for
- is the total load for .
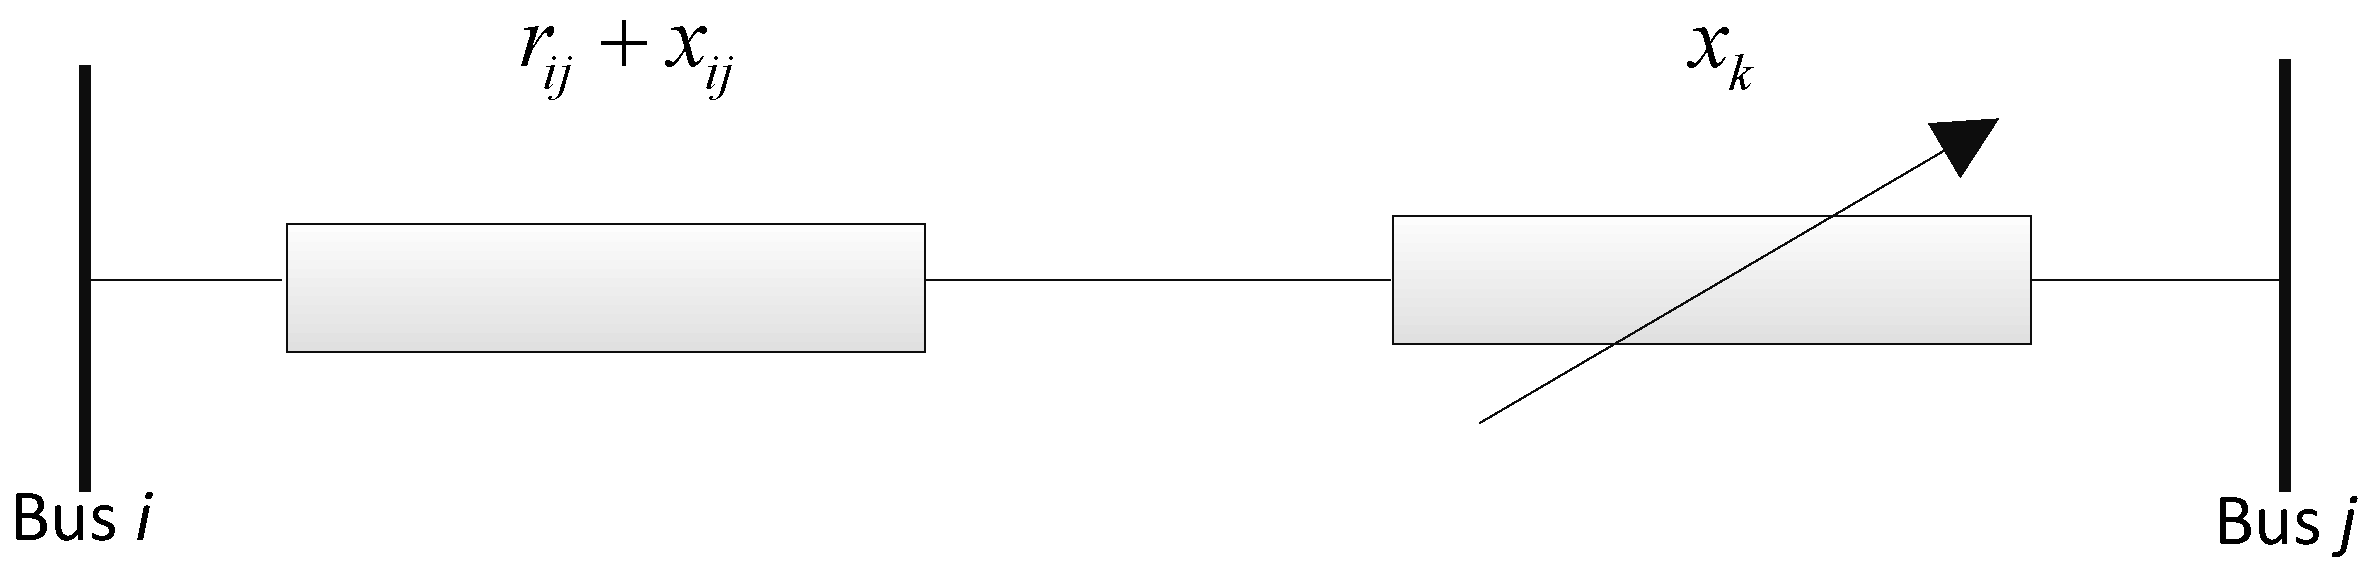
- : Net reactance of
- : the original reactance of
- : reactance of Series FACTS
- : lower limit (capacitive reactance)
- : upper limit (inductive reactance).
- Maximize λ
- Subject to:
- and ,
3. Method for Multiple Locations Selection of FACTS Devices
3.1. System Performance Index for Real Power Flow Analysis
- : real power flow on line m,
- : mth rated capacity
- z : specified exponent (z = 2 preferred)
- : total number of lines
- : non negative real weighting coefficient used to reflect the importance of lines ( = 1).
3.1.1. PI Sensitivity Factors
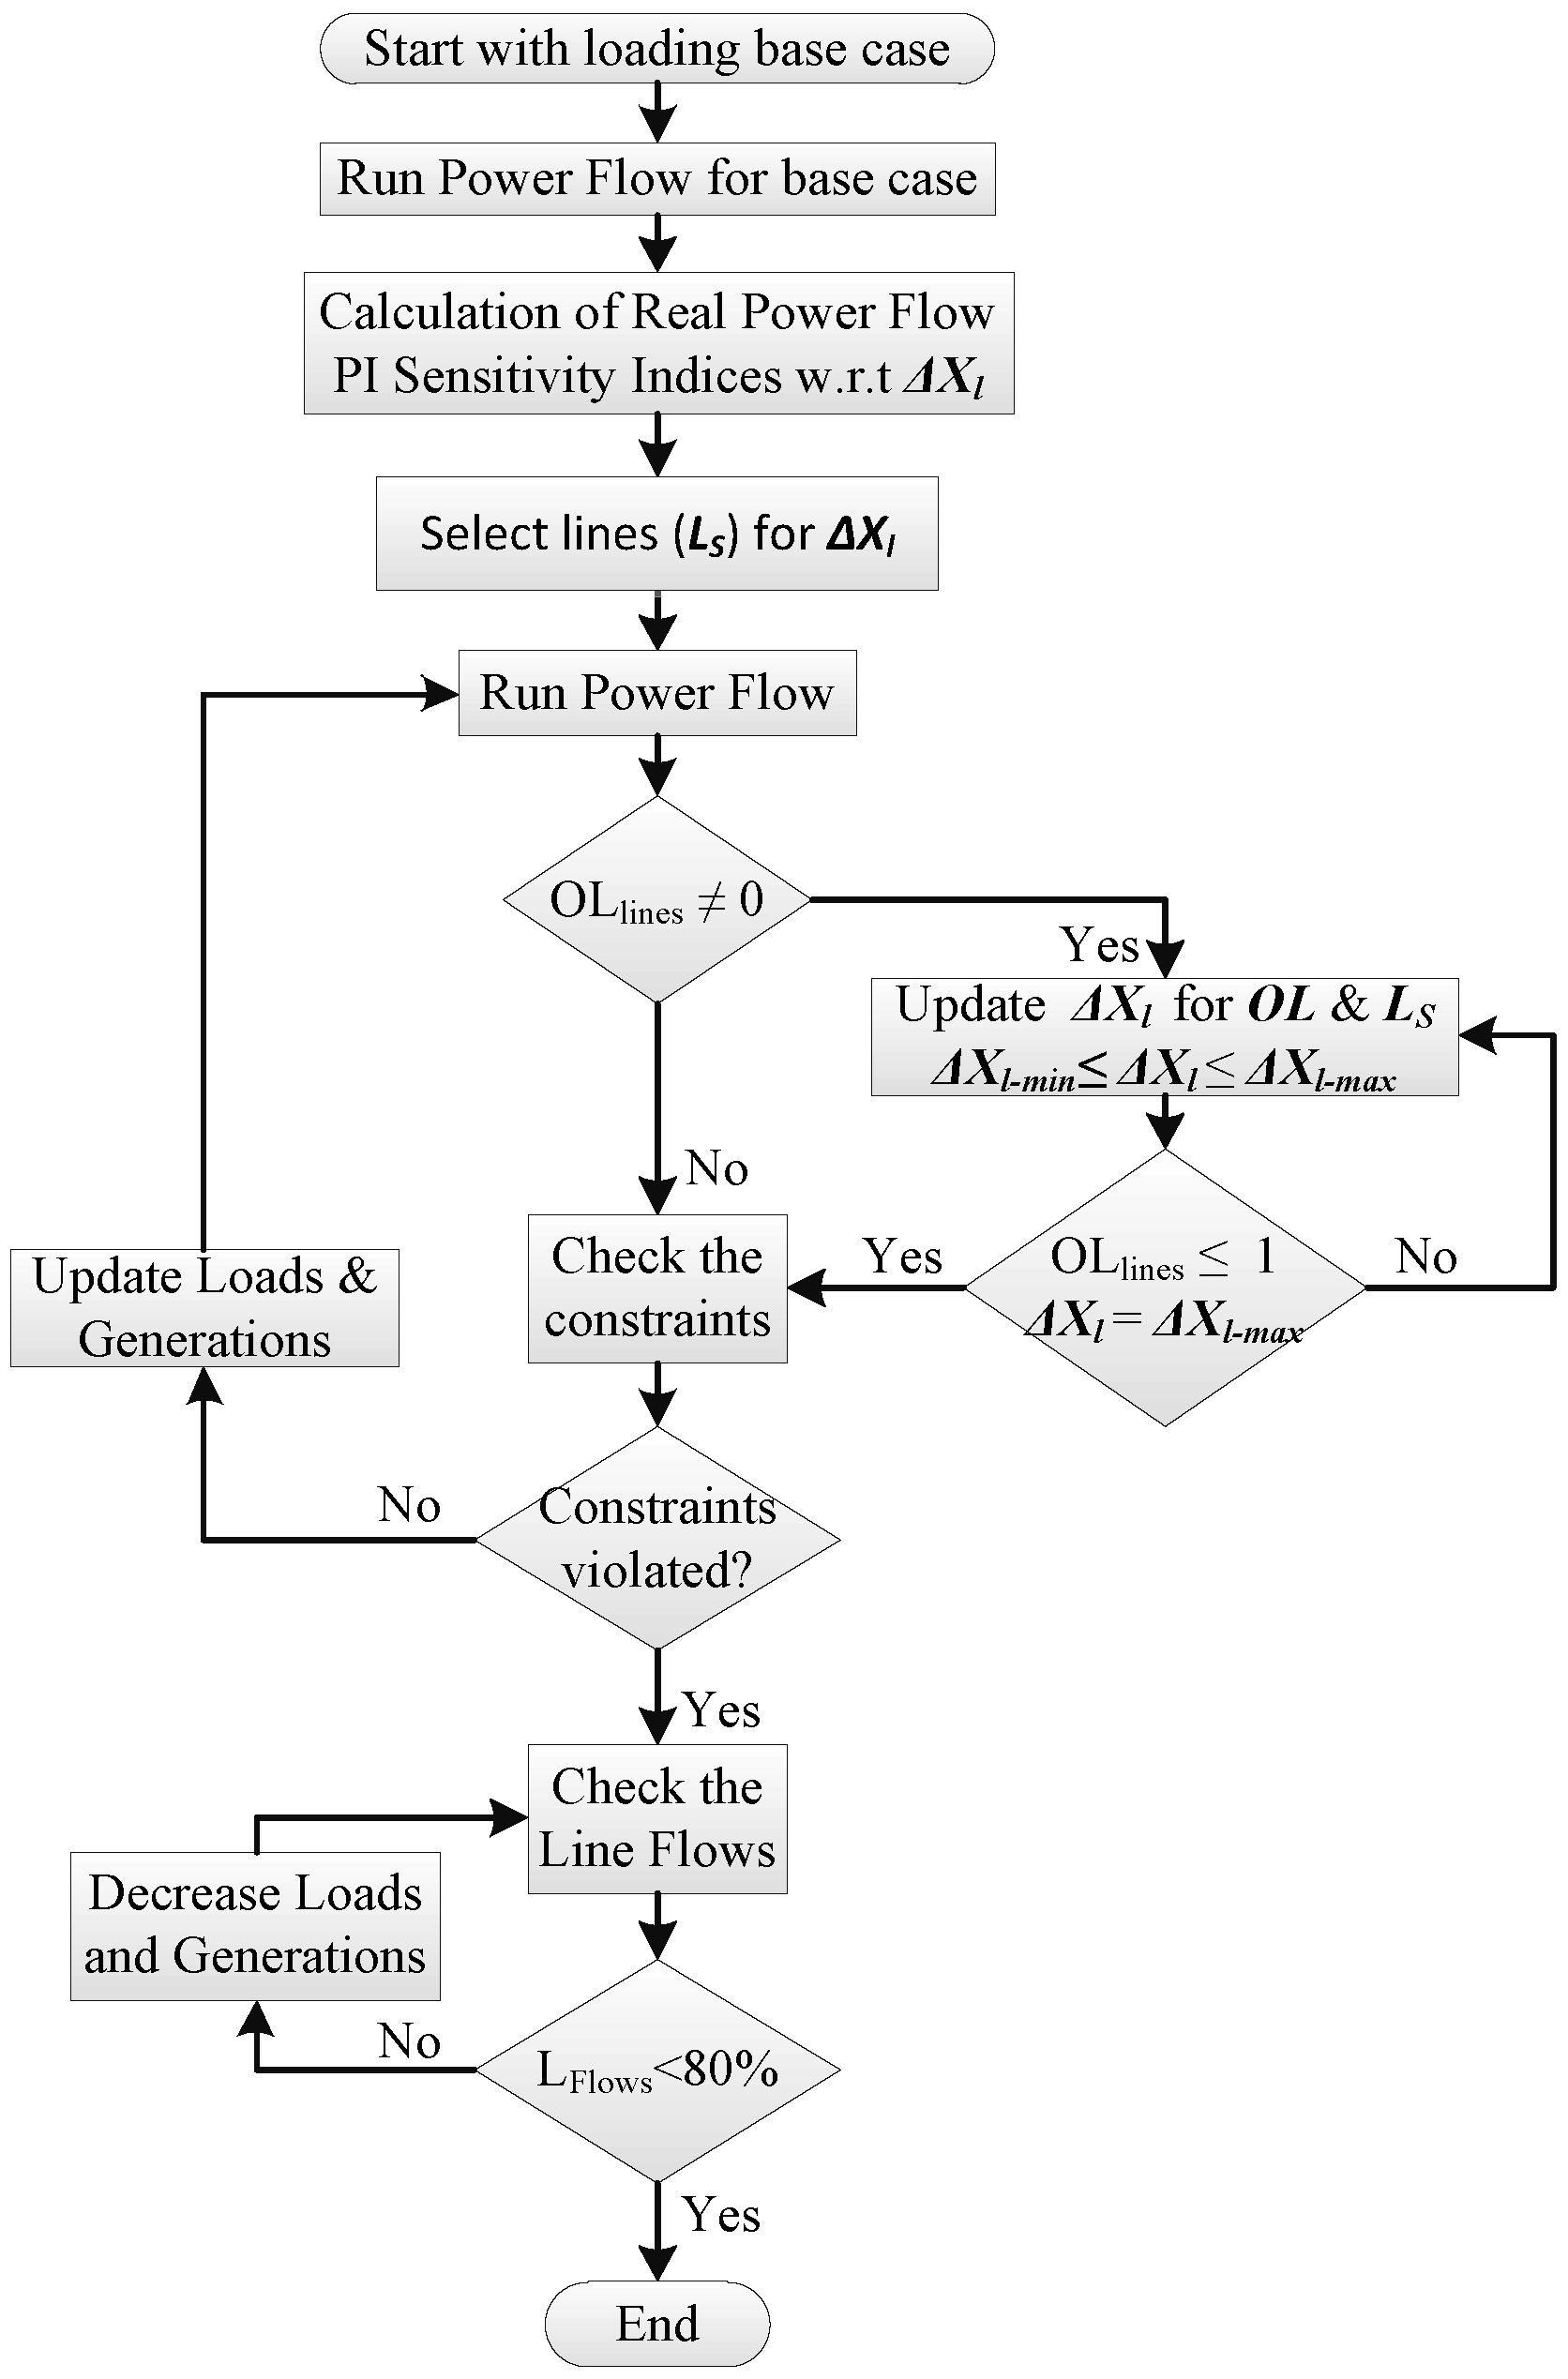
4. Determination of TTC with Lines Reactance Variation
- 1.
- Select any network from three IEEE(24, 30 & 39 bus) test systems.
- 2.
- Solve the power flow for (Normal or any contingency case) with ()
- 3.
- Using Equation (16), calculate PI sensitivity factors for each line.
- 4.
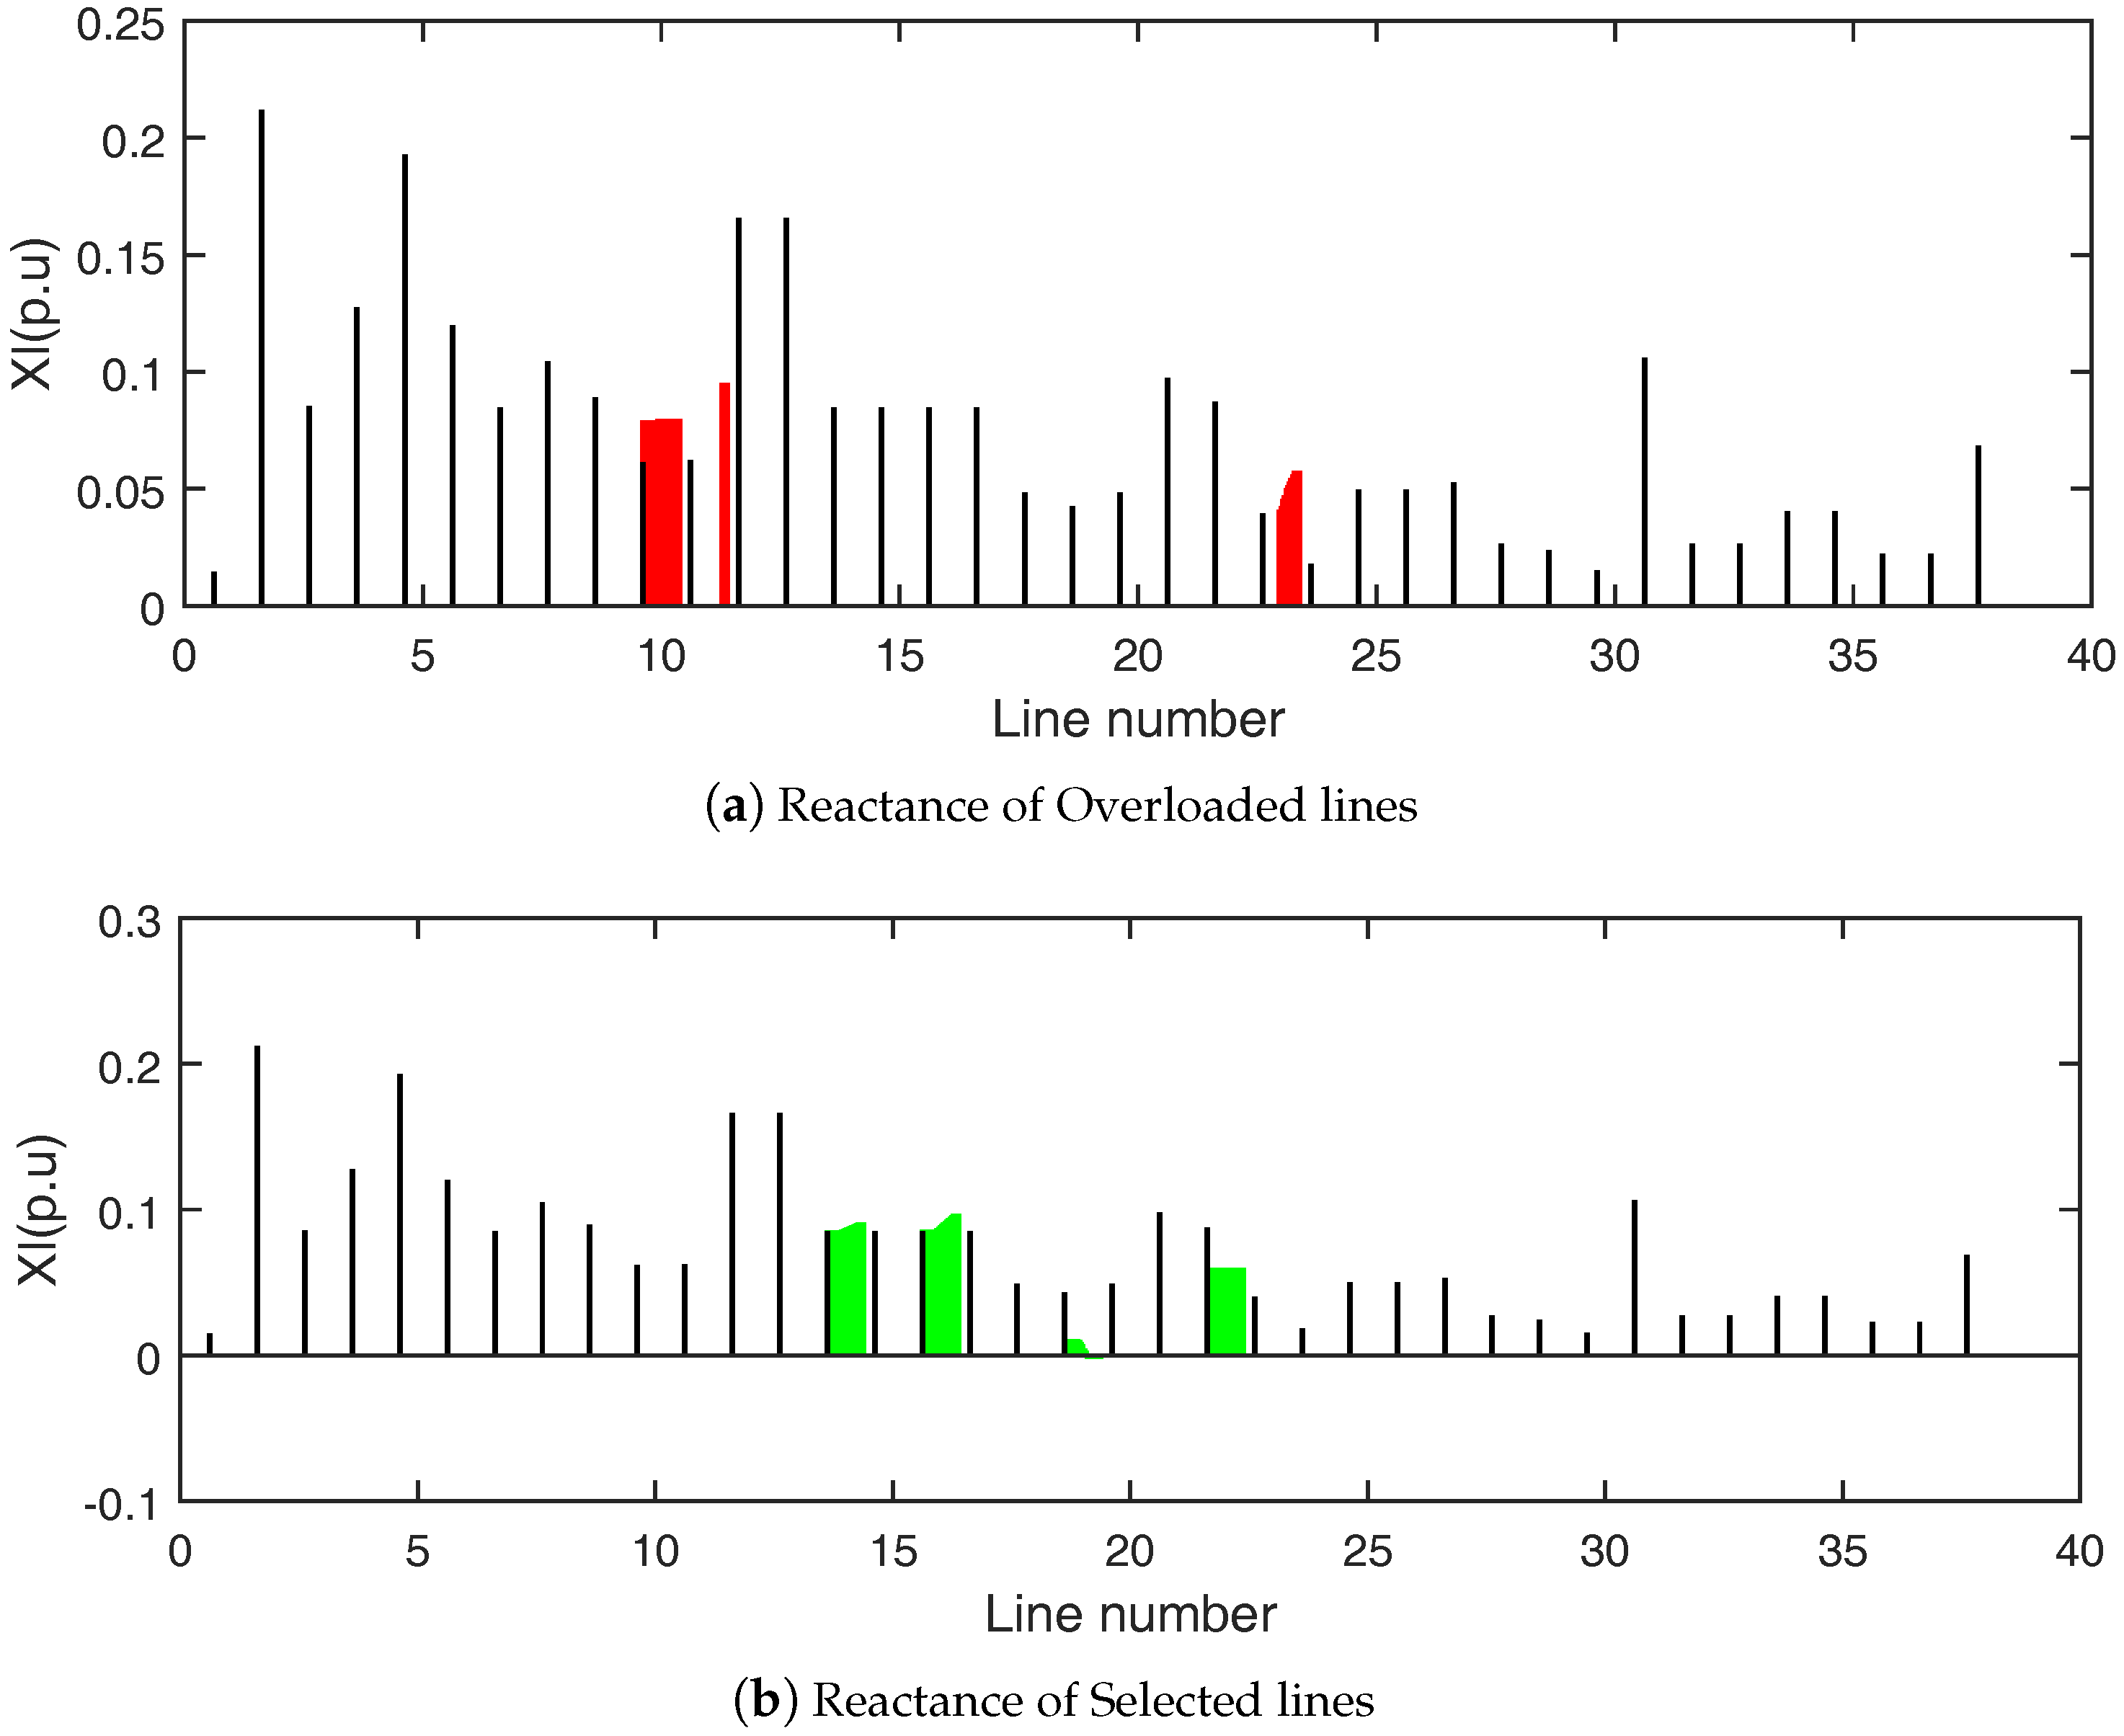
- Select lines (Selected Lines ) based on negative values.
- 5.
- Start RPF with step increase in power transfer and identify source and sink.
- 6.
- Solve the power flow problem with the modified power transfer increase in step 5
- 7.
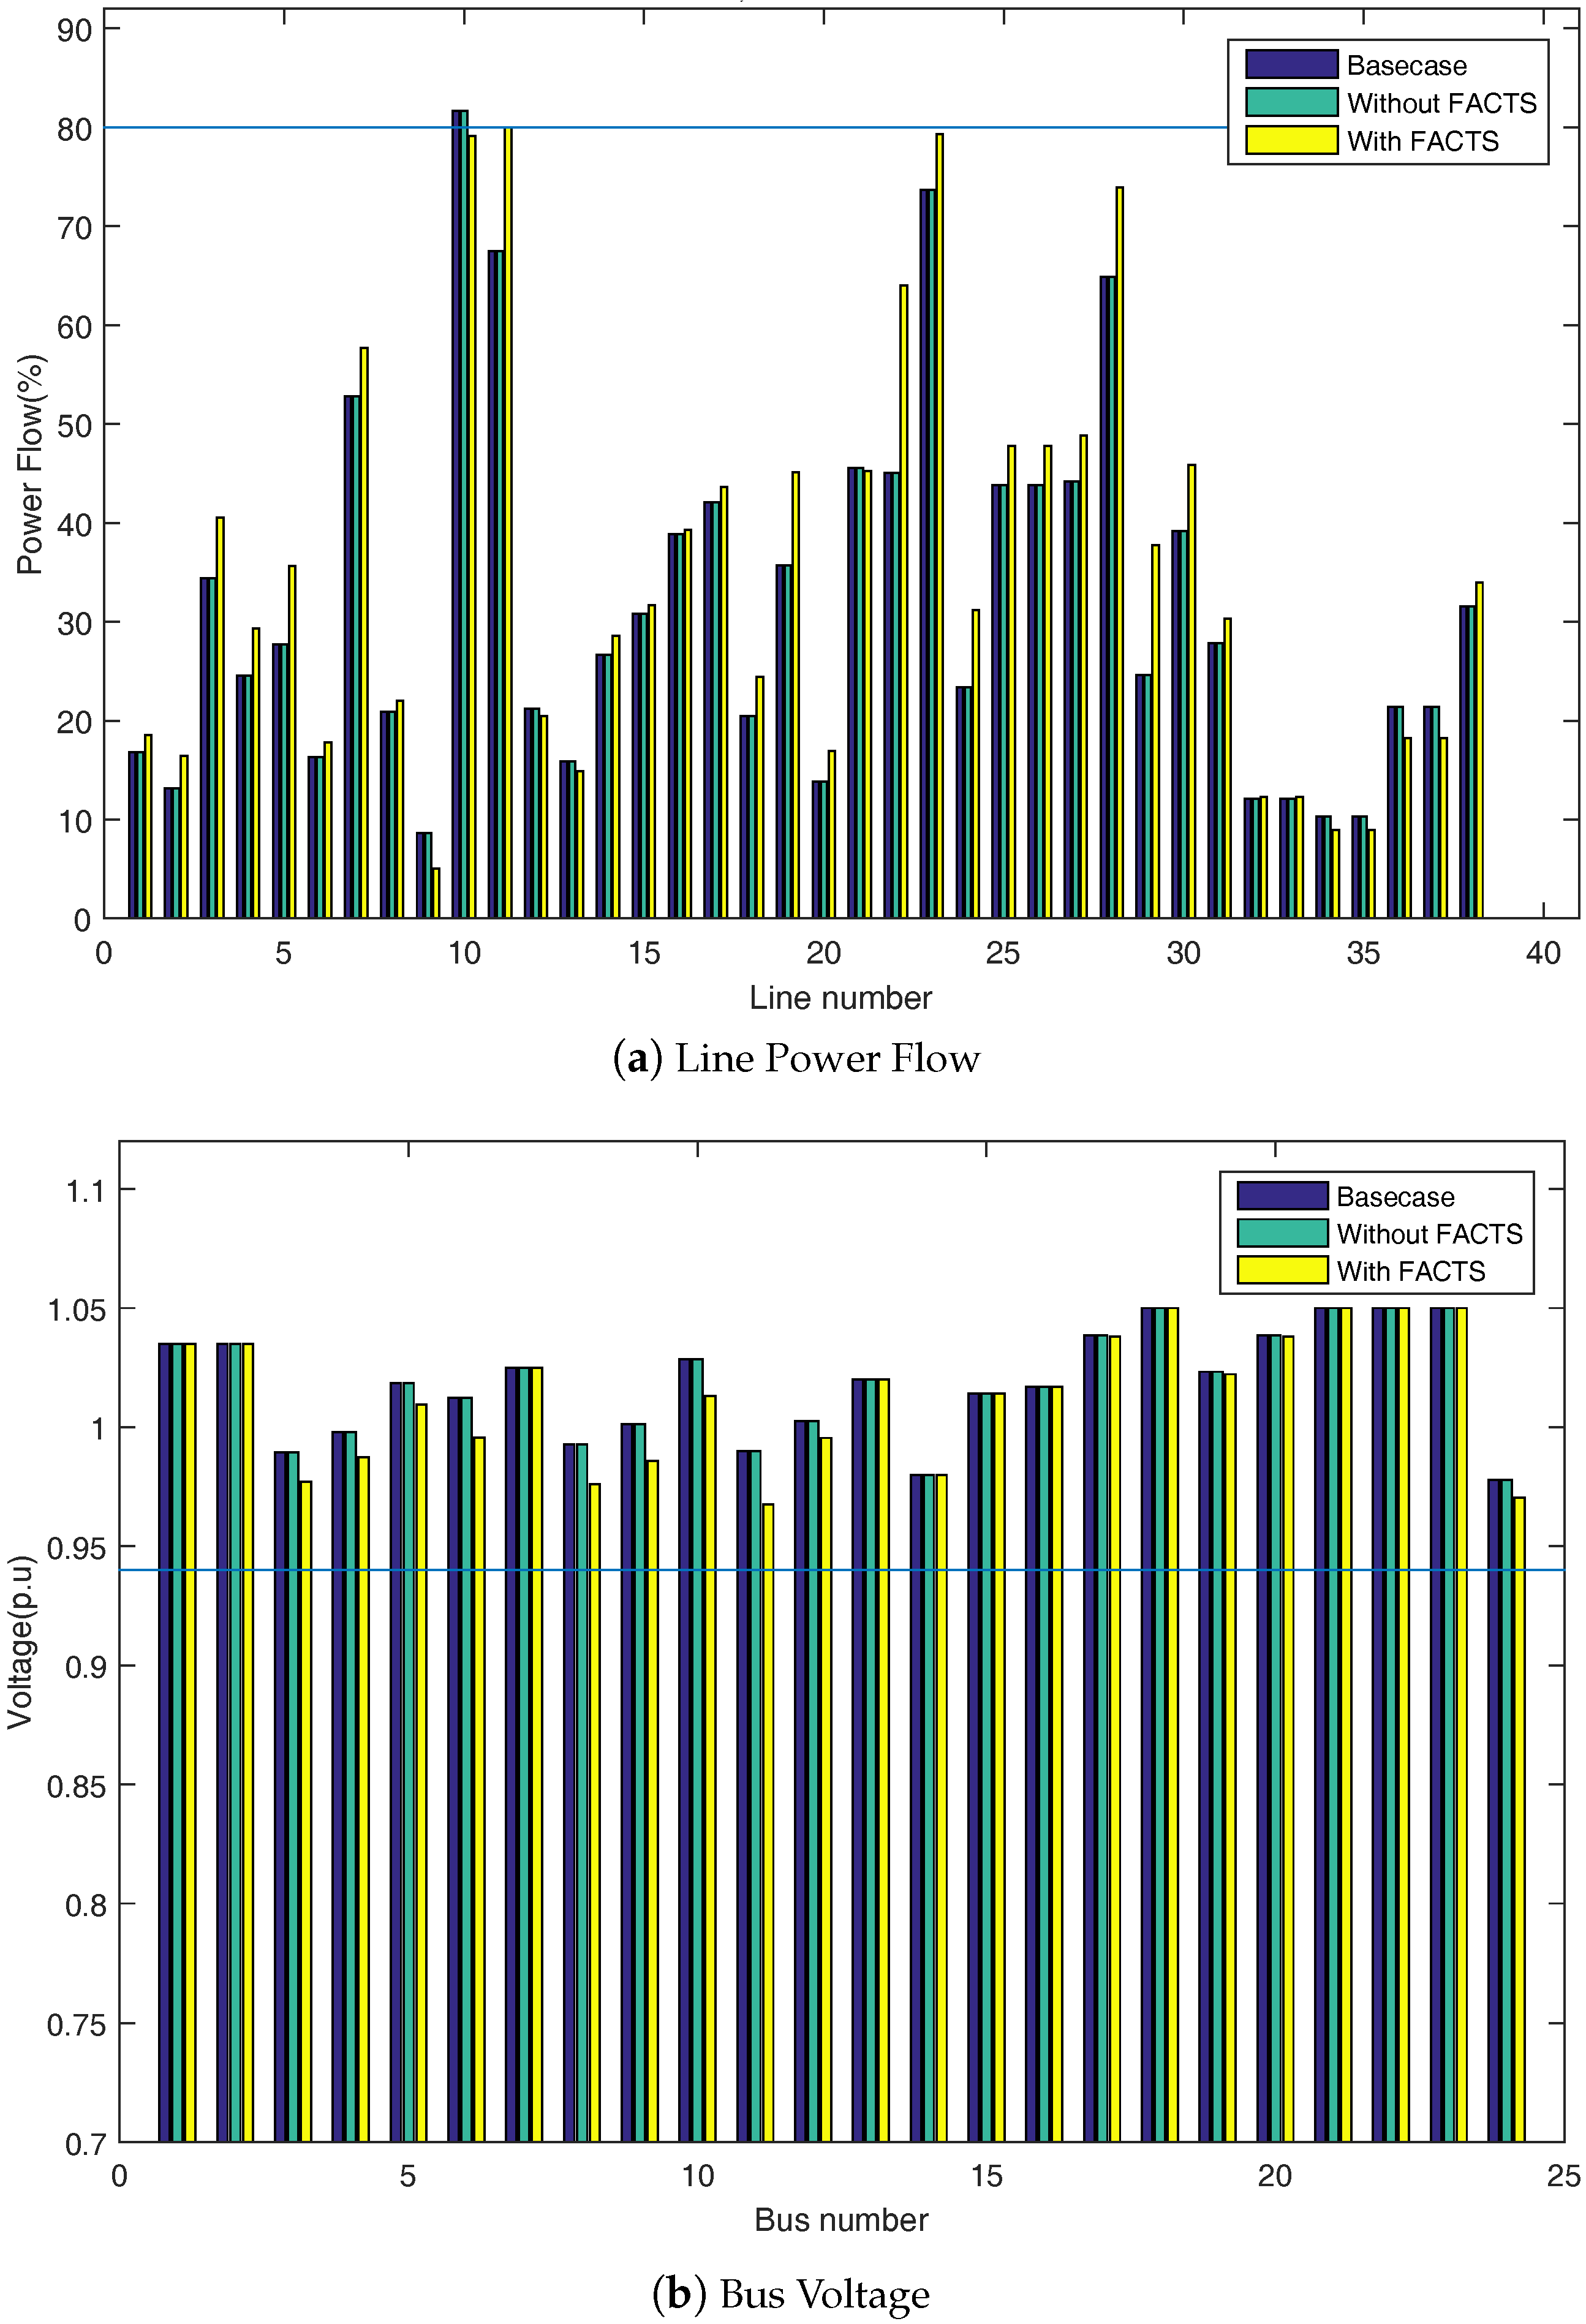
- Identify the lines having line utilization more than 80% of line thermal capacity (Overloaded Lines ).
- 8.
- Change the reactance of lines and lines in step 4 using Equation (6), solve the power flow equation for updated line reactance.
- 9.
- Check the solution if any constraint is violated, if there is any violation go to next step otherwise go to step 5.
- 10.
- Decrease the power transfer until no constraint is violated, Calculate the TTC for source/sink transfer.
5. Test Systems and Case Studies
5.1. IEEE 24-Bus System
5.1.1. Bus Contribution in Load and Generation
5.1.2. Inter-Area TTC
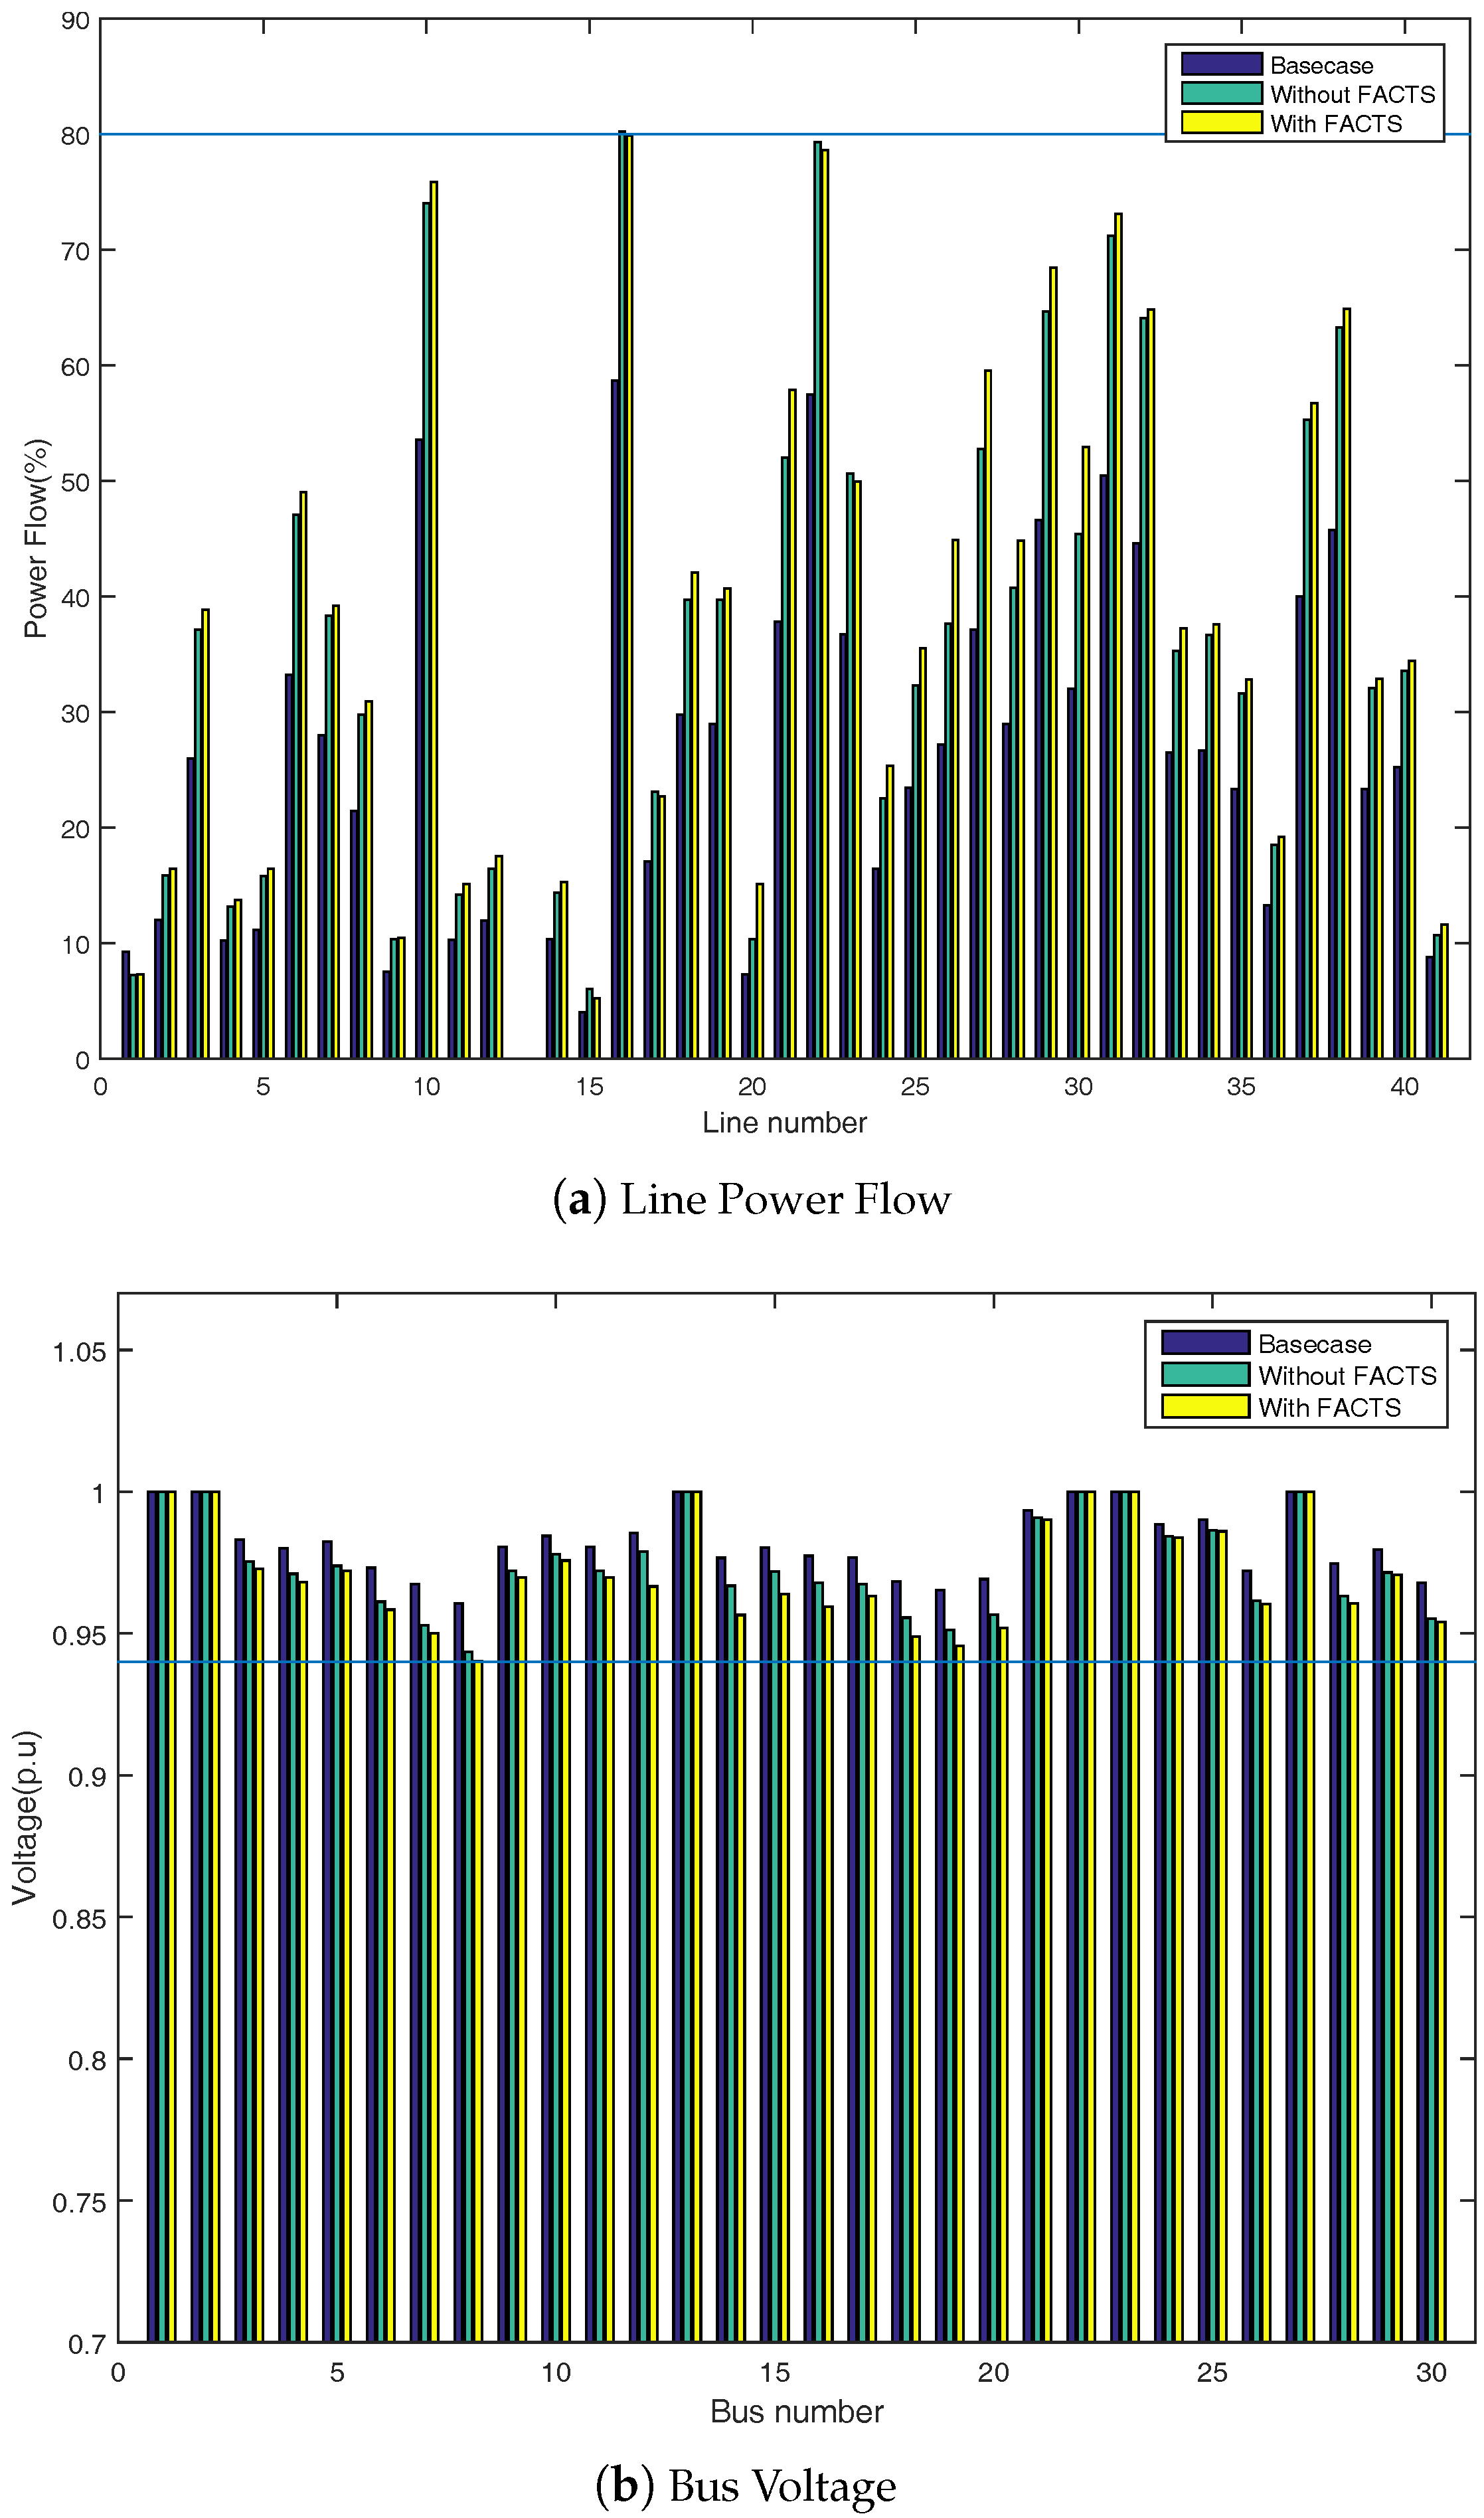
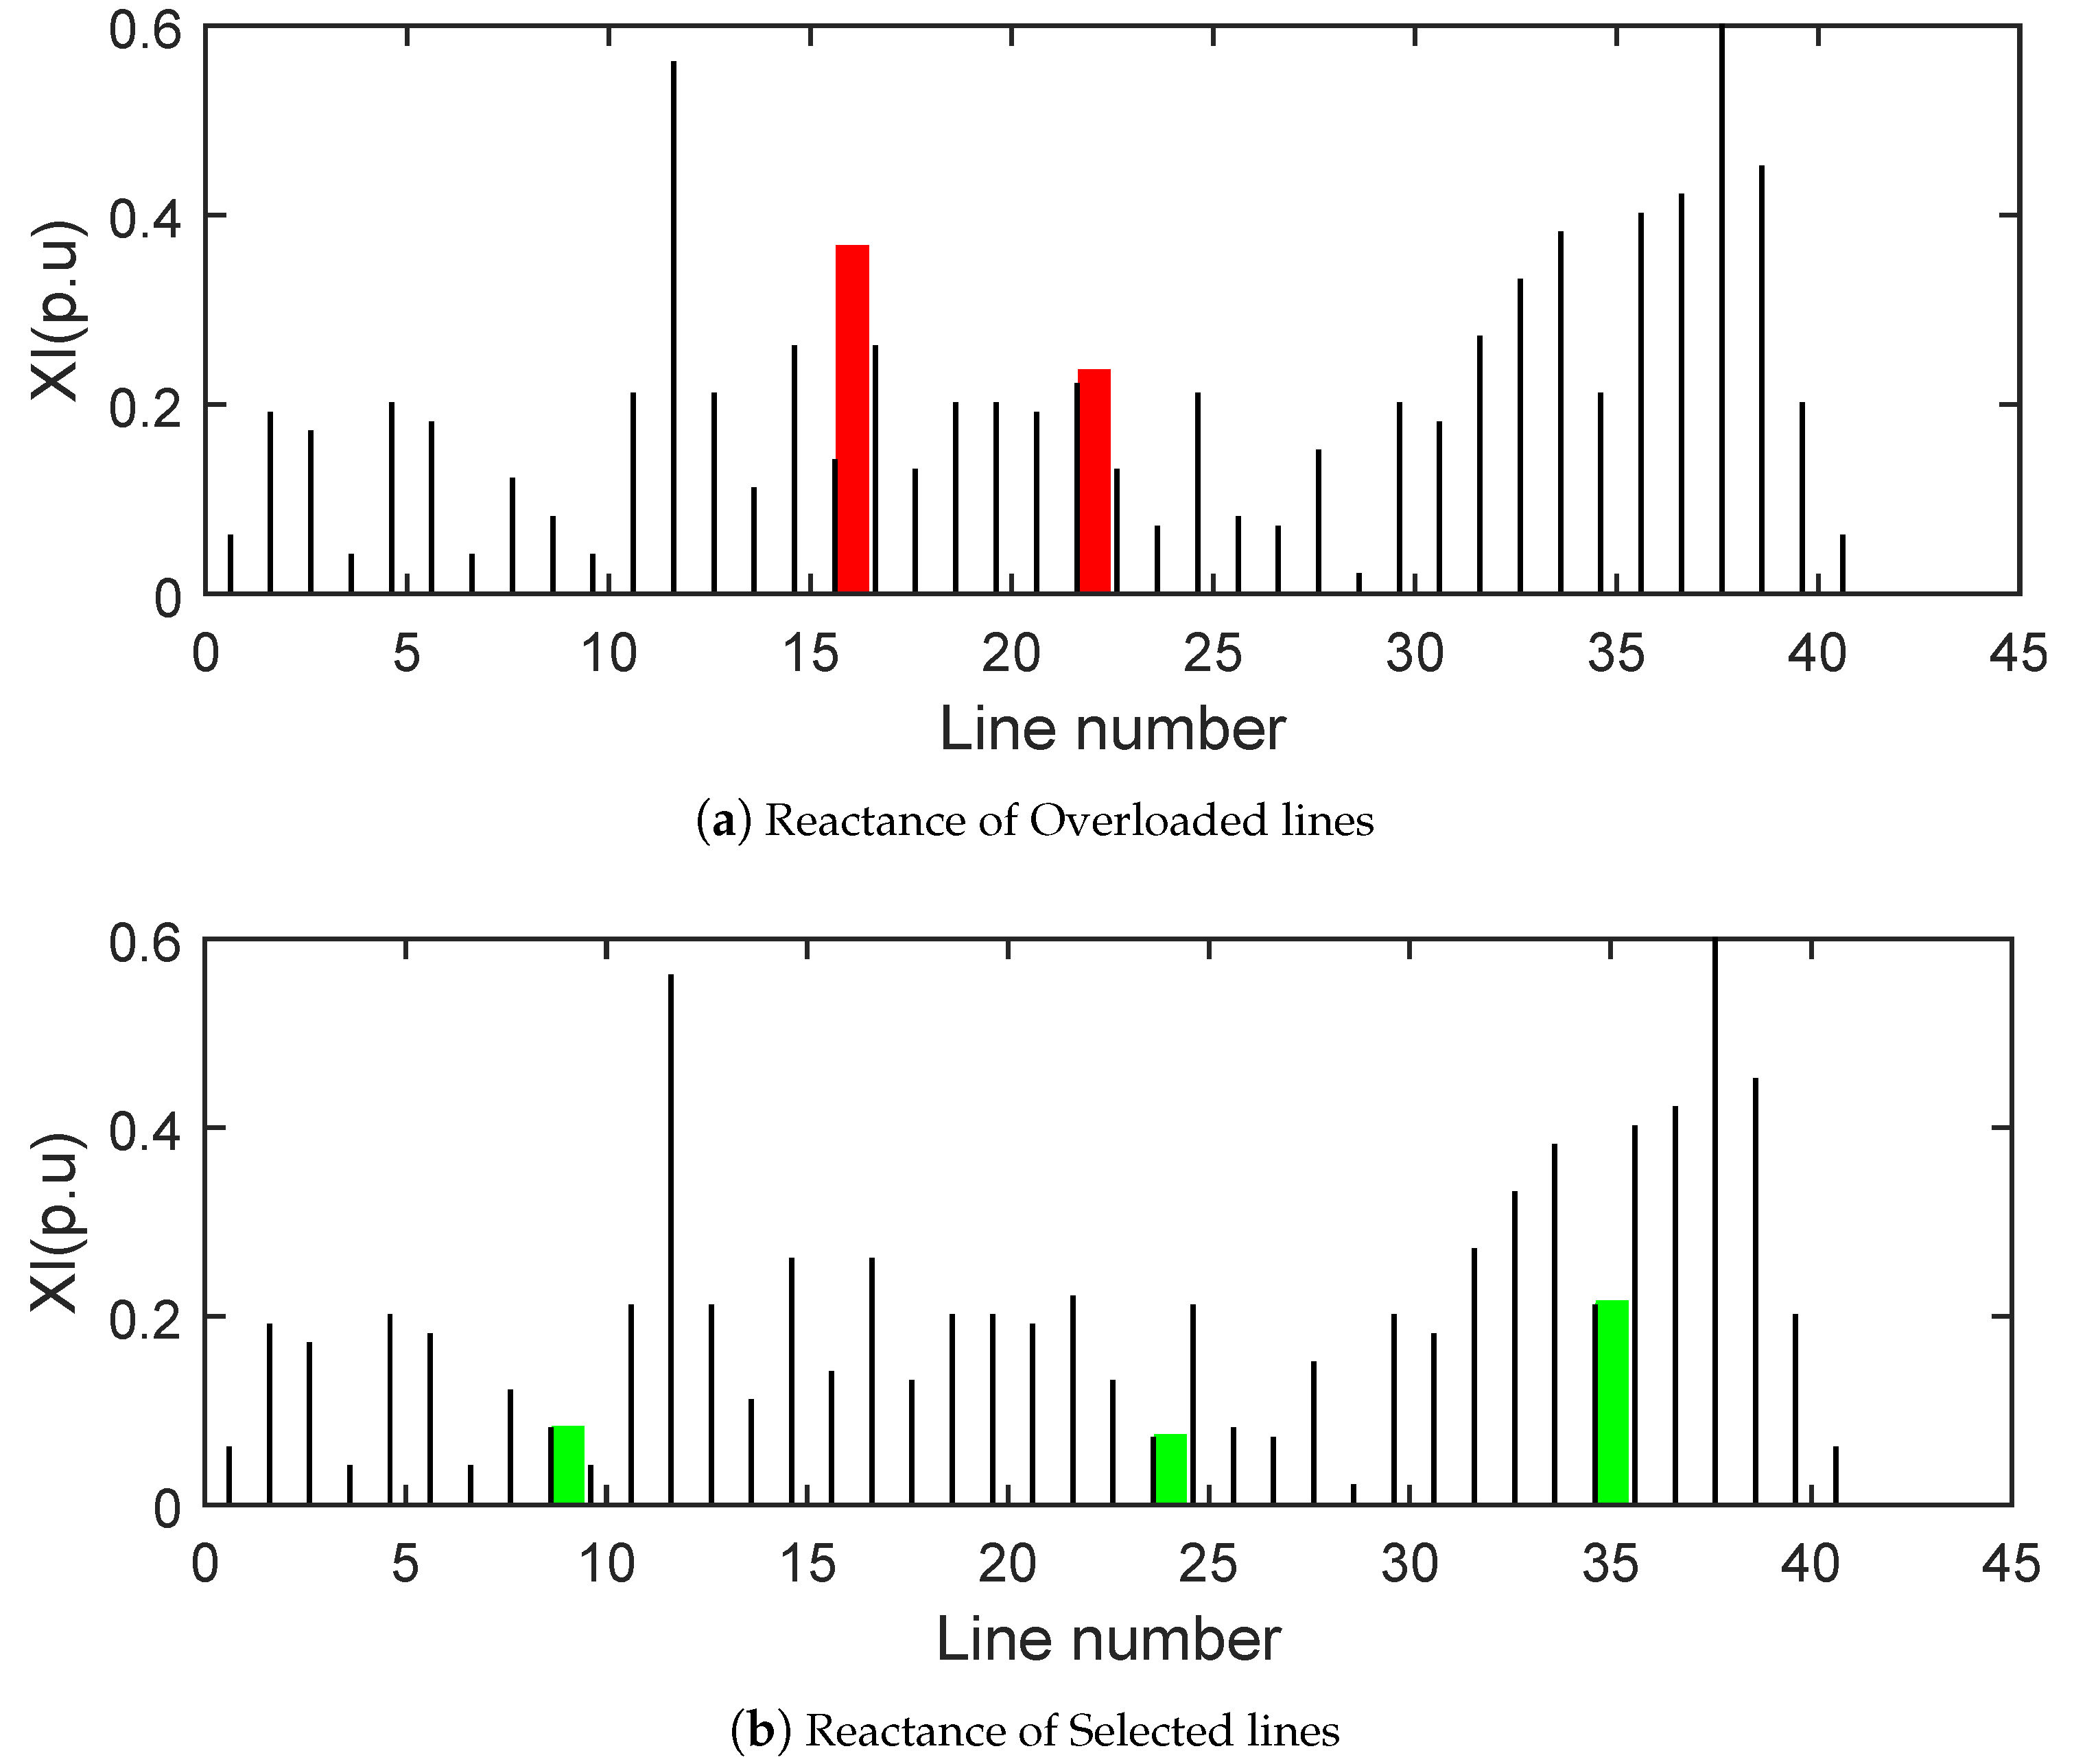
5.2. IEEE 30-Bus System
5.2.1. Bus Contribution in Load and Generation
5.2.2. Inter-Area TTC
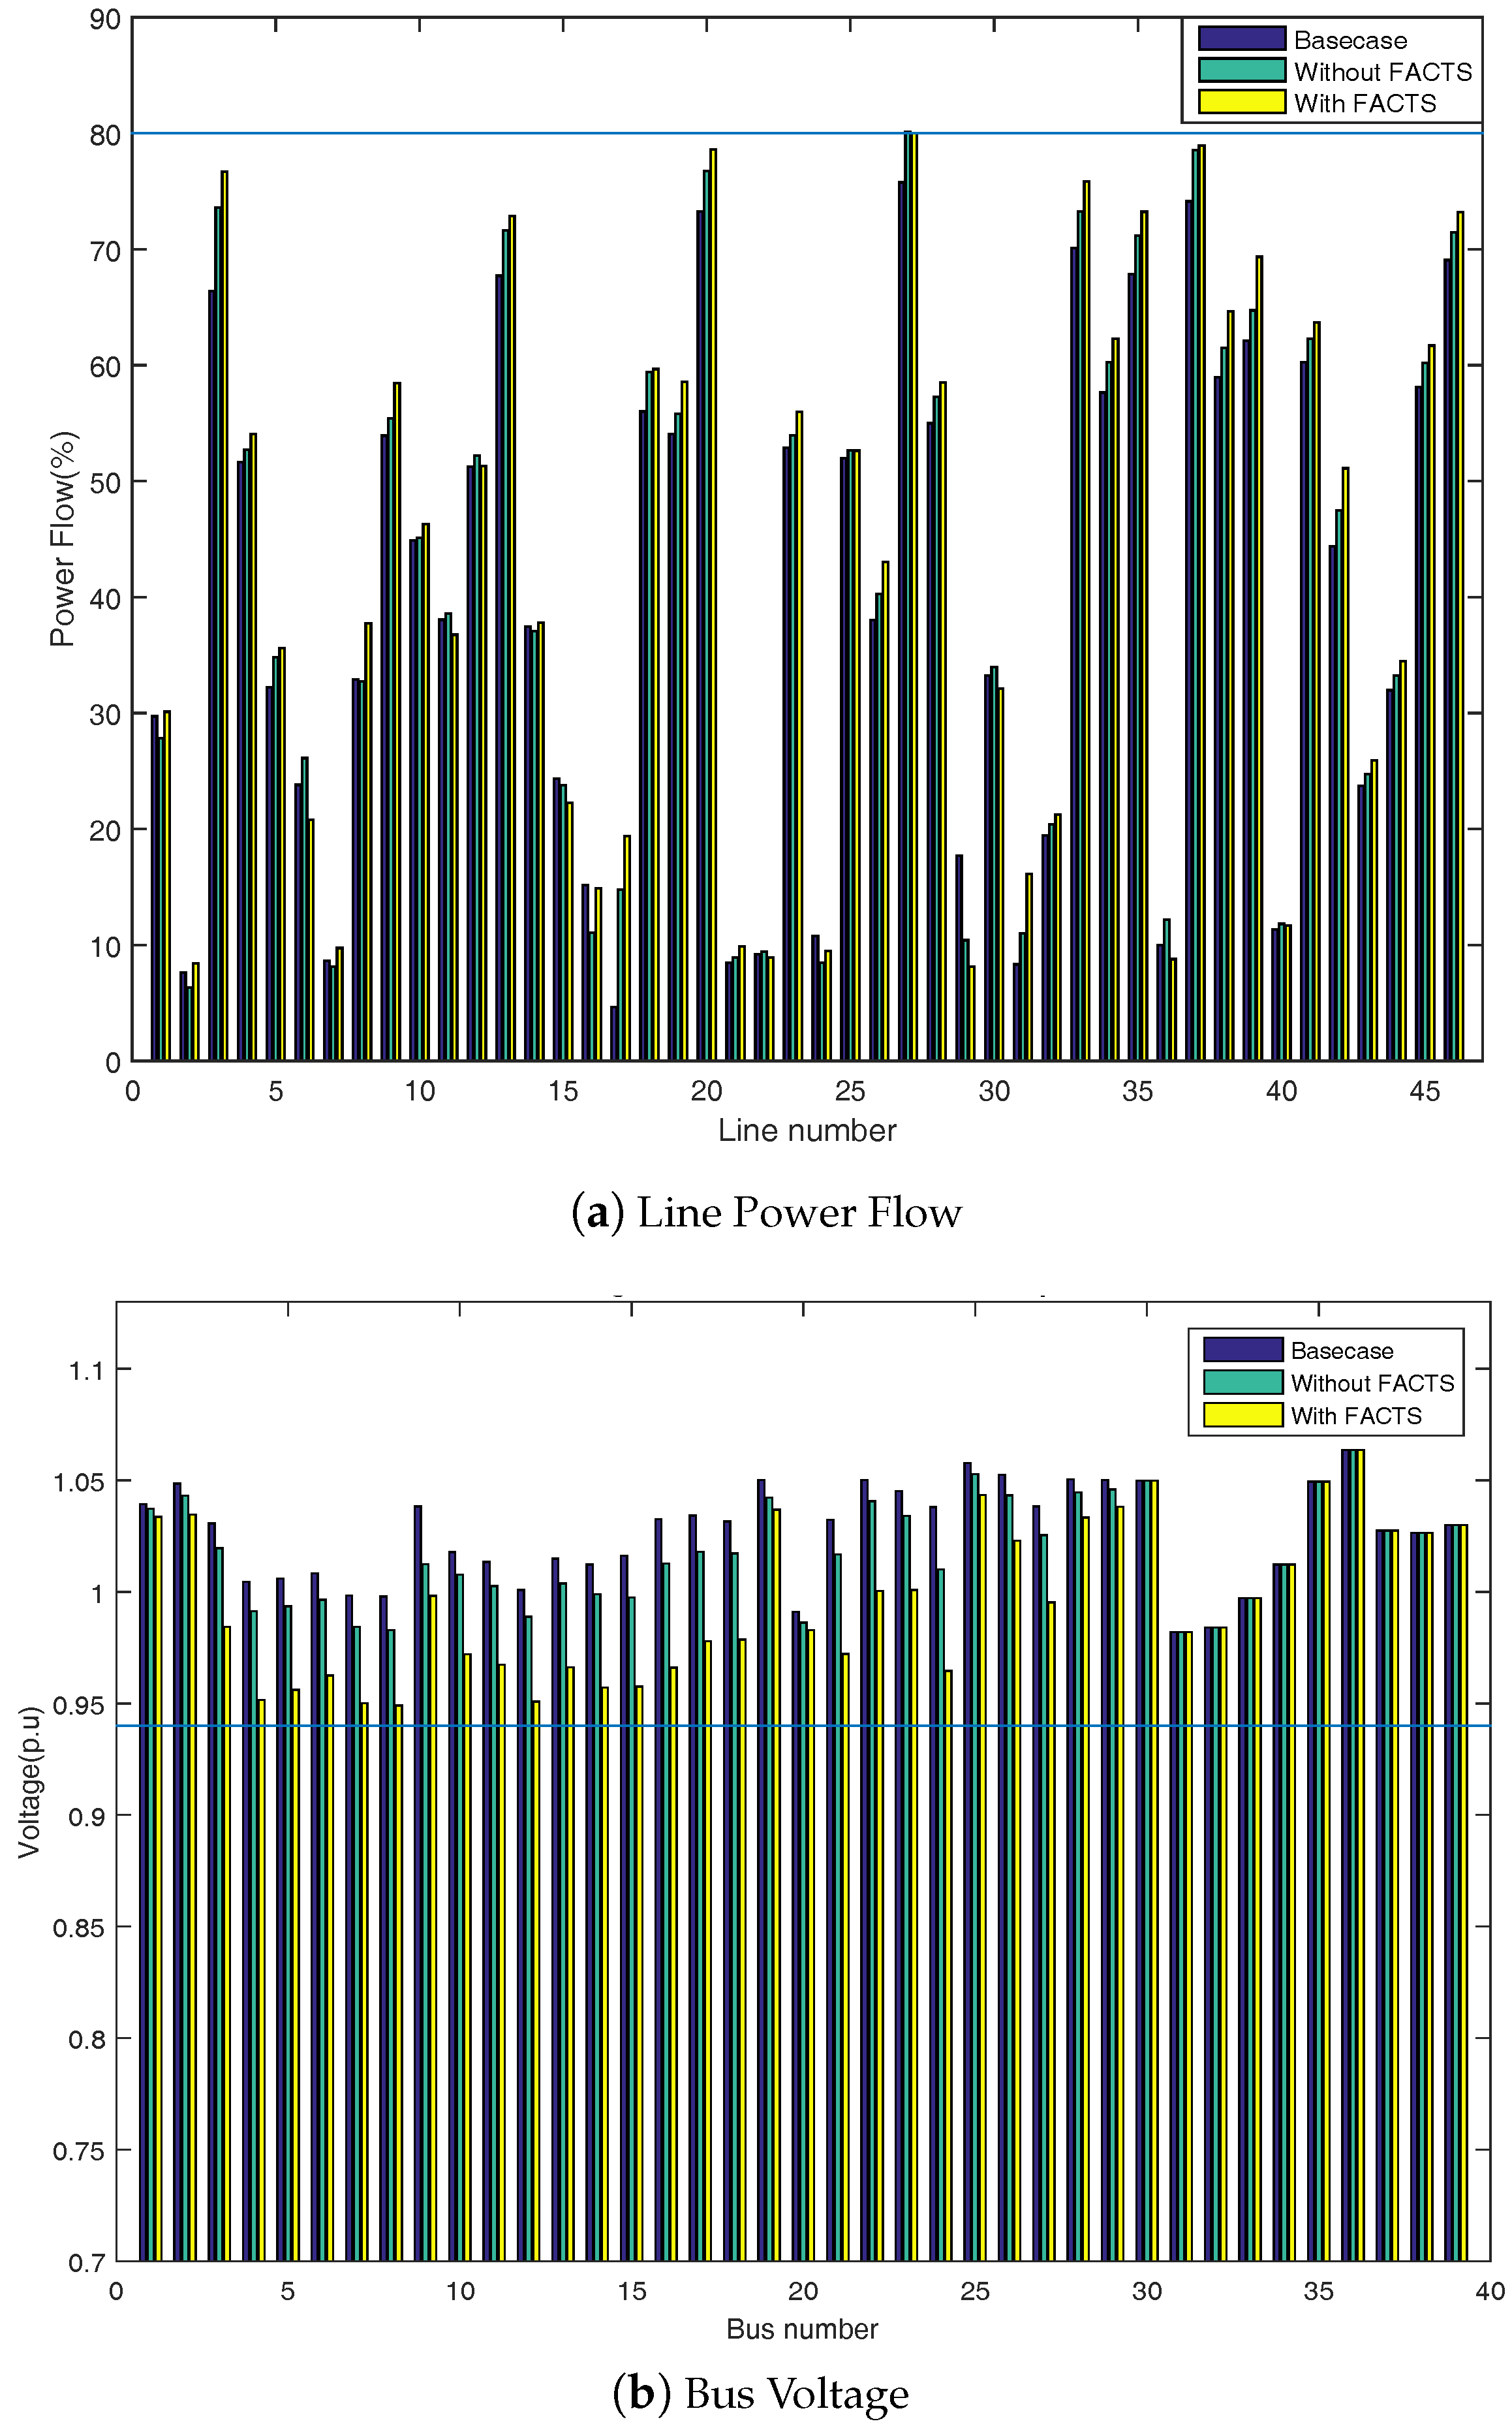
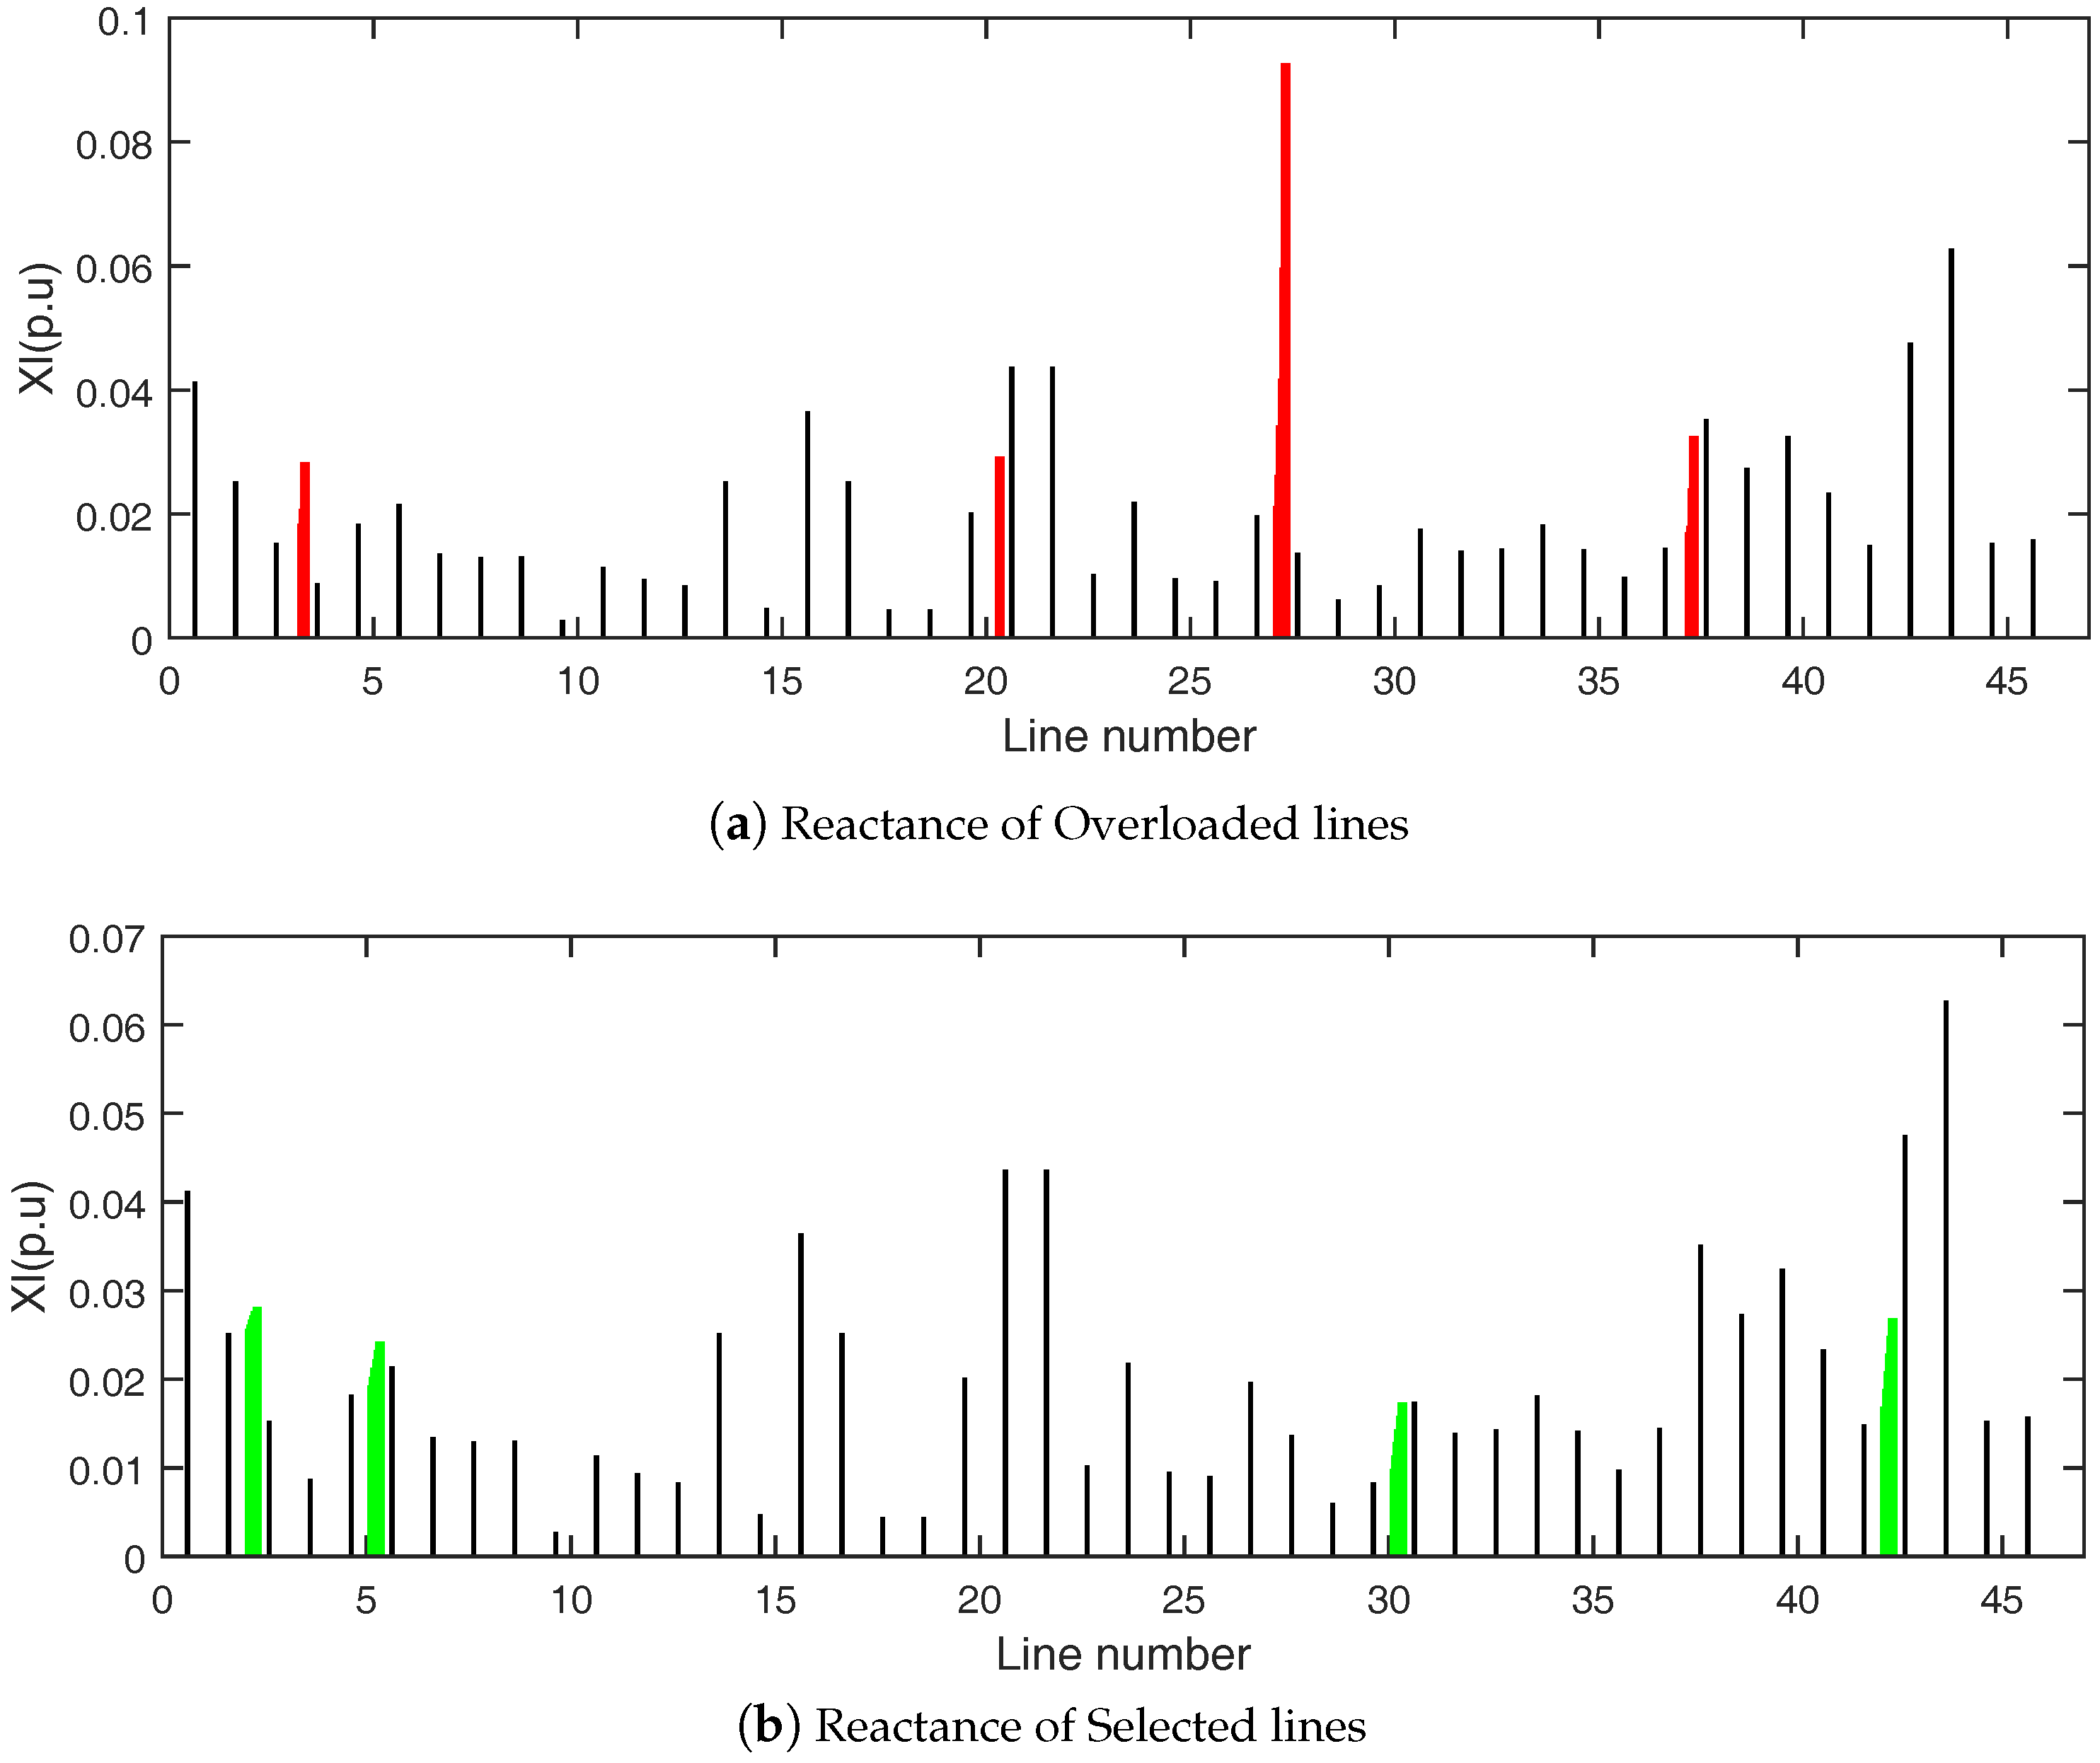
5.3. IEEE 39-Bus System
5.3.1. Bus Contribution in Load and Generation
5.3.2. Inter-Area TTC
6. Conclusions
Acknowledgments
Author Contributions
Conflicts of Interest
Appendix A. The Relation of Line Power Flow and Bus Power Injection
References
- Federal Energy Regulatory Commission. Open Access Same-Time Information System and Standards of Conduct; Docket No. Technical Report, RM 95-9-000, Order 889; GAO: Washington, DC, USA, 1996.
- Force, T.T.C.T. Available Transfer Capability Definitions and Determination; North American Electric Reliability Council: Princeton, NJ, USA, 1996.
- Ou, Y.; Singh, C. Assessment of available transfer capability and margins. IEEE Trans. Power Syst. 2002, 17, 463–468. [Google Scholar] [CrossRef]
- Chiang, H.D.; Flueck, A.J.; Shah, K.S.; Balu, N. CPFLOW: A practical tool for tracing power system steady-state stationary behavior due to load and generation variations. IEEE Trans. Power Syst. 1995, 10, 623–634. [Google Scholar] [CrossRef]
- Farahmand, H.; Rashidi-Nejad, M.; Fotuhi-Firoozabad, M. Implementation of FACTS devices for ATC enhancement using RPF technique. In Proceedings of the 2004 Large Engineering Systems Conference on Power Engineering, Halifax, UK, 28–30 July 2004; pp. 30–35.
- Kumar, J.; Kumar, A. Multi-transactions ATC determination using PTDF based approach in deregulated markets. In Proceedings of the 2011 Annual IEEE India Conference (INDICON), New Delhi, India, 16–18 December 2011; pp. 1–6.
- Wang, B.; Fang, X.; Zhao, X.; Chen, H. Bi-level optimization for available transfer capability evaluation in deregulated electricity market. Energies 2015, 8, 13344–13360. [Google Scholar] [CrossRef]
- Hingorani, N.G.; Gyugyi, L. FACTS concept and general system considerations. In Understanding FACTS: Concepts and Technology of Flexible AC Transmission Systems; John Wiley & Sons, Inc.: Hoboken, NJ, USA, 2000; pp. 1–35. [Google Scholar]
- Song, Y.H.; Johns, A. Flexible ac transmission systems (FACTS); Institution of Engineering and Technology (IET): Stevenage, UK, 1999. [Google Scholar]
- Xiao, Y.; Song, Y.; Liu, C.C.; Sun, Y.Z. Available transfer capability enhancement using FACTS devices. IEEE Trans. Power Syst. 2003, 18, 305–312. [Google Scholar] [CrossRef]
- Chansareewittaya, S.; Jirapong, P. Power transfer capability enhancement with multitype FACTS controllers using hybrid particle swarm optimization. Electr. Eng. 2015, 97, 119–127. [Google Scholar] [CrossRef]
- Chansareewittaya, S.; Jirapong, P. Optimal allocation of multi-type FACTS controllers for total transfer capability enhancement using hybrid particle swarm optimization. In Proceedings of the 2014 11th IEEE International Conference on Electrical Engineering/Electronics, Computer, Telecommunications and Information Technology (ECTI-CON), Nakhon Ratchasima, Thailand, 14–17 May 2014; pp. 1–6.
- Ahmad, S.; Albatsh, F.M.; Mekhilef, S.; Mokhlis, H. Fuzzy based controller for dynamic Unified Power Flow Controller to enhance power transfer capability. Energy Convers. Manag. 2014, 79, 652–665. [Google Scholar] [CrossRef]
- Nireekshana, T.; Rao, G.K.; Raju, S.S.N. Enhancement of ATC with FACTS devices using real-code genetic algorithm. Int. J. Electr. Power Energy Syst. 2012, 43, 1276–1284. [Google Scholar] [CrossRef]
- Esmaeili, A.; Esmaeili, S. A new multiobjective optimal allocation of multitype FACTS devices for total transfer capability enhancement and improving line congestion using the harmony search algorithm. Turk. J. Electr. Eng. Comput. Sci. 2013, 21, 957–979. [Google Scholar]
- Menniti, D.; Scordino, N.; Sorrentino, N. A new method for SSSC optimal location to improve power system available transfer capability. In Proceedings of the 2006 IEEE PES Power Systems Conference and Exposition, Atlanta, GA, USA, 29 October–1 November 2006; pp. 938–945.
- Kumar, A.; Kumar, J. ATC determination with FACTS devices using PTDFs approach for multi-transactions in competitive electricity markets. Int. J. Electr. Power Energy Syst. 2013, 44, 308–317. [Google Scholar] [CrossRef]
- Rao, M.V.; Sivanagaraju, S.; Suresh, C.V. Available transfer capability evaluation and enhancement using various FACTS controllers: Special focus on system security. Ain Shams Eng. J. 2016, 7, 191–207. [Google Scholar]
- Albatsh, F.M.; Mekhilef, S.; Ahmad, S.; Mokhlis, H.; Hassan, M. Enhancing power transfer capability through flexible AC transmission system devices: A review. Front. Inf. Technol. Electr. Eng. 2015, 16, 658–678. [Google Scholar] [CrossRef]
- Rodger, J.A. A fuzzy nearest neighbor neural network statistical model for predicting demand for natural gas and energy cost savings in public buildings. Expert Syst. Appl. 2014, 41, 1813–1829. [Google Scholar] [CrossRef]
- Verma, K.; Singh, S.; Gupta, H. FACTS devices location for enhancement of total transfer capability. In Proceedings of the 2001 IEEE Power Engineering Society Winter Meeting, Columbus, OH, USA, 28 January–1 February 2001; Volume 2, pp. 522–527.
- Bhesdadiya, R.H.; Patel, R.M. Review of available transfer capability calculation methods. In Proceedings of the 2015 IEEE International Conference on Electrical, Electronics, Signals, Communication and Optimization (EESCO), Visakhapatnam, India, 24–25 January 2015; pp. 1–6.
- Divan, D.; Brumsickle, W.; Schneider, R.; Kranz, B.; Gascoigne, R.; Bradshaw, D.; Ingram, M.; Grant, I. A distributed static series compensator system for realizing active power flow control on existing power lines. In Proceedings of the 2004 IEEE PES Power Systems Conference and Exposition, New York, NY, USA, 10–13 October 2004; pp. 654–661.
- Ejebe, G.; Wollenberg, B. Automatic contingency selection. IEEE Trans. Power Appar. Syst. 1979, 1, 97–109. [Google Scholar] [CrossRef]
- Besharat, H.; Taher, S.A. Congestion management by determining optimal location of TCSC in deregulated power systems. Int. J. Elect. Power Energy Syst. 2008, 30, 563–568. [Google Scholar] [CrossRef]
- Ou, Y.; Singh, C. Improvement of total transfer capability using TCSC and SVC. In Proceedings of the 2001 IEEE Power Engineering Society Summer Meeting, Vancouver, BC, Canada, 15–19 July 2001; Volume 2, pp. 944–948.
- Subcommittee, P.M. IEEE reliability test system. IEEE Trans. Power Appar. Syst. 1979, 6, 2047–2054. [Google Scholar] [CrossRef]
- Ferrero, R.; Shahidehpour, S.; Ramesh, V. Transaction analysis in deregulated power systems using game theory. IEEE Trans. Power Syst. 1997, 12, 1340–1347. [Google Scholar] [CrossRef]
- Bills, G. On-Line Stability Analysis Study, RP 90-1; Technical Report; North American Rockwell Information Systems Co.: Anaheim, CA, USA, 1970. [Google Scholar]
- Wood, A.J.; Wollenberg, B.F. Power Generation, Operation, and Control; John Wiley & Sons: Hoboken, NJ, USA, 2012. [Google Scholar]


| Cases | Basecase | Max. without FACTS | Max. with FACTS | ||||
|---|---|---|---|---|---|---|---|
| MW | Mvar | MW | Mvar | MW | Mvar | ||
| Generation | Area1 | 344.00 | 37.13 | 344.00 | 37.13 | 372.10 | 66.05 |
| Area2 | 240.00 | 51.84 | 240.00 | 51.84 | 259.60 | 62.16 | |
| Area3 | 847.20 | 241.86 | 847.20 | 241.86 | 822.90 | 302.89 | |
| Area4 | 1470.00 | 256.54 | 1470.10 | 256.54 | 1590.10 | 296.26 | |
| Generation increase | 122.40 | 139.99 | |||||
| Load | Area1 | 705.00 | 144.00 | 705.00 | 144.00 | 745.87 | 152.34 |
| Area2 | 627.00 | 128.00 | 627.00 | 128.00 | 668.03 | 136.42 | |
| Area3 | 768.00 | 156.00 | 768.00 | 156.00 | 793.25 | 161.15 | |
| Area4 | 750.00 | 152.00 | 750.00 | 152.00 | 750.00 | 152.00 | |
| Load increase | 107.15 | 21.90 | |||||
| Losses | 51.25 | 454.77 | 51.25 | 454.77 | 66.535 | 566.74 | |
| Cases | TTC without FACTS (MW) | TTC with FACTS (MW) | ||||||
|---|---|---|---|---|---|---|---|---|
| Areas | A1 | A2 | A3 | A4 | A1 | A2 | A3 | A4 |
| TTC | 0 | 0 | 0 | 0 | 40.87 | 41.03 | 25.25 | 0 |
| Case | without FACTS | with FACTS | ||||
|---|---|---|---|---|---|---|
| Normal | 0.00 | limiting | 316.39 | , & limiting | ||
| outage | 126.49 | 0.00 | 206.21 | 206.21 | ||
| outage | 0.00 | 332.79 | ||||
| Normal | 0.00 | & limiting | 316.39 | , & limiting | ||
| outage | 135.06 | 0.00 | 218.13 | 218.13 | ||
| outage | 0.00 | 316.39 | ||||
| Normal | 0.00 | limiting | 316.39 | , limiting | ||
| outage | 48.91 | 0.00 | 256.92 | 256.92 | ||
| outage | 0.00 | 316.39 | ||||
| Cases | Area | Base Case | Max. without FACTS | Max. with FACTS | |||
|---|---|---|---|---|---|---|---|
| P (MW) | Q (Mvar) | P (MW) | Q (Mvar) | P (MW) | Q (Mvar) | ||
| Generation | Area1 | 86.94 | 31.00 | 111.02 | 44.55 | 113.50 | 49.30 |
| Area2 | 56.20 | 19.30 | 78.03 | 27.26 | 78.65 | 28.41 | |
| Area3 | 48.50 | 50.11 | 66.25 | 71.11 | 67.88 | 74.26 | |
| Generation increase | 62.40 | 42.47 | 68.39 | 53.55 | |||
| Load | Area1 | 84.50 | 56.40 | 107.49 | 72.40 | 109.59 | 73.86 |
| Area2 | 56.20 | 25.80 | 75.60 | 34.66 | 77.37 | 35.47 | |
| Area3 | 48.50 | 25.00 | 66.25 | 34.15 | 67.88 | 34.99 | |
| Load increase | 60.14 | 34.01 | 65.64 | 37.12 | |||
| Losses | 2.444 | 8.99 | 4.705 | 17.25 | 5.19 | 25.18 | |
| Cases | TTC without FACTS | TTC with FACTS | ||||
|---|---|---|---|---|---|---|
| Area | A1 | A2 | A3 | A1 | A2 | A3 |
| TTC | 22.99 | 19.40 | 17.75 | 25.09 | 21.17 | 19.38 |
| Case | without FACTS | with FACTS | ||||
|---|---|---|---|---|---|---|
| Normal | 47.0981 | limiting | 56.8185 | limiting | ||
| outage | 40.761 | 40.761 | 54.2404 | 54.2404 | ||
| outage | 47.0981 | 56.8185 | ||||
| outage | 28.6024 | 28.6024 | 51.7638 | 42.79 | ||
| outage | 33.4037 | 42.79 | ||||
| outage | 47.0981 | 30.1398 | 53.8119 | 30.1398 | ||
| outage | 30.1398 | 30.1398 | ||||
| Cases | Area | Base Case | without FACTS | with FACTS | |||
|---|---|---|---|---|---|---|---|
| P (MW) | Q (Mvar) | P (MW) | Q (Mvar) | P (MW) | Q (Mvar) | ||
| Generation | Area1 | 2327.87 | 507.01 | 2375.87 | 712.59 | 2413.50 | 932.10 |
| Area2 | 790.00 | 160.39 | 819.66 | 214.38 | 841.30 | 270.90 | |
| Area3 | 3180.00 | 607.54 | 3299.38 | 832.92 | 3386.60 | 1145.70 | |
| Generation increase | 197.03 | 484.94 | 343.53 | 1073.76 | |||
| Load | Area1 | 2384.03 | 720.60 | 2431.74 | 876.29 | 2466.60 | 892.73 |
| Area2 | 1221.60 | 216.30 | 1267.46 | 224.42 | 1301.00 | 230.35 | |
| Area3 | 2648.60 | 450.20 | 2748.03 | 658.42 | 2820.70 | 675.83 | |
| Load increase | 193.00 | 372.04 | 334.07 | 411.81 | |||
| Losses | 43.641 | 1000.59 | 47.675 | 1090.92 | 43.495 | 1120.1 | |
| Cases | TTC without FACTS | TTC with FACTS | ||||
|---|---|---|---|---|---|---|
| Areas | A1 | A2 | A3 | A1 | A2 | A3 |
| TTC (MW) | 47.71 | 45.86 | 99.43 | 82.56 | 79.36 | 172.07 |
| Case | TTC (MW) without FACTS | TTC (MW) with FACTS | ||||
|---|---|---|---|---|---|---|
| Normal | 119.02 | limiting | 128.17 | limiting | ||
| 119.02 | 107.80 | 128.17 | 128.17 | |||
| outage | 107.80 | 128.17 | ||||
| outage | 107.802 | 0.538 | 592.48 | 128.17 | ||
| outage | 0.538 | , , | 137.15 | |||
| outage | 119.02 | 7.59 | 128.17 | 10.21 | ||
| outage | 7.59 | , , | 10.21 | |||
© 2016 by the authors; licensee MDPI, Basel, Switzerland. This article is an open access article distributed under the terms and conditions of the Creative Commons Attribution (CC-BY) license (http://creativecommons.org/licenses/by/4.0/).
Share and Cite
Ullah, I.; Gawlik, W.; Palensky, P. Analysis of Power Network for Line Reactance Variation to Improve Total Transmission Capacity. Energies 2016, 9, 936. https://doi.org/10.3390/en9110936
Ullah I, Gawlik W, Palensky P. Analysis of Power Network for Line Reactance Variation to Improve Total Transmission Capacity. Energies. 2016; 9(11):936. https://doi.org/10.3390/en9110936
Chicago/Turabian StyleUllah, Ikram, Wolfgang Gawlik, and Peter Palensky. 2016. "Analysis of Power Network for Line Reactance Variation to Improve Total Transmission Capacity" Energies 9, no. 11: 936. https://doi.org/10.3390/en9110936