Article

Design and Output Performance Model of Turbodrill Blade Used in a Slim Borehole

1
School of Engineering and Technology, China University of Geosciences, Beijing 100083, China
2
China Railway Rolling stock Corporation (CRRC), Beijing Locomotive Co., Ltd., Beijing 100072, China
*
Authors to whom correspondence should be addressed.
Energies 2016, 9(12), 1035; https://doi.org/10.3390/en9121035
Submission received: 1 September 2016 / Revised: 10 November 2016 / Accepted: 30 November 2016 / Published: 8 December 2016

Abstract

:
Small-diameter turbodrills have great potential for use in slim boreholes because of their lower cost and higher efficiency when used in geothermal energy and other underground resource applications. Multistage hydraulic components consisting of stators and rotors are key aspects of turbodrills. This study aimed to develop a suitable blade that can be used under high temperature in granite formations. First, prediction models for single- and multi-stage blades were established based on Bernoulli’s Equation. The design requirement of the blade for high-temperature geothermal drilling in granite was proposed. A Φ89 blade was developed based on the dimensionless parameter method and Bezier curve; the parameters of the blade, including its radial size, symotric parameters, and blade profiles, were input into ANASYS and CFX to establish a calculation model of the single-stage blade. The optimization of the blade structure of the small-diameter turbodrill enabled a multistage turbodrill model to be established and the turbodrill’s overall output performance to be predicted. The results demonstrate that the design can meet the turbodrill’s performance requirements and that the multistage model can effectively improve the accuracy of the prediction.

1. Introduction

High dry rock (HDR) [1] can be directly extracted to obtain hot steam and water that can be used to generate clean energy [2]. Tibet, Yunnan, Hainan, and the northeast and southeast coastal areas of China have a large amount of hot dry rock geothermal resources. Because small-diameter drilling can greatly reduce the labor intensity and cost of extracting such resources, such drilling can be regarded as a potential method for use in geothermal exploration [3]. HDR primarily consists of igneous or metamorphic rocks of high hardness and poor drillability, such as granite and gneiss; the temperature of a high-temperature geothermal reservoir is typically greater than 200 °C and can even reach 500 °C. When drilling a slim hole using a conventional drill, the amount of borehole friction is excessively high, thus making it difficult to pass the power to the bottom [4]. The common screw drill cannot be used under conditions of high temperature [5] with large rotational vibration. Practical work shows that an all-metal turbine drill with impregnated diamond bits [6] has good temperature adaptability and high efficiency in terms of the hard rock formations [7]. The first application of turbodrills and hybrid bits for drilling cretaceous formations with high chert content was reported in the south Mexico region [8].
A turbine is made of several stages. Each stage is made of one or several rows of blade rings [9], which determine the output characteristics of the turbo-drill [10]. The key to success is to match the output characteristics with the formation properties. Therefore, the turbine drill design must first be based on the formation properties based on the appropriate performance indicators that are used to conduct the individual design of the blades. The accuracy of the blade’s design is critical to the success of the turbodrill [11]. Before the manufacture of the turbine blades and its mold, it is particularly important to accurately predict its output performance, which in turn guides the optimization design of the turbine blades.
Many achievements have been made during the century of development of turbodrill technology [12]. Before 2000, the conventional turbine drill size was generally greater than 5″. With the increased implementation of coiled tubing technology [13], the use of small-diameter turbine drills has become a topic of increasing interest after slowly transitioning from use in oil drilling to areas of high-temperature geothermal drilling, among other applications. However, regardless of the specifications of the turbine drill, the blade design and field research have become the main aspects of research on small-diameter turbodrilling.
Jin and Daliang [14] analyzed the influence of the blade profile on the flow parameters of liquid flow and found that the turbine performance is mainly affected by the uncontinuous curvature on the blade profile. Reference [15] detailed the design enhancements made to the turbodrill to establish a shorter tool with more power to address current and future applications. Reference [16] analyzed the applications and developments in turbodrills based on an analysis of recent runs on Coiled Tubing (CT). Ding et al. [17] applied CFX-BladeGen to develop the single-turbine-blade model and performed a numerical simulation calculation for a Φ115 mm turbodrill. Hu et al. [18] analyzed the principle and characteristics of the Bezier curve used in the design of a turbine blade. Reference [19] examined the history of turbodrilling and described a number of the harshest and most complex drilling environments in which turbodrills have been notably successful. Reference [20] described several improvements to the turbodrill design (such as blade design) that have enabled reductions in the tool length, thereby allowing easier rig up for coiled tubing applications. Mokaramian et al. [21] conducted computational fluid dynamics (CFD) simulations to determine the performance of a single-stage turbodrill with different rotation speeds and mass flow rates. The optimum design parameters for achieving the required rotation speed and torque for hard-rock drilling were proposed. In Reference [22], after using Solidworks software to draw the turbine blade profile, Fluentsoftware was used to simulate and analyze the flow field pressure and velocity change of the turbine cascade of the commonly used five-circarc profile and cubic polynomial profile. Hongbo et al. [23] designed a turbodrill blade according to the quintic polynomial and used the Solidworks 3D modeling software and a single-blade model to analyze the hydraulic performances of the turbine blades under different viscosity levels. Zhitao et al. [24] built a single-stage turbodrill model based on CFD software to simulate blade performance at different rotation speeds. Yu et al. [25] built a computational model of a single-stage blade on ANSYS CFD for a Φ127 turbodrill applied in a crystallized section under high-temperature and high-pressure conditions. Miyazaki et al. [26] developed a turbine-driven coring system for use in hard rock. The turbine blade used was the type that provides high-rotation speed without a Leaf crown, and it has been tested on shore. The Φ127 turbine blade was established based on the Bezier curve, experimental design theory, and the response surface method. A single-stage blade simulation model was built to study the performance of the blade [27]. Qiang et al. [28] constructed multiple-sectional linear turbine blades according to five polynomial methods. A single-stage turbine runner mesh model was built to simulate the increase in hydraulic efficiency.
In summary, the current drill turbine blade design is mainly based on the principle of an axial turbine, i.e., the conservation of energy and momentum of the fluid momentum theorem. However, the current design mainly focuses on studying individual single-stage turbine blades. As a result, there are three main aspects to be improved in the design: (1) the drilling mud flow is ignored when using the energy conservation in studying a single-stage blade, without considering the centrifugal field; (2) the interaction between the blades at the same level is ignored when using a variety of curves to design the turbine blades to predict the performance; and (3) it is generally assumed that the energy of each stage is the same regarding the overall performance of the turbine drill, with the predicted performance often based simply on the product of a single-stage turbine performance and the stage under consideration. In fact, each stage of the single-stage blade has a corresponding energy loss, causing the output energy to not be equal to the overall energy input. Based on the aforementioned assumptions, the boundary conditional difference for a small-diameter turbine drill is greater than that for the large-diameter turbine drill because of the small size of its radial and axial pressure drop.
This study aimed to design turbine blades to be used under high-temperature conditions and in hard rock formations. First, prediction models of a single-stage turbine blade and a multi-stage turbine blade were developed based on the modified Bernoulli Equation to overcome the above-described drawbacks, thereby improving the accuracy of the final results. The specifications of the blade were raised based on the hard-rock formation properties of the high-temperature geothermal reservoir. The geometrical parameters and blade profile of a Φ89 mm blade were developed according to the dimensionless coefficient method and Bezier curve design theory; three-dimensional solid modeling of the turbine blades was performed, and then, the modeling results were imported into the ANSYS/CFX module to obtain a single-stage multi-leaf computational runner, thus completing the optimization of the small-diameter turbine blade structure. Finally, a multi-stage turbine simulation model was developed to predict the overall output performance of the turbine drill.

2. Hydrodynamic Model of a Turbodrill Blade

2.1. Hypothesis of the Model

The turbodrill blade is made of a stator and rotor, both of which are axial-flow hydraulic components. Figure 1 shows a single-stage blade; its stator can be tightened by an axial force. Through stator blade 1, the drilling mud can flow and then pass into rotor blade 2; two different movements occur during this process: circular and relative movement. Rotation shaft 3 and the stator can output the torque at high speed. An overall turbine section is formed through a series of connections between the multi-stage turbodrill blades.
As shown in Figure 1, the fluid into the turbine will flow between the surfaces of the two cylinders with R1 and R2. However, each fluid mass point has one distance to the axial line, resulting in different interactions between the blades and the relative velocity of the fluid. Therefore, there is one structural characteristic cylindrical surface with diameter R among the cylinders, whose velocity is assumed to be the mean of the overall system. The energy accumulated by motion at this velocity can represent the overall rotational kinetic energy. Based on the element theory method (ETM), the mean diameter is given by:
R = 2 3 R 1 3 R 2 3 R 1 2 R 2 2
The model is established based on the Euler equation and the following assumptions: (1) the fluid is a Newtonian fluid; (2) the blade is infinitely thin; and (3) no flow loss and fluid compression loss out of the stator cylinder occur. Based on these assumptions, the drilling fluid can flow in accordance with the blade’s requirements without friction loss.

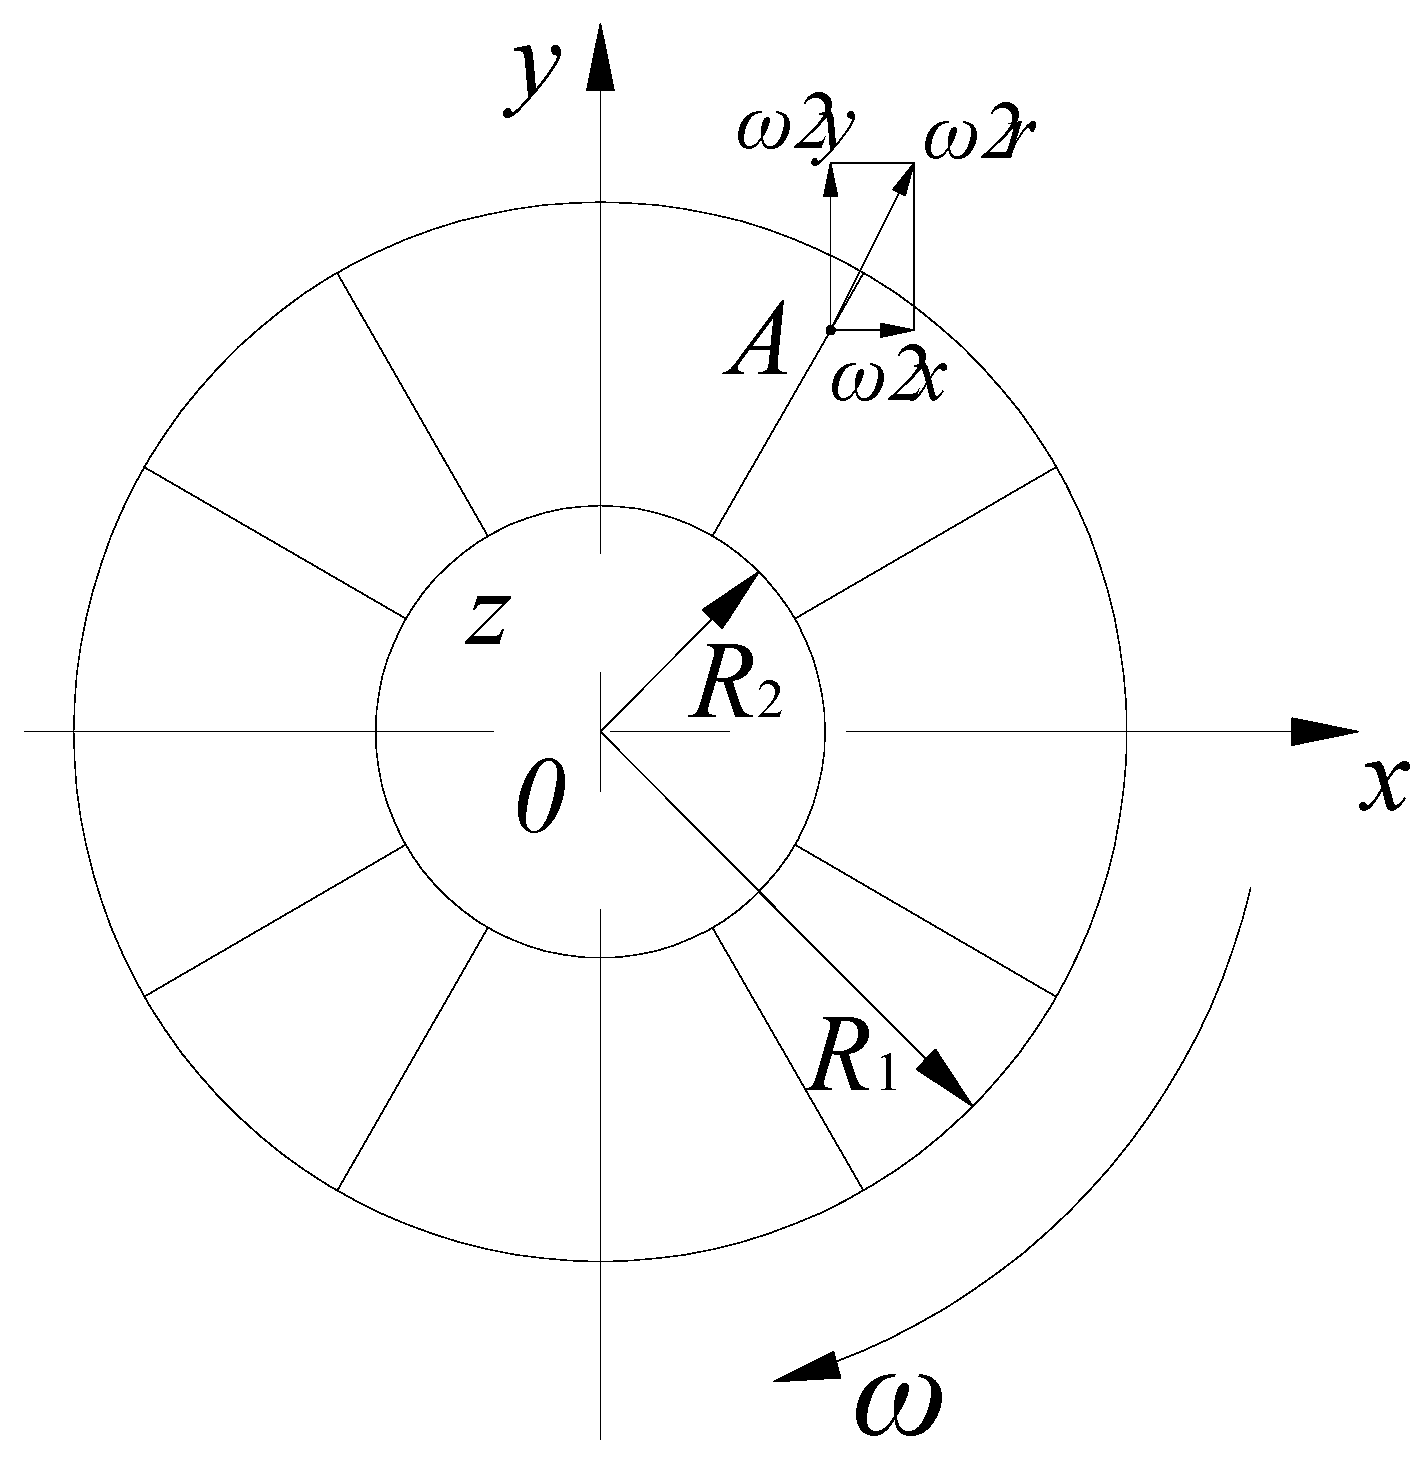
2.2. Inertial Force Field

The kinetic energy and pressure energy of the drilling fluid will be transformed and redistributed into mechanical energy during operation through the turbodrill blade, thereby producing the output driven energy of the rotation shaft. In the results of previous studies [25], the influence of the rotor due to rotation motion is ignored; however, in practice, the drilling fluid is influenced by not only gravity but also the centrifugal force, as shown in Figure 2. The three dimensional coordinate system is built to describe the force analysis of the drilling mud, shown as Figure 2. According to the actual flow state of drilling fluid, centrifugal force is in the plane of coordinates XOY, and the direction of the gravity is the same as the direction of the coordinate Z. As a result, the energy from the centrifugal force should be included in Bernoulli’s Equation. The actual inertial force field is shown in Figure 2.
Here, we assume that the turbodrill blade will maintain a stable rotation speed during drilling operation. The rotating turbodrill blade is chosen as the reference system, in which the drilling fluid is relatively constant. Select point A on one streamline of the drilling mud with diameter r, on which the gravity and inertial centrifugal force are exerted. Its components along the x-, y-, and z-axes are, respectively:
{ X = ω 2 x Y = ω 2 y Z = g
Accordingly, the definition of potential function produced by mass can be expressed by the formula:
W = d w = X d x + Y d y + Z d z = 1 2 ω 2 r 2 g z
Combining the potential function produced by mass shown in Equation (3) and the Bernoulli equation, in the rotating environment, the Bernoulli equation for the unit weight of drilling mud is expressed as:
z + p ρ g + u 2 2 g ω 2 r 2 2 g = C

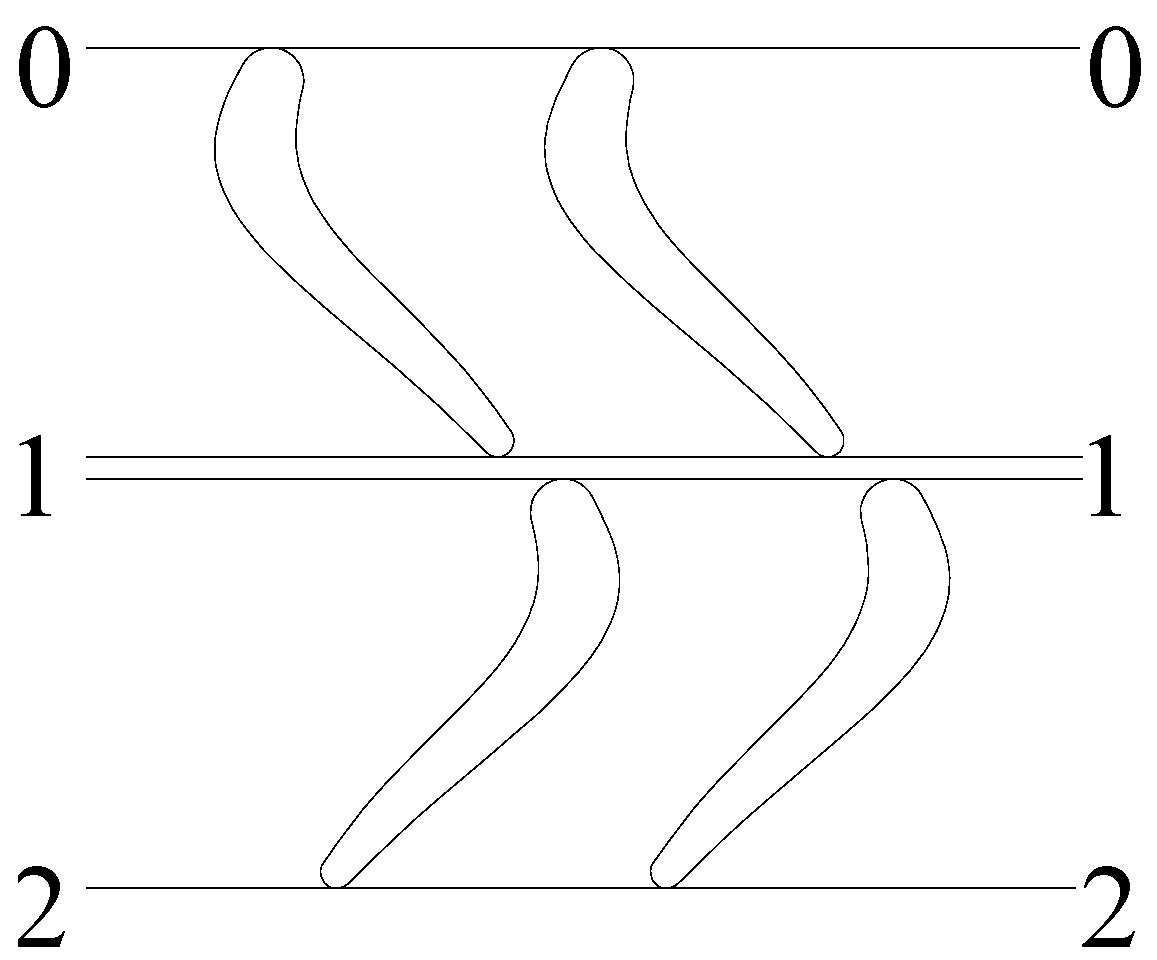
2.3. Energy Transformation Model

To better illustrate the three-dimensional fluid flow, the structural characteristic surface of the drilling mud is expanded into a 2-dimensional map. As shown in Figure 3, the cross-line of the stator and rotor represents the section of a certain position of the blade. The flow routine can be divided into two parts: one is from stator entrance 0-0 to stator exit 1-1 (which is used to guide the drilling fluid), and the other is from rotor entrance 1-1 to rotor exit 2-2 (which is used to drive the rotation shaft).
For the first-stage stator, the pressure energy of the fluid will be transformed into kinetic energy and partial hydraulic loss because of the lack of mechanical energy output. There is a hydraulic loss during this process.According to Bernoulli’s equation, the energy at the input and output of the turbodrill stator is given by:
{ E 0 = p 0 ρ g + c 0 2 2 g + z 0 E 1 = p 1 ρ g + c 1 2 2 g + z 1 E 0 = E 1 + h h s 1
For the first-stage rotor, the majority of the energy will be transformed into mechanical energy and hydraulic loss because of the mechanical rotation energy output. The flow of drilling fuild is not only affected by gravity, but also by the centrifugal force. According to Bernoulli’s equation, the energy at the input and output of the turbodrill rotor is given by:
{ E 1 = p 1 ρ g + c 1 2 2 g + z 1 E 2 = p 2 ρ g + c 2 2 2 g + z 2 ω 2 R 2 2 g E 1 = E 2 + h h r 1
According to the Equations (5) and (6), the pressure energy of the stator and rotor and the overall loss of the first-stage stator and rotor can be written as follows:
{ Δ p s 1 ρ g = p 0 p 1 ρ g = c 1 2 c 0 2 2 g + ( z 1 z 0 ) + h h s 1 Δ p r 1 ρ g = p 1 p 2 ρ g = c 2 2 c 1 2 2 g + ( z 2 z 1 ) + h h r 1 ω 2 R 2 2 g Δ p s 1 ρ g + Δ p r 1 ρ g = c 2 2 c 0 2 2 g + ( z 2 z 0 ) + ( h h s 1 + h h r 1 ) ω 2 R 2 2 g
Although the flow of each stage turbine is of the same structure and equal length and has approximately the same flow rate and flow behavior, energy loss occurs in different stage turbines, causing the absolute output velocity to be less than the input velocity in practice.
Based on Equation (7), the mechanical energy loss in the first stage can be described by the following formula:
( h h s 1 + h h r 1 ) = ( Δ p s 1 ρ g + Δ p r 1 ρ g ) + c 0 2 c 2 2 2 g + ( z 0 z 2 ) + ω 2 R 2 2 g
Repeating the procedure described above, the overall mechanical energy loss of the multi-stage turbines can be written as:
i = 1 Z ( h h s i + h h r i ) = Δ p + c 0 2 c Z 2 2 g + ( z 0 z Z ) + Z ω 2 R 2 2 g
For the single-stage turbine, the torque of the blade in the stator is equal to the torque in the flow aisle but with opposite direction. Therefore, the torque can be obtained by considering the flow law of the fluid between the two blades. According to the theorem of the moment of momentum, the torque of the first stage turbine and the main axis is calculated as:
M 1 = ρ Q i R ( c 1 cos α 1 c 2 cos α 2 ) = ρ Q i R ( c 1 u c 2 u )
The output torque on the rotation shaft driven by the i-th-stage turbine is calculated as:
M i = ρ Q i R ( c ( 2 i 1 ) cos α ( 2 i 1 ) c ( 2 i ) cos α ( 2 i ) ) = ρ Q i R ( c ( 2 i 1 ) u c ( 2 i ) u )
The transfer power consumption of the i-th-stage turbine blade is calculated as:
N i = M i ω = ρ Q i R ω ( c ( 2 i 1 ) cos α ( 2 i 1 ) c ( 2 i ) cos α ( 2 i ) ) = ρ Q i R ω ( c ( 2 i 1 ) u c ( 2 i ) u )
The torque of the multi-stage turbine (assuming the series is Z) is the sum of the torque of each single-stage; thus, the total output torque of the rotation shaft is given by:
{ M = ρ Q i R i = 1 Z ( c ( 2 i 1 ) u c ( 2 i ) u ) N = ρ Q i R ω i = 1 Z ( c ( 2 i 1 ) u c ( 2 i ) u )
In comparison to Equation (13), the result is smaller than that calculated from the sum of the first single-stage turbine because the fluid has less energy. The method of collaborative simulation of the multi-stage turbine blades is important in predicting the performance of the turbine drill.

3. Design of the Turbodrill

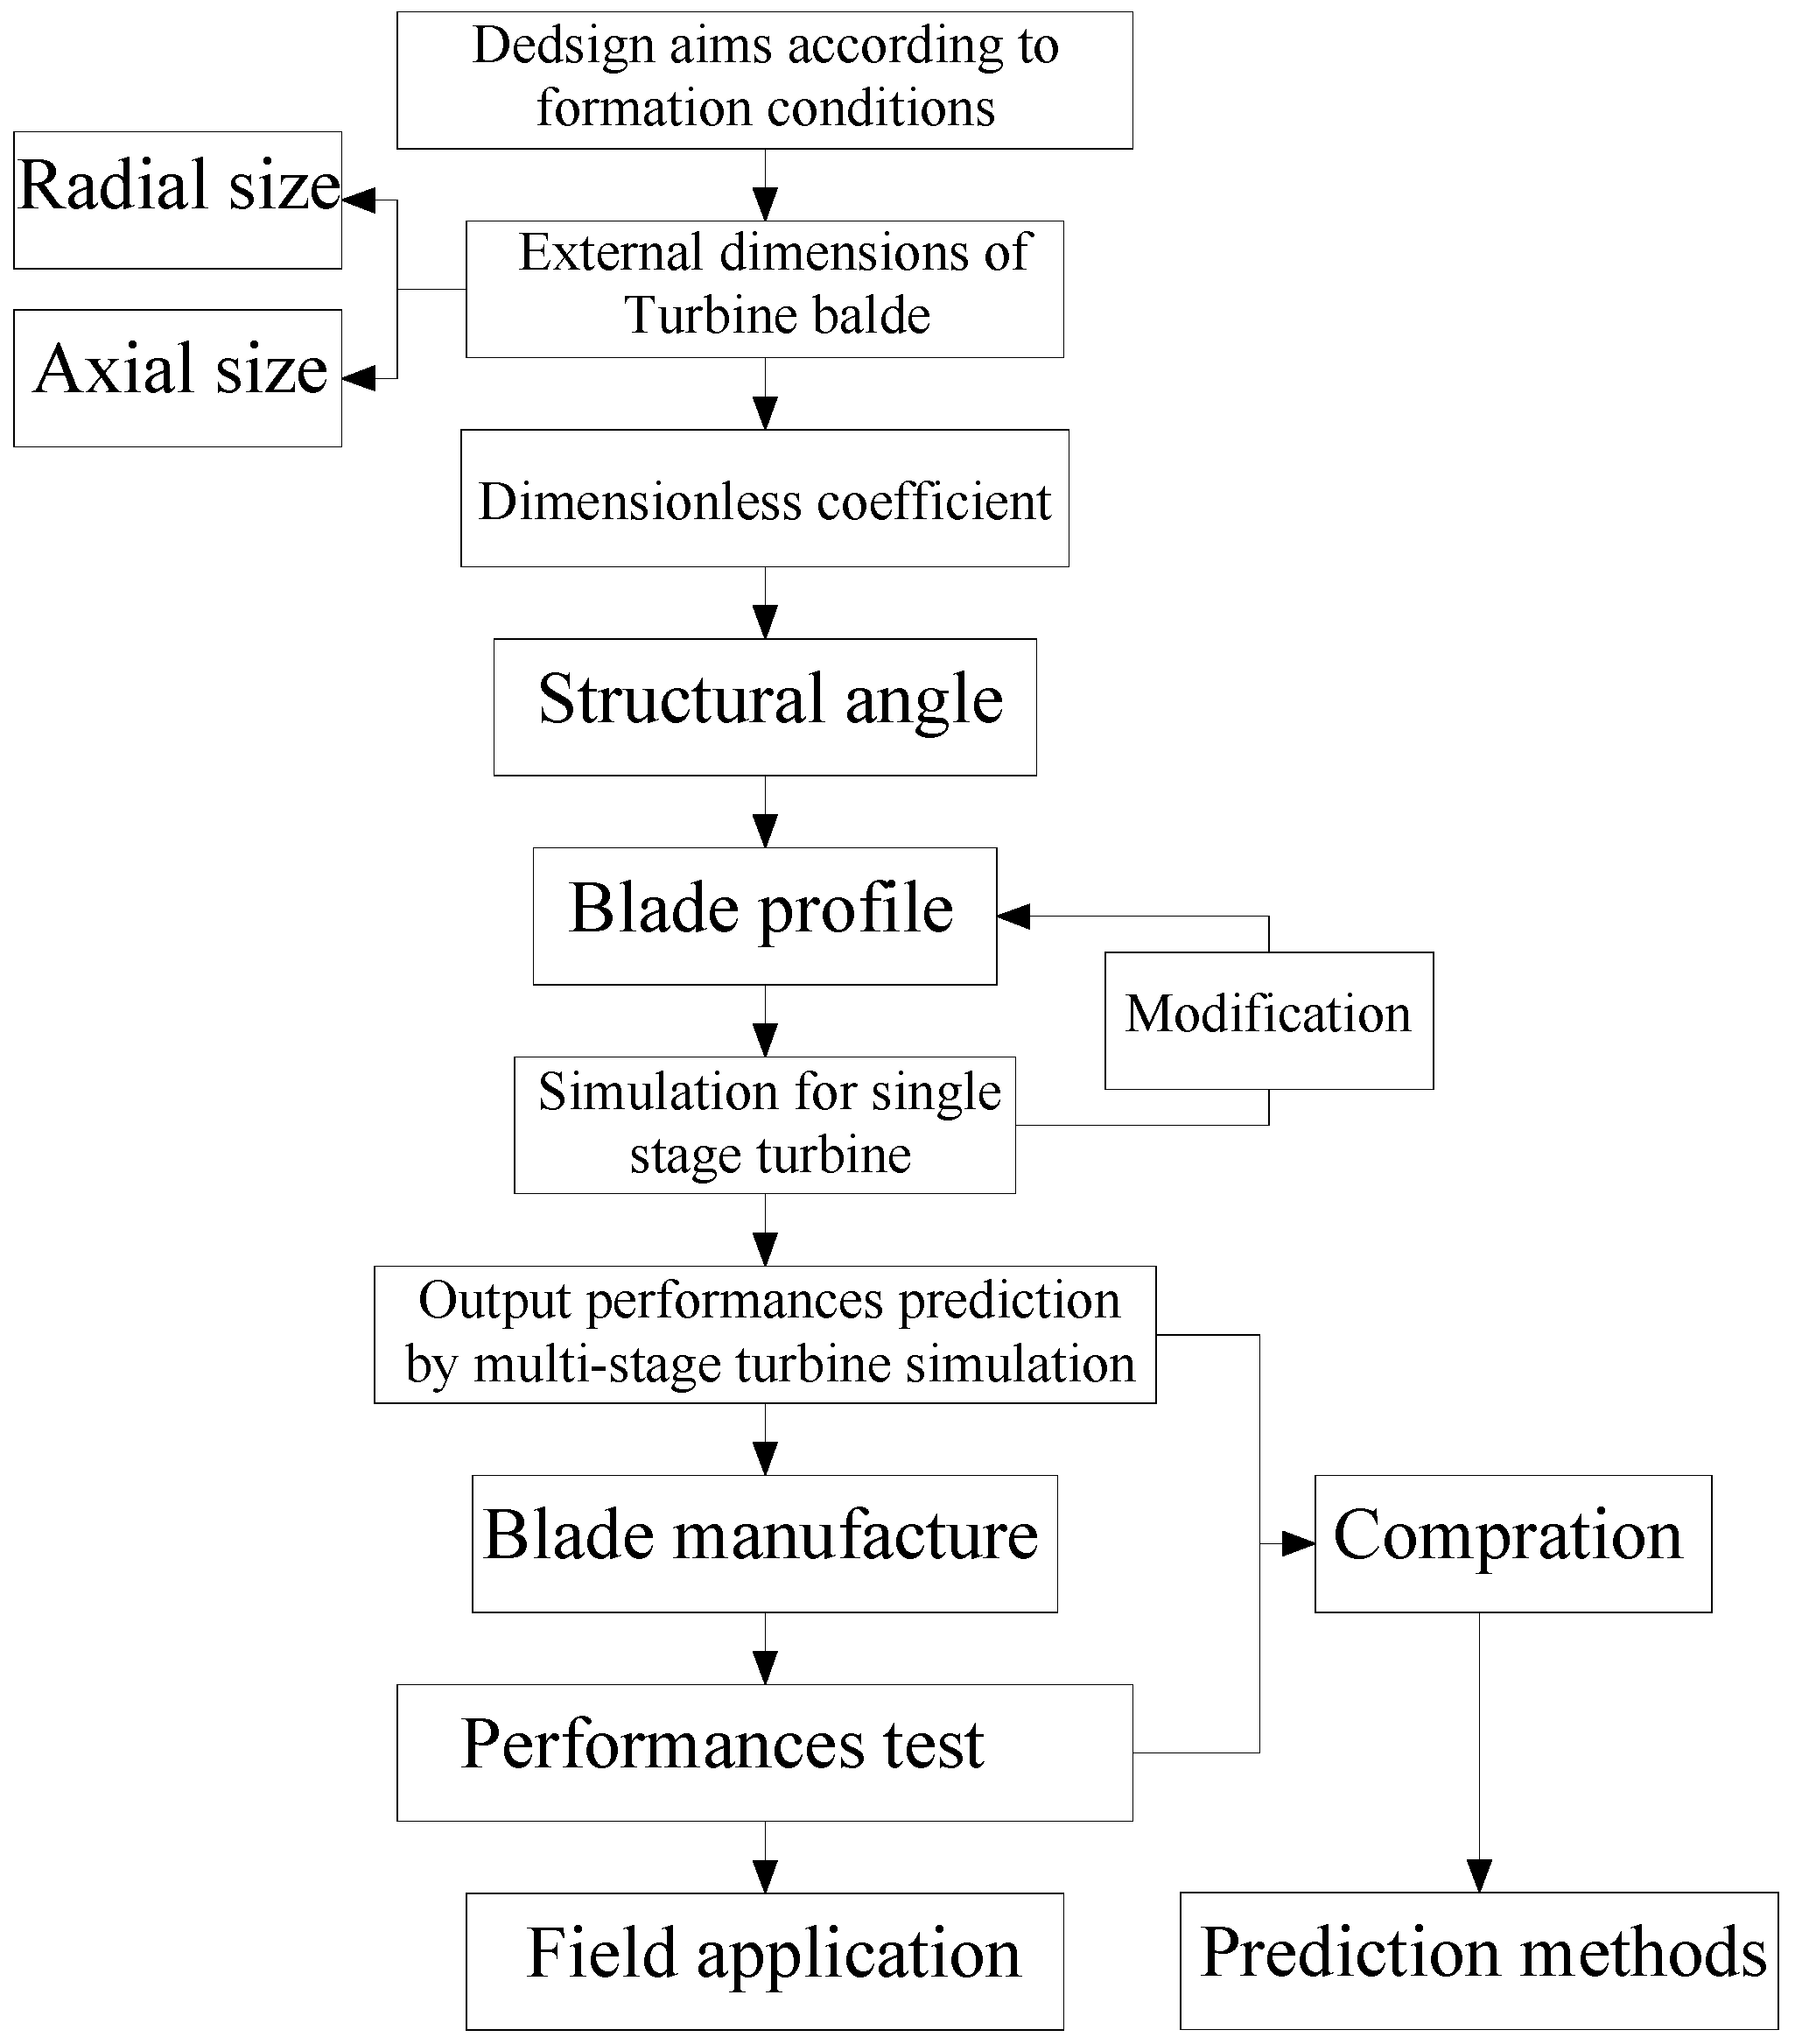
3.1. Design Process of the Turbodrill Blade

With the impregnated diamond bit, the Φ89 turbine is intended for drilling hot crystalline rock formations, for which the rock drillability classification number is from 7 to 8. The maximum downhole temperature is 120 °C. Table 1 shows the functional parameters of the turbine.
The blade design includes its structure and profile designs, which are keys to the design of the turbine drill. As shown in Figure 4, the radial and axial size are determined based on the formation properties and rock drillability. The dimensionless coefficient design method [25] was used to determine the blade’s entrance and exit structural angles. The method of Bezier curve modeling was used to design the corresponding blade profile, and a single-stage blade simulation was used to conduct the partial correction; the simulation was conducted on the multi-stage blade, whose outcomes were used to forecast the turbodrill overall performance. The final modified turbine blades were manufactured to be used in the field test.

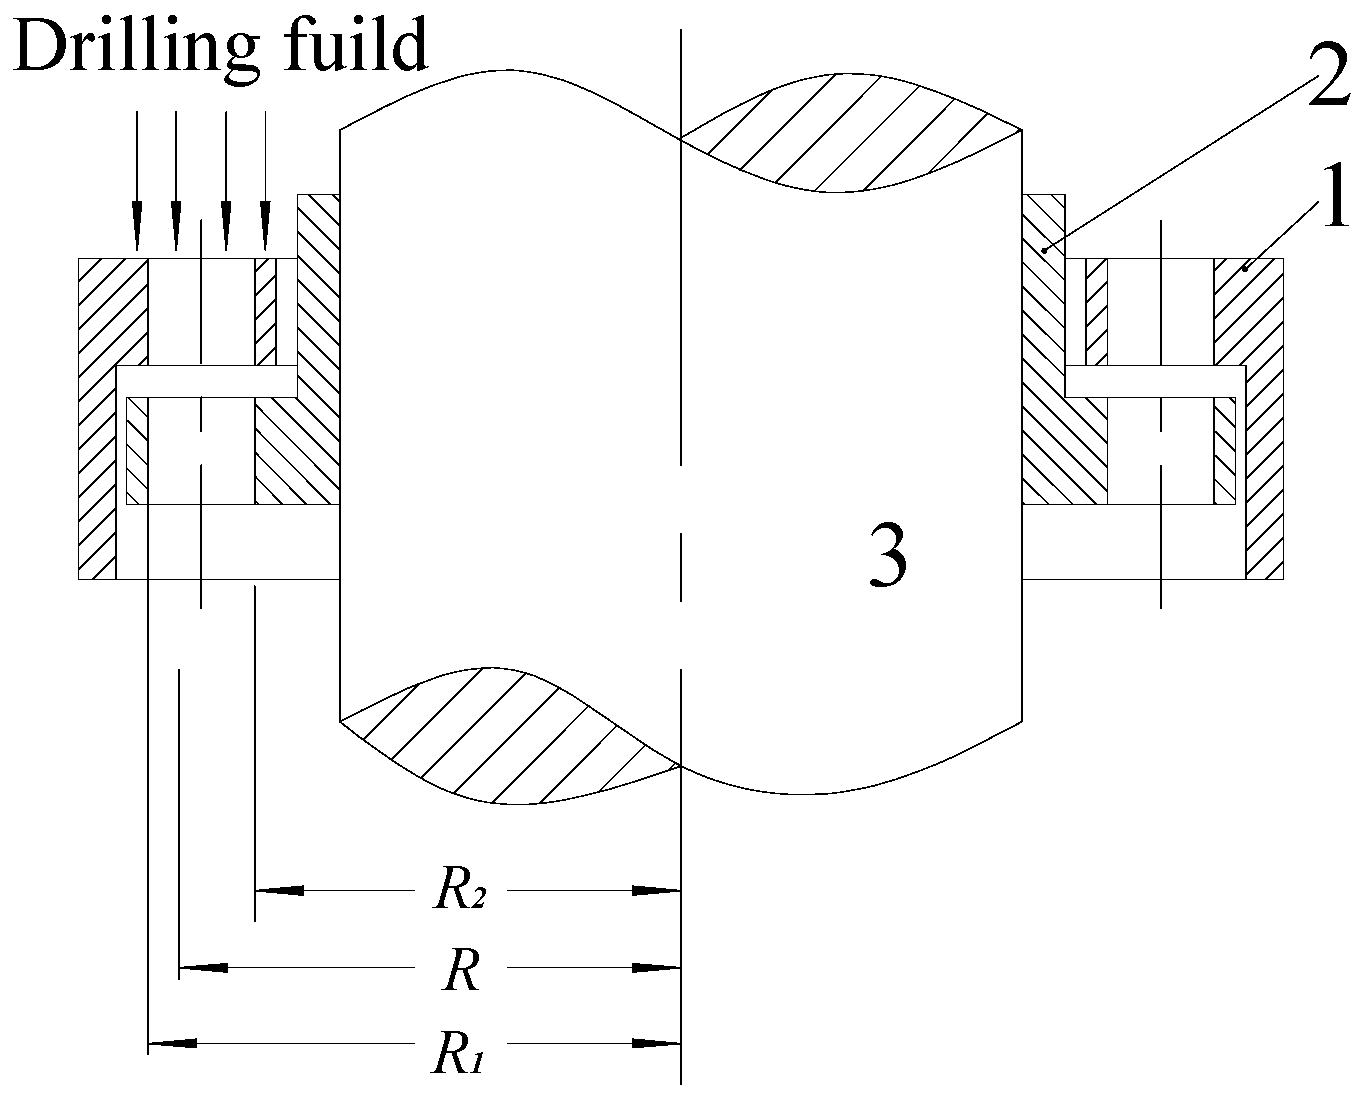
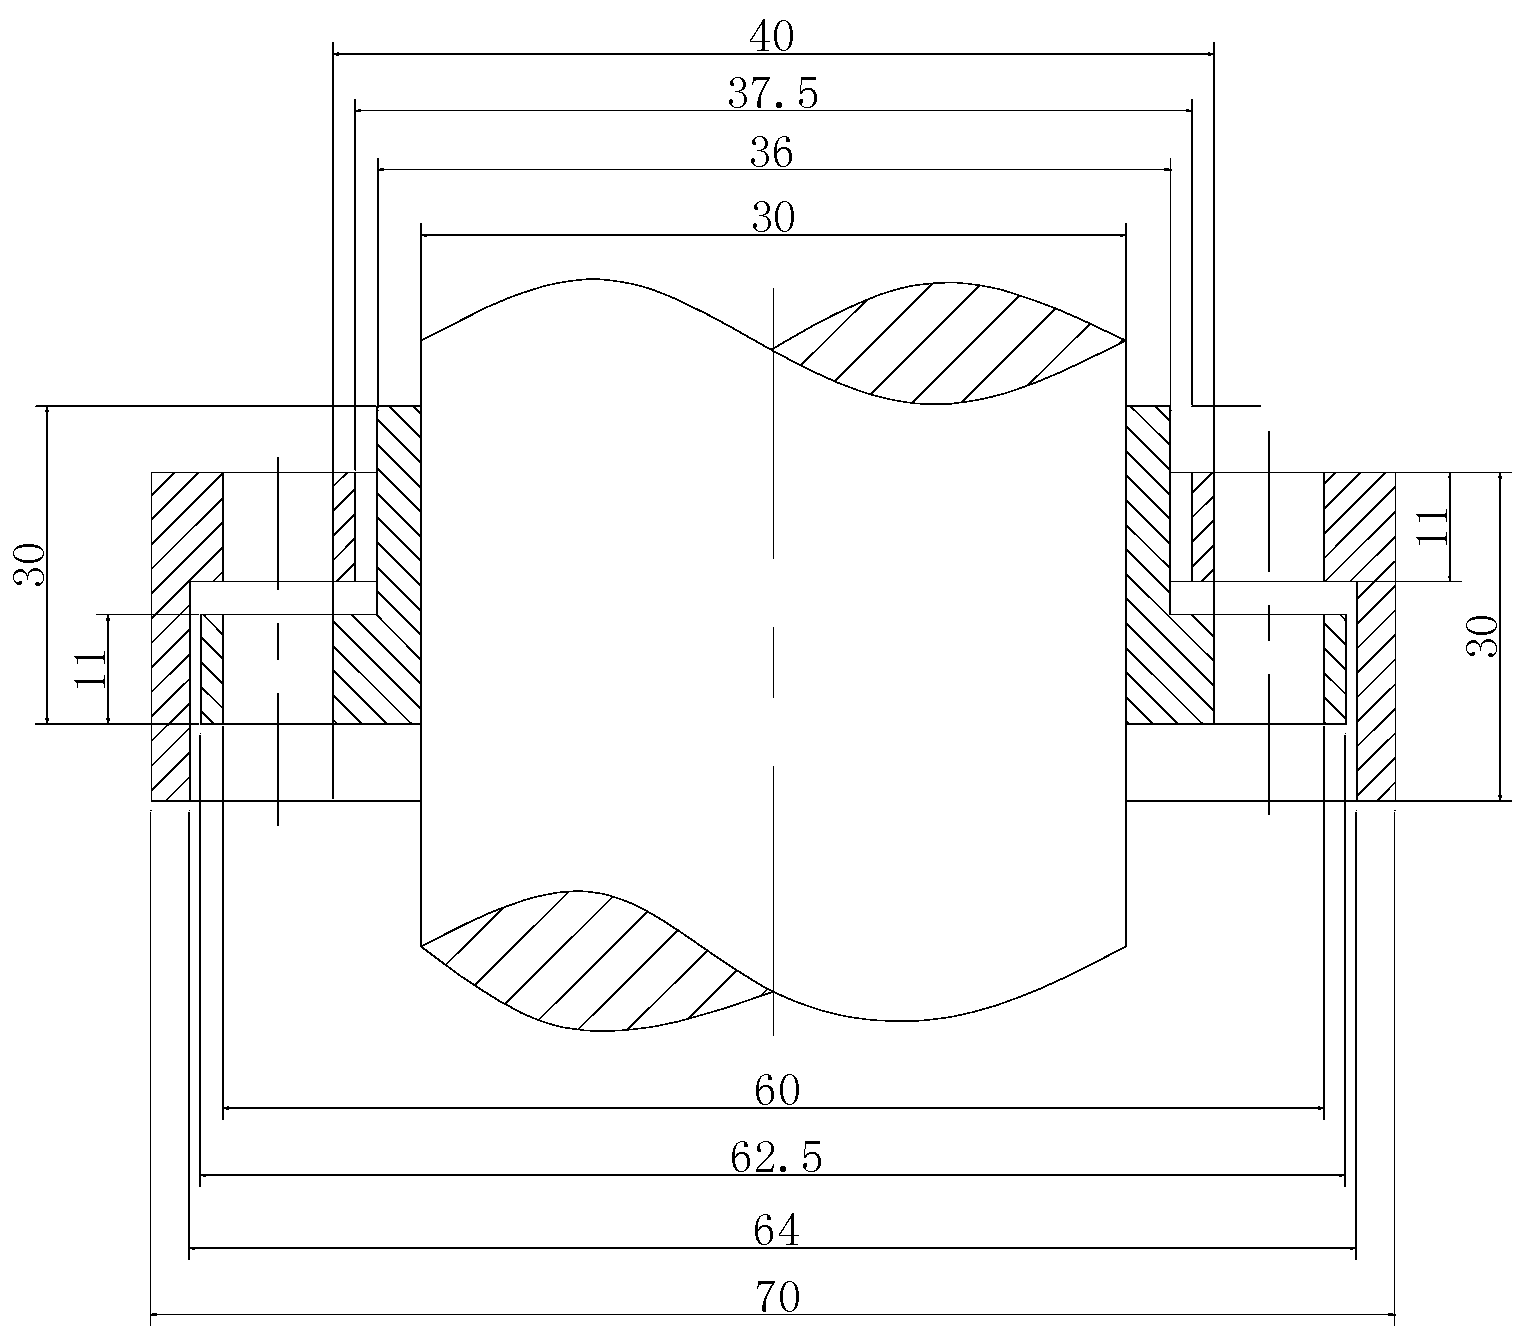
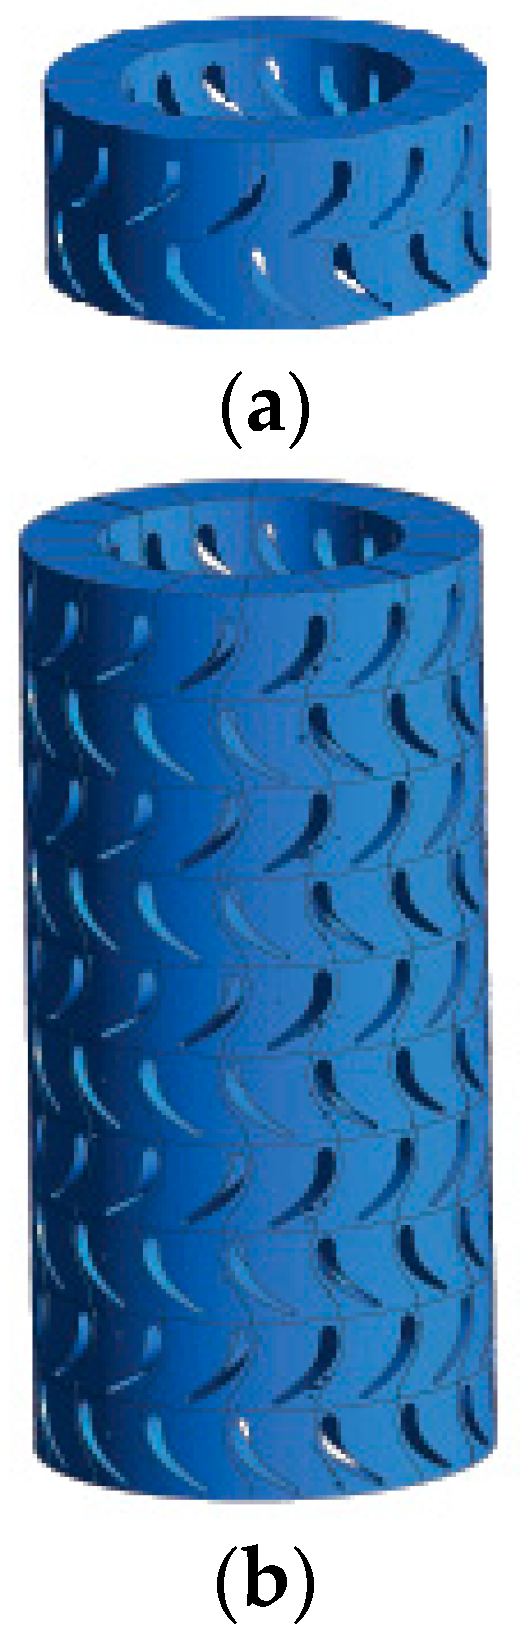
3.2. Structure Design of the Turbodrill Blade

The design of the turbine blades includes the outer cylinder turbodrill size and the radial and axial sizes of the turbine; the parameters involved in the design must be checked. The design principle is to maximize the flow area (orifice area) while ensuring adequate structural strength, thereby improving the output mechanical energy. The outer turbodrill cylinder is made of special steel for the drilling tool with an outer diameter of Φ89 mm, and the shell thickness is 8 mm. For the shell material, 40CrMo, which has high mechanical properties and better heat-treated properties, is selected.
The rotation shaft is a solid axis for bearing the drill bit torque, rotor torque, and axial weight on bit (WOB). The rotor’s inner diameter determines the shaft diameter, both of which work through the clearance fit. The solid shaft torsional stress suffered should be less than the allowable twisting stress. The axial loads suffered should meet the column stability conditions. The rotation shaft can be considered as the compressive column under the bit’s weight. The axial load of rotation shaft should meet the stability of column, and the stress should satisfy the formulas, σ = P φ A = 4 P φ π d 2 σ p . The diameter should be larger than the maximum diameter calculated by different demands:
d M a x { [ S ] T [ τ ] 3 , 4 P φ π σ p 2 }
The radial size of the turbodrill blade is excessively large. Considering the casting difficulty and strength, the radial thickness of the thinnest part is 1.25 to 3 mm. To prevent interference between the static and dynamic components and considering the precision, the clearance between the stator parts and rotor is selected to be 0.75 to 1.25 mm. Figure 5 shows the partial design parameters and radial sizes selected.

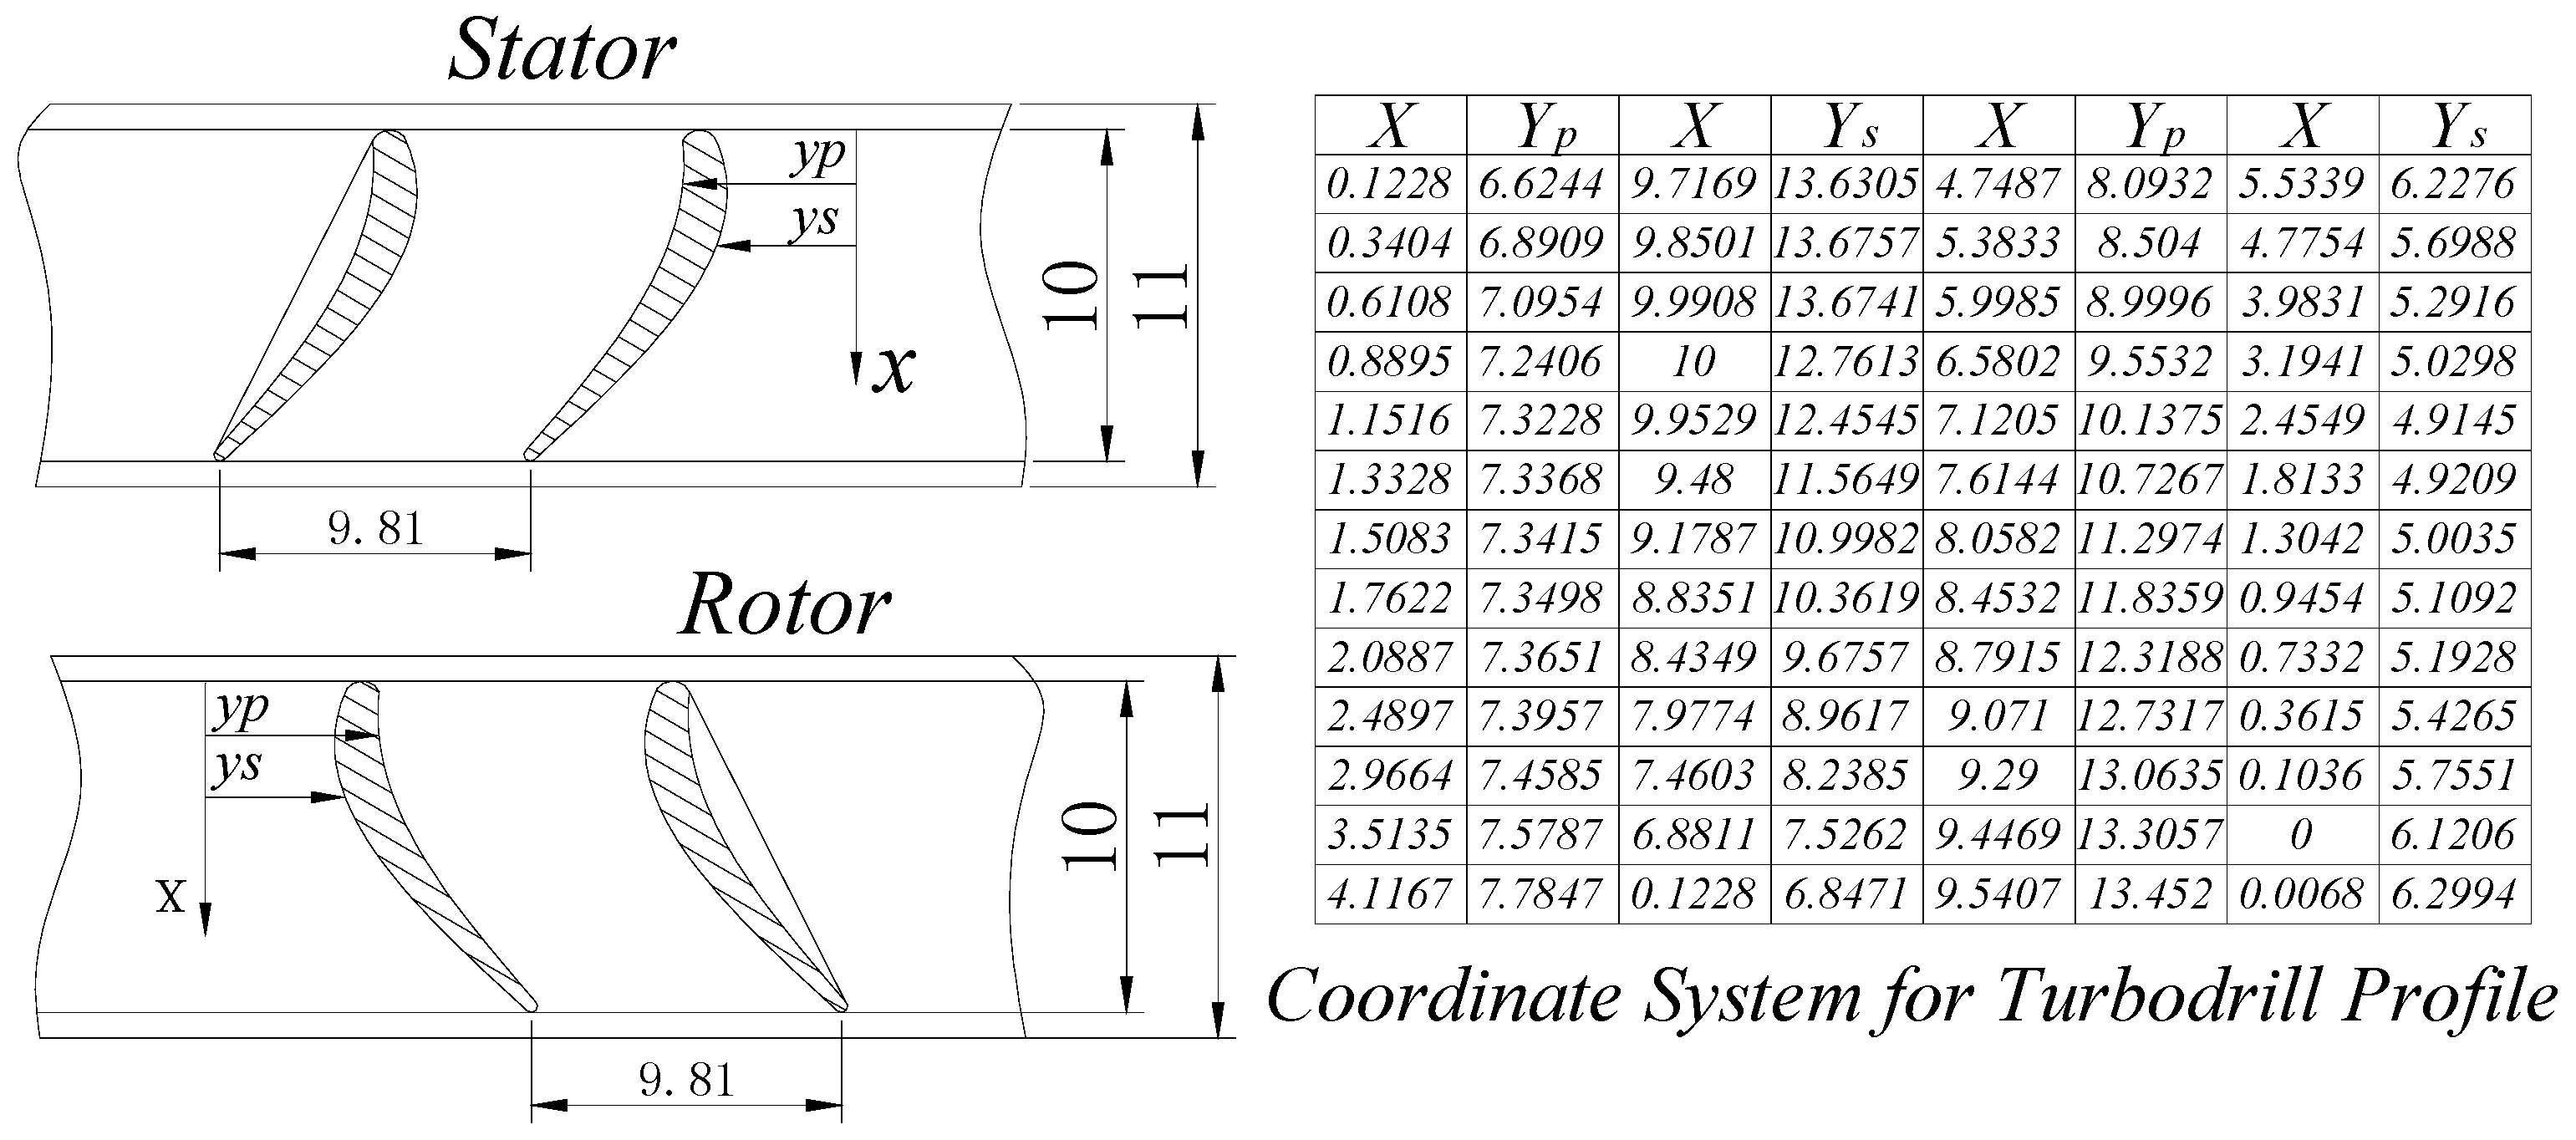
3.3. Turbine Blade Profile Design

The turbine blade profile can influence the flow field of the path by changing the mud velocity and pressure distribution. To reduce fluid friction loss, the profile line of the blade should be continuously changed such that the blade surface pressure distribution and velocity can vary smoothly. When calculating the incompressible flow field, the uniform flow field is used to describe the evolution of pressure and velocity according to physical space and time. The available mass conservation equations and the momentum equation can be derived according to the unsteady boundary layer basic equations of motion flow for the incompressible fluid. The boundary curvature radius R has a greater influence on the fluid. The blade surface should have a continuous curvature derivative to maintain the smooth distribution of the speed and pressure of the blade. Assume that the blade-type line is y = f(x), and the type of line curvature and third derivatives are, respectively:
C = 1 R = y [ 1 + ( y ) 2 ] 3 2 = f [ 1 + ( f ) 2 ] 3 2 C = f [ 1 + ( f ) 2 ] 3 f ( f ) 2 [ 1 + ( f ) 2 ] 5 2
Although the combined line can satisfy the continuously shrinking demands of the inlet, outlet and channel of the blade, there is often a discontinuous curvature derivative point at the junction of the curve that can cause nutation of the flow velocity and pressure and reduce the hydraulic characteristics of the turbine. Therefore, this design uses a combination of computer-aided design and configuration Bezier blade profile to eliminate the catastrophe point. Based on the semi-circular arc of the head and trail edge, the blade profile of the stator and rotor is designed as shown in Figure 6. The turbine blade profile, which is described by the data array, can be easily manufactured using a numerical control machine.

4. Numerical Simulation and Test

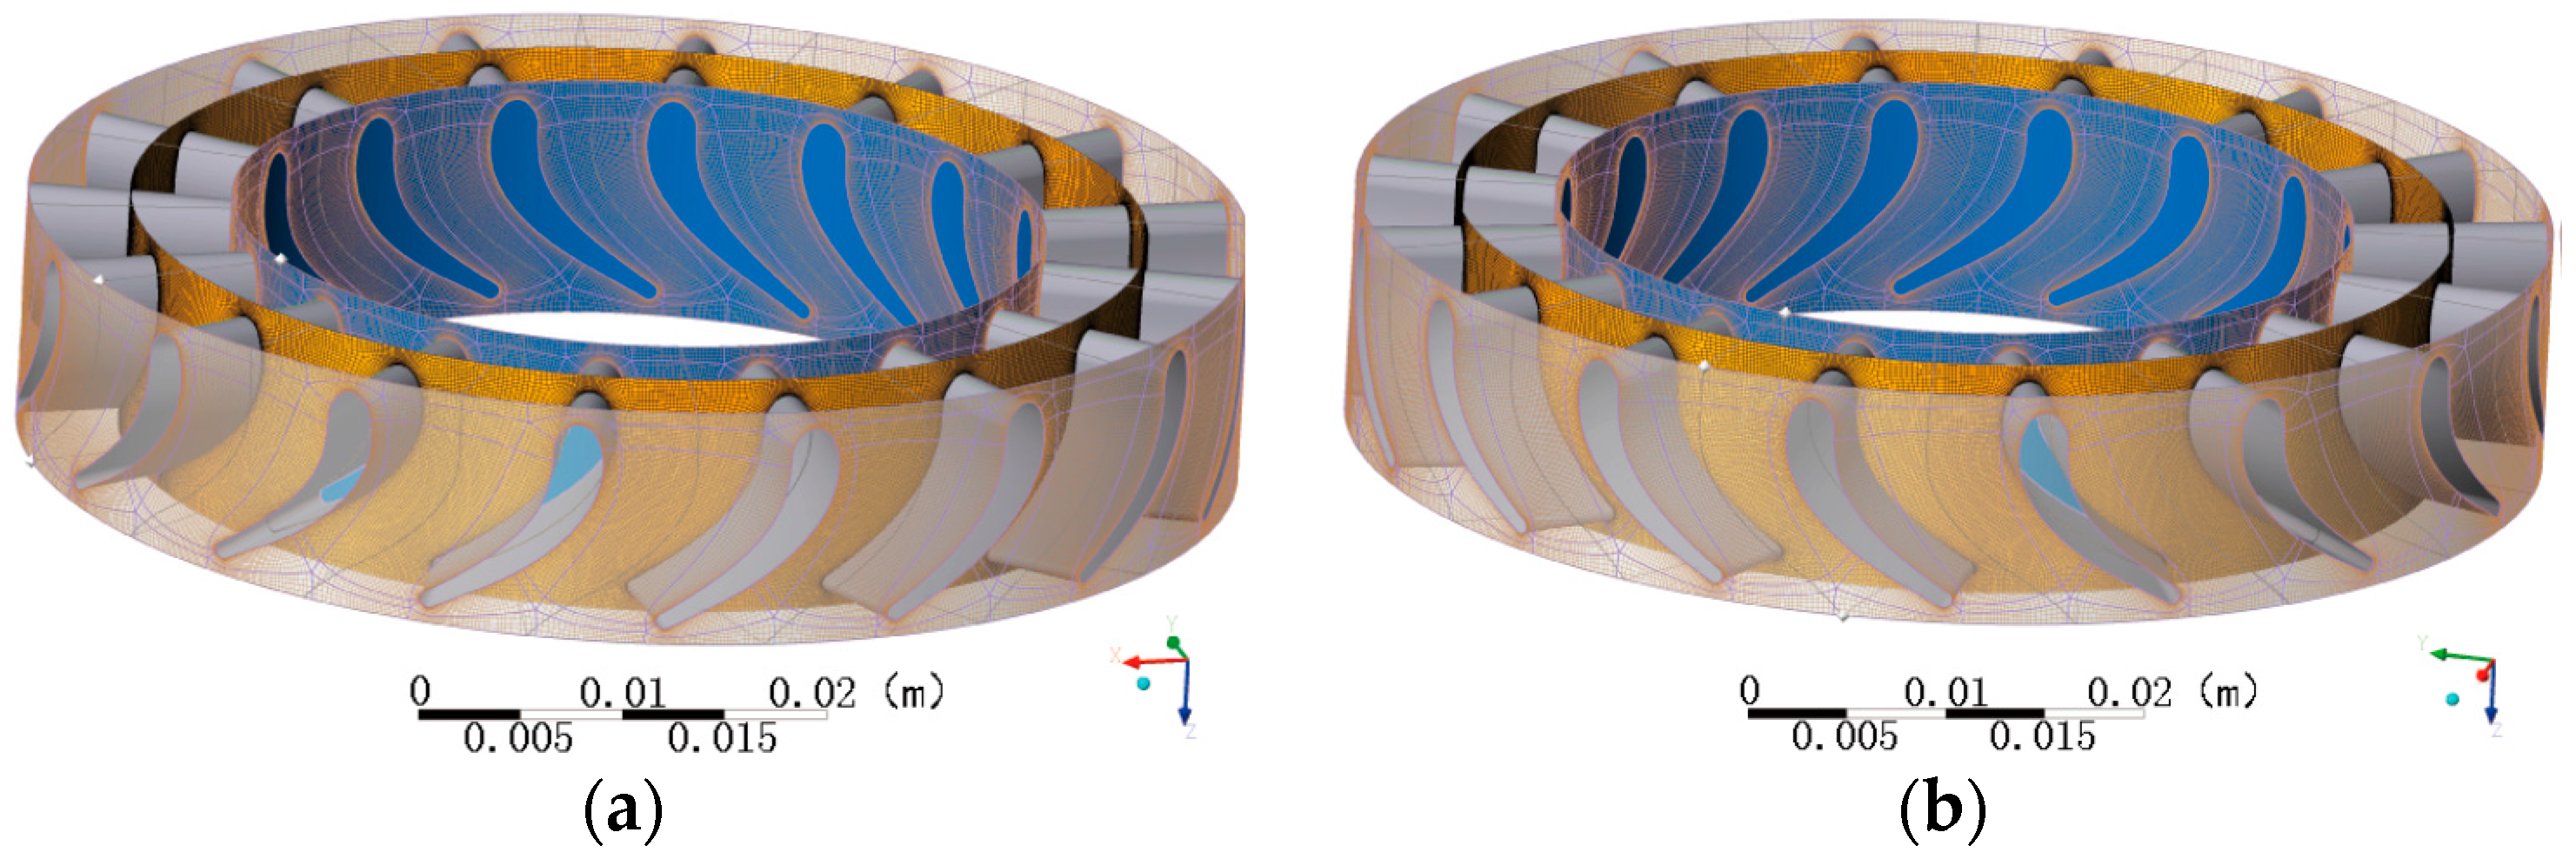
4.1. CFD Model of the Turbodrill Blade

The single blade-to-blade flow field mode is mainly used to simulate a blade. The model ignores the mutual interference between the blades and the influence of the rotor blades on the flow field. In addition, a single runner blade model will set be as a standard quadrilateral, which has a different exit compared to the actual field case. Thus, the simulation results are substantially different than the field results.
In this paper, we use a single-stage turbine blade simulation to improve the blade design. The multi-stage and multi-blade turbodrill is used to predict the performance. First, a single-cycle turbine blade in the two-dimensional model is drawn in Bladegen. Next, a two-dimensional model of an annular array of the turbine blade in a single stage is formed, extending upward and downward to a time length of the blade. An import and export boundary flow channel is implemented, forming a closed fluid channel. A single-stage multi-blade flow model is obtained. Next, the three-dimensional model is implemented into ANSYS through Bladegen to form the single-stage multi-blade CFD simulation model shown in Figure 7.

4.2. Meshing and Boundary Conditions

In the simulation, the stator and rotor are meshed using the full flow path method. The multistage turbine stators and rotors are stacked according to the actual assembly. Different grid coordinates are set to each level. The boundaries of the rotor can be set to a controllable speed value. The partial profile wire is intelligently encrypted, and the grid nodes and elements can be adjusted to ensure sufficient accuracy of the flow field. Because the field flow is turbulent, the stator and rotor grid cell are all hexahedral meshes, as shown in Figure 8. Different models must set different borders according to the difference between the flow fields in ANSYS. Because the three-dimensional flow field in this simulation is continuously differentiable turbulent flow, the calculation of the control theory should use turbulence theory. In addition, the default equation is the Reynolds equation.
Table 2 plots the meshing of the single and multi-stage turbine simulation. The drilling mud has a certain density and viscosity. During the simulation, Fluid is selected as the condition to analyze these two constants. Other analysis parameters are generally set by default in ANSYS. After these procedures, Define Run is used to perform the corresponding analysis of the calculation results. In ANSYS CFD-Post, the corresponding calculation result can be used in the Insert function to obtain the blade velocity field and pressure field.

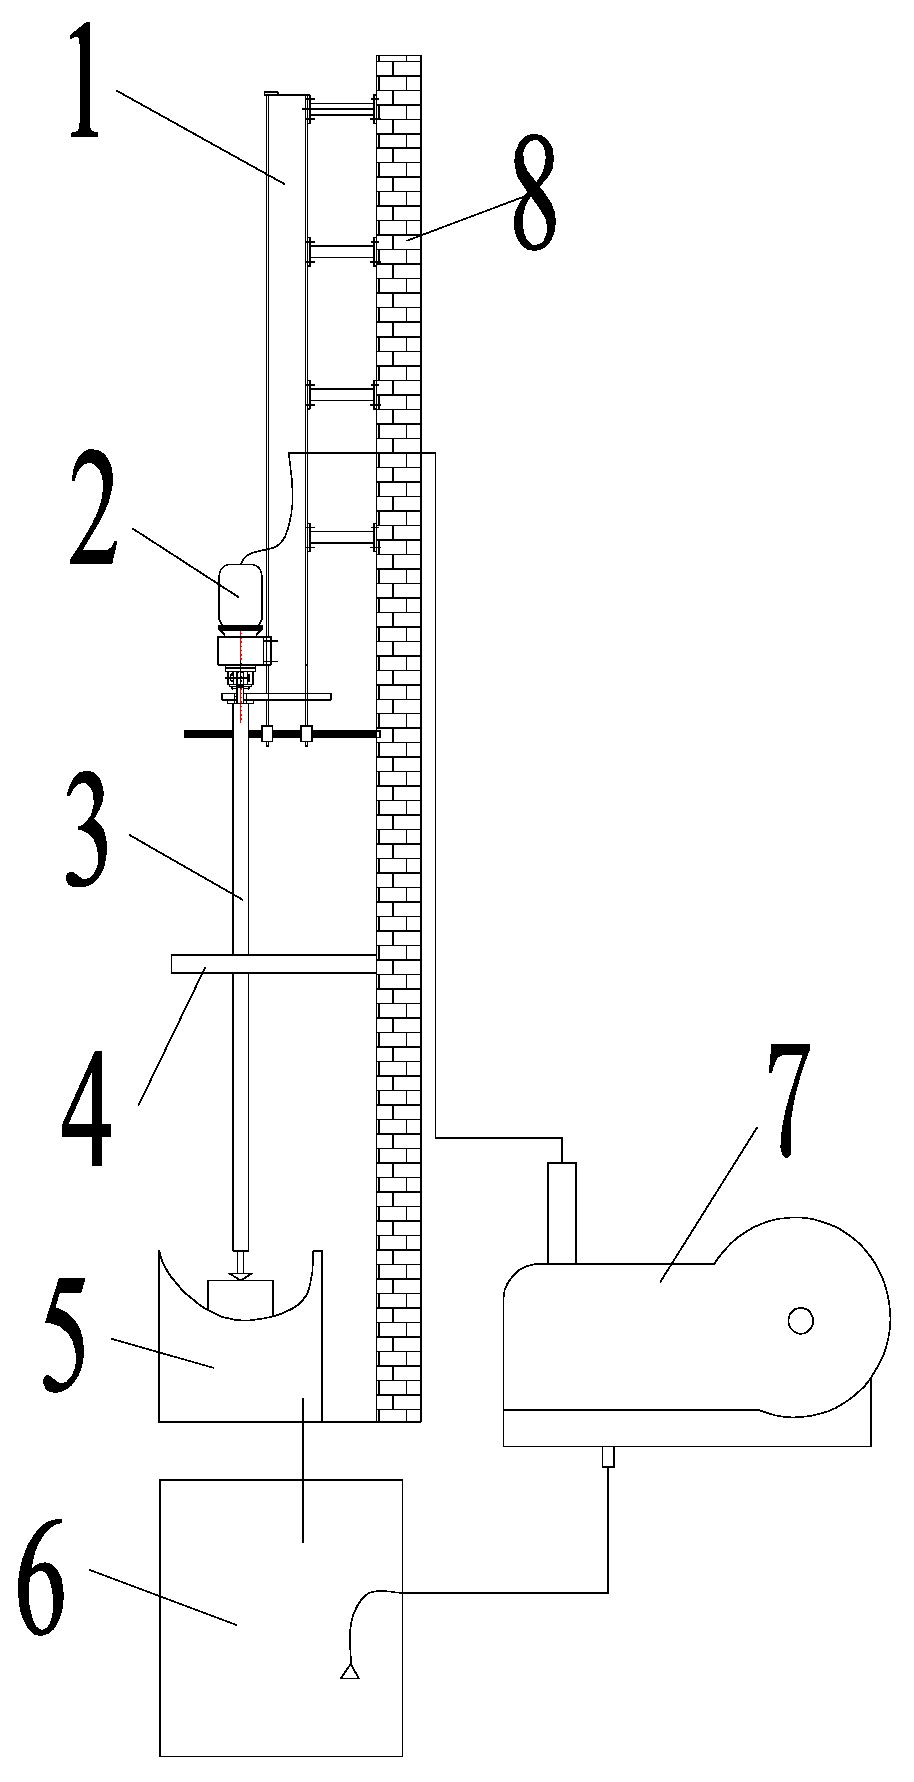
4.3. Test Principle of the Turbodrill

As shown in Figure 9, a high-pressure three-throw reciprocating pump is used in the drilling mud circulation system. A certain high-pressure mud is output through the manifold to drive the Φ89 drill to rotate and penetrate. The circulation system can also ensure that the mud is cleaned and return it to the pool. The test bench is primarily composed of the turbine drill support and involves righting, holding, lifting and other basic operations. The power head on the slide is used to provide continuously adjustable WOB to the bottom of the turbine drill bit as well as some rotational torque to drive the turbodrill.
The control system can be used to measure the WOB, pressure, flow, rate of penetration (ROP), footage, output torque, and speed equal amount in real time. The mud pump flow rate can be adjusted continuously. The results can be displayed on the display simultaneously. The control system is also equipped with the function of a security alarm in case of emergency. The data can be saved in real time to facilitate off-line analysis and synthesis.
The test works can be conducted using the cross multiplication method. The main parameters can be changed to test the output performances. Different WOB levels are exerted on different types of granite blocks. The turbine output torque and speed are measured [29]. The relationship between import and export the same amount of pressure, research output torque and efficiency of the turbine drill speed.

5. Result and Discussion

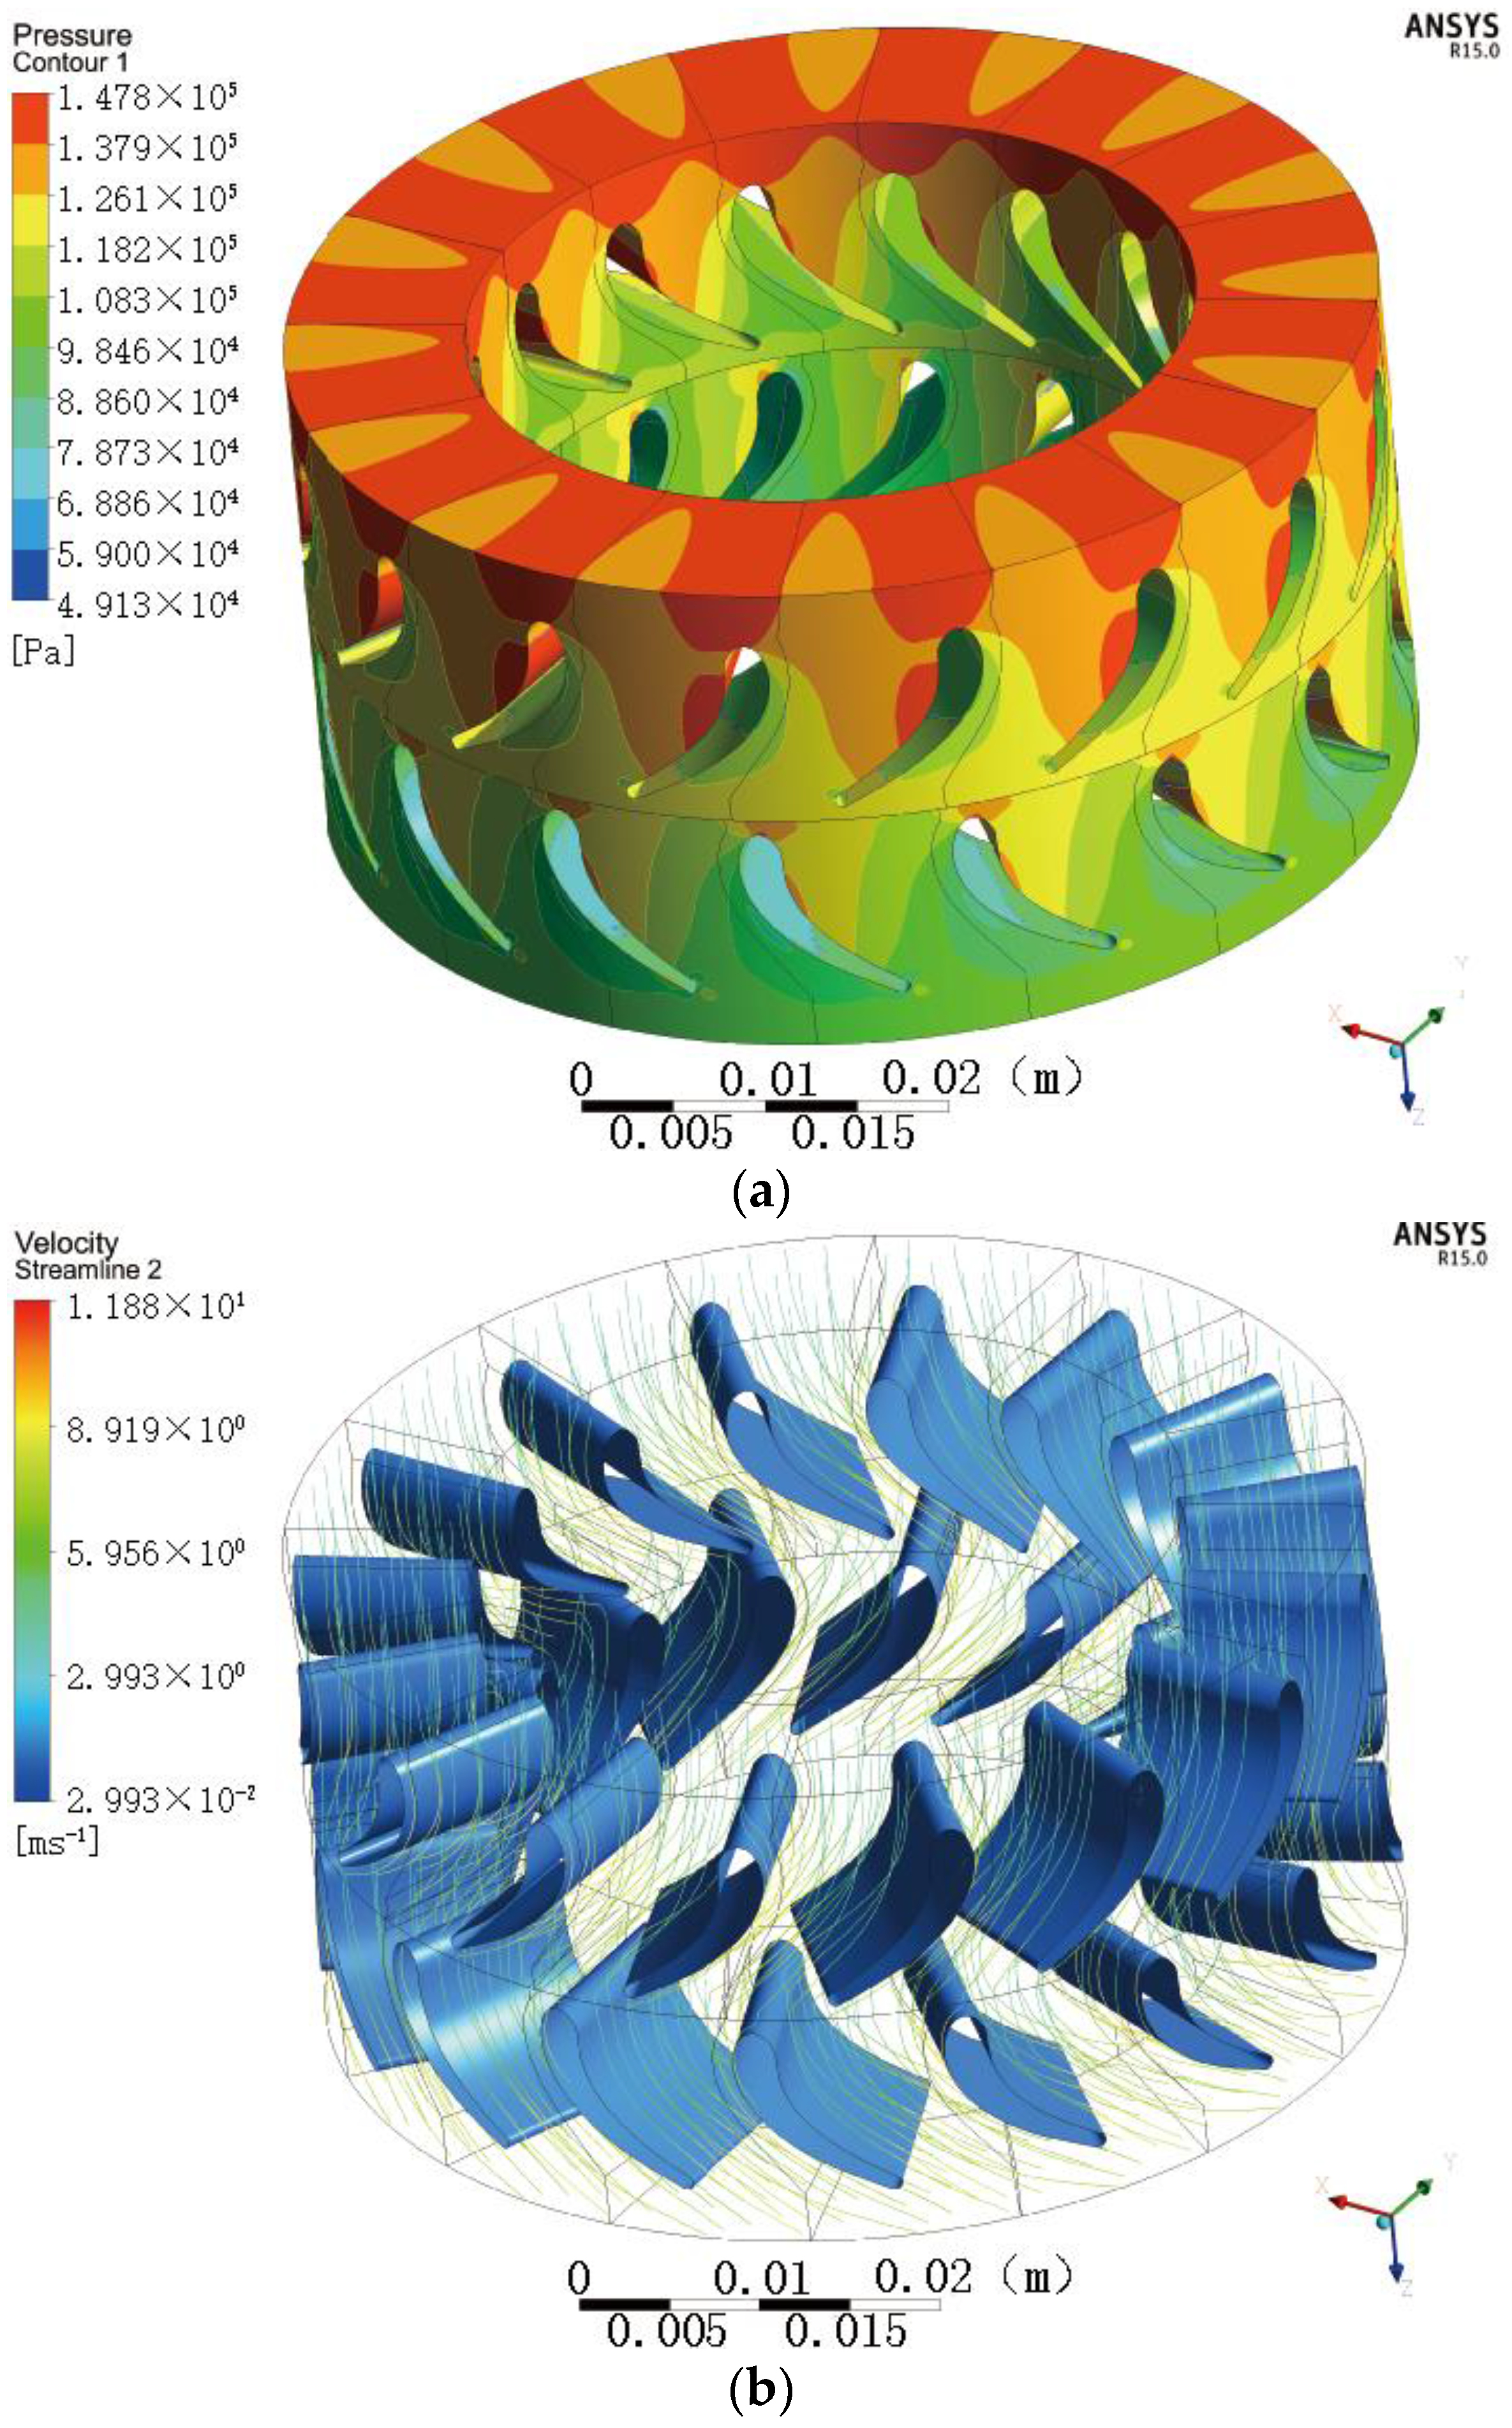
5.1. Simulation of a Single-Stage Turbodrill Blade

Figure 10 plots the pressure and flow cloud diagram of the single-stage turbine when the flow rate is 6 L/s. As shown in the figure, there are the two different directions after the drilling mud flows into the path: one toward the suction surface of the stator, and the other toward the pressure surface of blade. The velocity of the drilling mud in the stator and rotor is nearly zero at the leading edge and trailing edge. The pressure at the the velocity at the surface is often greater than the flow rate of the suction surface. The pressure and flow cloud diagram of the single-stage turbine did not produce stalls and other anomalies, thereby proving that the profile shape is reasonable and meets all of the design requirements.
As shown in the figure of the pressure field, after drilling mud into the flow path, the difference in the pressure distribution between the pressure surface and suction surface of the stator blade is relatively small. When the drilling mud flows through the rotor blades, the pressure surface and suction surface are impacted by the pressure field. In addition, the pressure of the pressure surface was significantly lower than the pressure of the suction surface, where a large pressure difference exists. This process contributes to the rotor blade moving toward to the pressure surface, thereby providing the impetus for the torque generated.
The output characteristics of the turbine blade can be obtained by using the CFX software, as shown in Figure 11. According to the simulation results, the working brake torque of the single-stage turbine is 1.8 N·m. Under normal operating speed, the torque is 1.5–2 N·m, the maximum power is 0.19 kW, the speed can reach up to 3800 r/min when idle, and the optimal operating speed is approximately 1800 r/min. At the designed operating speed, the pressure of the power section can likely drop to 0.029–0.032 MPa, which does not substantially contribute to the speed change. This result corresponds with the theoretical value, which is less than the design value of 0.03–0.04 MPa.

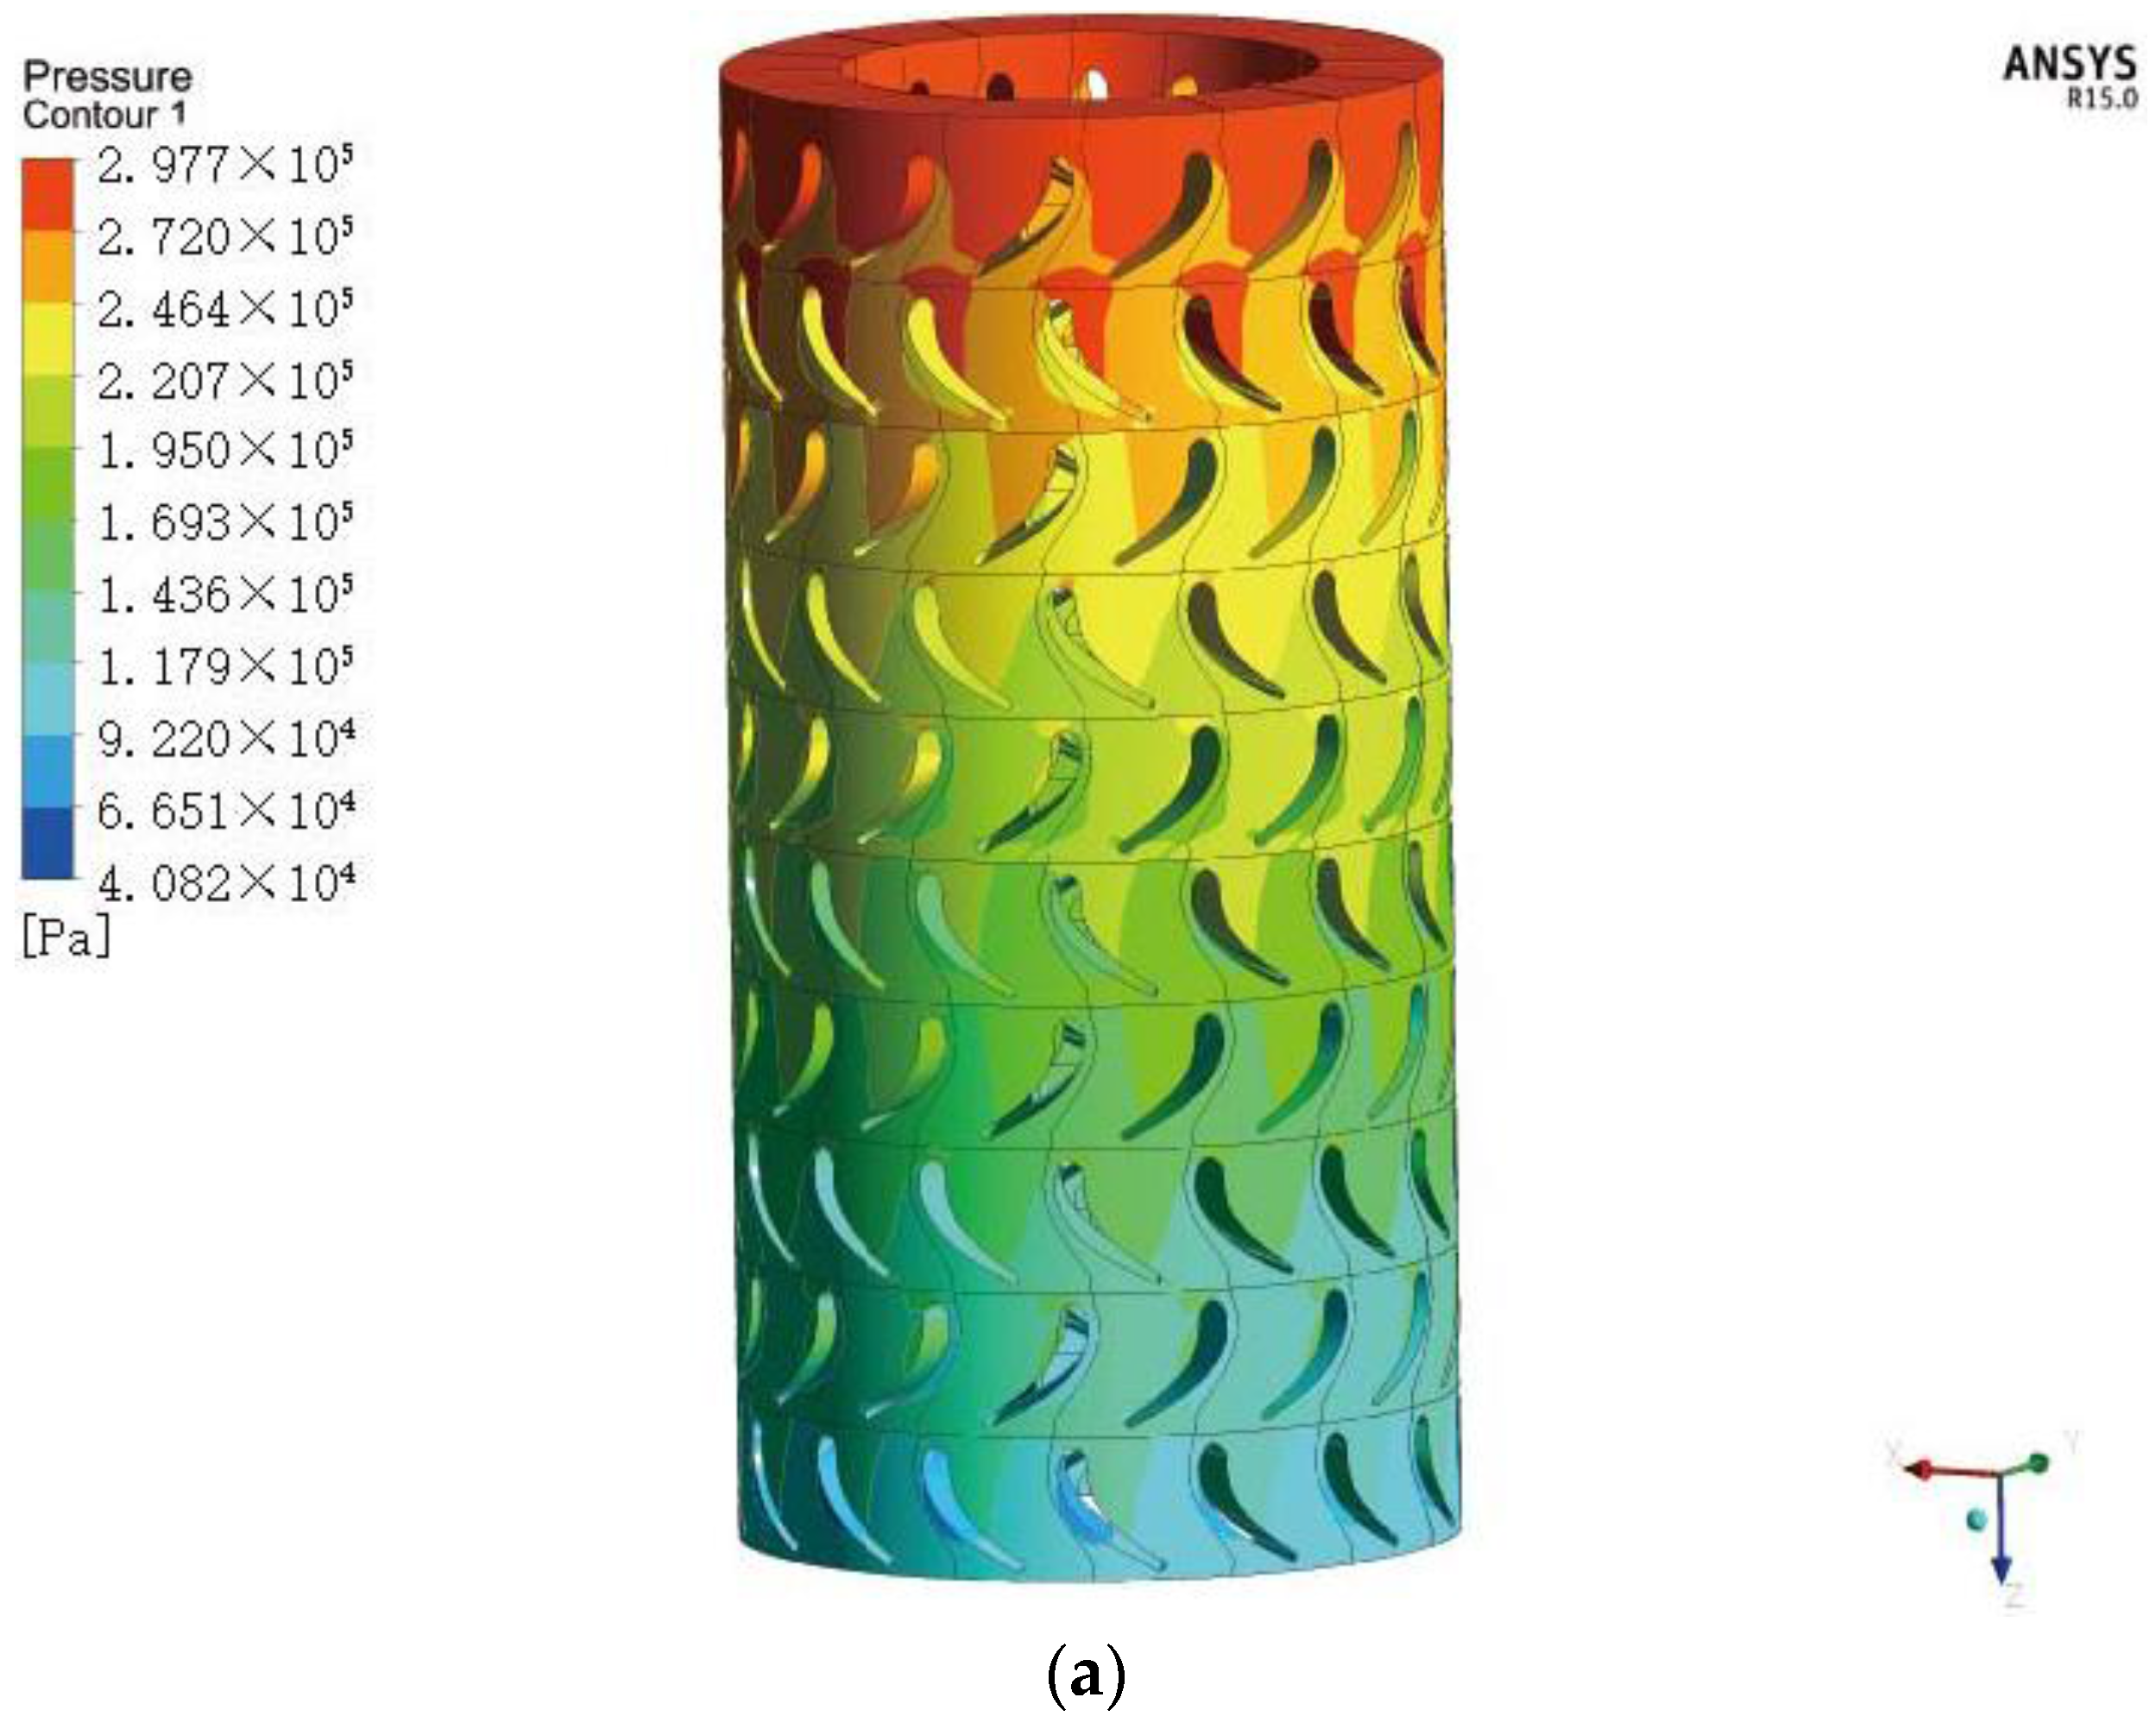
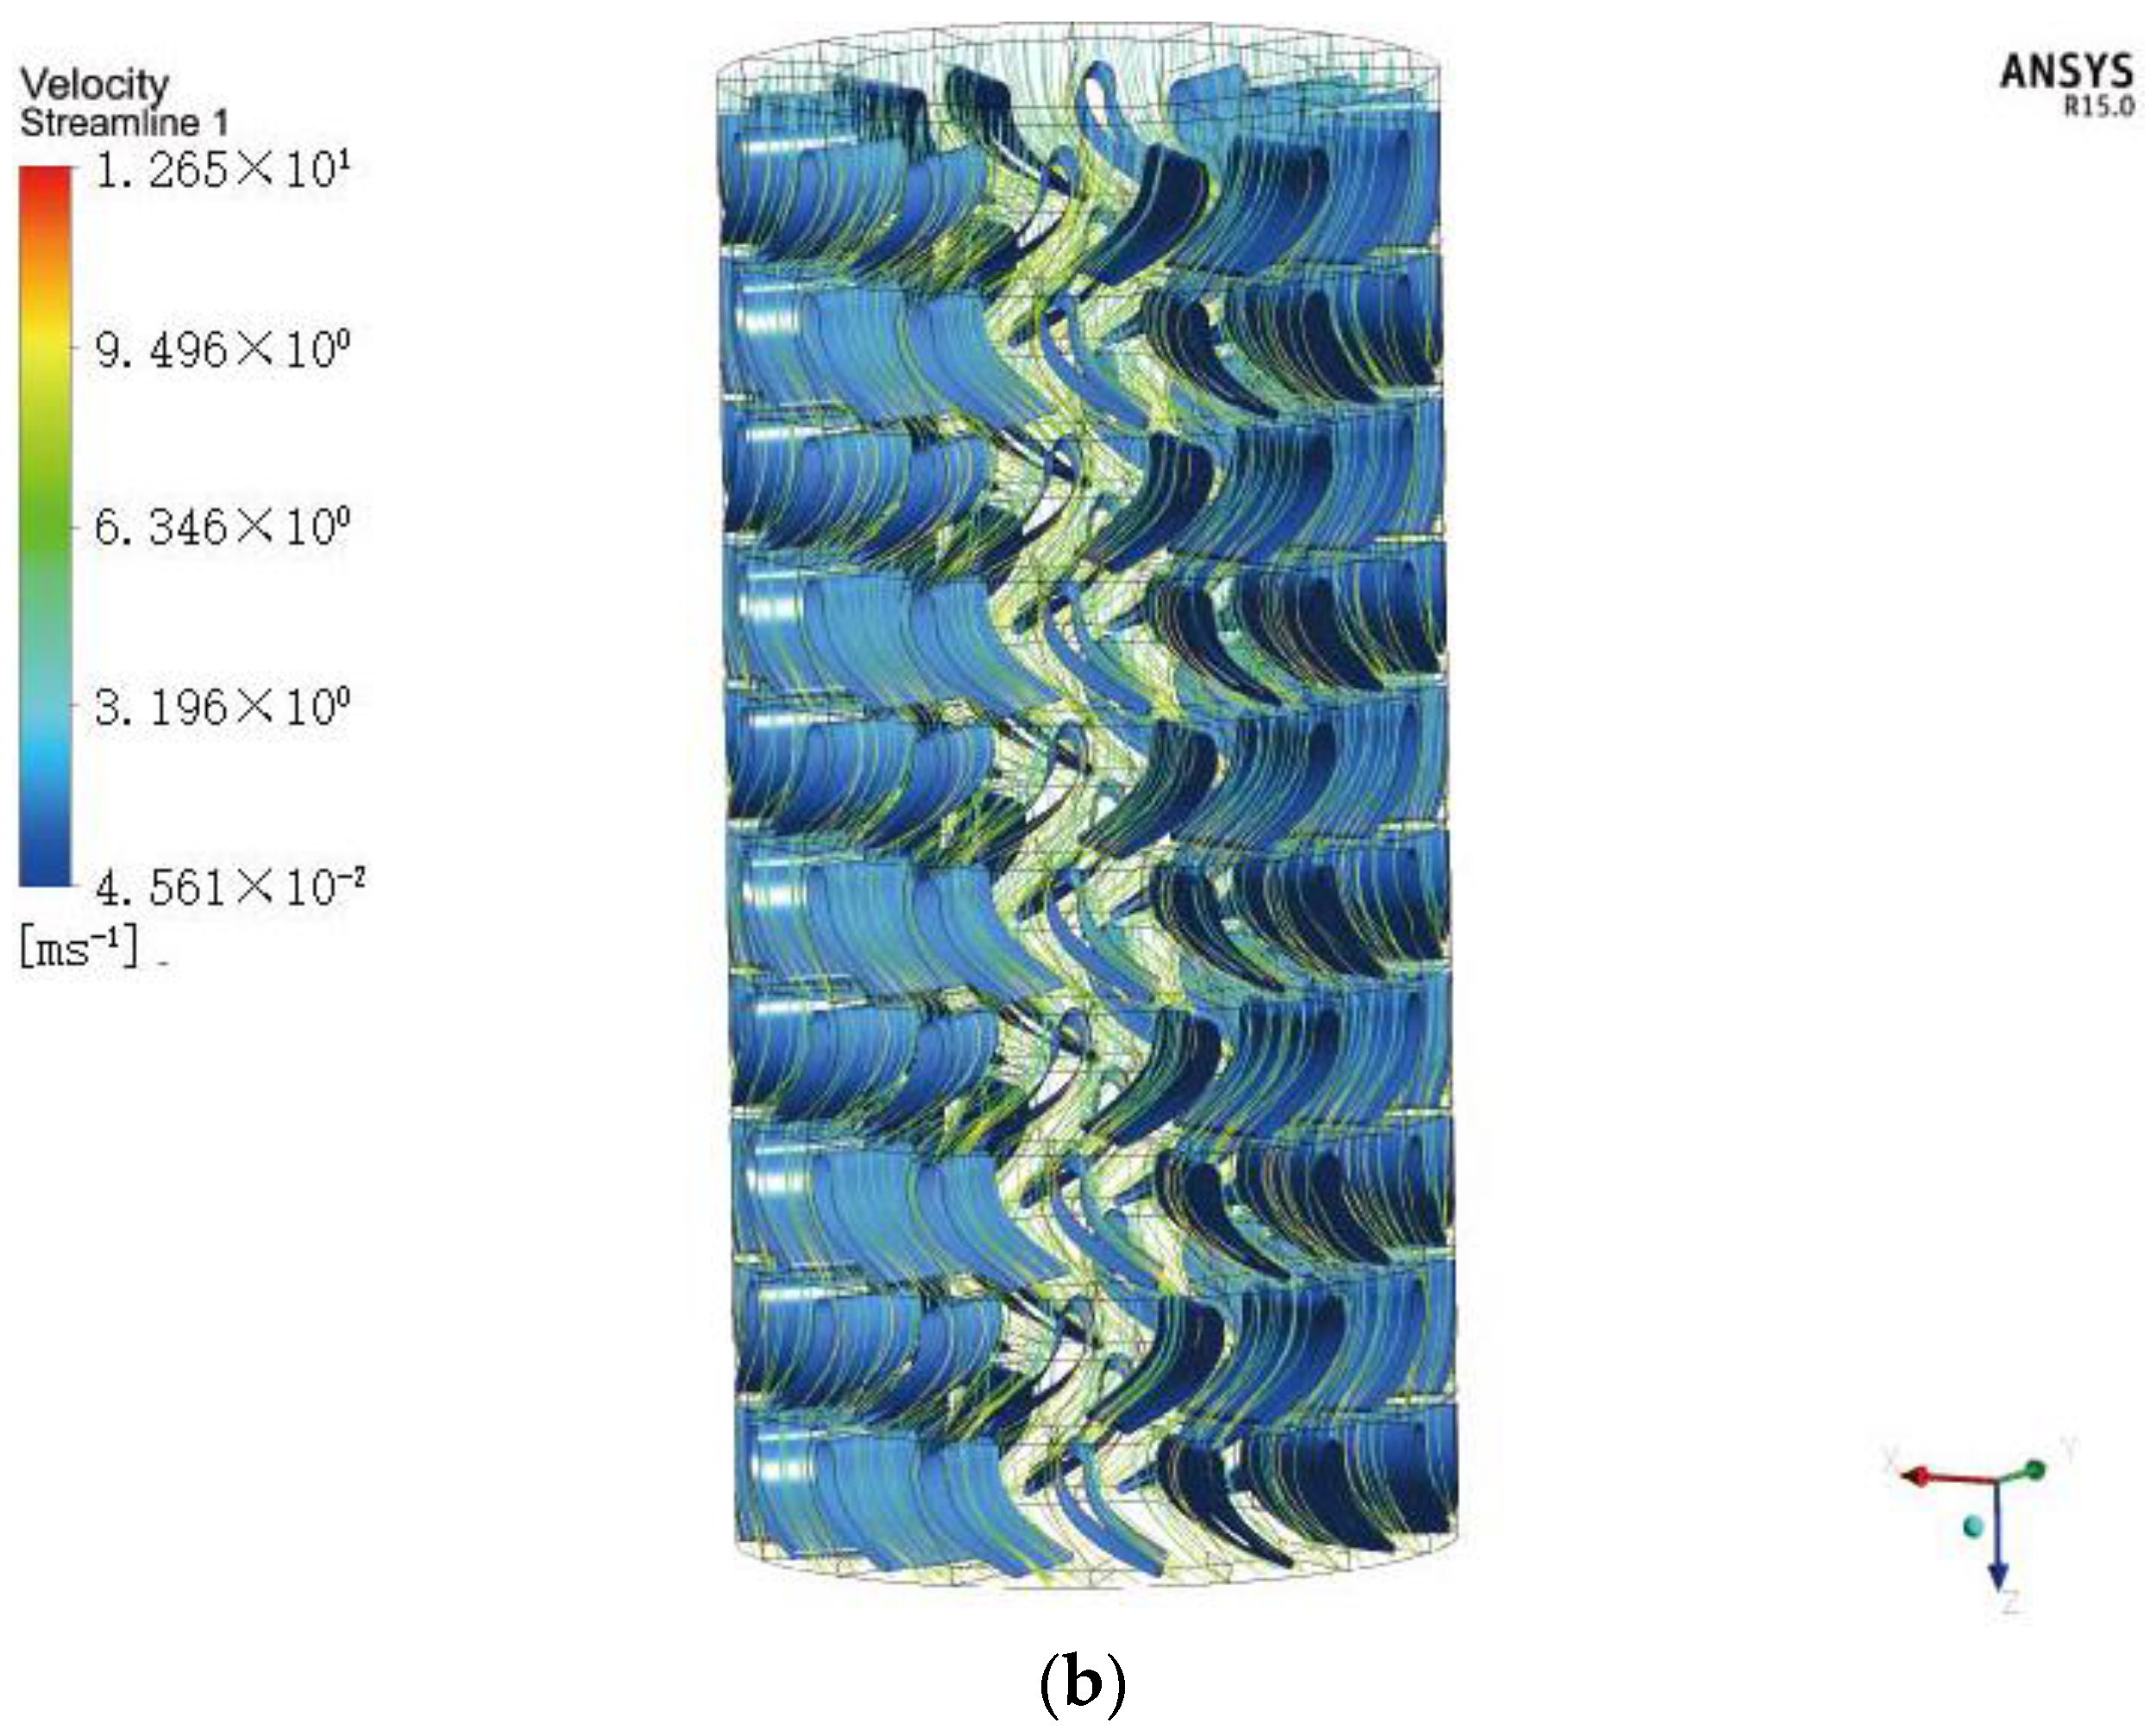
5.2. Simulation of the Multistage Turbodrill Blade

In previous studies, it is assumed that the boundary conditions are the same at each stage when the single-stage turbine simulation is conducted to predict the overall performance. However, energy loss occurs in each stage. In addition, the speed direction of the outlet boundary of the rotor will change, thus affecting the flow field considerably. Therefore, the inlet and outlet speeds of the first- and second-stage turbine is different. As a result, a simple simulation involving multiplying the results of every stage cannot provide an accurate prediction of the output performance.
A multi-stage turbine simulation can overcome this drawback and better simulate the actual conditions. As shown in Figure 12, when the flow is 6 L/s, the inlet and outlet pressures of the first- and second-stage turbodrill blades are different, and the pressure or velocity of flow of the second-stage turbodrill blade is smaller than that of the first stage. In addition, the pressure or velocity of flow of the subsequent stage turbodrill blade is smaller than that of the previous stage, and this trend continues for the increasing stages, with progressive decreases in pressure and velocity.

5.3. Comparison with the Experimental Results

Data A represent the simple product of the result obtained by the single-stage output and the number of turbine stages. Data B represent the machine’s performance, which is transformed by the five-stage simulation results and the number of turbine stages, while considering the interaction between the multi-stage turbodrill blades. Data C are the experimental measured data of the turbodrill. Data D are the design aims of the turbodrill. In comparison to design aim D, C represents the practical overall performance of the turbo-drill prediction, which is obtained from the drilling test.
Figure 13 plots overall performance of the Φ89 mm turbo-drill predictions, including torque, power, and pressure drop, with the change in rotation speed. The optimum operating actual speed is found to be in the range of 900–1800 r/min based on the multi-level simulation and experimental measurement. The torque fluctuates in the range of 200–300 N·m, and the power is in the range of 25–38 kW. Regarding the value of the torque prediction, the overall outcome of the multi-stage simulation is less than that of the single-stage, with a deviation of 3–16 N·m. The maximum driven torque of the turbodrill is from data D, followed by the values from data A and data B; the minimum value is from data C. Thus, the outcome of the multi-stage simulation is closer to the real performance given by data C.Data D are the design aims of the turbodrill, which are generally idealized. Data A are the results from one single stage multiplied by the number of stages, which are remarkably close to the design aims, but far from the actual experimental value. The results from the total n-stages geometry simulated (Data B) are close to the experimental value. That is to say, the outcome of the multi-stage simulation has the highest accuracy. We recommend this method for predicting the performance of the turbodrill.
The power predicted in the multi-stage simulation is higher than that of the single-stage simulation. The deviation between data C and data D is modest, in the range of 0–1 kW. The comparative experiments illustrate that the overall trend is D > A > B > C. The multi-stage simulation result is closer to the real test result. Regarding the pressure drop, the result of the multi-stage simulation is higher than that of the single-stage simulation, with a deviation of 0–1 MPa. The comparative studies demonstrated that the overall pressure drop predicted follows the trend of C > B > D > A, with the multi-level simulation prediction being closer to the real test measured performance values of data C. Overall, the results of the multi-stage simulation can be used to predict the performance parameters.
The multi-stage simulation method has the highest accuracy. We can analyze these results based on the following explanations. Firstly, the inertial centrifugal force is considered to modify Bernoulli Equation in the same streamline for per unit weight of the drilling mud. According to Equation (6), the energy in this situation is smaller than normal. Secondly, the coupling effect between different stage turbodrill blades is considered in the multistage simulation, which enables the flow field much closer to the real. Finally, the traditional method for the single-stage simulation and design has some inevitable defects. Herein a new design and performance prediction method for turbodrill are put forward in this paper to enhance the accuracy. I believe that this method will have great application.

6. Conclusions

(1)
A Φ89 mm turbodrill blade was developed for high-temperature geothermal drilling of granite formations using a Bezier curve design. The single- and multi-blade turbine simulation was used to achieve the optimization and correction of the turbine profile. The relevant manufacturing and assembly work were also completed.
(2)
The output characteristics of a turbine blade model were established based on the gravitational and rotation centrifugal field, using the Bernoulli equation and the momentum theorem. The traditional model was modified, and the accuracy of turbine performance prediction was improved.
(3)
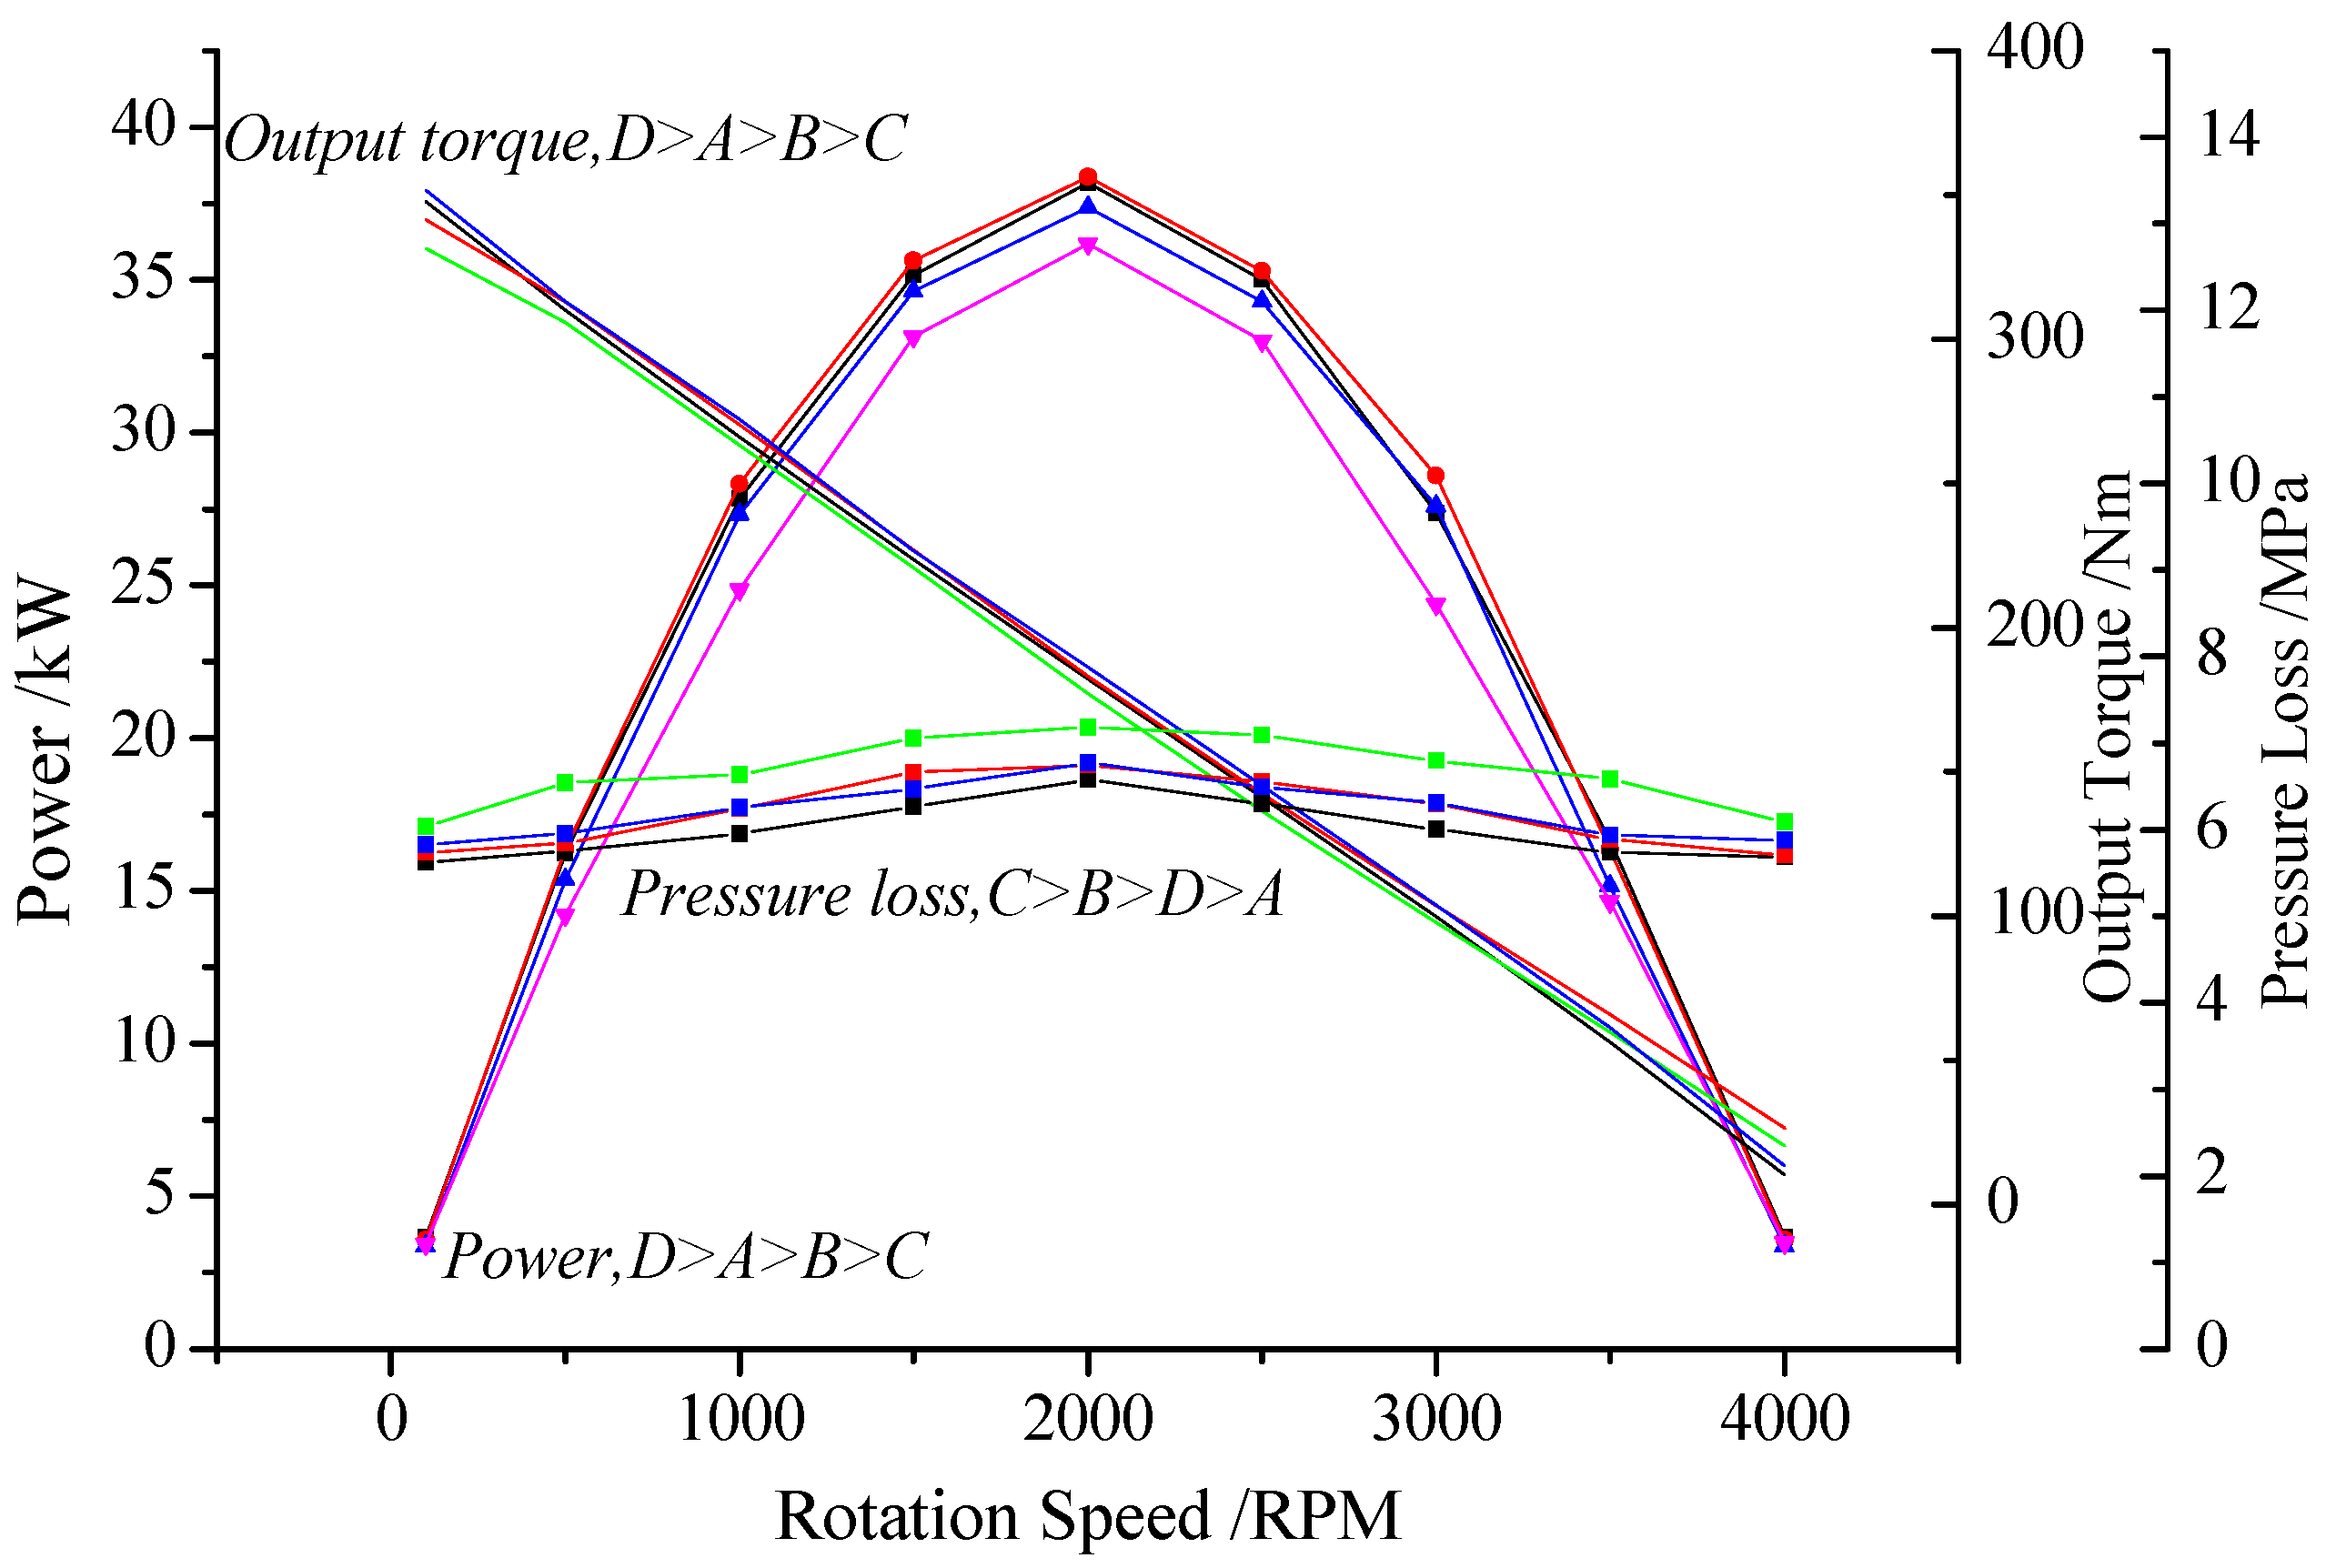
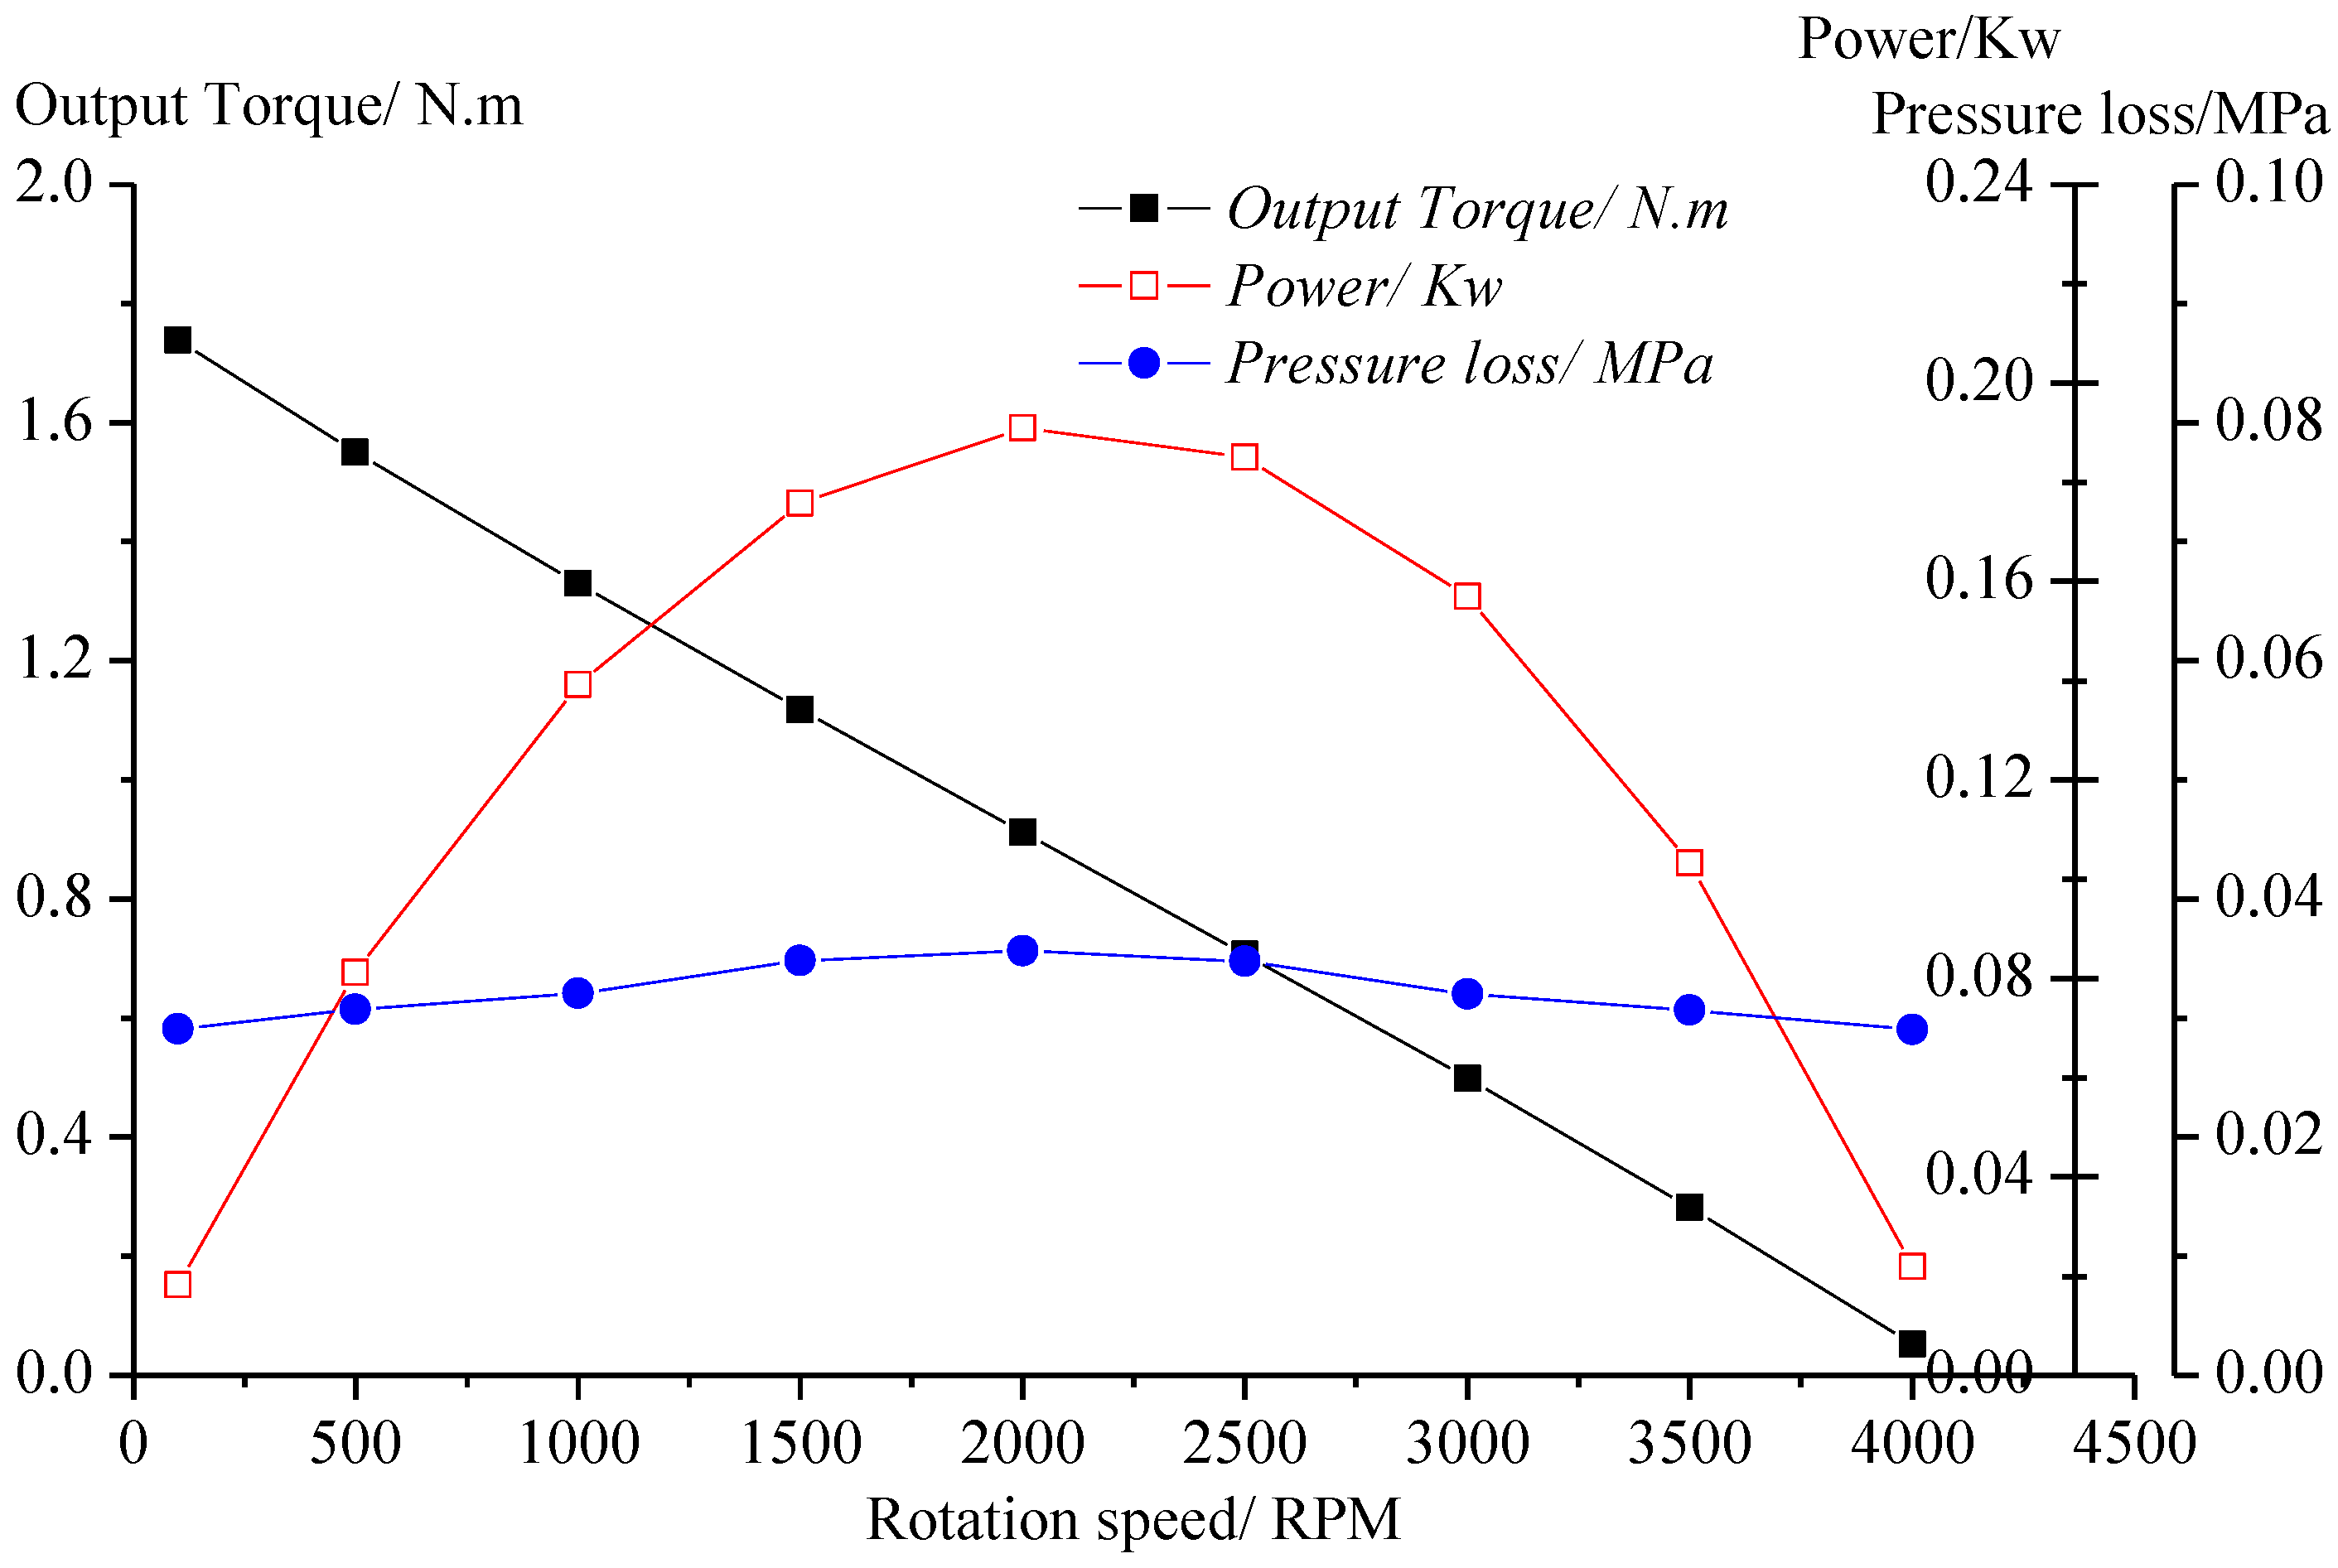
The turbodrill has 200 stages. The braking torque can reach 341 N·m. The maximum speed is approximately 3800 r/min, and the maximum power is approximately 38 kW. The rated speed is approximately 1800 r/min, and the pressure drop is less than 8 MPa, consistent with the theoretical design and meeting the design requirements. Based on the multi-stage simulation and optimization interval theory, the entire range of fluctuation of the optimum operating actual speed is 900–1800 r/min, and the torque fluctuates in the range of 200–300 N·m. The power fluctuates over the range of 25–38 KW, which reaches the level of the highest efficiency turbine, i.e., it is the best working range.
(4)
The multi-stage simulation was used to predict the turbodrill output performance by comparing the single-stage turbine simulation and the entire real analysis; the multi-stage simulation was found to be closer to the truth, i.e., it is more accurate than the single-stage simulation. The multi-stage simulation is a suitable method for predicting the performance parameters.

Acknowledgments

This work is supported by the National Natural Science Foundation of China (No. 41572360), the Fundamental Research Funds for the Central Universities (No. 292015061), and the National Key Technology Support Program (No. 2015BAD20B02). We sincerely acknowledge the former researchers for their excellent works, which greatly assisted our academic study.

Author Contributions

Yu Wang and Bairu Xia established the hydrodynamic model of turbodrill blade. Yu Wang and Zhiqiao Wang conceived and designed the experiments and wrote the paper. Zhiqiao Wang performed the experiments, Qin Zhou analyzed the data, and Liguang Wang contributed to the simulation results for the turbodrill blade.

Conflicts of Interest

The authors declare no conflicts of interest.

Nomenclature

X , Y , and Z unit mass gravity of the x-axis, y-axis and z-axis, respectively, N / m
ω angular velocity of the revolving turbodrill blade, rad / s
r radius of the point A, m
W potential function produced by mass, m 3 / s
z height of point A, m
p pressure of point A, p a
u flow rate of the drilling mud with respect to the turbodrill blade, m / s
E 0 and E 1 energy of the drilling mud at the inlet and outlet of the first-stage turbodrill stator, respectively
p0 and p1pressure of the drilling mud at the inlet and outlet of the first-stage turbodrill stator, respectively, Pa
c0 and c1absolute speed of the drilling mud at the inlet and outlet of the first-stage turbodrill stator, respectively, m/s
z0 and z1height of the drilling mud at the inlet and outlet of the first-stage turbodrill stator, respectively, m
h h s 1 mechanical energy loss of the first-stage turbodrill stator, m
E 2 energy of the drilling mud at the outlet of the first-stage turbodrill rotor
p 2 pressure of the drilling mud at the outlet of the first-stage turbodrill rotor, Pa
c 2 absolute speed of the drilling mud at outlet of the first-stage turbodrill rotor, m/s
z 2 height of the drilling mud at outlet of the first-stage turbodrill rotor, m
h h r 1 mechanical energy loss of the first-stage turbodrill rotor, m
Z series of the multi-stage turbodrill blades
i = 1 Z ( h h s i + h h r i ) total mechanical energy loss of the turbodrill
Δ p total pressure loss of turbodrill, p a
c Z absolute speed of the drilling mud at the outlet of the Z stage turbodrill rotor, m/s
z Z height of the drilling mud at outlet of the Z stage turbodrill rotor, m
d diameter of the rotor shaft, mm
T torque on the rotor shaft, N·mm
[ S ] safety factor of the shaft materials
[ τ ] allowable twisting stress, MPa
P weight on the bit, N
φ reduction factor according to the flexibility of the shaft
σ p allowable stress for the strength calculation, N / cm 2
WOBweight on bit
ROPrate of penetration

References

  1. Frash, L.P.; Gutierrez, M.; Hampton, J. True-triaxial apparatus for simulation of hydraulically fractured multi-borehole hot dry rock reservoirs. Int. J. Rock Mech. Min. 2014, 70, 496–506. [Google Scholar] [CrossRef]
  2. Gnatus, N.A.; Khutorskoy, M.D. Hot dry rocks: An inexhaustible and renewable source of energy. Lithol. Miner. Resour. 2010, 45, 593–600. [Google Scholar] [CrossRef]
  3. Kamyab, M.; Rasouli, V. Experimental and numerical simulation of cuttings transportation in coiled tubing drilling. J. Nat. Gas Sci. Eng. 2016, 29, 284–302. [Google Scholar] [CrossRef]
  4. Livescu, S.; Craig, S. Increasing lubricity of downhole fluids for coiled-tubing operations. SPE J. 2015, 20, 396–404. [Google Scholar] [CrossRef]
  5. Jones, S.; Feddema, C.; Sugiura, J. A gear-reduced drilling turbine provides game changing results: An alternative to downhole positive displacement motor. In Proceedings of the IADC/SPE Drilling Conference and Exhibition, Fort Worth, TX, USA, 1–3 March 2016.
  6. Pantoja, R.; Britto, G.; Buzzá, J.; Vieira, A.M.; Laroca, F.; Appelshaeuser, G. Pioneer turbodrilling with 16 ½ impregnated bit in deep pre-salt well in Santos Basin. In Proceedings of the SPE/IADC Drilling Conference and Exhibition, London, UK, 17–19 March 2015.
  7. Wang, Y.; Liu, B.L.; Zhu, H.Y.; Yan, C.L.; Li, Z.J.; Wang, Z.Q. Thermophysical and mechanical properties of Granite and its effects on borehole stability in high temperature and three-dimensional stress. Sci. World J. 2014, 2014, 95–104. [Google Scholar]
  8. Varela, R.; Guzman, F.; Cruz, D.; Atencio, N.; Iturrizaga, F.; May, R.; Solano, R.; Perez, R. First application of turbodrill and hybrid bit to optimize drilling times in Cretaceous Formations with high chert content in Mexico South Region. In Proceedings of the IADC/SPE Drilling Conference and Exhibition, Fort Worth, TX, USA, 4–6 March 2014.
  9. Eskin, M.; Maurer, W.C. (Eds.) Former USSSR R&D on Advanced Downhole Drilling Motors; TR97–31; Maurer Engineering Inc.: Austin, TX, USA, 1997.
  10. Mokaramian, A.; Rasouli, V.; Cavanough, G. Adapting oil and gas downhole motors for deep mineral exploration drilling. In Proceedings of the Sixth International Seminar on Deep and High Stress Mining, Perth, Australia, 28–30 March 2012.
  11. Zhang, X.; Feng, J. Research on the effect of fluid media on the mechanical property of high speed turbo-drill. China Pet. Mach. 2012, 40, 38–42. [Google Scholar]
  12. Mokaramian, A.; Rasouli, V.; Cavanough, G. Turbodrill design and performance analysis. J. Appl. Fluid Mech. 2015, 8, 377–390. [Google Scholar]
  13. Hu, L.; Gao, D. A new orientation design model and numerical solution for coiled tubing drilling. J. Nat. Gas Sci. Eng. 2015, 27, 1274–1278. [Google Scholar] [CrossRef]
  14. Jin, F.; Daliang, F. New design method of turbine blade shape of turbodrill. China Pet. Mach. 2000, 28, 9–12. [Google Scholar]
  15. Seale, R.; Beaton, T.; Flint, G. Optimizing turbodrill designs for coiled tubing application. In Proceedings of the SPE Eastern Regional Meeting, Charleston, WV, USA, 15–17 September 2004.
  16. Beaton, T.; Seale, R. The use of turbodrills in coiled tubing applications. In Proceedings of the SPE/ICOTA Coiled Tubing Conference and Exhibition, Houston, TX, USA, 23–24 March 2004.
  17. Ding, L.Y.; Feng, J.; Liu, X.G.; Zhang, M.L. Application CFX-BladeGen in modelling turbine blade. J. Eng. Des. 2005, 12, 109–112. [Google Scholar]
  18. Hu, X.D.; Liu, Q.; Liu, Y.L.; Zhao, F. The application of using Bezier curve to design turbine blade. Oil Field Equip. 2007, 36, 1–3. [Google Scholar]
  19. Calnan, D.; Seale, R.; Beaton, T. Identifying applications for turbodrilling and evaluating historical performances in North America. J. Can. Pet. Technol. 2007, 46, 34–39. [Google Scholar] [CrossRef]
  20. Grigor, C.; Conroy, D.; Henderson, M. Expanding the use of turbodrills in coiled tubing and workover applications. In Proceedings of the SPE/ICOTA Coiled Tubing and Well Intervention Conference and Exhibition, Woodlands, TX, USA, 1–2 April 2008.
  21. Mokaramian, A.; Rasouli, V.; Cavanough, G. CFD simulations of turbodrill performance with asymmetric stator and rotor blades congiguration. In Proceedings of the Ninth International Conference on CFD in the Minerals and Process Industries CSIRO, Melbourne, Australia, 10–12 December 2012.
  22. Tan, C.F.; Zhang, S.F.; Zhang, R.L.; Yu, L.W. Research on the effect of turbine blade profile line structure on cascade flow field. China Pet. Mach. 2012, 40, 6–9. [Google Scholar]
  23. Zhao, H.B.; Liu, B.L.; Wang, J.Q.; Wang, Y. Study on turbine blade of turbodrill design and simulation of flow field, exploration engineering. Rock Soil Drill. Tunn. 2012, 39, 29–32. [Google Scholar]
  24. Zhao, Z.T.; Weng, W.; Huang, Y.W.; Yang, P.; Yue, W.M.; Xu, J.J. Cascade design and performance prediction of the Φ89 turbodrill. Geol. Explor. 2013, 49, 1176–1180. [Google Scholar]
  25. Wang, Y.; Yao, J.; Li, Z. Design and development of turbodrill blade used in crystallized section. Sci. World J. 2014, 2014, 682963. [Google Scholar]
  26. Miyazaki, E.; Shinmoto, Y.; Kyo, M.; Suzuki, T. Development of turbine driven coring system for hard rock sampling. In Proceedings of the Offshore Technology Conference, Houston, TX, USA, 5–8 May 2014.
  27. Zhang, X.; Yu, S.; Gong, Y.; Li, Y. Optimization design for turbodrill blades based on response surface method. Adv. Mech. Eng. 2016, 8, 1–12. [Google Scholar] [CrossRef]
  28. Zhang, Q.; Chen, Z.; Luo, K.J.; Wen, J.; Dong, X.H. Coiled tubing small size turbodrill three-dimensional cascade design. Sci. Technol. Eng. 2016, 16, 186–189. [Google Scholar]
  29. Wu, C.; Wen, G.; Wu, X.; Wang, W.; Han, L.; Zhang, F. Using acoustic sensor and accelerometer to measure the downhole impact frequency of a hydraulic impactor. J. Nat. Gas Sci. Eng. 2015, 27, 1296–1303. [Google Scholar] [CrossRef]
Figure 1. Schematic of the turbodrill blade assembly. 1 stator blade; 2 rotor blade; 3 rotation shaft.
Energies 09 01035 g001
Figure 2. Inertial force field of the turbodrill blade.
Energies 09 01035 g002
Figure 3. Drilling mud flow in a turbodrill blade.
Energies 09 01035 g003
Figure 4. Design diagram for the turbodrill blade.
Energies 09 01035 g004
Figure 5. Design dimensions (mm).
Energies 09 01035 g005
Figure 6. Turbine blade profile (mm).
Energies 09 01035 g006
Figure 7. Simulation model of the turbodrill blade. (a) Single-stage blade model; (b) Multi-stage and multi-blade model.
Energies 09 01035 g007
Figure 8. Finite element model after meshing. (a) Meshing of the stator; (b) Meshing of the rotor.
Energies 09 01035 g008
Figure 9. Test principle of the turbodrill: 1: support frame; 2: power head; 3: turbodrill; 4: centralizer; 5: rock box; 6: mud pool; 7: wall; 8: drilling mud pump.
Energies 09 01035 g009
Figure 10. Cloud diagram of the single-stage turbodrill blade. (a) Pressure cloud diagram; (b) Flow velocity cloud diagram.
Energies 09 01035 g010
Figure 11. Simulated output performances of the single-stage turbodrill blade.
Energies 09 01035 g011
Figure 12. Cloud diagram of the multi-stage turbodrill blade. (a) Pressure cloud diagram; (b) Flow velocity cloud diagram.
Energies 09 01035 g012aEnergies 09 01035 g012b
Figure 13. Comparison between the experimental results and predicted values.
Energies 09 01035 g013
Table 1. Target performance parameters of the turbodrill (Φ89).
Items/UnitValueItems/UnitValue
Outside diameter/mm89Pressure drop/MPa6–8
Working flow/L·s−16–7Rated torque/N·m350
Rotation speed/r·min−11800Drilling fluid density/kg·m−31000–2000
Table 2. Mesh number of divisions for single stage and multistage turbodrill blade.
GridNumber of NodesNumber of UnitsNumber of Hexahedrons
Single flow passage of stator133,325121,920121,920
Full flow passage of stator133,325 × 16121,920 × 16121,920 × 16
Single flow passage of rotor133,325121,920121,920
Full flow passage of rotor133,325 × 16121,920 × 16121,920 × 16
Flow passage of single stage multi-blade1,333,250 × 321,219,200 × 321,219,200 × 32
Flow passage of multi-stage multi-blade1,333,250 × 1601,219,200 × 1601,219,200 × 160

