Article

New Aspects to Greenhouse Gas Mitigation Policies for Low Carbon Cities

1
School of Science and Engineering, Hellenic Open University, Riga Feraiou 167, 26222 Patra, Greece
2
Centre for Research and Technology Hellas, Institute for Research & Technology of Thessaly, Technology Park of Thessaly, 1st Industrial Area, 38500 Volos, Greece
3
Lab of Soft Energy Applications & Environmental Protection, Piraeus University of Applied Sciences, P.O. Box 41046, 12201 Athens, Greece
4
School of Science and Technology, Hellenic Open University, Parodos Aristotelous 18, 26335 Patra, Greece
*
Author to whom correspondence should be addressed.
Energies 2016, 9(3), 128; https://doi.org/10.3390/en9030128
Submission received: 10 January 2016 / Revised: 4 February 2016 / Accepted: 17 February 2016 / Published: 25 February 2016
(This article belongs to the Special Issue Energy Efficient City)

Abstract

:
Methane (CH4) is an important greenhouse gas emitted by vehicles. This study provides estimates of emissions of this important and often not well characterized greenhouse gas (GHG) emission related to transportation energy use. It aims to assist urban community planners and policymakers to prioritize and choose implementation strategies for low carbon cities. The paper focuses on emissions of CH4 from vehicles. Unlike emissions of CO2, which are relatively easy to estimate, emissions of CH4 are a function of many complex aspects of combustion dynamics and depend on the type of emission control systems used. In this context, they cannot be derived easily and instead must be determined through the use of published emission factors for each combination of fuel, end-use technology, combustion conditions, and emission control systems. Emissions of CH4 play a significant role with regards to the relative CO2–equivalent GHG emissions of the use of alternative transportation fuels, in comparison with the use of conventional fuels. By analyzing a database based on literature review this study analyzes all the factors affecting the creation of CH4 emissions from different vehicle types. Statistical analysis indicated “r” values ranging from 0.10 to 0.85 for all vehicles.

1. Introduction

Air quality constitutes a very important issue for public health, economy and environment. Poor air quality as a result of air pollution is a major environmental health risk, contributing to respiratory disease, cardiovascular disease, and lung cancer. In addition to the health effects, air pollution has considerable economic impacts, cutting short lives, increasing medical costs, and reducing productivity through lost working days across the economy. As climate change and air pollution stemming in urban areas from Greenhouse Gas Emissions (GHG) are closely linked, it is of great siginficance to investigate all interellations of GHG for a low carbon urban environment.
In 2010, 82% of all European Union’s greenhouse gas emissions were CO2–related. About 94% of the carbon dioxide (CO2) released to the atmosphere stemmed from combusting fossil fuels and the remaining 6% from industrial processes. Methane is considered a major GHG that accounted for 14% of the world GHG emissions and 8.6% of the European Union GHG emissions in 2010. Over the last two hundred and fifty years, the concentration of methane (CH4) in the atmosphere has increased by 151% [1]. To be more specific, since the pre-industrial period, the global mixing ratios of CH4 emissions in the atmosphere have more than doubled, rising from around 750 parts per billion (ppb) in 1800 [2,3] to the current level of around 1770 ppb [4]. The rate of increase slowed to 5–10 ppb year by the late 1980s and continued to decline into the 1990s, though with considerable annual growth variation [4].
Atmospheric CH4 originates from both non-biogenic and biogenic sources. Non-biogenic CH4 includes emissions from fossil fuel mining and burning (natural gas, petroleum and coal), biomass burning, waste treatment and geological sources. Alternatively, CH4 sources can be divided into anthropogenic and natural. The anthropogenic sources include rice agriculture, livestock, landfills and waste treatment, some biomass burning, and fossil fuel combustion. Natural CH4 is emitted from sources such as wetlands, oceans, forests, fire, termites and geological sources.
Regarding the anthropogenic emissions of CH4, it is noted that these can contribute significantly to total CO2-equivalent emissions of GHG from the lifecycle of conventional and alternative transportation fuels and technologies. Internal combustion engines (ICE) operate by burning fossil fuel derivatives. Exhaust emissions are their major contribution to environmental pollution. Typical emissions contain primary greenhouse gases—carbon dioxide (CO2), methane (CH4) and nitrous oxide (N2O). All criteria pollutants—carbon monoxide (CO), total nitrogen oxides (NOx), sulfur dioxide (SO2), non-methane volatile organic compounds (NMVOC) and particulate matter (PM) are the other major components. CH4 is emitted from gasoline, diesel, methanol, ethanol, Liquified Petroleum Gas (LPG), and natural gas internal-combustion-engine vehicles. Methane is emitted from light duty vehicles due to the incomplete combustion of fuel in the vehicle engine and the incomplete oxidation of engine-out methane in current catalytic after treatment systems. Emissions of CH4 are a function of the type of fuel used, the design and tuning of the engine, the type of emission control system, the age of the vehicle, as well as other factors. Given that the transportation sector is a main source for emitting CO2, accounting for 13.5% of worldwide global warming [5] it is imperative to investigate CH4 emissions resulting from this sector.
The EU’s methane emissions have dropped from around 595 MtCO2eq. in 1990 to 405 MtCO2eq. in 2010 (a reduction of more than 30%). This reduction was attributed to lower emissions from enteric fermentation and less waste disposal on land [6]. Viewed over a longer timeframe, the decrease in methane emissions in the period 1990–2010 resulted from lower fugitive emissions from coal mining and post-mining activities, and lower emissions from managed waste disposal on land. Methane from enteric fermentation in the agricultural sector also fell significantly, partly due to reduced livestock numbers but also due to changes in the agricultural management of organic manures. Despite the fact that methane is not toxic, it has a global warming potential that is 25 times higher than that of CO2 [7,8]. As far as legislation is concerned, EU tackles methane emissions together with other GHG emissions through the Climate and Energy Package aiming at reducing the EU’s greenhouse gas emissions by 20% in 2020 compared to 1990 [9].
The usage of natural gas as an automotive fuel seems bound to increase over the next few years as the demand for natural gas for use in European road vehicles is projected to double between 2015 and 2020 [10]. A recent techno–economic analysis of a broad range of fuel types revealed Compressed Natural Gas-CNG to outperform gasoline in terms of fuel economy, with a vehicle purchase cost that was close to that of a gasoline vehicle [11]. Based on the above and in conjunction with the fact that road transport is responsible for about 75% of GHG emissions (CO2, CH4 and N2O) [12,13], estimating and measuring CH4 emissions by road traffic is a key-issue for air pollution management as it introduces a good additional method for the environmental evaluation of transportation system scenarios. Furthermore, city-based research literature on road emissions is in broad agreement that the energy efficiency improvement in urban transport sector has large potentials to address carbon mitigation. Nonetheless, a key gap in the existing literature remains on analyses involving the opportunity to mitigate CH4 emissions.
In this context, the purpose of this study is to provide an estimation of CH4 emissions of different vehicle types, so as to identify all the factors affecting methane emission, as well as the ratio of methane to total hydrocarbons emissions by passenger cars. We focus on CH4 because for many energy-use technologies—and particularly alternative fuel vehicles—emissions of CH4 are not well characterized, whereas emissions of CO2 from fuel combustion are relatively easy to estimate. In order to address the abovementioned issues the method of statistical analysis was selected. The results of this study indicate that CH4 emissions from the road sector are affected by various vehicle’s characteristics, such as the engine volume, horsepower, compression ratio, temperature, exhaust after treatment system as well as the fuel injection system. In adittion, the paper argues that the results of this study should intereperted in regards to a low carbon transportation system and to be considered in policy and planning strategies. The paper is structured as follows: Section 2 describes the data, variables and methodology used. Section 3 presents the main results, whereas Section 4 includes the concluding remarks.

2. Materials and Methods

A statistical analysis was performed in order to determine the direct relationships of CH4 emissions from different vehicles. Based on references concerning a number of commercial vehicles makes such as Chrysler, Ford, GM, Honda and Toyota a database was designed. The database includes a sample of 1000 vehicles that were distributed between the period of 1986–2005 [14,15,16,17,18,19,20,21,22,23,24,25,26,27,28,29,30,31,32,33,34,35,36,37,38,39,40,41,42,43,44,45,46,47,48,49,50,51,52,53,54,55,56,57,58,59,60,61,62,63,64,65,66,67,68,69,70,71,72,73,74,75,76,77,78,79,80,81]. It should be noted that in regards to the methodological approach, some other methodologies, such as patent analysis [82], could have been used in a study, which focus on providing guideline regarding climate change mitigation; nonetheless due to the large number of data it was decided that in this study a statistical analysis could have better results, as it will clearly depict the correlations between different vehicle parameters and CH4 emissions.
The literature review focused on finding useful data for grouping and analyzing the vehicles as well as on finding statistical issues and analytic methods associated with vehicle emissions data. This included notably numerous cars with mileages far higher than 1,000,000 km. The vehicles under examination were assumed to cover a wide range of engine conditions. The emission records used were for vehicles speeds between 20 and 58 km/h and accelerations between 0 and 2.8 m/s2, so as to avoid irregular emission behavior at deceleration, high instantaneous acceleration, and top speeds. Furthermore, to ensure statistical validity an F-test (99% confidence level) was carried out to validate the regression model. In order to perform the comparative analysis the following vehicle characteristics were assessed:
-
Engine Volume: L
-
Horsepower: hp
-
Torque: Nm/rpm
-
Distance travelled: km
-
Fuel consumption: L/100 km
-
Εmissions of CO2, CO: g/km
-
Emissions of NOx, THC, CH4: mg/km
-
Emissions of PM: Particle Number/km
The driving test cycles examined, included the ECE and EUDC test cycle—also known as the MVEG-A cycle [EEC Directive 90/C81/01]. The European transient cycle (ETC) is the regulatory test cycle for heavy-duty dsiesel vehicles. In 2000, that idling period has been eliminated, i.e., engine starts at 0 s and the emission sampling begins at the same time. This modified cold-start procedure is referred to as the New European Driving Cycle (NEDC) or as the MVEG-B test cycle, which was also taken into consideration. NEDC is the regulatory test cycle for light and medium-duty vehicles. The full test starts with four repetitions of the ECE cycle. The ECE is an urban driving cycle, also known as UDC. It was devised to represent city driving conditions, e.g. in Paris or Rome. It is characterized by low vehicle speed, low engine load, and low exhaust gas temperature. In adittion, the EPA Federal Test Procedure, commonly known as FTP-75 for the city driving cycle was also incuded in the statistical analysis. Finally from the US cycles, which include a variety of test cycles from the USA including their type approval cycles–cars, HGVs and buses the US06 test cycle was taken into consideration.
Emission standards for passenger cars and light commercial vehicles were also taken into consideration. Since the Euro 2 stage, EU regulations introduce different emission limits for diesel and petrol vehicles. Diesel vehicles have more stringent CO standards but are allowed higher NOx emissions. Petrol-powered vehicles are exempted from particulate matter (PM) standards through to the Euro 4 stage, but vehicles with direct injection engines are subject to a limit of 0.005 g/km for Euro 5 and Euro 6. The type of testing also played a role in determining if a given study should be included in this analysis. There were a number of cases in which data from one study were repeated in another study. This might occur if the authors published the same data set in multiple scientific journals to maximize exposure, or if the authors presented a previously-published set of data in a new publication for the purpose of comparing the two datasets. These publications were excluded from our database. The variables examined are the type of fuel, horse power, engine power, compression ratio as well as mileage.
The statistical analysis consisted of a series of statistical procedures applied to the data in each vehicle type. These included both Regression and Pearson Correlation Analysis (PCA), in order to identify the relationship between a dependent variable and one or more independent variables. Pearson correlation coefficients (r) were also calculated. A model of the relationship is hypothesized, and estimates of the parameter values are used to develop an estimated regression equation. Various tests are then employed to determine if the model is satisfactory. If the model is deemed satisfactory, the estimated regression equation can be used to predict the value of the dependent variable given values for the independent variables. It is noted that the correlation and regression analysis are related in the sense that both deal with relationships among variables.

3. Results and Discussion

Based on the methodology presented in Section 2, statistical analysis was performed for the vehicles that are included in the database. The results of the positive correlations were “r” values ranging from 0.10 to 0.85 for all vehicles’ whereas for negative correlations the results of “r” values were ranging between −0.08 to −0.9. Methane emissions vary with the engine load and with vehicle characteristics. The variables examined are distinguished to the following categories: Vehicles’ Characteristics (engine volume, horsepower, compression ratio, temperature, exhaust after treatment system as well as fuel injection system), Fuel Properties, Exhaust Emissions, Driving Cycles, Emissions standards, Three Way Catalyst—TWH, Total Hydrocarbons (THC).
The findings of the statistical analysis performed for the category of vehicle’s characteristics are summarized in Table 1. The engine volume was examined for 482 vehicles, the horsepower for 101 vehicles, and the temperature for 110 and finally the exhaust after treatment system for 409 vehicles.

3.1. Vehicle’s Characteristics

It is noted that the engine volume is strongly correlated with the average of methane emissions of Otto engine vehicles with distribution year after 2000, which are gasoline (or gasoline blended), fueled. This is also noted in the case of diesel powered vehicles with correlation efficiency reaching r = 0.855. The strong correlation is attributed to the fact the fuel consumption increases as the engine volume increases. Highest dispersion emissions values compared to engine volume, are indicating the existence of more important factors that affect emissions of older vehicle technologies (for instance vehicle’s emission standards).
It is noticed (Table 1) that the compression ratio (CR) is negative correlated with CH4 emissions, having a low correlation coefficient. This can be attributed to the fact the majority of the vehicles in our database with high CR refer to either diesel engine or OTTO engine direct injection vehicles, which can extract maximum possible mechanical efficiency from the engine. The temperature of the combustion chamber will also increase and that is beneficial for complete combustion reducing CH4 emissions. The horsepower is negatively correlated with methane emissions; this is attributed to the technological progress of vehicles.
Methane emissions appear to be higher at lower ambient temperatures. This is expected because before the engine is warmed up the temperature of the fuel going into the engine is close to the ambient temperature, and at lower temperatures a liquid fuel does not vaporize as completely, and hence does not burn completely. If CH4 emissions are related to temperature, such that lower combustion and exhaust temperatures cause them to increase, then one would expect that CH4 emissions also would be related to the driving cycle, which can affect engine and exhaust temperatures. The dependence between methane emissions and temperature is not linear but exponential decay.
The exhaust after treatment systems seem to have a positive influence on engine performance and reduce CH4 exhaust emissions. On the contrary, it seems that the existence of after treatment systems in diesel powered vehicles, does not have an effect on methane emissions. This can be attributed to lower diesel engine methane emissions as well as to the fact that after treatment systems in diesel engines such as Diesel Particulate Filter (DPF) or NOx Storage Reduction (NSR) aim to reduce emissions such as PMs and NOx respectively. In general, exhaust gas after treatment systems using catalytic converter systems, secondary air injection, insulation of exhaust manifold and exhaust system, filters (traps) etc, can reduce the CH4 emissions.
Figure 1, illustrates that technology progress in the field of vehicle’s fuel injection system has lead to significant CH4 emissions reduction. For instance Gasoline Direct Injection (GDI) technology has decreased the percentage of CH4 emissions approximately 170%, compared to Multi Port Injection (MPI) technology. The maximum percentage of methane emissions is noted at older technology systems (Sequential Fuel Injection system (SFI) of the Ford Crown Victoria [83] and classic carburator system with no after treatment system of the Volkswagen Golf [84]. Methane emissions seems to increase as the engine and the emission-control system deteriorate. The data of Table 1 suggest that for most vehicles CH4 emissions increase with the age of the catalyst.

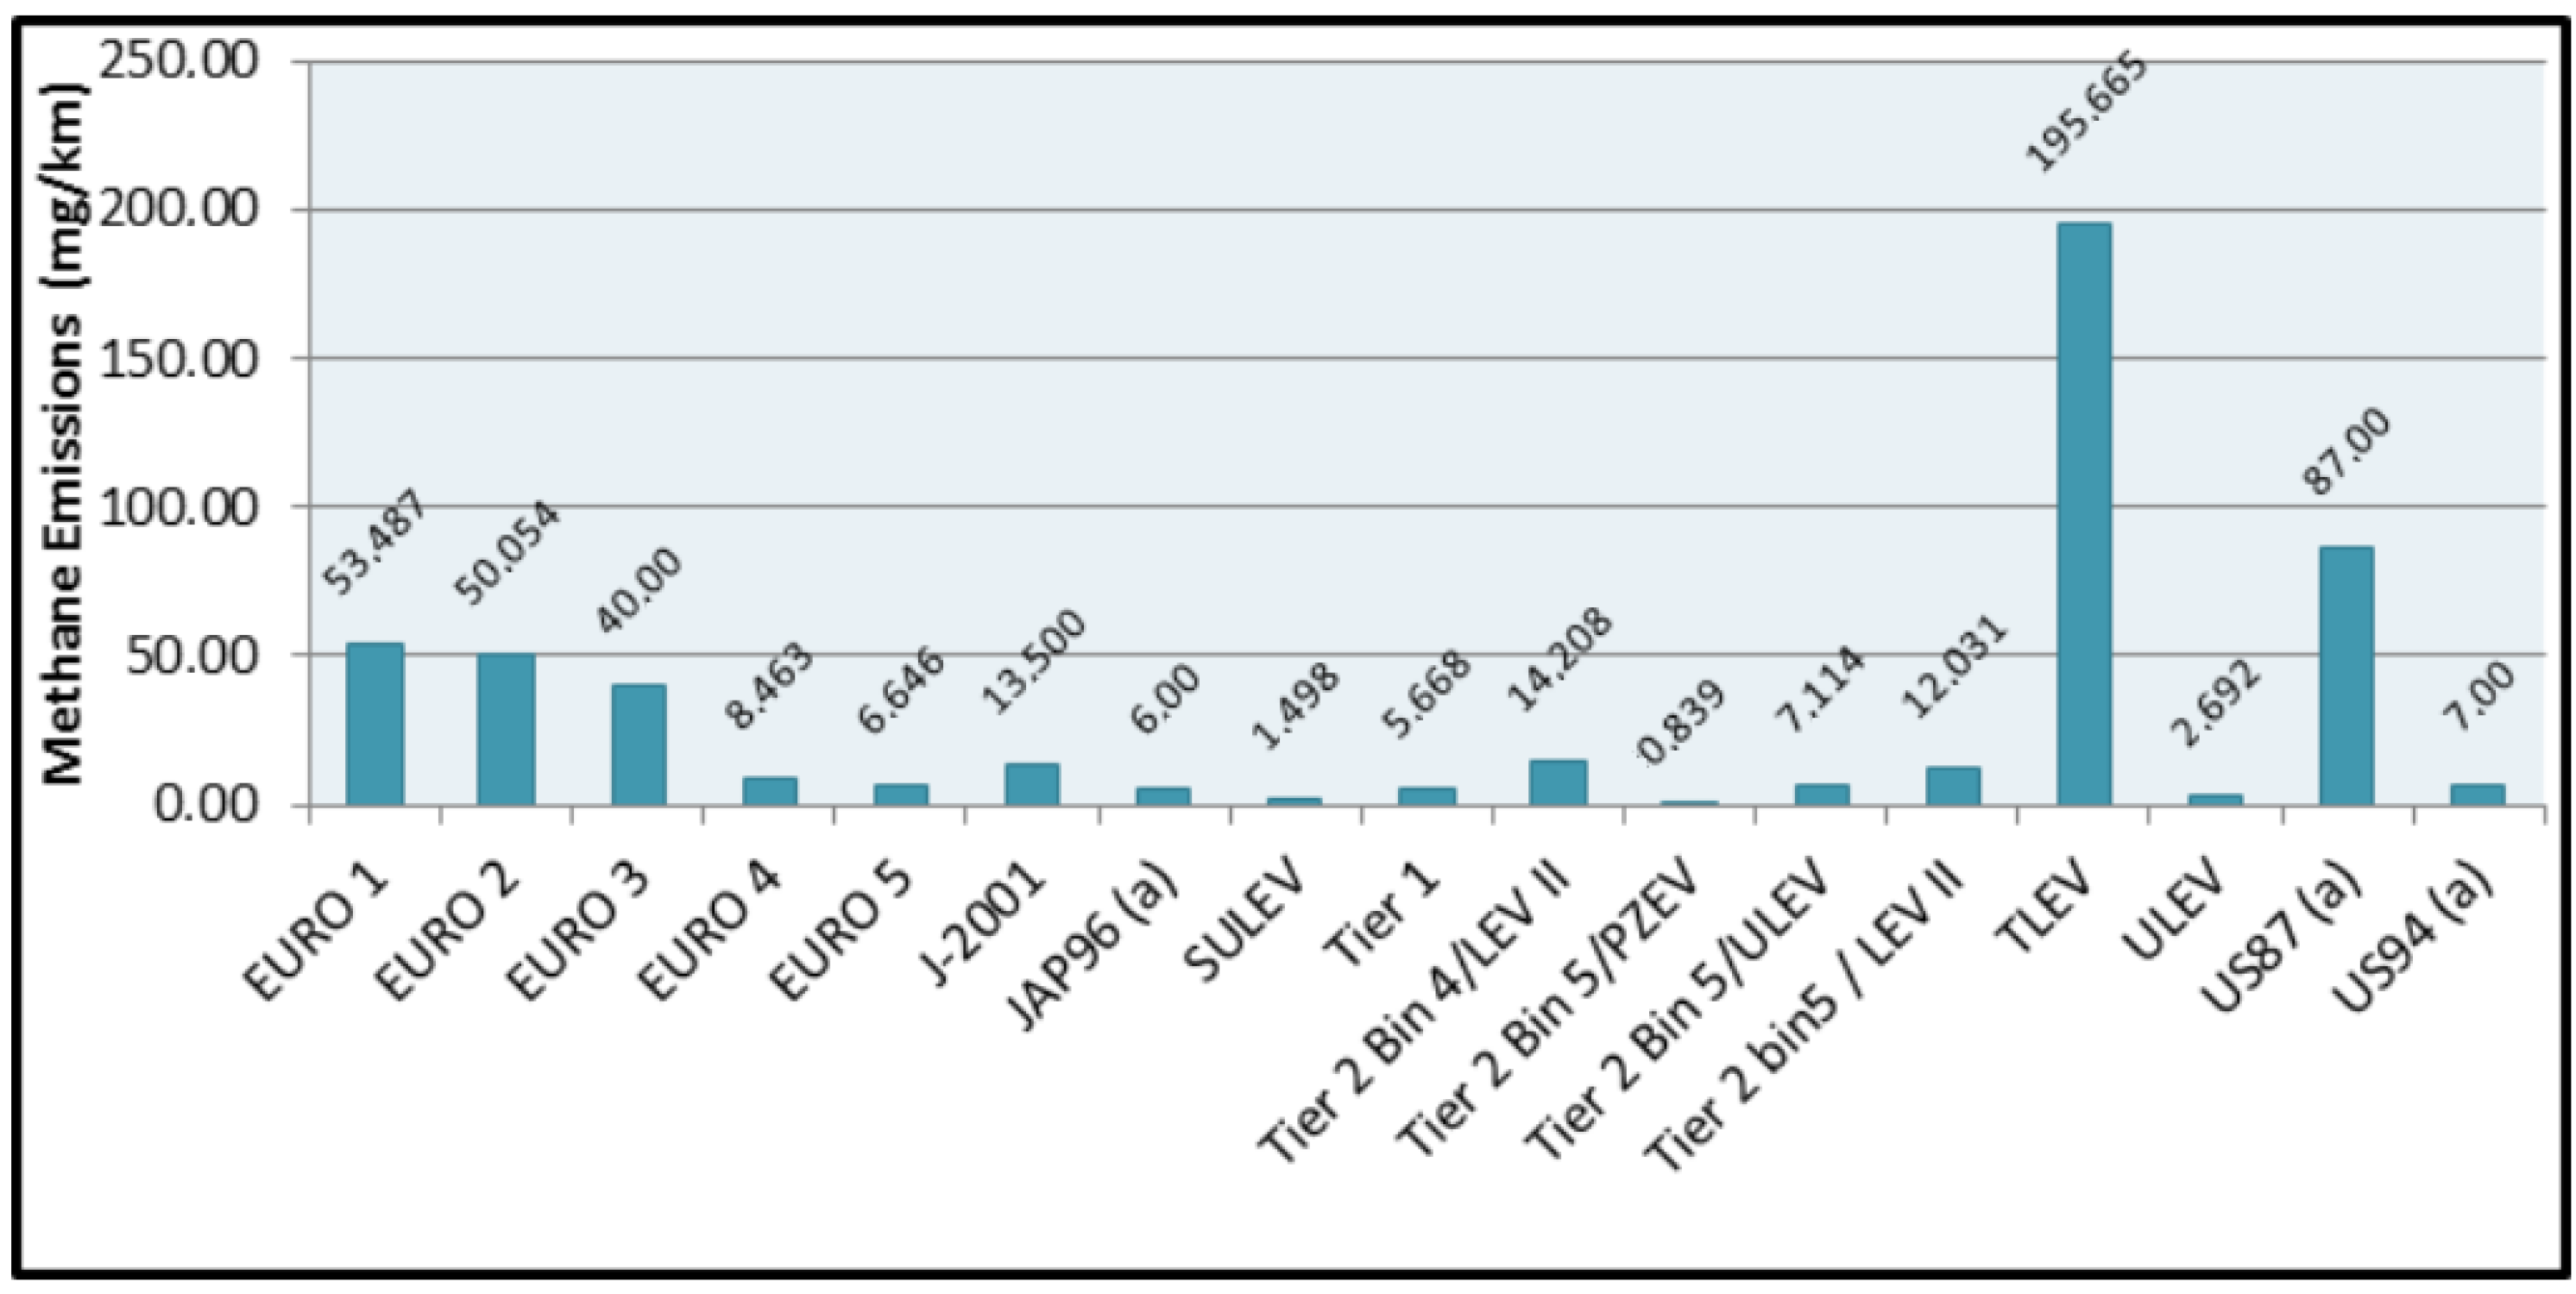
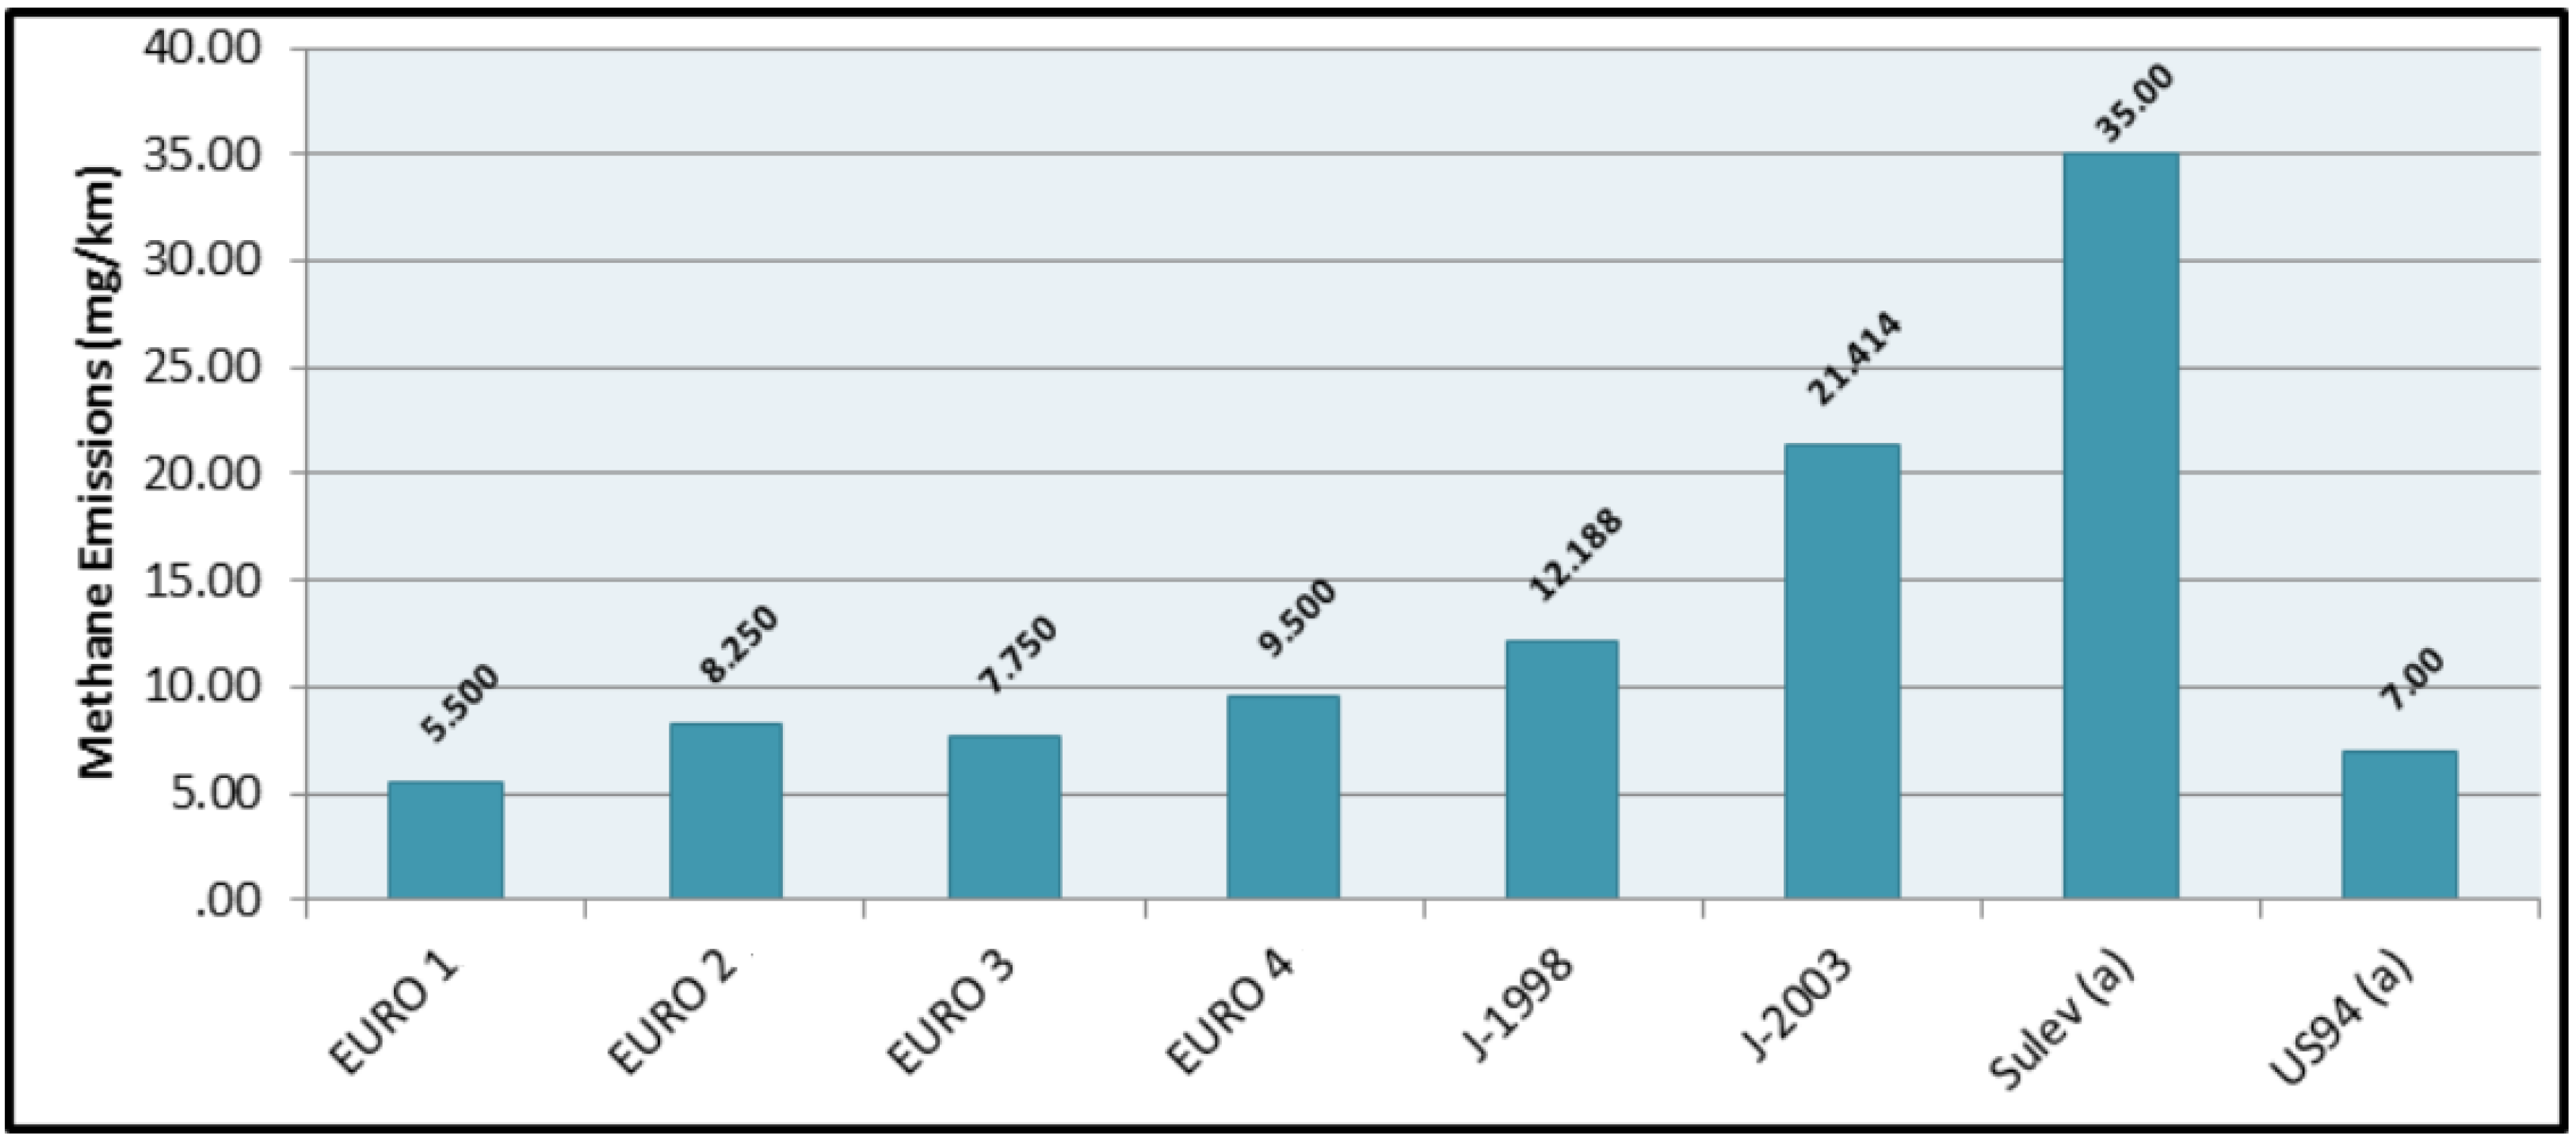
3.2. Emission Standards

Figure 2 and Figure 3 depict average methane emissions for Otto and Diesel engine vehicles for several European and non- European regulations of commercial vehicles tested. In the case of Otto engine vehicles, a constant decrease is observed for the vehicles of EURO 1 to EURO 5 emission technology. In the case of non- European regulations average gasoline CH4 emissions decrease from US87 to US94 regulations. It is noted that as in commercial vehicle engines, the Selective Catalytic Reduction (SCR technology) became the norm for the most part in Europe since the introduction of Euro IV vehicle technology, the reduction of CH4 emissions from EURO3 to EURO4 is impressive.
As far as diesel engine vehicles are concerned, a decrease is observed from EURO 1 to EURO 3 emission technology; whereas EURO 4 emission technology seems to have slighter higher emissions than EURO 3. The latter can be attributed to the tax incentives. In the case of non-European regulations, average diesel CH4 emissions increase in the case of SULEV to US94.

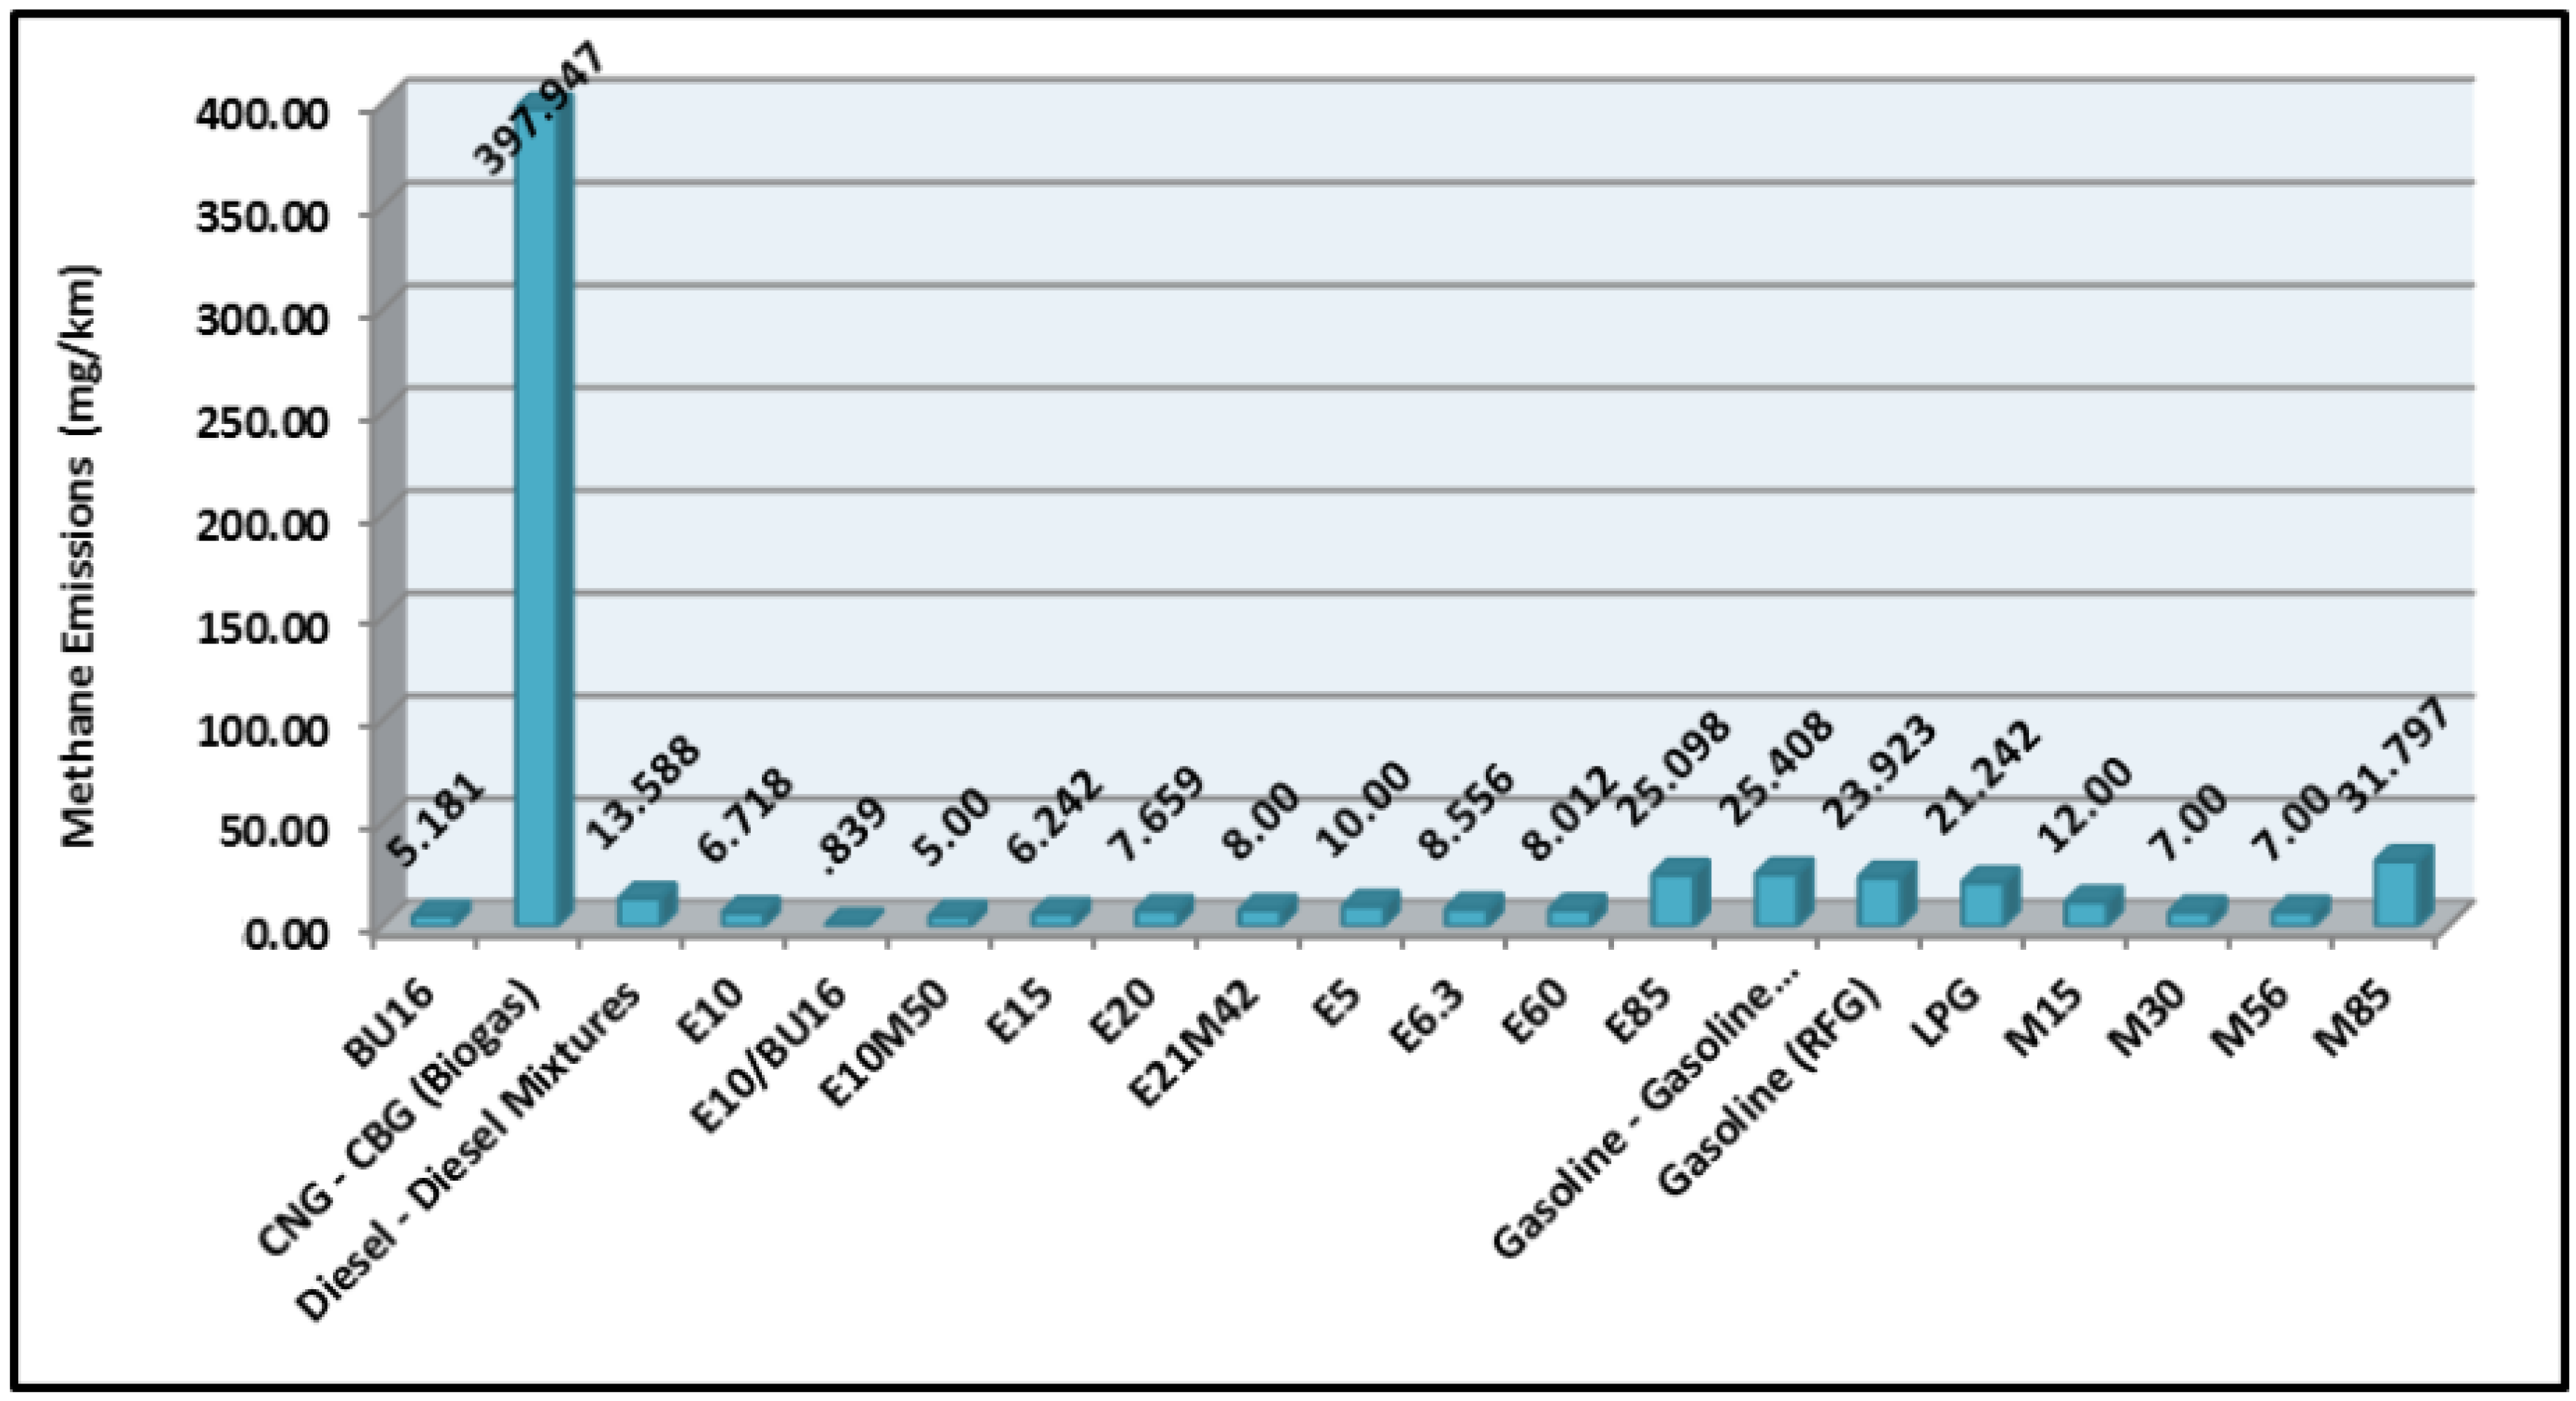
3.3. Fuel Properties

Table 2 illustrates the correlation between CH4 emissions and different fuel properties. It is obvious that CH4 emissions are positive correlated to the percentage of aromatic hydrocarbons, as well as gasoline’s content of olefins and paraffins; whereas CH4 emissions are negative correlated to the percentage of Methyl ter-butyl-ether (MTBE) in gasoline–MTBE blends, as well as to the percentage of oxygen in gasoline. It is also deducted that there is no correlation between CH4 emissions and diesel’s sulfur content (r = −0.47); whereas are correlated with gasoline’s octane number (r = 0.51). The latter can be attributed to the reduction of produced SO2, from the CH4 produced during the following reaction:
2SO2 + CH4 → H2O + 2S + CO2
It should be noted that with diesel fuel, ignition quality is also a main performance criterion. Diesel fuel ignitability is specified by its cetane number which, like octane number, is measured in a stationary engine and specified by comparison to reference fuels. Whereas gasoline must be resistant to auto ignition, diesel fuel is required to auto ignite readily. This is because combustion proceeds without spark ignition, i.e., burning must commence spontaneously as the fuel is injected into a gas mixture that has been heated adiabatically by piston compression. Whereas gasoline ignition quality is dictated by performance at severe, high load conditions, diesel ignition quality is most critical under cold start and light load conditions—the fuel must ignite easily enough to allow start-up and smooth running under cold condition.
CNG vehicles have higher emissions than gasoline and diesel cars (Figure 4). This is due to the unburned fuel which is mainly methane, while this pollutant is mainly formed during the combustion process from the higher hydrocarbons in gasoline and diesel powered vehicles. Methane emissions from CNG vehicles decrease with technology, but there is no clear trend in the case of gasoline and diesel. As per data analysis, it is shown that emissions from natural gas fueled vehicles, decrease with model year (later models emit less) and increase with vehicle mileage, and generally are about an order of magnitude higher than methane emissions from gasoline vehicles of similar technology and age.
Methane emissions increase significantly with ethanol content, having a strong correlation of r = 0.89 (Table 2). The abovementioned is significant as it indicated that show that vehicles running on ethanol have very different CH4 emission characteristics compared to vehicles running on methanol. The results show that CH4 emissions tend to increase with ethanol content, which is the reverse of what occurs with methanol. This can be attributed to the fact that adding ethanol to gasoline results to oxygenate the fuel. The higher the ethanol blend, the higher the oxygen content in the fuel. The increased oxygen in the fuel changes the stoichiometric air/fuel ratio of the fuel. The stoichiometric air/fuel ratio is the chemically correct or theoretical air to fuel ratio which provides the minimum amount of oxygen for the conversion of all the fuel into completely oxidized products. For a hydrocarbon-based fuel, this means that all the carbon in the fuel is converted to CO2 and the hydrogen to water, H2O.
Methanol vehicles emit less CH4 compared to gasoline vehicles. For instance, Figure 4 indicates that methanol vehicles generally emit less CH4 than do gasoline vehicles of the same model. Data analysis suggests that dedicated M85 vehicles (which use a mixture of 85% methanol and 15% gasoline) emit about 2/3 as much CH4 as gasoline vehicles.

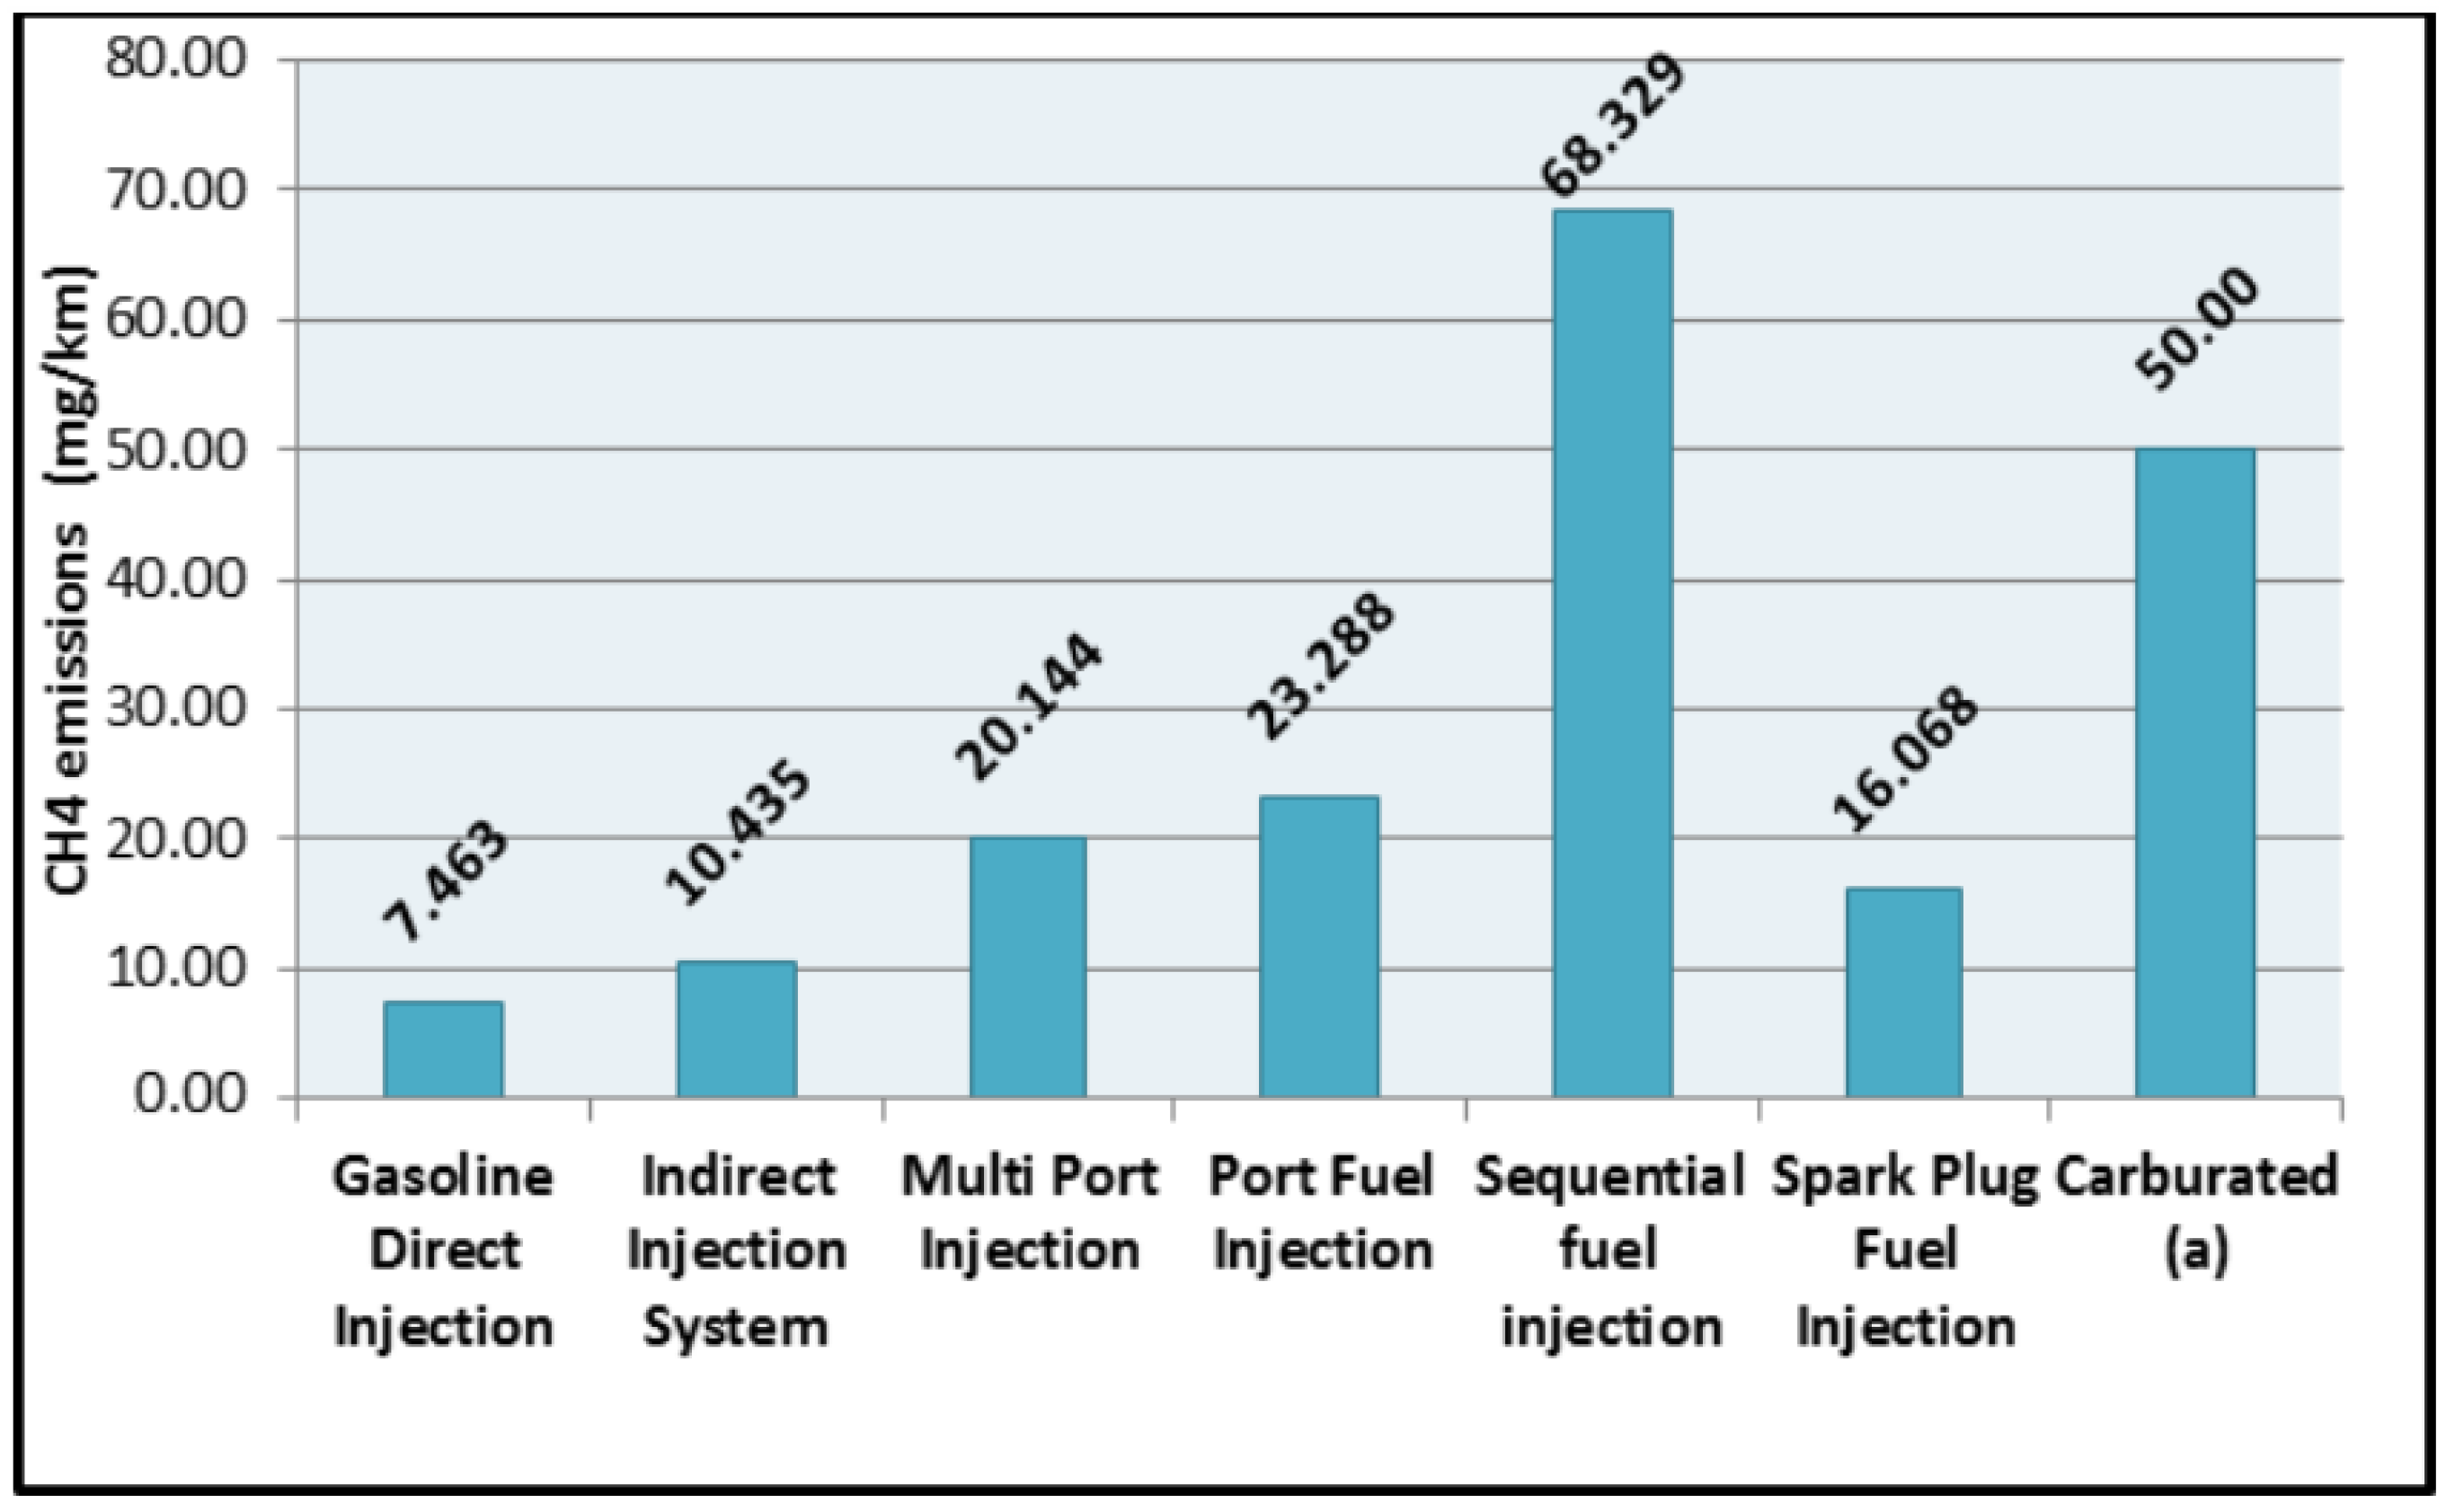
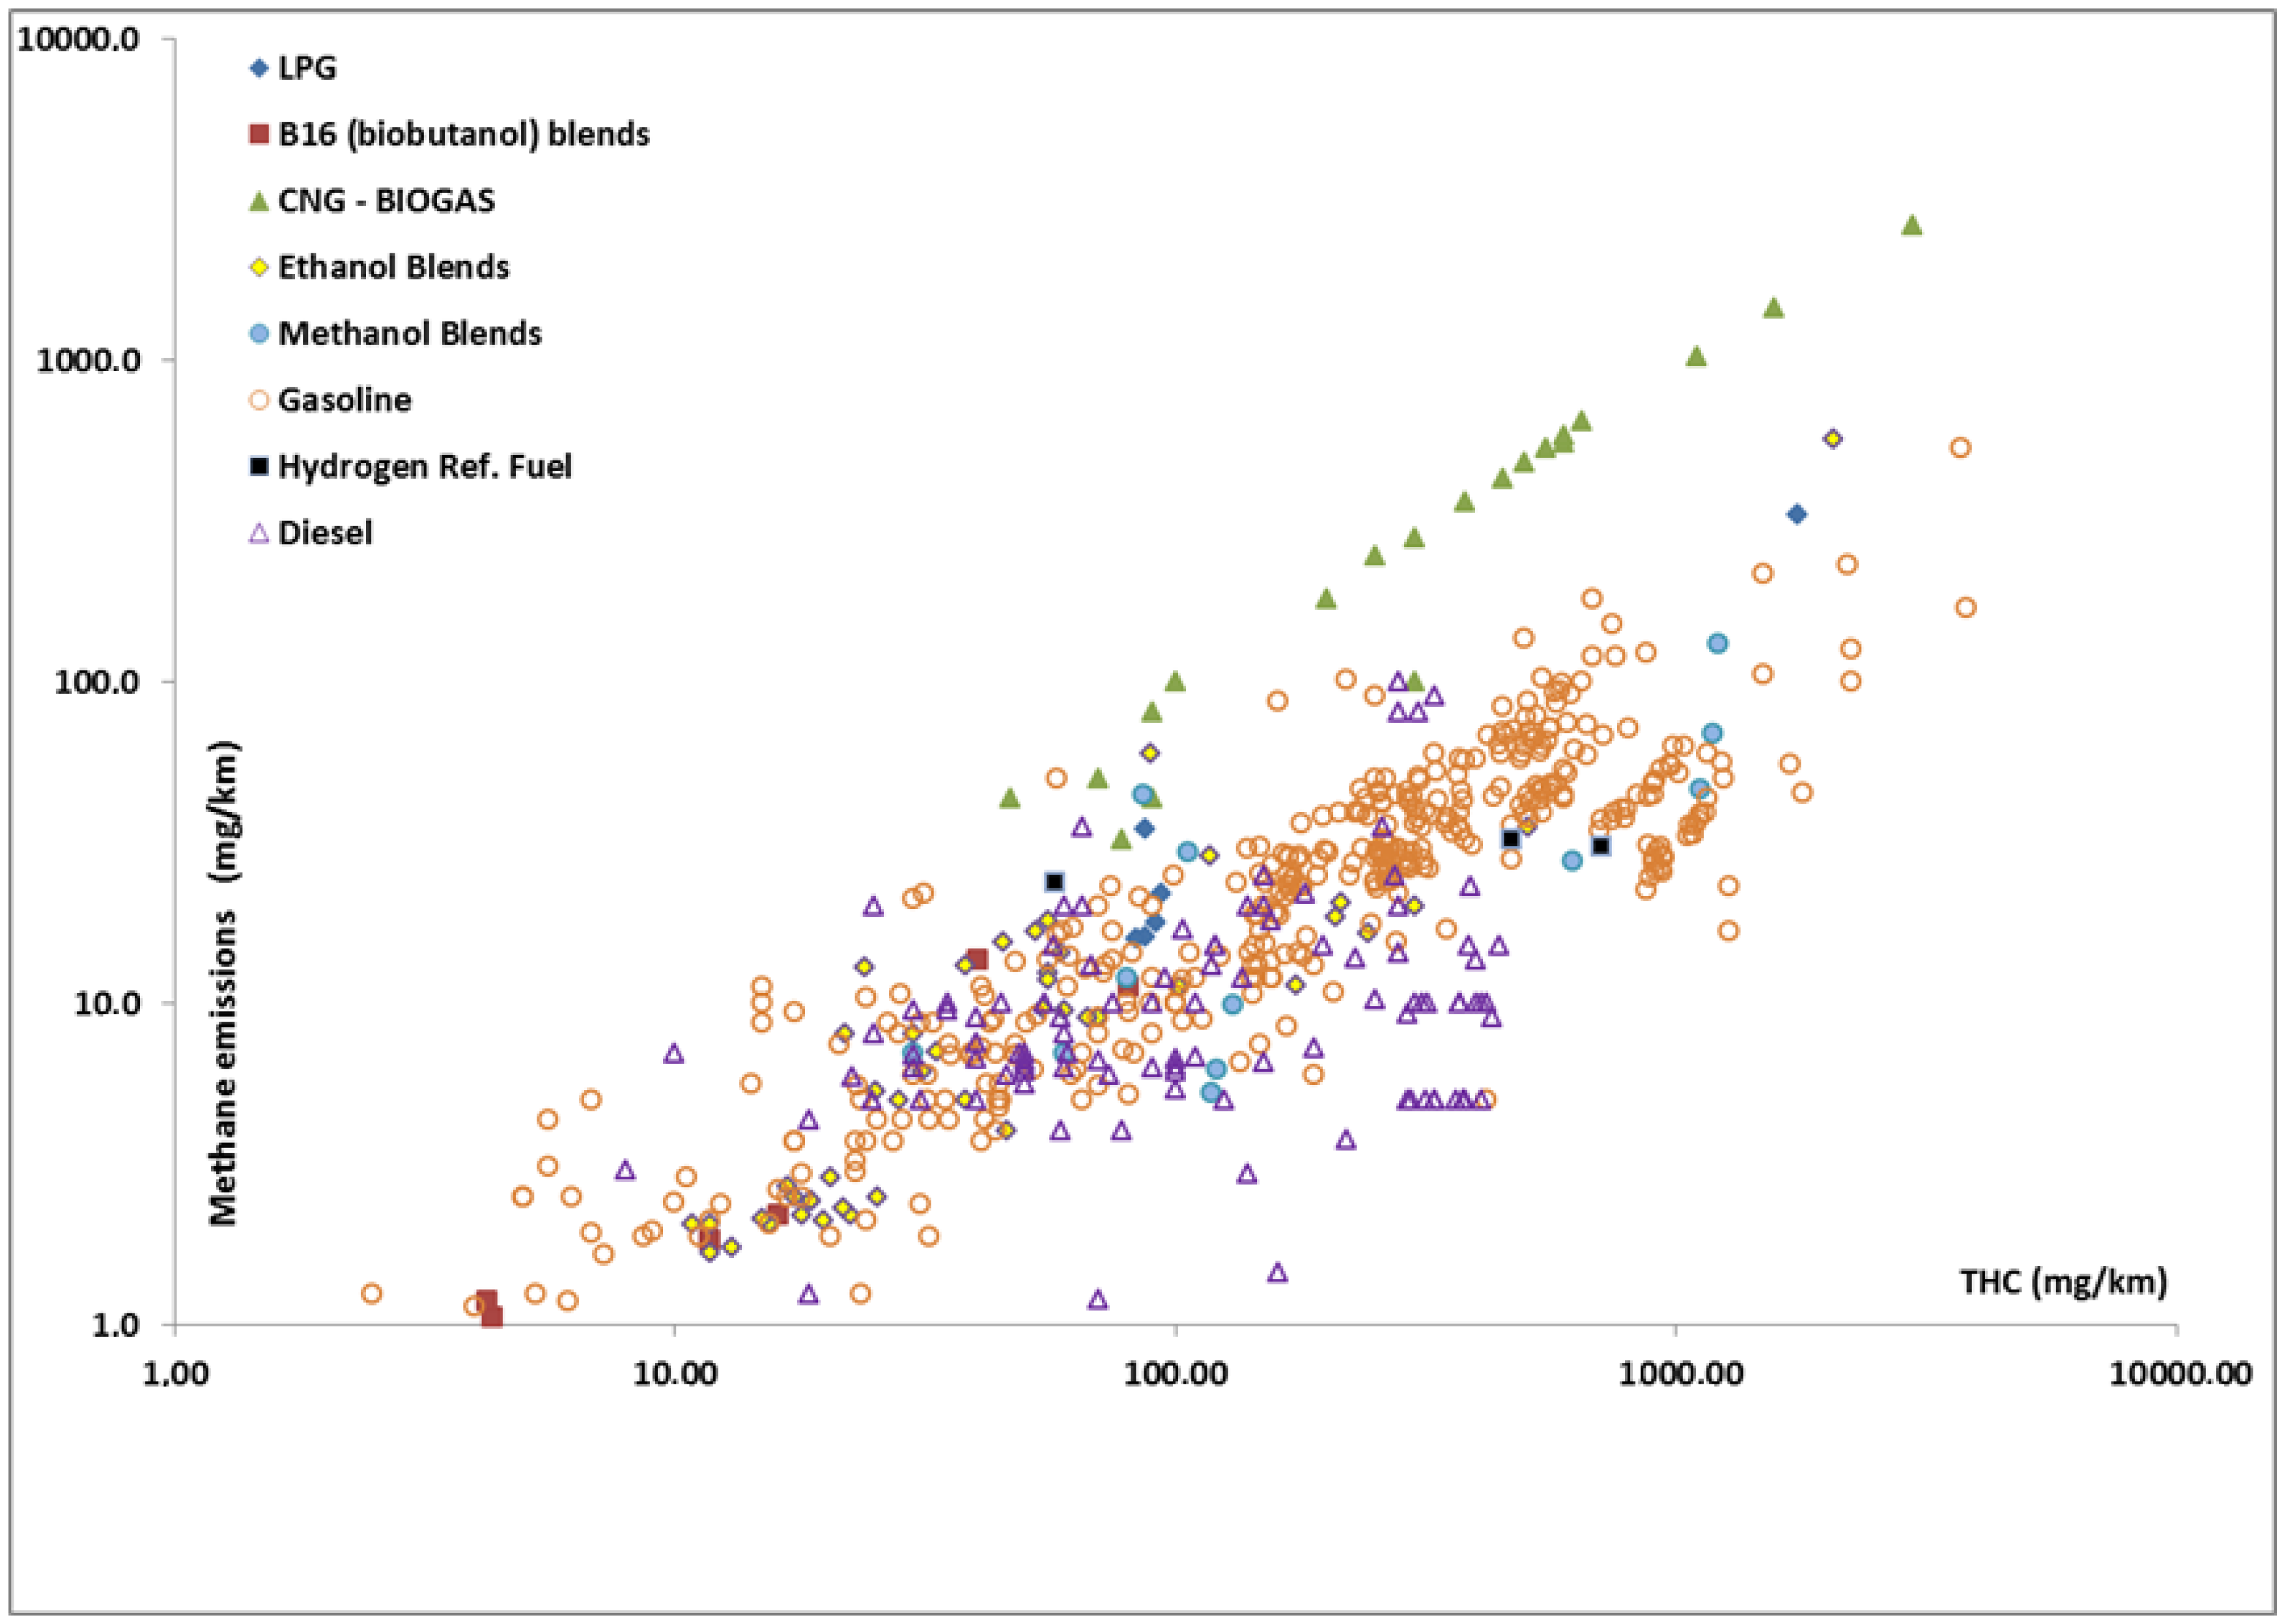
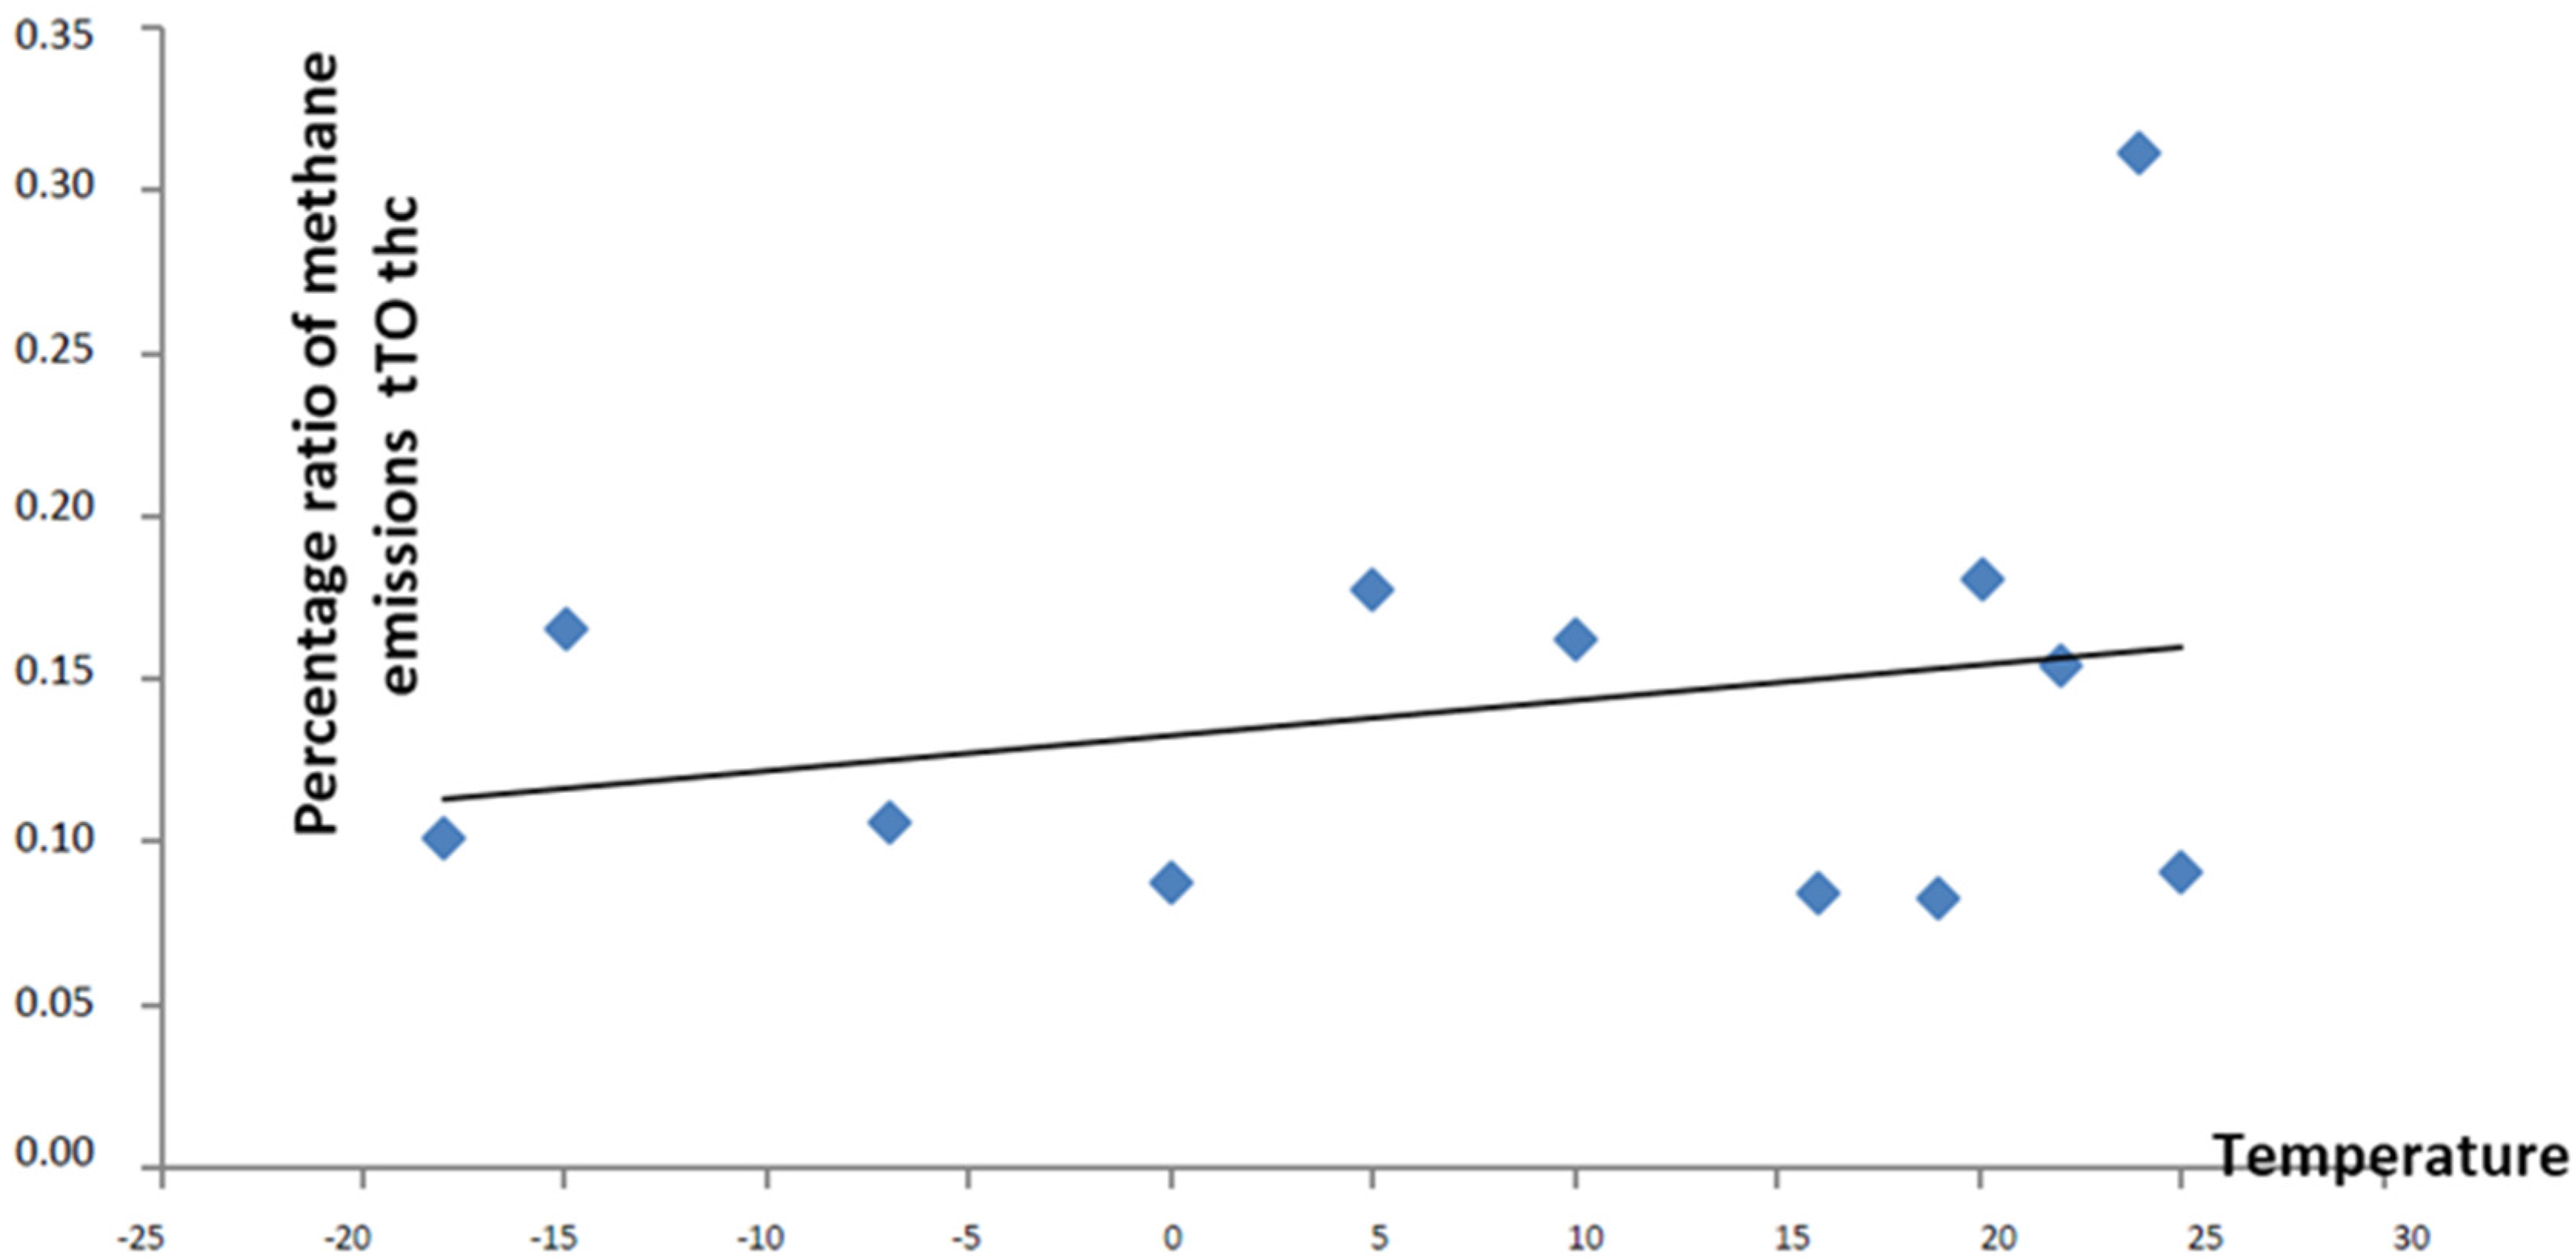
3.4. Exhaust Emissions

Table 3 examines the relation between exhaust emissions and CH4 emissions. The variables examined include the following emissions: CO2, CO, NOx as well as THC. In regards to CO2, CO and NOx emissions, 482 vehicles were examined,whereas in regards to assessment of TCH emissions 647 vehicles were examined.
Table 3 indicates a positive correlation between methane emissions and CO2, CO, ΝΟx emissions, in all types of vehicles. Correlation coefficients are higher for Otto engine vehicles compared to Diesel engine vehicles. Especially, in the case of Diesel engine vehicles, correlation coefficient increases for vehicles that have been manufactured after 2000. In addition, the data of Table 3 show that as THC is reduced, methane is also reduced in a proportional manner. Thus, as vehicle technology advances to meet stricter organic compound emission standards, it is reasonable to expect that methane emissions will also decline.Hydrocarbons derive from the incomplete combustion of fuel, lubricating oil and pyrosynthetic reactions, presents a large variety of compounds, including alkanes, alkenes, aromatics as well as oxygenated organic compounds.
Statistically significant relations between both CH4 and THC are found. From total HC emitted, more than 60% correspond to methane in the case of gasoline engine vehicles. The emissions ratio of CH4/ΤΗC increases as the percentage of ethanol increases in gasoline-ethanol blends (Figure 5). As indicated by Figure 6, the emission ratio of CH4/ΤΗC is not correlated to temperature.

4. Conclusions

About half of the world’s population lives in urban areas and the future population growth will happen mostly in urban areas. How urban dwellers choose their infrastructure, technology, consumption and lifestyle will determine the global GHG emissions. To support the global GHG mitigation, several new strands of research for developing a better understanding of mitigation opportunities, governance and incentives systems for urban areas are necessary. The goals of research and actions in urban areas should be to reduce the overall urban carbon footprint, taking into a broader system perspective. In order to advance the urban research on GHG mitigation, we identified a number of key research issues.
The findings of this study indicated that natural gas vehicles can play a significant role in reducing emissions in the transportation sector. When used in vehicles, natural gas the fossil fuel (predominantly methane) result in reduced emissions of almost all regulated and non-regulated emissions compared to gasoline and diesel-fuelled vehicles possibly with one exception: total hydrocarbons. Nonetheless it should be mentioned that although CH4 emissions from gasoline vehicles (in terms of global warming potential) are lower than N2O emissions, these are increased in natural gas-fueled vehicles (given that methane is the primary component of natural gas). It should be noted that the results of this study could be verified with the use of other methods like artificial intelligence (AI), so as to translate descriptive factors into functions [85].
On light-duty gasoline vehicles, modern three-way catalyst-based emission control technology is effective at reducing all hydrocarbon exhaust emissions including methane. Tightening of hydrocarbon emission standards over time with the parallel introduction of more effective emission control systems have resulted in lower emissions of methane from today’s vehicles compared to older vehicles certified to less stringent standards. Catalyst designs can also be optimized in concert with engine control strategies to oxidize methane exhaust emissions from motor vehicles including vehicles that operate exclusively on natural gas or bi-fuel vehicles that can operate on either natural gas or gasoline. Natural gas could also be important for cutting CO2 emissions from heavy-duty vehicles (HDVs). Moreover natural gas vehicles can contribute to a low carbon transportation sector by: improving air quality and reducing noise in urban areas; diverting oil from domestic consumption to export; improving energy security; and reducing government spending on road fuel subsidies. Nevertheless it should be noticed that despite the fact that natural gas can play a significant role in cutting vehicle carbon dioxide (CO2) emissions, over the long term there will need to be a commitment to transition to very low CO2 gas sources, such as biogas or bio-synthetic gas.
The analysis of this study can play a significant role in the development of a low carbon city by identifying policies and programs for energy saving and carbon emissions reduction across the transportation sector. The dissemination of the abovementioned information will give the ability to local governments not only to gather resources, but also the legislative power to devise plans and enforce them. These are crucial factors for low carbon governance across the cities. In this direction, regulatory conditions should be changed and financial incentives should be provided. Additionally, the public sector cans co-ordinate stakeholders to align their expectations and actions towards a common goal of an energy transition to a low carbon city. The adoption of alternative fuel vehicles is not possible to take off without co-ordination between automakers, fuel suppliers and governments. Co-ordination is essential on pilot region selection, target market, vehicle portfolio selection, asymmetric incentives for urban and rural stations, other incentive packages and standardization. Government intervention will also be required to break through the technological lock-in of existing technologies or path dependence. In view of the abovementioned, the findings of this study can be further developed by investigating the combined use of other alternative transportation fuels, so as to provide a useful policy tool for decision-makers, in order to develop a sustainable transport system.

Author Contributions

Efthimios Zervas conceived the idea of this study, provided the data and had the general supervision of this work; George Dalianis, George Xydis and Evanthia Nanaki analyzed the data; Evanthia Nanaki wrote the paper.

Conflicts of Interest

The authors declare no conflict of interest.

References

  1. Intergovernmental Panel for Climate Change, 2006: 2006 IPCC Guidelines for National Greenhouse Gas Inventories. Available online: http://www.ipcc-nggip.iges.or.jp/public/2006gl/index.html (accessed on 10 December 2015).
  2. Simpson, I.J.; Blake, D.R.; Rowland, F.S.; Chen, T.Y. Implications of the recent fluctuations in the growth rate of tropospheric methane. Geophys. Res. Lett. 2002, 29, 117:1–117:4. [Google Scholar] [CrossRef]
  3. Dlugokencky, E.J.; Houweling, S.; Bruhwiler, L.; Masarie, K.A.; Lang, P.M.; Miller, J.B.; Tans, P.P. Atmospheric methane levels off: Temporary pause or a new steady-state? Geophys. Res. Lett. 2003, 30. [Google Scholar] [CrossRef]
  4. NOAA. National Oceanic and Atmospheric Administration, Interactive Atmospheric Data Visualization, 2003–2008 Airborne Methane Mixing Ratios Measured 1000–2000 Meters above Sea Level over Trinidad Head, California. 2008. Available online: http://www.esrl.noaa.gov/gmd/ccgg/iadv (accessed on 25 September 2008). [Google Scholar]
  5. Baumert, K.; Herzog, T.; Jonathan, P. Navigating the Numbers Greenhouse Gas Data and International Climate Policy; World Resources Institute: Washington, DC, USA, 2005. [Google Scholar]
  6. Annual European Union Greenhouse Gas Inventory 1990–2010 and Inventory Report 2012. Available online: http://www.eea.europa.eu/publications/european-union-greenhouse-gas-inventory-2012 (accessed on 20 December 2015).
  7. Nylund, N.O.; Erkkilä, K.; Lappi, M.; Ikonen, M. Transit Bus Emission Study: Comparison of Emissions from Diesel and Natural Gas Buses; VTT Technical Research Centre of Finland: Helsinki, Finland, 15 October 2004. [Google Scholar]
  8. Environment Canada. Global Warming Potentials. 2011. Available online: http://www.ec.gc.ca/ges-ghg/default.asp?lang=En&n=CAD07259-1 (accessed on 28 July 2015).
  9. Climate Action. 2015. Available online: http://ec.europa.eu/clima (accessed on 9 August 2015).
  10. International Energy Agency. The Contribution of Natural Gas Vehicles to Sustainable Transport. International Energy Agency Working Paper. 2010. Available online: http://www.iea.org/publications/freepublications/publication/natural_gas_vehicles.pdf (accessed on 6 December 2015).
  11. Takeshita, T. Assessing the co-benefits of CO2 mitigation on air pollutants emissions from road vehicles. Appl. Energy 2012, 97, 225–37. [Google Scholar] [CrossRef]
  12. Nanaki, E.; Koroneos, C. Comparative LCA of the use of biodiesel, diesel and gasoline for transportation. J. Clean. Prod. 2012, 20, 14–19. [Google Scholar] [CrossRef]
  13. Nanaki, E.A.; Koroneos, C.J.; Xydis, G.A.; Rovas, D. Comparative Environmental Assessment of Athens Urban Buses—Diesel, CNG and Biofuel Powered. Transp. Policy 2014, 35, 311–318. [Google Scholar] [CrossRef]
  14. Adcock, J.; Allen, B.; Cleary, R.; Dobbins, C.; Grooms, L.; Hayzen, G.; Hutcheson, S.; Johnson, M.; Johnston, B.; Jordan, B.; et al. Design and Construction of the University of Tennessee, Knoxville FutureTruck 2000/2001 Parallel Hybrid Vehicle; SAE Technical Paper 2002-01-1213; SAE International: Warrendale, PA, USA, 2002. [Google Scholar]
  15. Andrews, G.; Ahamed, F.; Li, H. Condensable and Gaseous Hydrocarbon Emissions and Their Speciation for a Real World SI Car Test; SAE Technical Paper 2007-01-0062; SAE International: Warrendale, PA, USA, 2007. [Google Scholar]
  16. Bach, C.; Lämmle, C.; Bill, R.; Soltic, P.; Dyntar, D.; Janner, P.; Boulouchos, K.; Onder, C.; Landenfeld, T.; Kercher, L.; et al. Clean Engine Vehicle A Natural Gas Driven Euro-4/SULEV with 30% Reduced CO2-Emissions; SAE Technical Paper 2004-01-0645; International: Warrendale, PA, USA, 2004. [Google Scholar]
  17. Baker, N.; Presnell, K. Investigation of the Effects of Wheel Slip on Vehicle Emissions and Fuel Economy; SAE Technical Paper 2006-01-1358; SAE International: Warrendale, PA, USA, 2006. [Google Scholar]
  18. Baronick, J.; Heller, B.; Lach, G.; Luf, H. Modal Measurement of Raw Exhaust Volume and Mass Emissions by SESAM; SAE Technical Paper 980047; SAE International: Warrendale, PA, USA, 1998. [Google Scholar]
  19. Bates, G.; Germano, S. Vehicle Tail Pipe Emissions—A Comparison of Natural Gas and Petrol Injection; SAE Technical Paper 942042; SAE International: Warrendale, PA, USA, 1994. [Google Scholar]
  20. Bell, A.; Yates, A. An Evaluation of the Speciated Exhaust Emissions Associated with South African Gasolines in an EU4 Vehicle. SAE Int. J. Fuels Lubr. 2009, 1, 1419–1432. [Google Scholar] [CrossRef]
  21. Bohac, S.V.; Han, M.; Jacobs, T.J.; López, A.J.; Assanis, A.N.; Szymkowicz, P.G. Speciated Hydrocarbon Emissions from an Automotive Diesel Engine and DOC Utilizing Conventional and PCI Combustion; SAE Technical Paper 2006-01-0201; SAE International: Warrendale, PA, USA, 2006. [Google Scholar]
  22. Brett, S.C.; Eade, D.; Hurley, R.G.; Gregory, D.; Collins, N.R.; Morris, D.; Collingwood, I.T. Evaluation of Catalysed Hydrocarbon Traps in the EGI System: Potential for Hydrocarbon Emissions Reduction; SAE Technical Paper 981417; SAE International: Warrendale, PA, USA, 1998. [Google Scholar]
  23. Cadle, S.H.; Groblicki, P.J.; Gorse, R.A.; Hood, J.; Korduba-Sawicky, D.; Sherman, M. A Dynamometer Study of off-Cycle Exhaust Emissions—The Auto/Oil Air Quality Improvement Research Program; SAE Technical Paper 971655; SAE International: Warrendale, PA, USA, 1997. [Google Scholar]
  24. Chan, T.; Meloche, E.; Kubsh, J.; Brezny, R.; Rosenblatt, D.; Rideout, G. Impact of Ambient Temperature on Gaseous and Particle Emissions from a Direct Injection Gasoline Vehicle and its Implications on Particle Filtration. SAE Int. J. Fuels Lubr. 2013, 6, 350–371. [Google Scholar] [CrossRef]
  25. Chandler, K.; Whalen, M.; Westhoven, J. Final Results From The State of Ohio Ethanol-Fueled Light-Duty Fleet Deployment Project; SAE Technical Paper 982531; SAE International: Warrendale, PA, USA, 1998. [Google Scholar]
  26. Crane, M.; Thring, R.; Podnar, D.; Dodge, L. Reduced Cold-Start Emissions Using Rapid Exhaust Port Oxidation (REPO) in a Spark-Ignition Engine; SAE Technical Paper 970264; SAE International: Warrendale, PA, USA, 1997. [Google Scholar]
  27. Delgado, R.; Paz, S. Effect of Different Ethanol-Gasoline Blends on Exhaust Emissions and Fuel Consumption; SAE Technical Paper 2012-01-1273; SAE International: Warrendale, PA, USA, 2012. [Google Scholar]
  28. Fanick, E.; Merritt, P.; Eng, K. Development of a Synthetic Diesel Exhaust. SAE Int. J. Engines 2009, 1, 65–70. [Google Scholar] [CrossRef]
  29. Fanick, E.; Whitney, K.; Bailey, B. Particulate Characterization Using Five Fuels; SAE Technical Paper 961089; SAE International: Warrendale, PA, USA, 1996. [Google Scholar]
  30. Gerini, A.; Monnier, G.; Bonetto, R. Ultra Low Emissions Vehicle Using LPG Engine Fuel; SAE Technical Paper 961079; SAE International: Warrendale, PA, USA, 1996. [Google Scholar]
  31. Goodfellow, C.; Gorse, R.; Hawkins, M.; McArragher, J. European Programme on Emissions, Fuels and Engine Technologies (EPEFE)—Gasoline Aromatics/E100 Study; SAE Technical Paper 961072; SAE International: Warrendale, PA, USA, 1996. [Google Scholar]
  32. Guenther, M.; Brown, K.; Landry, M.; Sherman, M.; Wu, D.Y. Refinement of a Bag Mini-Diluter System; SAE Technical Paper 2001-01-0212; SAE International: Warrendale, PA, USA, 2001. [Google Scholar]
  33. Guenther, M.; Wroza, L.; Polster, M. Update on Emissions Measurement Performance of a PZEV Test Cell; SAE Technical Paper 2006-01-1359; SAE International: Warrendale, PA, USA, 2006. [Google Scholar]
  34. Hammerle, R.H.; Ketcher, D.; Horrocks, R.W.; Lepperhoff, G.; Hüthwohl, G.; Lüers, B. Emissions from Diesel Vehicles with and without Lean NOx and Oxidation Catalysts and Particulate Traps; SAE Technical Paper 952391; SAE International: Warrendale, PA, USA, 1995. [Google Scholar]
  35. Hammerle, R.H.; Ketcher, D.A.; Horrocks, R.W.; Lepperhoff, G.; Hüthwohl, G.; Lüers, B. Emissions from Current Diesel Vehicles; SAE Technical Paper 942043; SAE International: Warrendale, PA, USA, 1994. [Google Scholar]
  36. Hartley, G.; Bykowski, B.; Welstand, S.; Lax, D. Effects of Catalyst Formulation on Vehicle Emissions with Respect to Gasoline Fuel Sulfur Level; SAE Technical Paper 1999-01-3675; SAE International: Warrendale, PA, USA, 1999. [Google Scholar]
  37. Heimrich, M.; Andrews, C. On-Board Hydrogen Generation for Rapid Catalyst Light-off; SAE Technical Paper 2000-01-1841; SAE International: Warrendale, PA, USA, 2000. [Google Scholar]
  38. Hoekman, S.; Jensen, T. Methanol Vehicle Emissions Round Robin Test Program; SAE Technical Paper 932773; SAE International: Warrendale, PA, USA, 1993. [Google Scholar]
  39. Jehlik, F.; Jones, M.; Shepherd, P.; Norbeck, J.M.; Johnson, K.; McClanahan, M. Development of a Low-Emission, Dedicated Ethanol-Fuel Vehicle with Cold-Start Distillation System; SAE Technical Paper 1999-01-0611; SAE International: Warrendale, PA, USA, 1999. [Google Scholar]
  40. Jemma, C.; Lance, D.; Shore, P. Speciation of Hydrocarbon Emissions from European Vehicles; SAE Technical Paper 922376; SAE International: Warrendale, PA, USA, 1992. [Google Scholar]
  41. Jeuland, N.; Dementhon, J.B.; Gagnepain, L.; Plassat, G.; Coroller, P.; Momique, G.C.; Belot, G.; Dalili, D. Performances and Durability of DPF (Diesel Particulate Filter) Tested on a Fleet of Peugeot 607 Taxis: Final Results; SAE Technical Paper 2004-01-0073; SAE International: Warrendale, PA, USA, 2004. [Google Scholar]
  42. Karavalakis, G.; Short, D.; Hajbabaei, M.; Vu, D.; Villela, M.; Russell, R.; Durbin, T.; Asa-Awuku, A. Criteria Emissions, Particle Number Emissions, Size Distributions, and Black Carbon Measurements from PFI Gasoline Vehicles Fuelled with Different Ethanol and Butanol Blends; SAE Technical Paper 2013-01-1147; SAE International: Warrendale, PA, USA, 2013. [Google Scholar]
  43. Karlsson, H.; Gåsste, J.; Åsman, P. Regulated and Non-regulated Emissions from Euro 4 Alternative Fuel Vehicles; SAE Technical Paper 2008-01-1770; SAE International: Warrendale, PA, USA, 2008. [Google Scholar]
  44. Koike, N.; Odaka, M. Methane and Nitrous Oxide (N20) Emission Characteristics from Automobiles; SAE Technical Paper 960061; SAE International: Warrendale, PA, USA, 1996. [Google Scholar]
  45. Kono, N.; Kobayashi, Y.; Takeda, H. Fuel Effects on Emissions from Diesel Vehicles Equipped with Advanced Aftertreatment Devices; SAE Technical Paper 2005-01-3700; SAE International: Warrendale, PA, USA, 2005. [Google Scholar]
  46. Korotney, D.; Rao, V.; Lindhjem, C.; Sklar, M. Reformulated Gasoline Effects on Exhaust Emissions: Phase III; Investigation on the Effects of Sulfur, Olefins, Volatility, and Aromatics and the Interactions Between Olefins and Volatility or Sulfur; SAE Technical Paper 950782; SAE International: Warrendale, PA, USA, 1995. [Google Scholar]
  47. Kwon, Y.K.; Bazzani, R.; Bennett, P.J.; Esmilaire, O.; Scorletti, P.; Morgan, T.D.B.; Goodfellow, C.L.; Lien, M.; Broeckx, W.; Liiva, P. Emissions Response of a European Specification Direct-Injection Gasoline Vehicle to a Fuels Matrix Incorporating Independent Variations in Both Compositional and Distillation Parameters; SAE Technical Paper 1999-01-3663; SAE International: Warrendale, PA, USA, 1999. [Google Scholar]
  48. Lance, D.; Andersson, J. Emissions Performance of Pure Vegetable Oil in Two European Light Duty Vehicles; SAE Technical Paper 2004-01-1881; SAE International: Warrendale, PA, USA, 2004. [Google Scholar]
  49. Lepperhoff, G.; Hüthwohl, G.; Lüers-Jongen, B.; Hammerle, R. Methods to Analyze Non-Regulated Emissions from Diesel Engines; SAE Technical Paper 941952; SAE International: Warrendale, PA, USA, 1994. [Google Scholar]
  50. Li, H.; Andrews, G.E.; Daham, B.; Bell, M.; Tate, J.; Ropkins, K. Impact of Traffic Conditions and Road Geometry on Real World Urban Emissions Using a SI Car; SAE Technical Paper 2007-01-0308; SAE International: Warrendale, PA, USA, 2007. [Google Scholar]
  51. Li, H.; Andrews, G.; Khan, A. VOC Emissions and OFP Assessment for Two Real World Urban Driving Cycles using a EURO 2 SI Car. SAE Int. J. Fuels Lubr. 2009, 1, 624–645. [Google Scholar] [CrossRef]
  52. Li, H.; Andrews, G.; Savvidis, D. Influence of Cold Start and Ambient Temperatures on Greenhouse Gas (GHG) Emissions, Global Warming Potential (GWP) and Fuel Economy for SI Car Real World Driving. SAE Int. J. Fuels Lubr. 2010, 3, 133–148. [Google Scholar] [CrossRef]
  53. Li, H.; Andrews, G.E.; Savvidis, D.; Daham, B.; Ropkins, K.; Bell, M.; Tate, J. Comparisons of the Exhaust Emissions for Different Generations of SI Cars under Real World; SAE Technical Paper 2008-01-0754; SAE International: Warrendale, PA, USA, 2008. [Google Scholar]
  54. Urban Driving Conditions; SAE Technical Paper 2008-01-0754; SAE International: Warrendale, PA, USA, 2008.
  55. Li, H.; Andrews, G.E.; Savvidis, D.; Daham, B.; Ropkins, K.; Bell, M.; Tate, J. Impact of Driving Cycles on Greenhouse Gas Emissions and Fuel Economy for SI Car Real World Driving. SAE Int. J. Fuels Lubr. 2009, 1, 1320–1333. [Google Scholar] [CrossRef]
  56. Li, H.; Andrews, G.; Savvidis, D.; Ropkins, K.; Tate, J.; Bell, M. Investigation of Regulated and Non-Regulated Cold Start Emissions using a EURO3 SI Car as a Probe Vehicle under Real World Urban Driving Conditions; SAE Technical Paper 2008-01-2428; SAE International: Warrendale, PA, USA, 2008. [Google Scholar]
  57. Luzenski, D.J.; Bedsole, K.T.; Hill, J.; Nagy, D.B.; Decarteret, S.S. Evaluation of Improved Bag Mini-Diluter System for Low Level Emissions Measurements; SAE Technical Paper 2002-01-0047; SAE International: Warrendale, PA, USA, 2002. [Google Scholar]
  58. Nagy, D.B.; Loo, J.; Tulpa, J.; Schroeder, P.; Middleton, R.; Morgan, C. Evaluation of the Bag Mini-Diluter and Direct Vehicle Exhaust Volume System for Low Level Emissions Measurement; SAE Technical Paper 2000-01-0793; SAE International: Warrendale, PA, USA, 2000. [Google Scholar]
  59. Newkirk, M.; Smith, L.; Payne, M.; Segal, J. Reactivity and Exhaust Emissions from an EHC-Equipped LPG Conversion Vehicle Operating on Butane/Propane Fuel Blends; SAE Technical Paper 961991; SAE International: Warrendale, PA, USA, 1996. [Google Scholar]
  60. Odaka, M.; Koike, N.; Ishii, H.; Suzuki, H.; Goto, Y. N2O Emissions from Vehicles Equipped with Three-Way Catalysts in a Cold Climate; SAE Technical Paper 2002-01-1717; SAE International: Warrendale, PA, USA, 2002. [Google Scholar]
  61. Payne, M.; Segal, J.; Newkirk, M.; Smith, L. Use of Butane as an Alternative Fuel-Emissions from a Conversion Vehicle Using Various Blends; SAE Technical Paper 952496; SAE International: Warrendale, PA, USA, 1995. [Google Scholar]
  62. Pentikäinen, J.; Rantanen, L.; Aakko, P. The Effect of Heavy Olefins and Ethanol on Gasoline Emissions; SAE Technical Paper 2004-01-2003; SAE International: Warrendale, PA, USA, 2004. [Google Scholar]
  63. Petit, A.; Jeffrey, J.; Palmer, F.; Steinbrink, R. European Programme on Emissions, Fuels and Engine Technologies (EPEFE)—Emissions from Gasoline Sulphur Study; SAE Technical Paper 961071; SAE International: Warrendale, PA, USA, 1996. [Google Scholar]
  64. Pischinger, S.; Umierski, M.; Hüchtebrock, B. New CNG Concepts for Passenger Cars: High Torque Engines with Superior Fuel Consumption; SAE Technical Paper 2003-01-2264; SAE International: Warrendale, PA, USA, 2003. [Google Scholar]
  65. Poola, R.B.; Sekar, R.; Ng, H.K.; Baudino, J.H.; Colucci, C.P. The Effects of Oxygen-Enriched Intake Air on FFV Exhaust Emissions Using M85; SAE Technical Paper 961171; SAE International: Warrendale, PA, USA, 1996. [Google Scholar]
  66. Przybyla, G.; Hadavi, S.; Li, H.; Andrews, G. Real World Diesel Engine Greenhouse Gas Emissions for Diesel Fuel and B100; SAE Technical Paper 2013-01-1514; SAE International: Warrendale, PA, USA, 2013. [Google Scholar]
  67. Rantanen, L.; Linnaila, R.; Aakko, P.; Harju, T. NExBTL—Biodiesel Fuel of the Second Generation; SAE Technical Paper 2005-01-3771; SAE International: Warrendale, PA, USA, 2005. [Google Scholar]
  68. Rimkus, W.A.; Larsen, R.P.; Zammit, M.G.; Davies, J.G.; Salmon, G.S.; Bruetsch, R.I. The Natural Gas Vehicle Challenge '92: Exhaust Emission Testing and Results; SAE Technical Paper 922387; SAE International: Warrendale, PA, USA, 1992. [Google Scholar]
  69. Ruetten, O.; Weinowski, R.; Baumgarten, H.; Habermann, K.; Umierski, M. Performance Improvement and Emission Reduction of NGV BiFuel Engines for Passenger Cars; SAE Technical Paper 2004-01-3468; SAE International: Warrendale, PA, USA, 2004. [Google Scholar]
  70. Sherman, M.; Akard, M.; Nakamura, H. Flame Ionization Detector Oxygen Quench Effects on Hydrocarbon Emission Results; SAE Technical Paper 2004-01-1960; SAE International: Warrendale, PA, USA, 2004. [Google Scholar]
  71. Schubert, P.F.; Russell, B.J.; Freerks, R.L.; DeVore, J.; Fanick, E.R. Impact of Ultra-Clean Fischer-Tropsch Diesel Fuel on Emissions in a Light Duty Passenger Car Diesel Engine; SAE Technical Paper 2002-01-2725; SAE International: Warrendale, PA, USA, 2002. [Google Scholar]
  72. Siegl, W.O.; Korniski, T.J.; Richert, J.F.O.; Chladek, E.; Weir, J.E.; Jensen, T.E. A Comparison of the Emissions from a Vehicle in Both Normal and Selected Malfunctioning Operation Modes; SAE Technical Paper 961903; SAE International: Warrendale, PA, USA, 1996. [Google Scholar]
  73. Sun, E.I.; McMahon, W.N.; Peterson, D.; Wong, J.; Stenersen, E.; Dallas, A.J. Evaluation of an Enhanced Constant Volume Sampling System and a Bag Mini Diluter for Near Zero Exhaust Emission Testing; SAE Technical Paper 2005-01-0684; SAE International: Warrendale, PA, USA, 2005. [Google Scholar]
  74. Turner, J.W.G.; Pearson, R.J.; Bell, A.; de Goede, S.; Woolard, C. Iso-Stoichiometric Ternary Blends of Gasoline, Ethanol and Methanol: Investigations into Exhaust Emissions, Blend Properties and Octane Numbers. SAE Int. J. Fuels Lubr. 2012, 5, 945–967. [Google Scholar] [CrossRef]
  75. Usmen, R.; Yassine, M.; Hartrick, M. Vehicle Exhaust Emissions Simulator—A Quality Control Tool to evaluate the Performance of Low Level Emission Sampling and Analytical Systems; SAE Technical Paper 2003-01-0391; SAE International: Warrendale, PA, USA, 2003. [Google Scholar]
  76. Webb, C.; Bykowski, B.; Weber, P.; McKinnon, D. Using Advanced Emission Control Systems to Demonstrate LEV II ULEV on Light-Duty Gasoline Vehicle; SAE Technical Paper 1999-01-0774; SAE International: Warrendale, PA, USA, 1999. [Google Scholar]
  77. Yassine, M.; Dhatt, R.; Laymac, T.; Ta, S. Using a Vehicle Exhaust Emission Simulator (VEES) as a Cross Check Tool for Emission Test Cell Correlation; SAE Technical Paper 2005-01-0687; SAE International: Warrendale, PA, USA, 2005. [Google Scholar]
  78. Yassine, M.; La Pan, M. Impact of Ethanol Fuels on Regulated Tailpipe Emissions; SAE Technical Paper 2012-01-0872; SAE International: Warrendale, PA, USA, 2012. [Google Scholar]
  79. Yassine, M.; Nayfeh, K.; Michell, R.; Chubert, E. Integration of Photoacoustic Innova Analyzer Within Bag Bench for Direct Measurement of Ethanol in Vehicle Emissions; SAE Technical Paper 2009-01-1518; SAE International: Warrendale, PA, USA, 2009. [Google Scholar]
  80. Zervas, E. Emissions of Non-regulated Pollutants from European Passenger Cars of Different Technology; SAE Technical Paper 2010-01-2226; SAE International: Warrendale, PA, USA, 2010. [Google Scholar]
  81. Zervas, E.; Panousi, E. Exhaust Methane Emissions from Passenger Cars; SAE Technical Paper 2010-01-2224; SAE International: Warrendale, PA, USA, 2010. [Google Scholar]
  82. Zhang, F.; Wang, J.H.; Tian, D.L.; Wang, J.X.; Shuai, S.J. Research on Unregulated Emissions from an Alcohols-Gasoline Blend Vehicle Using FTIR, HPLC and GC-MS Measuring Methods. SAE Int. J. Engines 2013, 6, 1126–1137. [Google Scholar] [CrossRef]
  83. Albino, V.; Ardito, L.; Dangelico, R.M.; Petruzzelli, A.M. Understanding the development trends of low-carbon energy technologies: A patent analysis. Appl. Energy 2014, 135, 836–854. [Google Scholar] [CrossRef]
  84. Lucas, S.V.; Loehr, D.A.; Meyer, M.E.; Thomas, J.J.; Gordon, E.E. Exhaust Emissions and Field Trial Results of a New, Oxygenated, Non-Petroleum-Based, Waste-Derived Gasoline Blending Component: 2-Methyltetrahydrofuran; SAE Technical Paper 932675; SAE International: Warrendale, PA, USA, 1993. [Google Scholar]
  85. Hirota, T.; Kojima, K.; Yakushiji, K.; Inoue, T. Effects of Exhaust Emission Control Devices and Fuel Composition on Speciated Emissions of S.I. Engines; SAE Technical Paper 922180; SAE International: Warrendale, PA, USA, 1992. [Google Scholar]
Figure 1. Average CH4 emissions of different OTTO gasoline fueled of gasoline-blended fueled vehicles equipped with exhaust after treatment system and standard driving conditions. (a No exhaust after treatment system).
Energies 09 00128 g001
Figure 2. Emissions Standards—methane emissions for Otto engine vehicles, gasoline fueled with after treatment exhaust.
Energies 09 00128 g002
Figure 3. Emissions Standards—Methane emissions for Diesel engine vehicles.
Energies 09 00128 g003
Figure 4. Average Methane Emissions per different fuel types of vehicles with after treatment exhaust systems. (*Gasoline - Gasoline blended fueled).
Energies 09 00128 g004
Figure 5. Methane emissions and THC emissions per different fuel type.
Energies 09 00128 g005
Figure 6. Percentage of average emissions ratio of CH4/THC per different test temperature.
Energies 09 00128 g006
Table 1. Correlation between CH4 emissions and different vehicle’s variables.
Variable: Vehicles‘ CharacteristicsNumber of vehiclesPearson’s Correlation Coefficient (r)
Engine Volume
All vehicles482−0.04
EURO 4, EURO 5, Otto engine, Gasoline or gasoline blended fueled with exhaust after treatment system35−0.04
Average of data regarding vehicles after 2000, TWC, Gasoline fueled, NEDC, EUDC, FTP-75, US06100.241
Average of vehicles after 2000, Diesel engine, Diesel fueled, EUDC, UDDS50.855
Average of data regarding vehicles before 2000, TWC, Gasoline fueled, NEDC, EUDC, FTP-75, US06130.045
Horsepower
All vehicles101−0.265
Test Temp. >10 °C, TWC82−0.327
Test Temp. >10 °C, TWC, FTP-75, NEDC, EUDC55−0.231
Compression Ratio
All vehicles217−0.162
Cold test, Liquid fueled vehicles136 0.107
No Cold test, Liquid fueled vehicles, FTP-75, NEDC, ECE, EUDC72−0.195
Temperature
All vehicles1170.03
Otto engine, Gasoline or gasoline blended fueled110−0.12
Hyundai Sonata-2011; Volvo S40-20111; Chrysler Town & Country-2001; Gasoline fueled21−0.78
Renault Express—19943−0.90
Exhaust after treatment system
All vehicles4090.30
Vehicles with Otto engine, with exhaust after treatment system4090.33
Vehicles after 2000 with Otto engine, with exhaust after treatment system570.60
Vehicles after 2000 with Otto engine, with exhaust after treatment system—performing testing at ambient temperature370.97
Vehicles with Diesel engine—performing testing at ambient temperature390.21
Vehicles with Diesel engine—performing testing at ambient temperature—EUDC driving cycle110.68
Table 2. Correlation between CH4 emissions and fuel properties.
Variable: Fuel PropertiesNumber of vehiclesPearson’s Correlation Coefficient (r)
Gasoline Composition
% aromatic hydrocarbons, standard driving conditions370.69
% paraffin, standard driving conditions40.90
% olefins, standard driving conditions280.60
% O2, standard driving conditions6−0.88
% MTBE, standard driving conditions3−0.46
Gasoline
% Methanol, Standard driving conditions18−0.10
Octane number, Vehicles with after treatment exhaust systems, Standard driving (no cold starts- cold conditions), Gasoline- gasoline blended fueled210.51
Sulfur content18−0.10
Ethanol Blends
% Ethanol, Standard driving conditions70.89
Diesel
Sulfur content (ppm)9−0.47
Cetane number190.63
Table 3. Correlation between CH4 emissions and exhaust emissions.
Variable: Exhaust EmissionsNumber of vehiclesPearson’s Correlation Coefficient (r)
CO2 emissions
All vehicles4820.14
Vehicles with Otto engine, Gasoline or gasoline blended fueled with exhaust after treatment system, after 19981100.58
Vehicles with Otto engine, Gasoline or gasoline blended fueled with exhaust after treatment system, after 1998, NEDC & F driving cycles420.65
Vehicles with Diesel engine1000.14
Vehicles with Diesel engine, with exhaust after treatment system560.19
CO emissions
All vehicles4820.526
Vehicles with Otto engine4810.797
Vehicles with Otto engine and exhaust after treatment system2630.724
Vehicles with Otto engine and exhaust after treatment system. ECE, EUDC, NEDC, FTP75 driving cycles1330.427
Vehicles with Otto engine and exhaust after treatment system, distributed after 2000, FTP75 & US06 driving cycles540.347
Vehicles with Otto engine and exhaust after treatment system, distributed before 2000, FTP75 & US06 driving cycles610.546
Vehicles with Diesel engine910.13
Vehicles with Diesel engine and after treatment exhaust system530.236
NOx emissions
All vehicles482−0.11
Vehicles with Otto engine and exhaust after treatment system2430.558
Vehicles with Otto engine and exhaust after treatment system, distributed after 2000, FTP75 driving cycle250.649
Vehicles with Otto engine and exhaust after treatment system, distributed before 2000, FTP75 driving cycle420.61
Vehicles with Diesel engine910.06
THC emissions
All vehicles6470.484
Vehicles with Otto engine and exhaust after treatment system, gasoline fueled4810.750
Vehicles with Otto engine and exhaust after treatment system, CNG190.996
Vehicles with Otto engine and exhaust after treatment system, LPG fueled80.341
Vehicles with Otto engine and exhaust after treatment system, gasoline-ethanol fueled550.967
Vehicles with Otto engine and exhaust after treatment system, FTP75 driving cycles270.579
Vehicles with Otto engine and exhaust after treatment system, gasoline-ethanol fueled, T < 0 °C100.982
Vehicles with Otto engine and exhaust after treatment system, gasoline-methanol fueled100.886
Vehicles with Otto engine and exhaust after treatment system, gasoline fueled, ECE, EUDC, NEDC driving cycles500.573
Vehicles with Diesel engine1040.214
Vehicles with Diesel engine, manufactured after 2000300.598

