1. Introduction
The world faces an environmental crisis as the volatile prices of petroleum meet rising concerns regarding each nation’s energy independence and global warming issues due to greenhouse gas (GHG) emissions. In this regard, the transportation sector plays a crucial and growing role in world energy use and, accordingly, GHG emissions, accounting for approximately 15% of overall GHG emissions [
1,
2]. These factors contribute to increase interest in alternative vehicle technologies. Nowadays, electrification of transportation has become an important, supported industry trend. Along the past few years, grid-enabled vehicles (GEVs) such as plug-in electric vehicles (PEVs) and plug-in hybrid electric vehicles (PHEVs) are growing in popularity due to increasing governmental regulations on industries and public will to reduce GHG emissions [
3]. Given GEVs’ popularity, different types are estimated to constitute 35% of the automotive market by 2025 [
4]. For this reason, many automotive manufacturers have already started to expand their productions to benefit from the growing GEV market.
In the near future, increasing number of GEVs will be connected to power distribution systems for charging their batteries [
5]. In [
6], Electric Power Research Institute (EPRI) estimates new vehicle market shares of conventional vehicles (CVs) and PHEVs using a choice-based market modeling of customer choice. Results of this report suggest that CVs will have a market share of 56%, 14%, and 5% and PHEVs will have a market share of 20%, 62%, and 80% by 2050 in low, medium, and high penetration scenarios, respectively. In Morgan Stanley’s report [
7], specific information is used to forecast sales of GEVs. Market demand of GEV is forecasted to reach one million by 2020. The study of Pacific Northwest National Laboratory (PNNL) [
8] examines GEV market penetration scenarios. Yearly market penetration ratios for PHEVs are estimated from 2013 to 2045 for three scenarios: hybrid technology-based assessment, R&D goals achieved, and supply constrained scenarios, in which PHEV market penetration is estimated to reach 9.7%, 9.9%, and 26.9% by 2023, and 11.9%, 29.8%, and 72.7% by 2045, respectively. The study of Oak Ridge National Laboratory (ORNL) [
9] estimates that the demand for GEVs will be almost one million by 2015 [
9]. It is clear that massive integration of GEVs on the power distribution system will result in a significant increase in electric energy demand and will raise load values at peak times [
10]. Also, various studies have already been carried out to predict the effects of GEVs on the power distribution system. As a result of these studies, GEVs have been observed to cause some special effects such as phase imbalance, power quality issues, grid stability, transformer degradation and failure, and circuit breaker and fuse blowout on the power distribution systems [
11,
12,
13,
14,
15].
All these problems can be prevented with well-designed GEV battery chargers and intelligent charging as part of the smart grid technologies. Massive integration of batteries of GEVs into the power grid can create some opportunities. With smart grid technologies, the function of the GEVs as a mobile energy storage unit in the power grid includes some opportunities such as reactive power compensation, harmonic filtering, voltage support, reducing frequency fluctuations, functioning as an emergency power supply such as an uninterruptible power supply (UPS) which is often named as vehicle-to-home (V2H), improving the effectiveness of home renewable energies by using GEV as storage, load balancing, peak shaving unit [
16,
17,
18,
19,
20,
21,
22,
23]. However, the design and control of a GEV on-board battery charger is important to perform specified operating conditions.
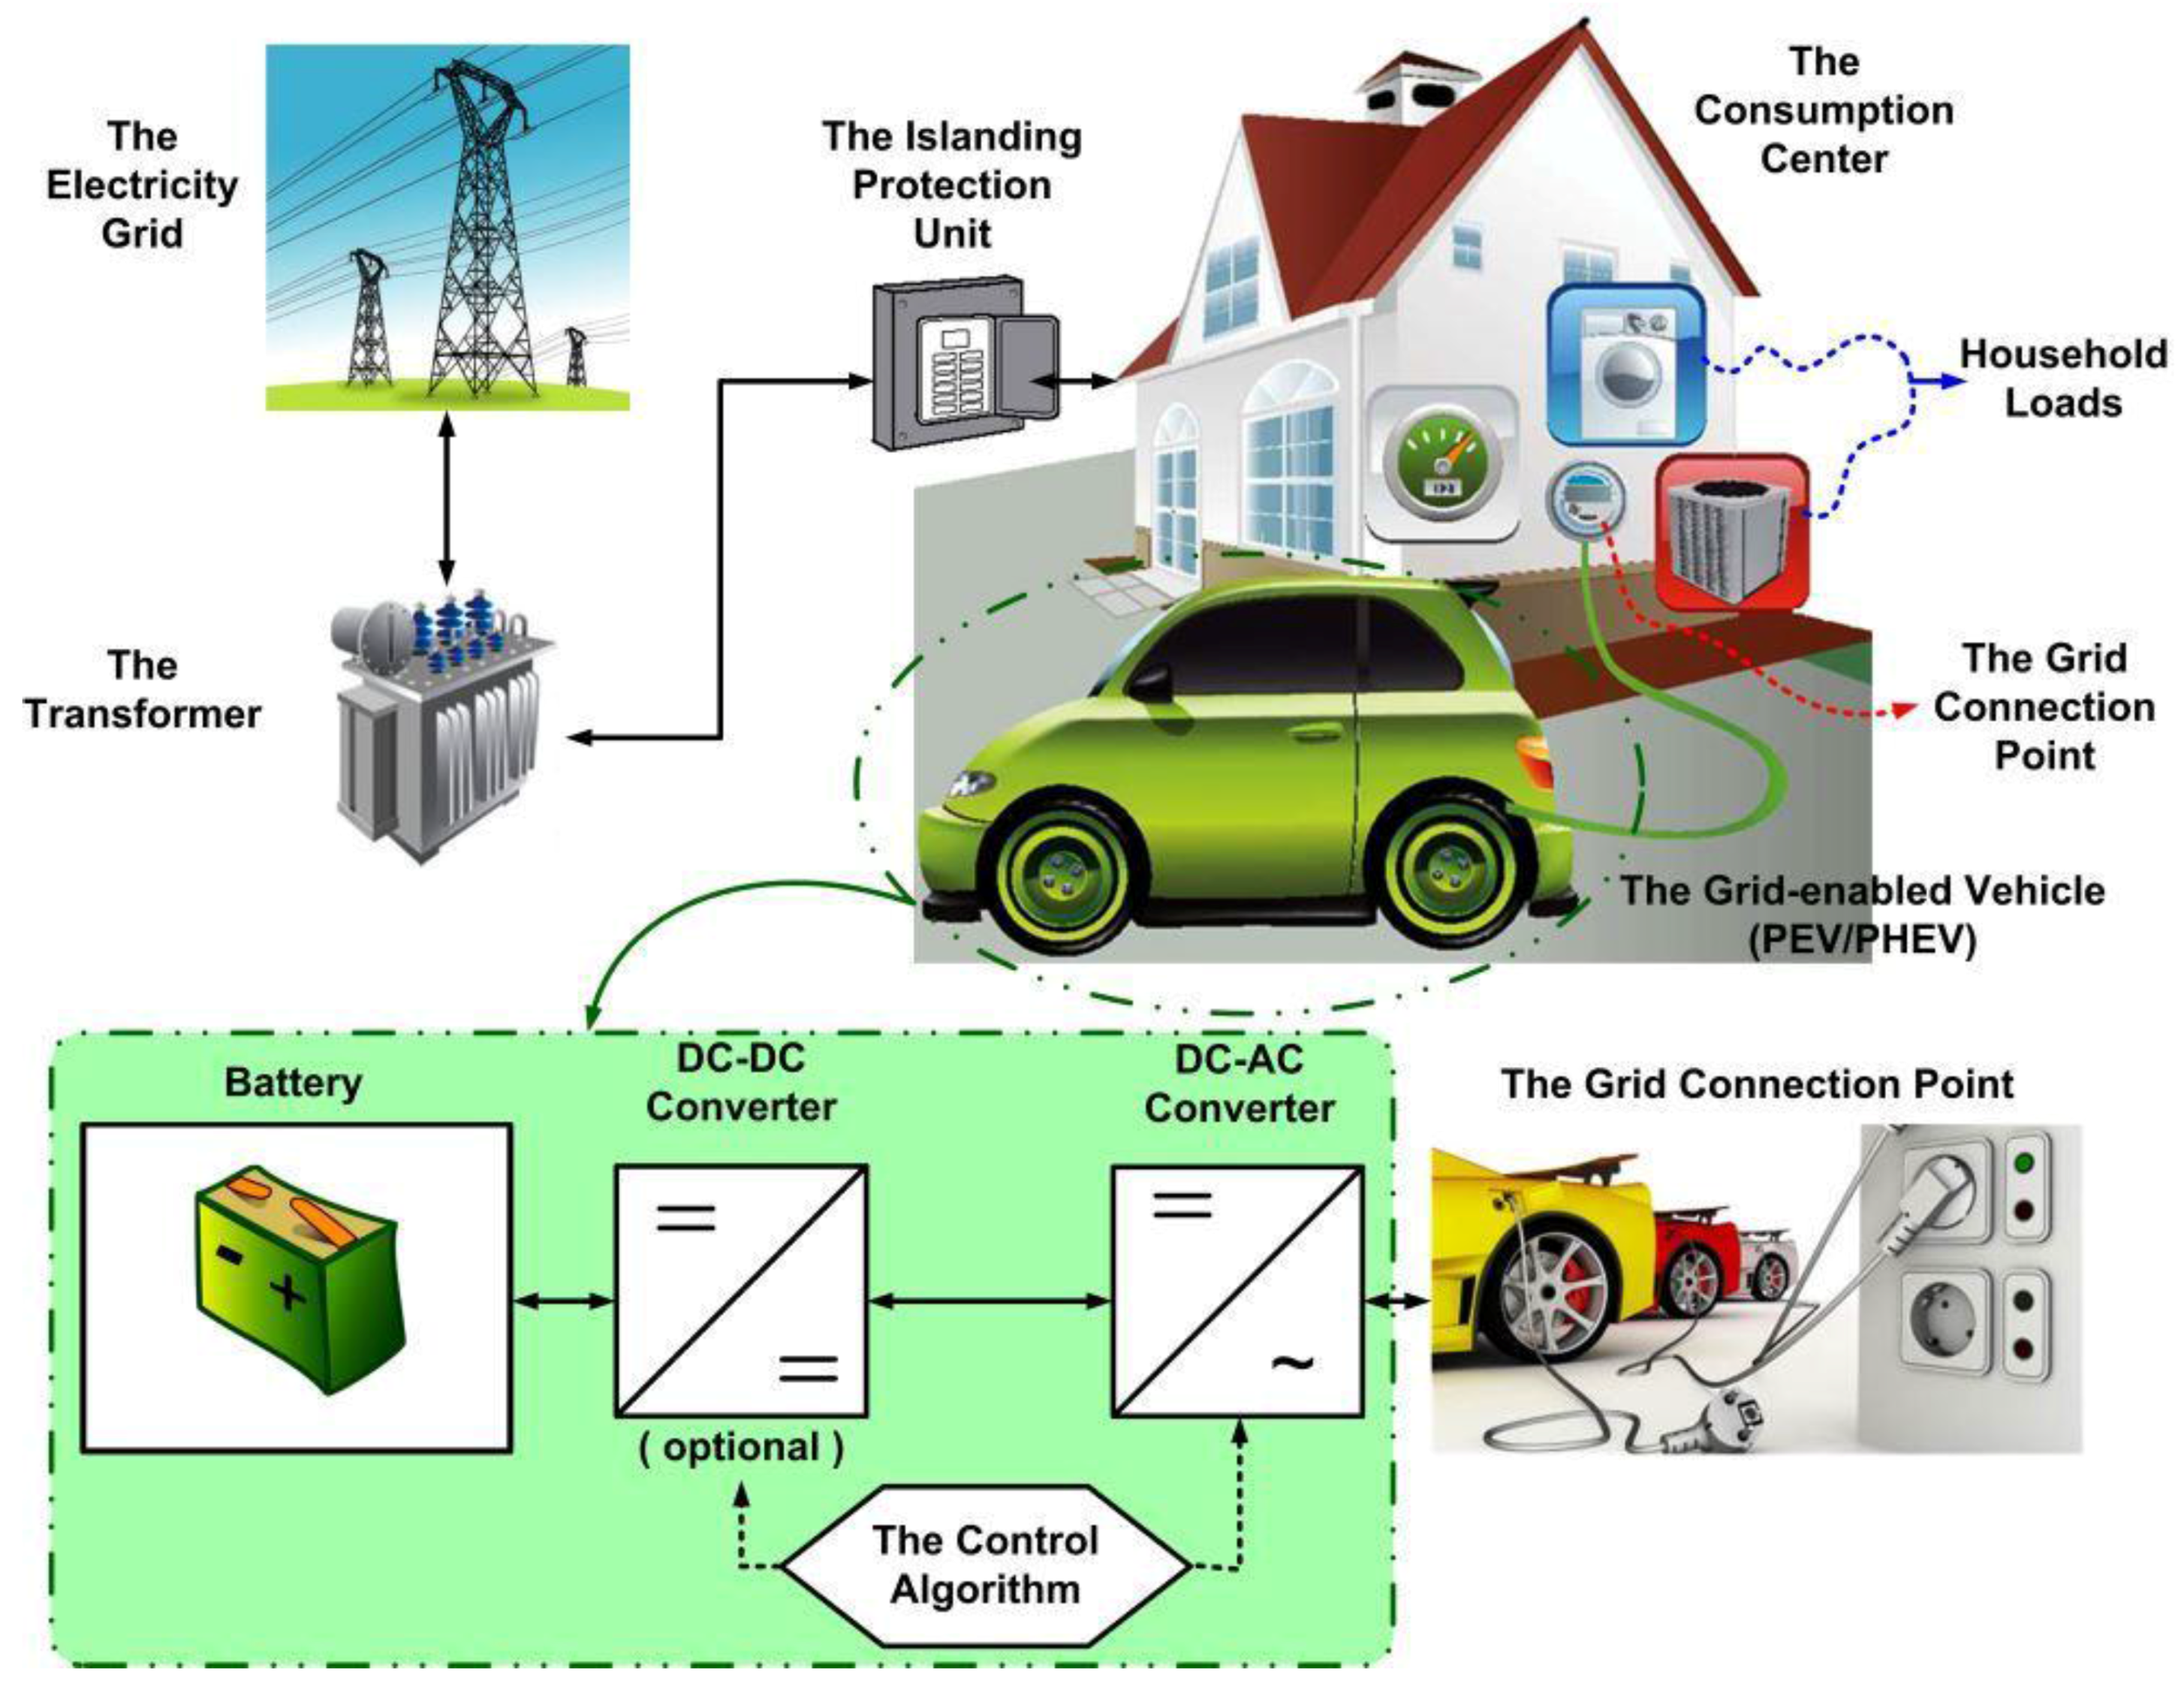
As it is well known, an energy storage unit that provides the required power for a vehicle is employed in GEVs. This energy storage unit must be recharged at charging points. Nowadays, the interaction of a commercial GEV with the grid is generally unidirectional—the charging process. However, GEVs can be operated bi-directionally by modifying the design of power units of GEV. Thus, the storage units can be supplied to small isolated systems such as single households without the power grid in V2H mode. Due to the large amount of energy stored in batteries of GEVs, they can supply the demand of the consumption center. The general scheme of the V2H operating condition is illustrated in
Figure 1. V2H operating conditions would offer the possibility of using a GEV as a domestic back-up power as a UPS [
24,
25]. Instead, a power unit that can be utilized for the consumption center connection of vehicular systems is important for the realization of this operating condition.
The main idea presented in this paper is using GEVs as a power supply to the consumption center when needed. The proposed study contributes to the relevant literature regarding the fact that both the simulation and the experimental analyses have been conducted for use of GEVs as UPS. The concept of using GEVs as a UPS unit is different from the regular UPS structures. Firstly, the GEVs are not continuously available at the residential premises as the GEV owners use their GEVs during daily life for traveling to work, etc. Besides, the use of GEVs for such purposes should be limited by comfort conditions as the GEV owner requiring a minimum level of charge for his/her GEV for possible unexpected GEV use during the evening, etc. Moreover, such systems should be continuously controlled regarding the fact that battery charge/discharge lifetime is limited and uncontrolled daily use of GEVs for such purposes will present drawbacks in this regard. However, the GEVs can be considered as a mobile UPS unit readily available during energy outages, etc. for supplying at least the minimum level of electrical energy for sustaining daily activities at home, work, etc. as GEVs are also mostly idle during the daytime (at work, etc.) even when the GEV is not at home. A limitation for the minimum State-of-Charge (SoC) is implemented within the control structure. In addition, an islanding unit is designed specifically for the mentioned type of use for GEVs in this study.
The simulation studies are performed in MATLAB & Simulink environments. For the experimental studies, a test platform formed by a battery group, a power unit, measurement units, an islanding protection unit, a load unit, a dead-time generation unit, and a dSPACE control unit is configured to test V2H operating conditions—different from the existing literature, which considers the topic a solely theoretical point of view.
The remainder of this paper is organized as follows:
Section 2 describes the V2H simulation model that has been developed and explains the physical configuration of the test platform as well as the testing methodology;
Section 3 demonstrates the simulation and experimental results; and finally, conclusions are made in
Section 4.
2. System Description and Methodology
In order to test and improve the effectiveness of the proposed methodology, an initial analysis is performed in a simulation environment before conducting experimental studies. In this simulation study, the modeling and analysis of the prepared system are realized using MATLAB & Simulink, Sim Power Systems. Afterwards, a test platform is established in order to use GEV as a UPS if necessary. The parameters of the components used in the test platform are normalized to real GEV specifications. The concept of the simulation model and test platform, control algorithms, and the principle of the operation as well as the general structure of the V2H are explained in detail in the following subsections.
2.1. Simulation Model
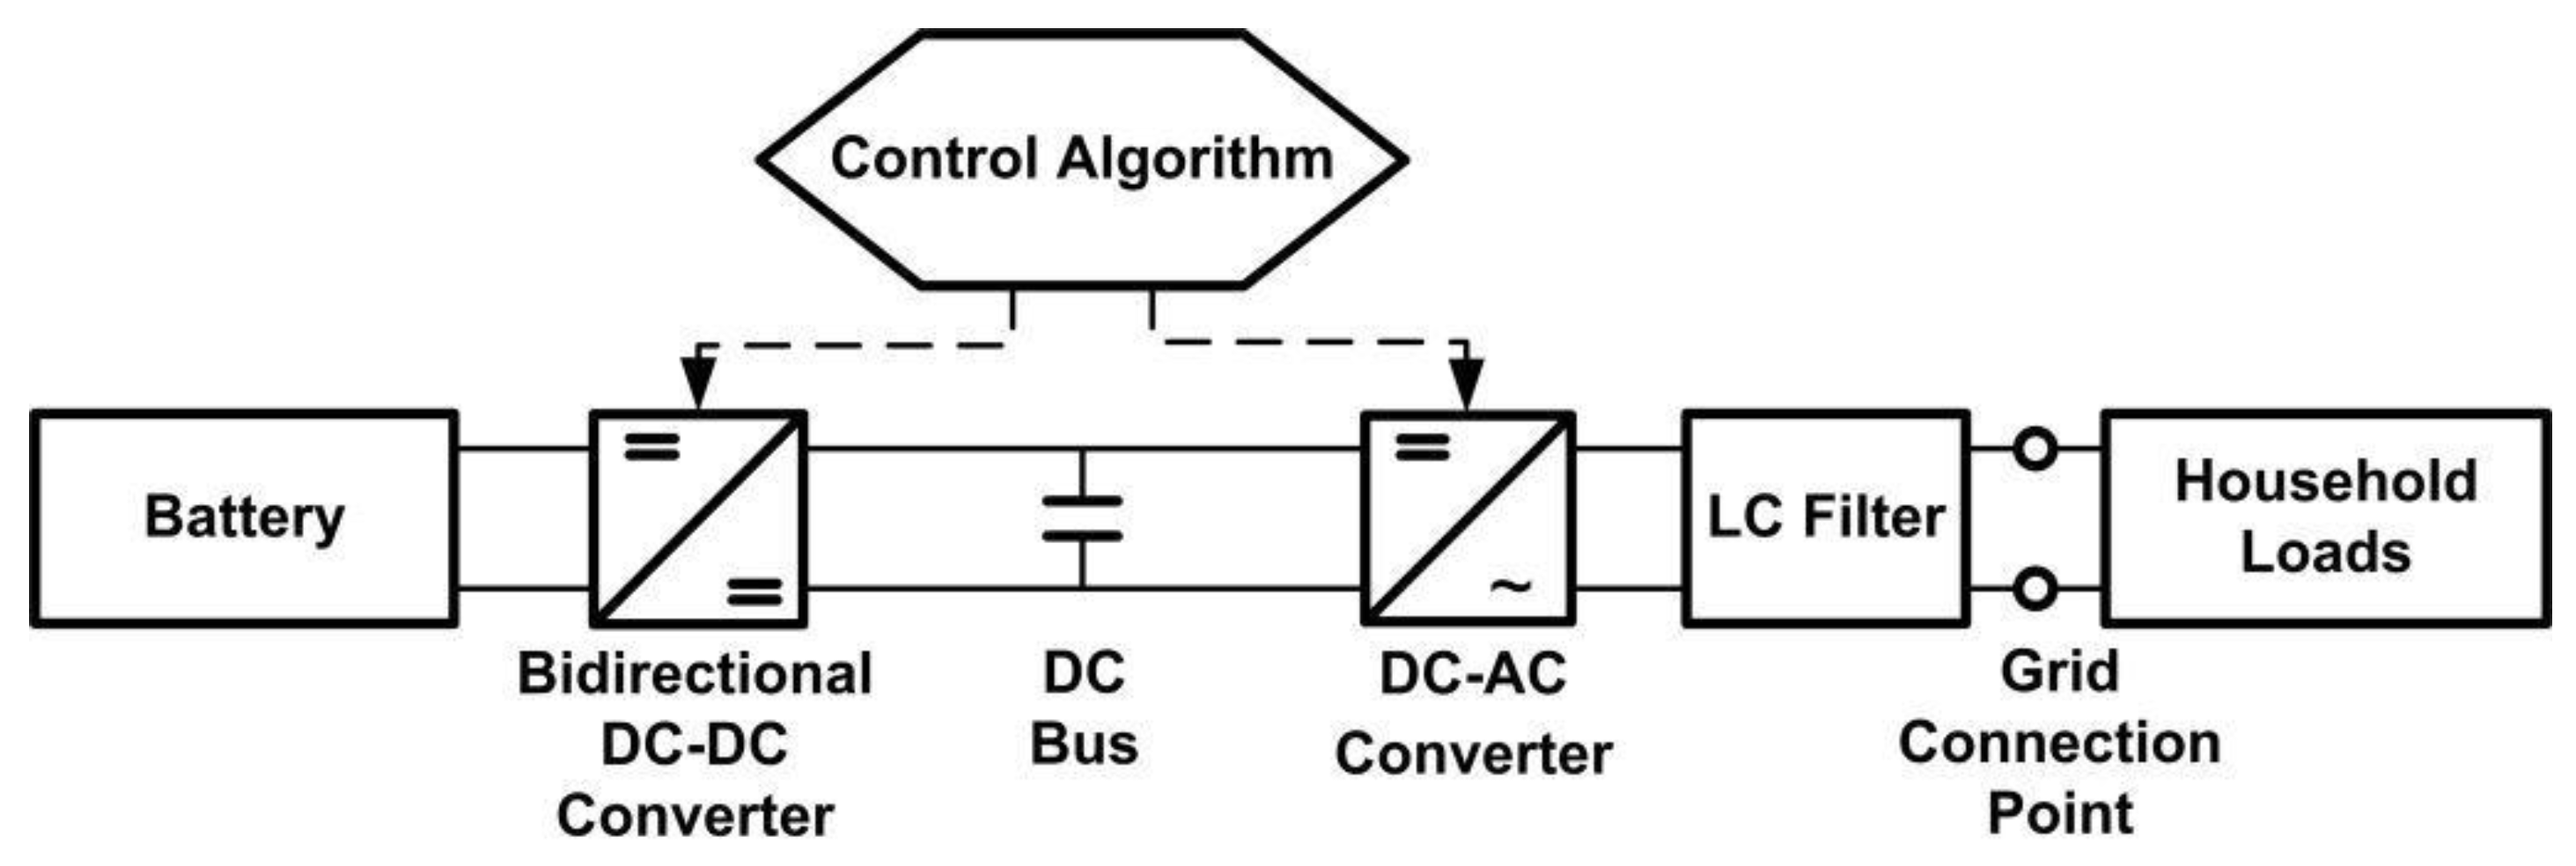
Firstly, all subsystems of the general structure in the performed simulation study are prepared separately. The simulation study consists of four units: Battery, DC-DC converter, DC-AC converter (inverter), and the load model. The block diagram of the prepared system is shown in
Figure 2 and the simulation model is given in
Figure 3. Also, the parameter values used in the simulation are given in
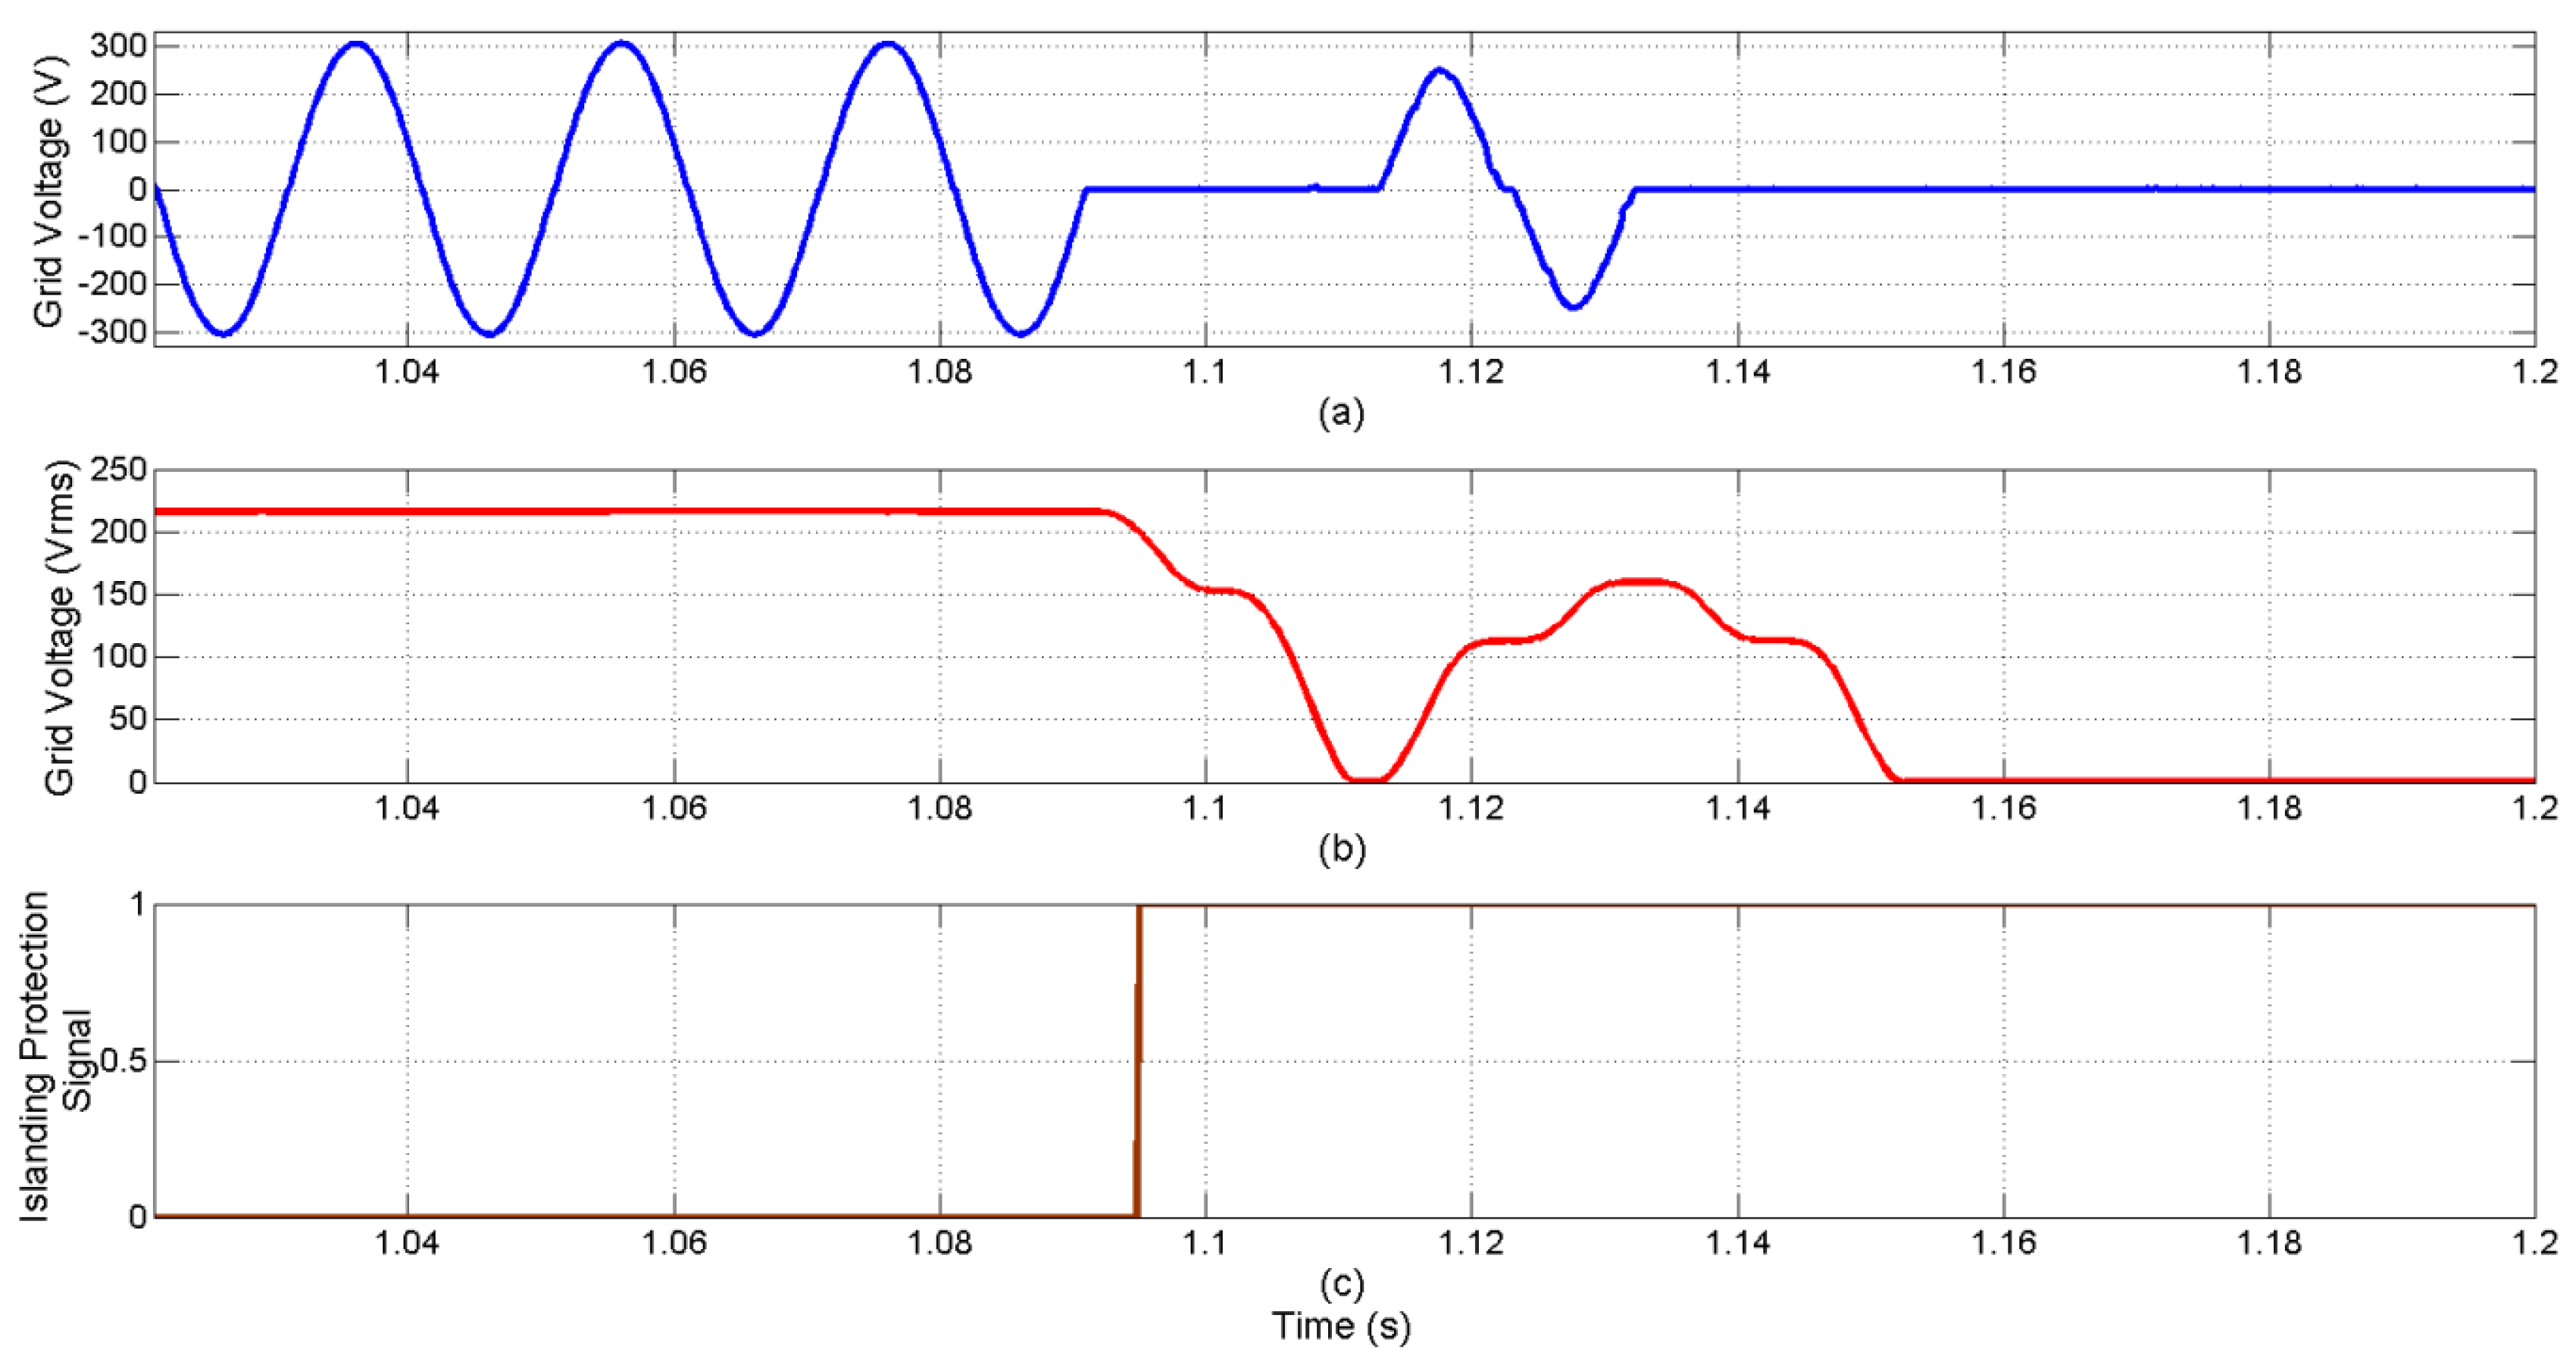
Table 1. In this simulation study, the charging process of the GEV is not included in order to reduce the complexity in a model that mainly focuses on the V2H operating mode. For this reason, the power grid and the islanding protection unit are not modeled and used in the simulation study. Under normal conditions, islanding operation is important for safety as it separates the power grid and the consumption center. Thus, the electrical energy generated by the GEV is only consumed by the consumption center in the V2H operation mode by this way the staff of the grid operator can safely rectify the fault. Also even when the power grid is powered up again the GEV is temporarily kept mechanically isolated to protect the power converters from transient effects that may occur.
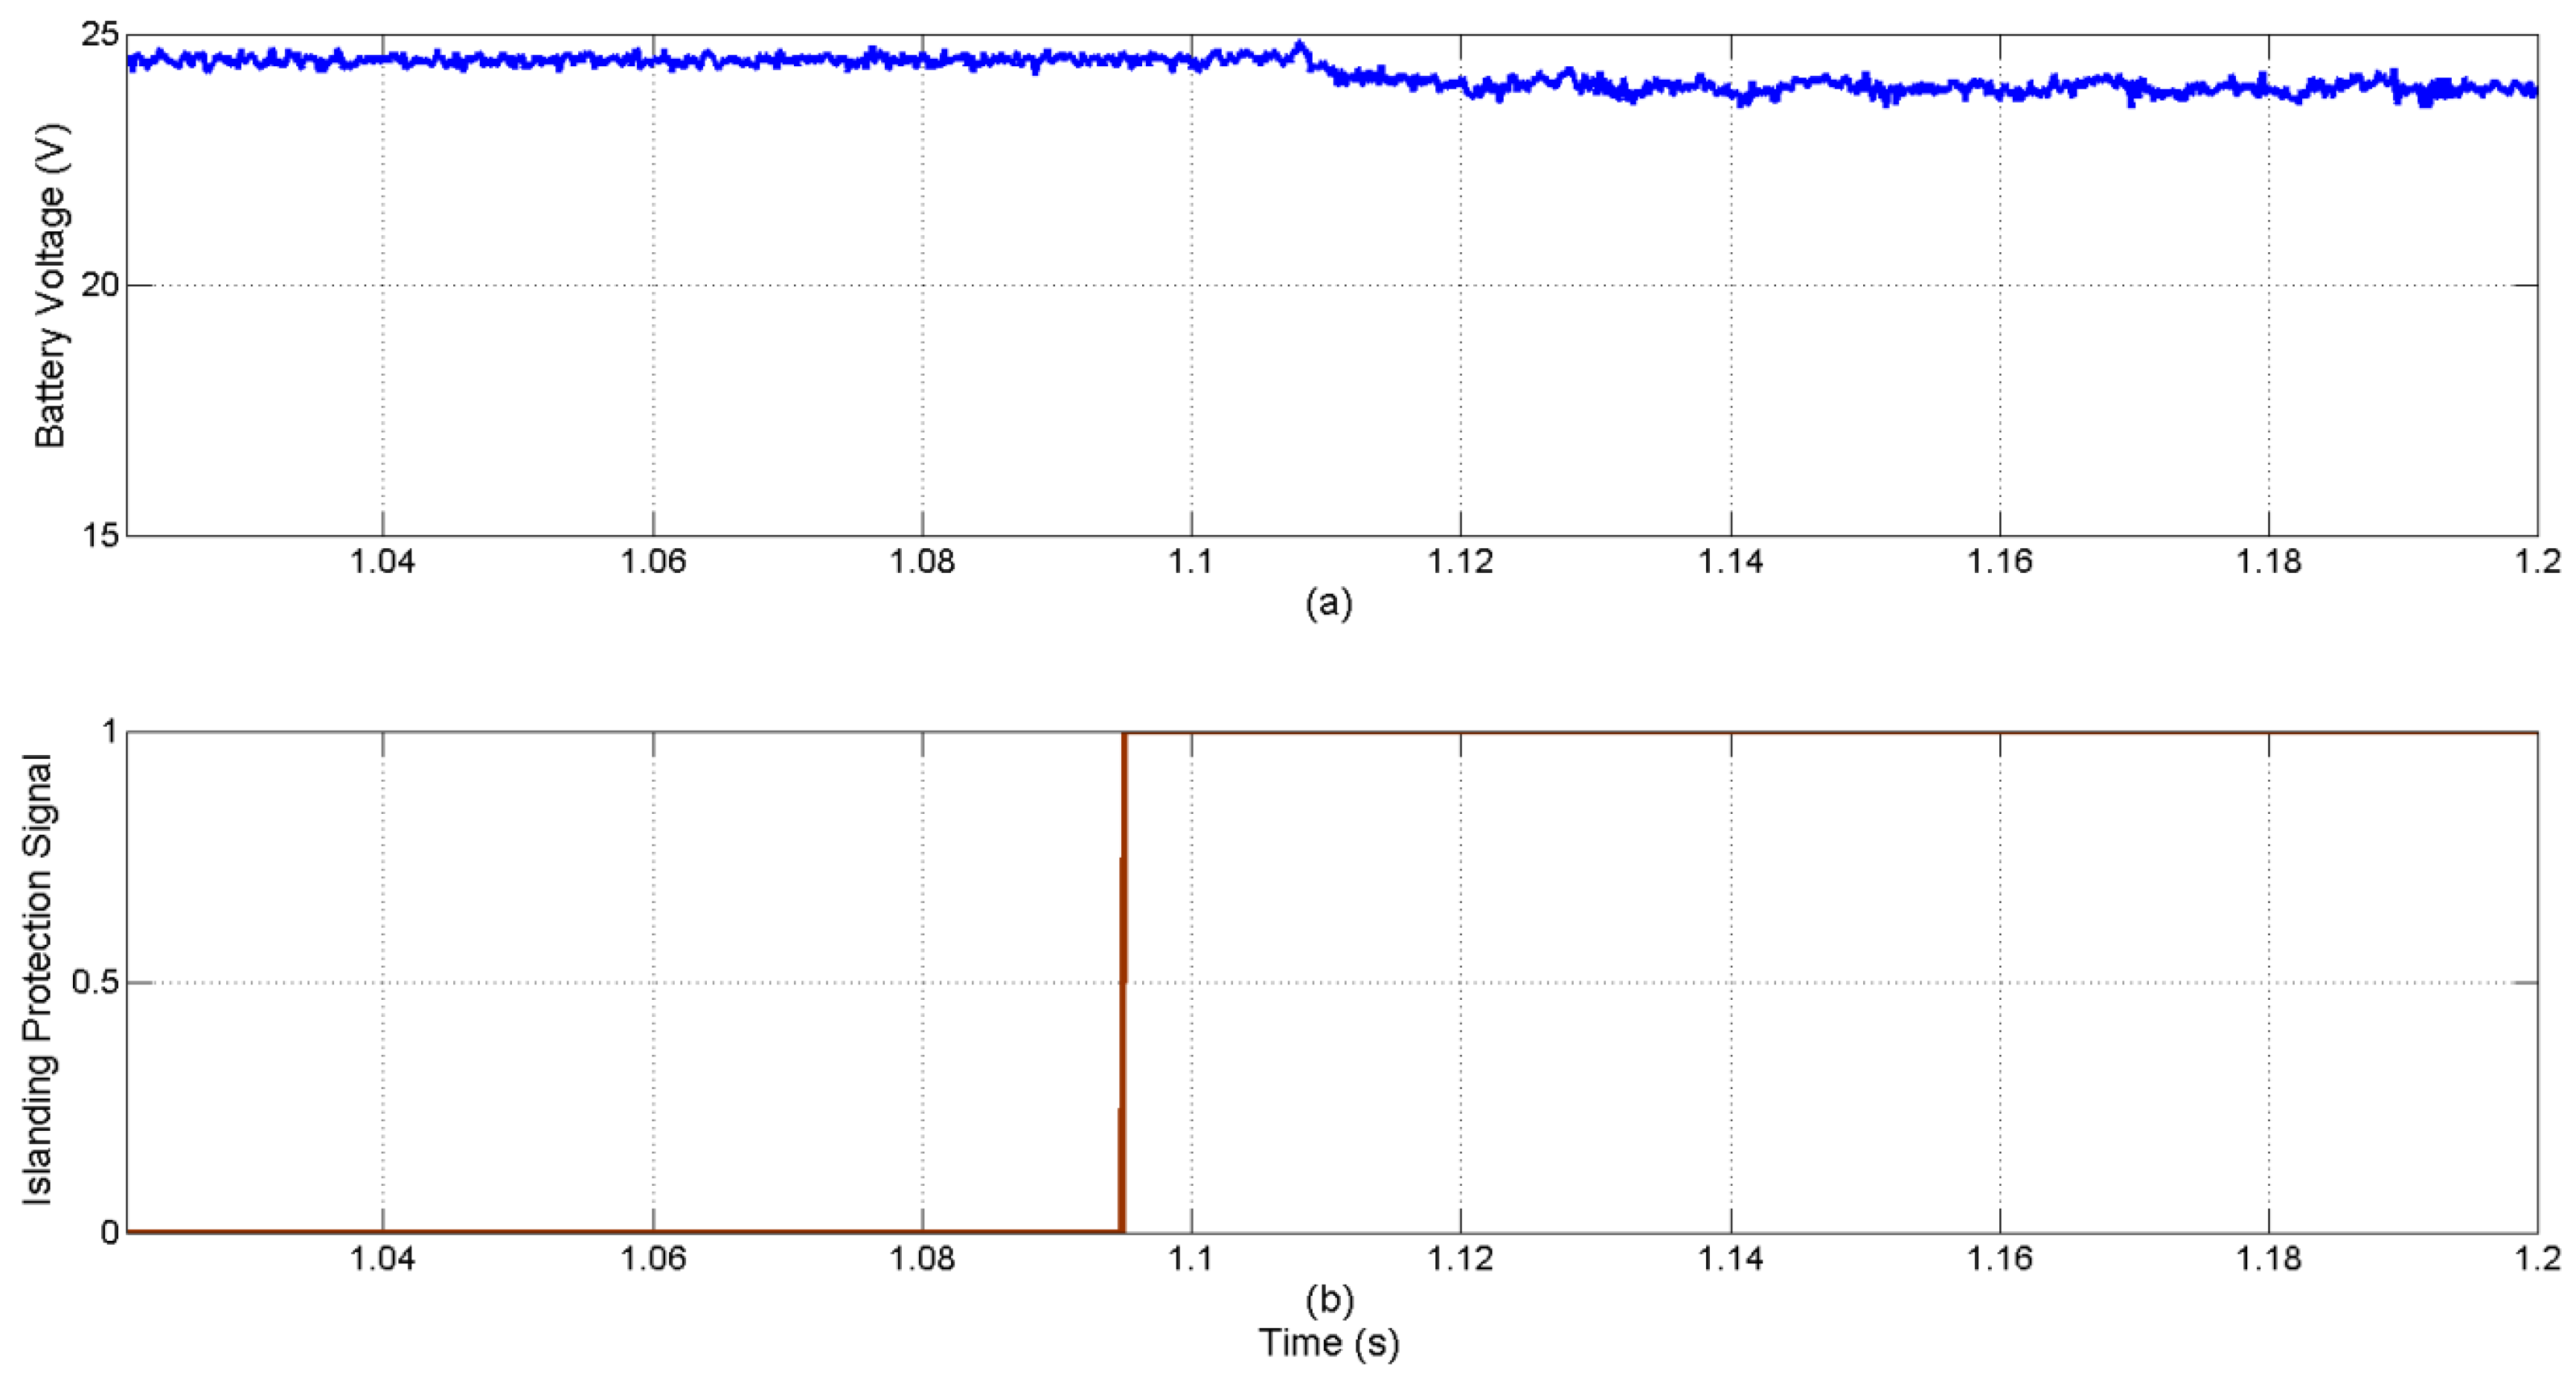
In this study, as the first unit in simulation, the existing battery model within the Simulink library was selected. The type of battery is lithium-ion and the battery values determined as 240 V, 10 Ah, and initial SoC of 100%.
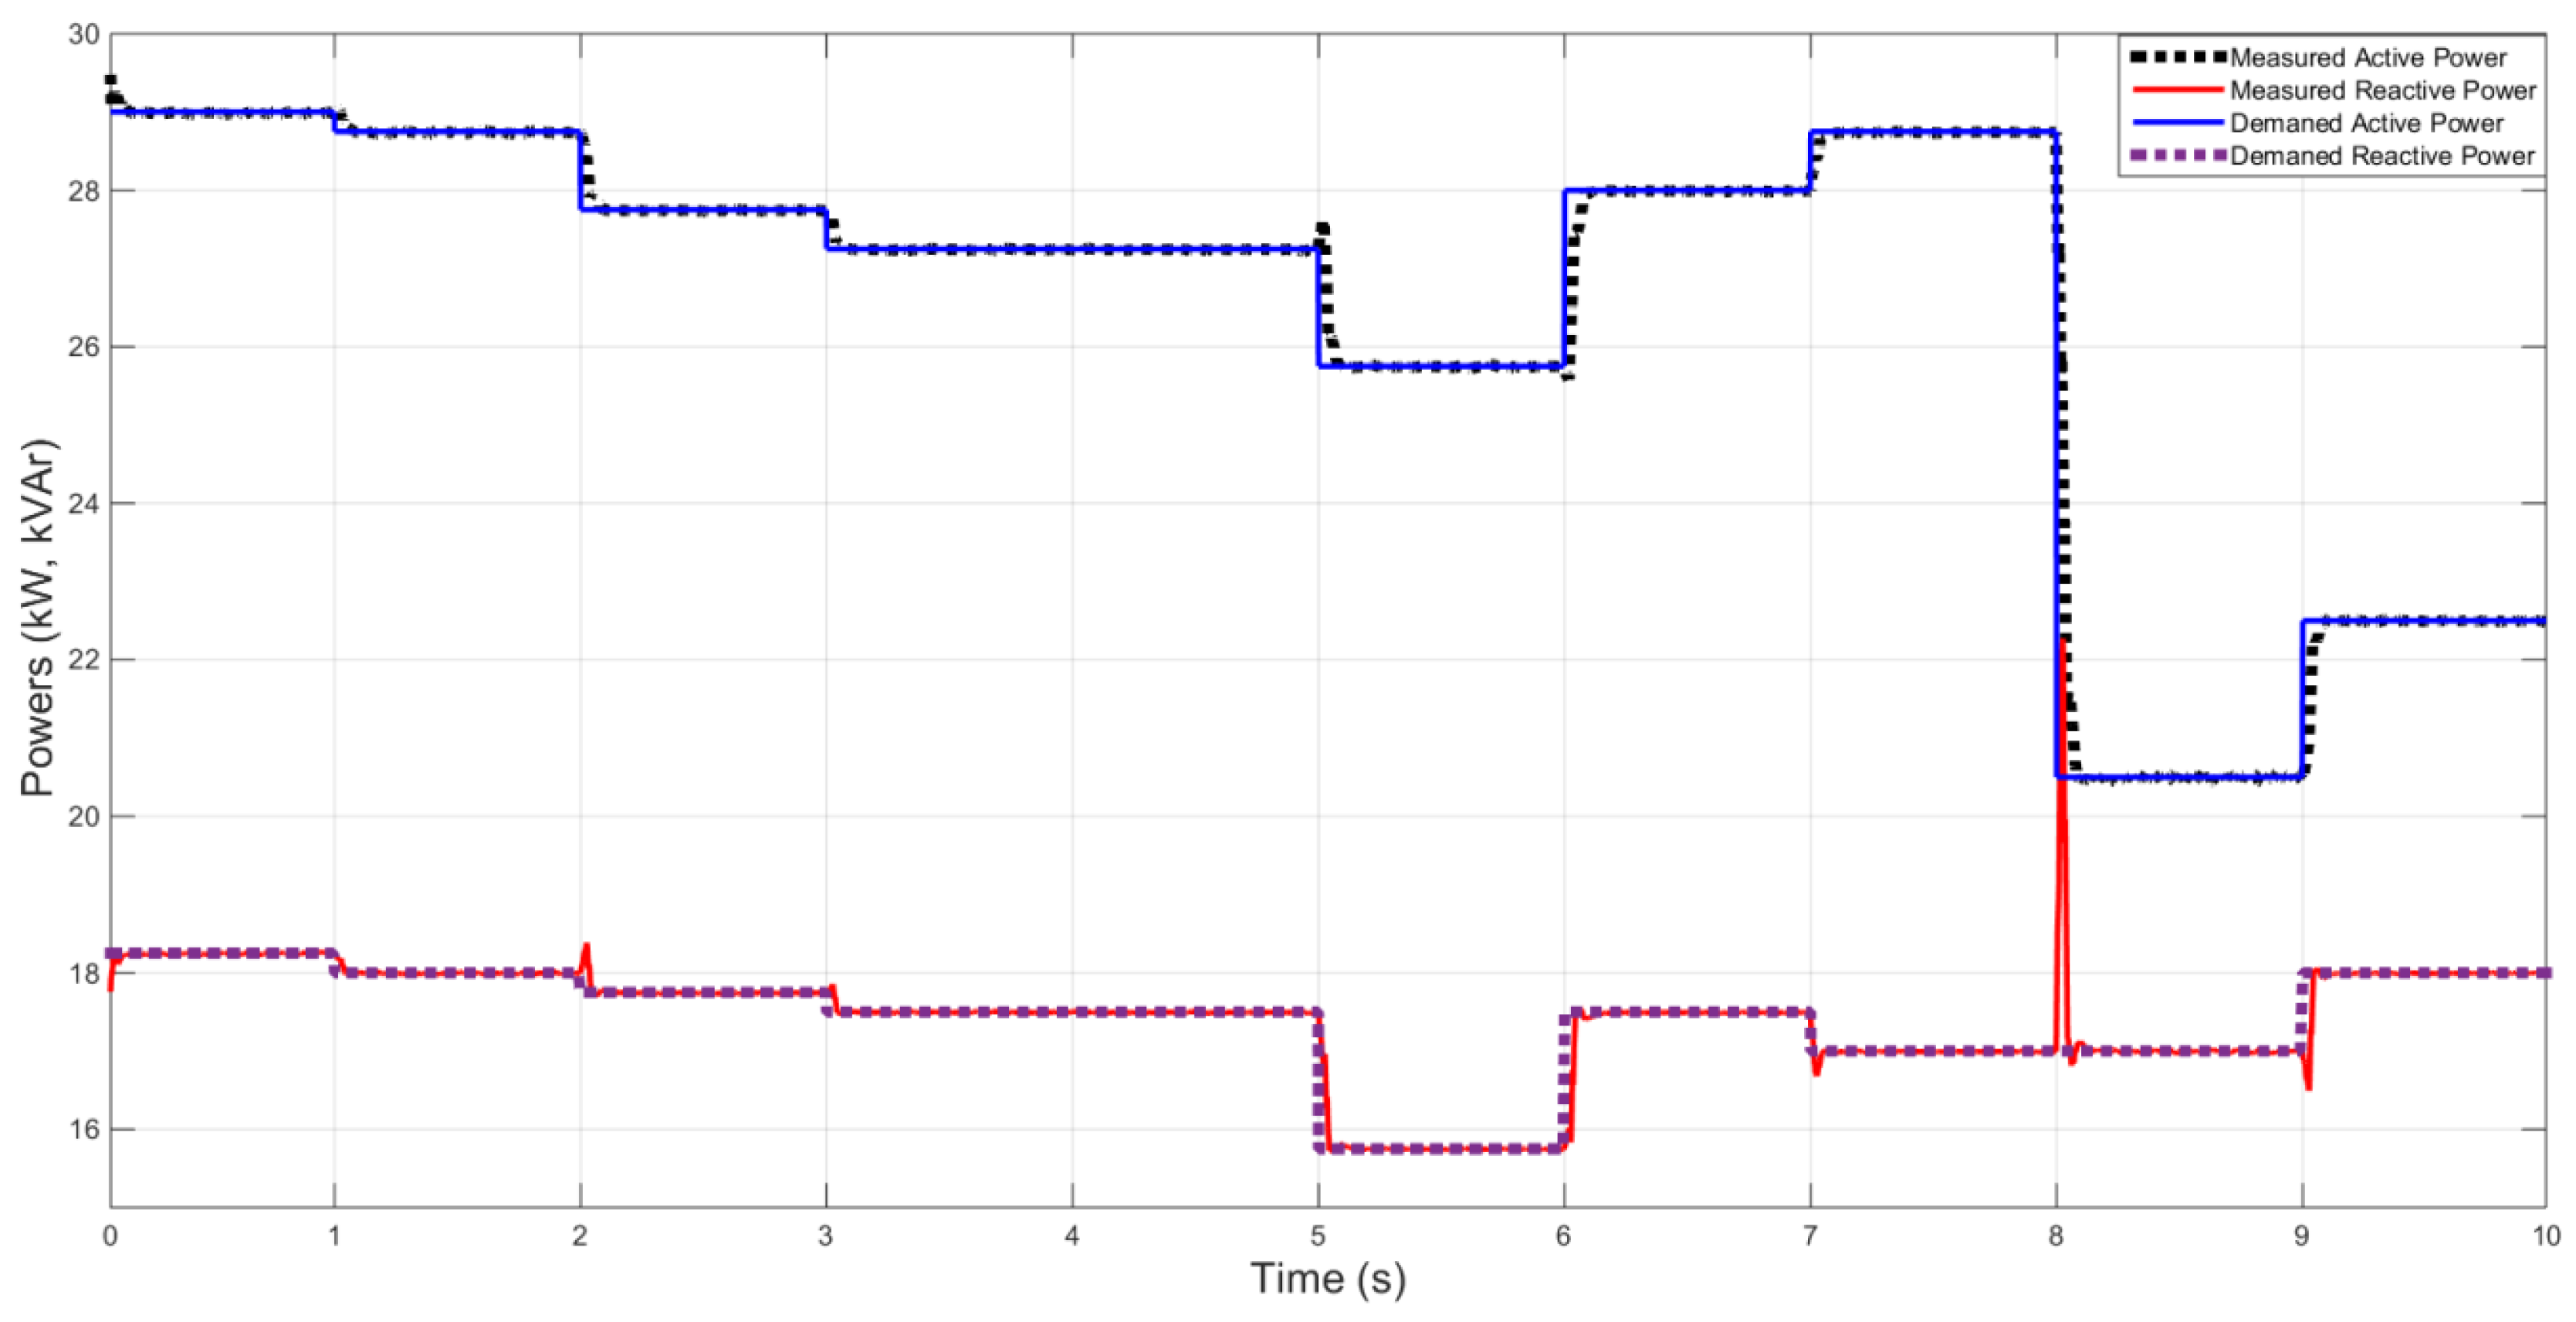
The second unit is a load model that models the consumption center in the simulation study. This load model consists of a controlled voltage source, resistor, and the control block of the controlled voltage source. As the basic operating principle of this system, control block of the load model generates the reference voltage value of the controlled voltage source and current is drawn through 1 ohm virtual resistance. The control inputs of the load unit are active power (P), reactive power (Q), and the instantaneous value of the voltage at the load connection point (V) is used as a feedback signal to calculate reference current value. The mentioned P and Q values of a three-story office building are used. The output of the load model is the voltage signal generated for the controlled voltage source. The signal production method for the controlled voltage source is shown in
Figure 4.
First, as in
Figure 4, angle (φ) is calculated in the unit of radians. The power factor (cos φ) value is calculated with φ. Also, φ is converted to seconds from radians for creating the phase difference between the current and the voltage. Afterwards, the RMS value of the current is calculated so that the peak value of the current can be specified. After all of these processes, a pure sine wave is generated with the same phase angle with the voltage of load connection point. This reference wave form is shifted to φ angle and multiplied by the peak value of the current and the reference current signal is produced. Finally, the measured current signal is subtracted from the voltage value on the load connection point. Thus, the control signal for the voltage controlled source is produced.
The third unit is a DC–DC converter, which generates an appropriate DC voltage for the inverter input. This DC–DC converter requires bi-directional operation (charging and discharging of the battery). In this simulation study, the bi-directional DC–DC converter is operated only for discharging the battery. The charging of the GEV battery is not in the scope of this study; relevant charging methodologies are presented in [
24]. Therefore, a bi-directional DC–DC converter control is realized just for the boost operating state. In control unit of the converter, the reference and measured values of DC bus voltage are required. First, the control unit of the DC–DC converter receives the information of the DC bus voltage in the DC–DC converter output. Then, the reference voltage information is compared with the measured voltage in the PI controller. The DC reference voltage value is chosen as 425 V
DC for resembling the voltage value at load connection to the grid voltage value. After this process, a pulse width modulation (PWM) signal is obtained by comparison of a saw tooth signal, with the signal received from the output of PI controller. Afterward, zero signal is given to the S1 switch and the PWM signal is sent to the S2 switch. S1 and S2 switches are shown in
Figure 3. In order to maintain the DC bus voltage, the control algorithm presented in
Figure 5 is used.
The fourth and the last unit is the power unit. This unit includes an inverter and the LC filter, which is located in the inverter output. A sinusoidal pulse width modulation (SPWM) control is applied at the aforementioned inverter. Due to the SPWM method, the switching elements (IGBT, MOSFET) are entered in cutoff mode and transmission mode to generate a sinusoidal wave form during each period. Thus, the variable amplitude sinusoidal signal can be obtained. A sinusoidal control signal is compared with a higher frequency triangle wave for achieving the desired frequency of SPWM. In this comparison result, the SPWM signals required for cross-arms of the power unit are obtained. An LC passive filter is used to filter the harmonics on the output of the inverter. The filter’s inductance and capacitor values are selected as 0.03 mH and 100 μF, respectively. The filter is designed and implemented to minimize the system harmonics.
All subsystems in the simulation study are prepared separately, as mentioned before. Then, the interconnection of these subsystems is performed and the simulation results are obtained.
2.2. Test Platform
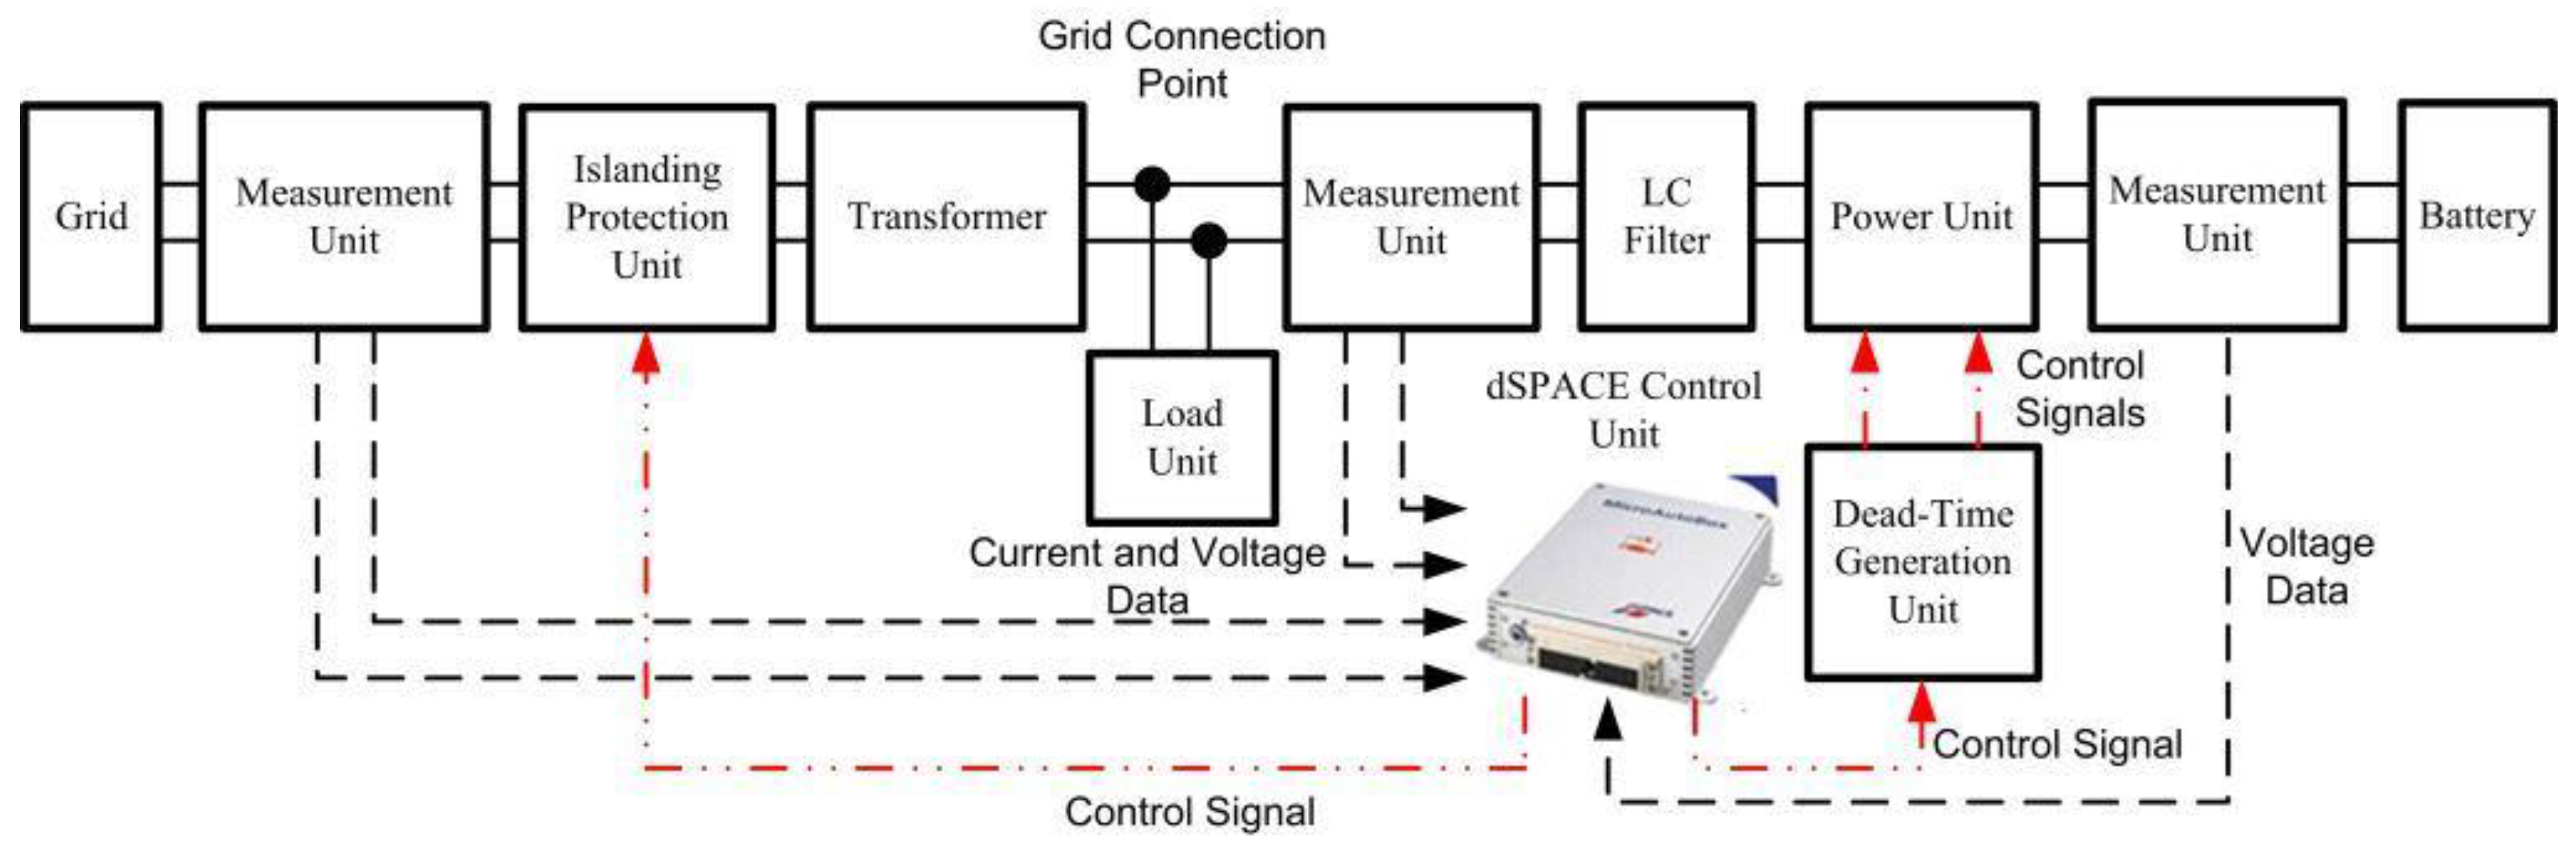
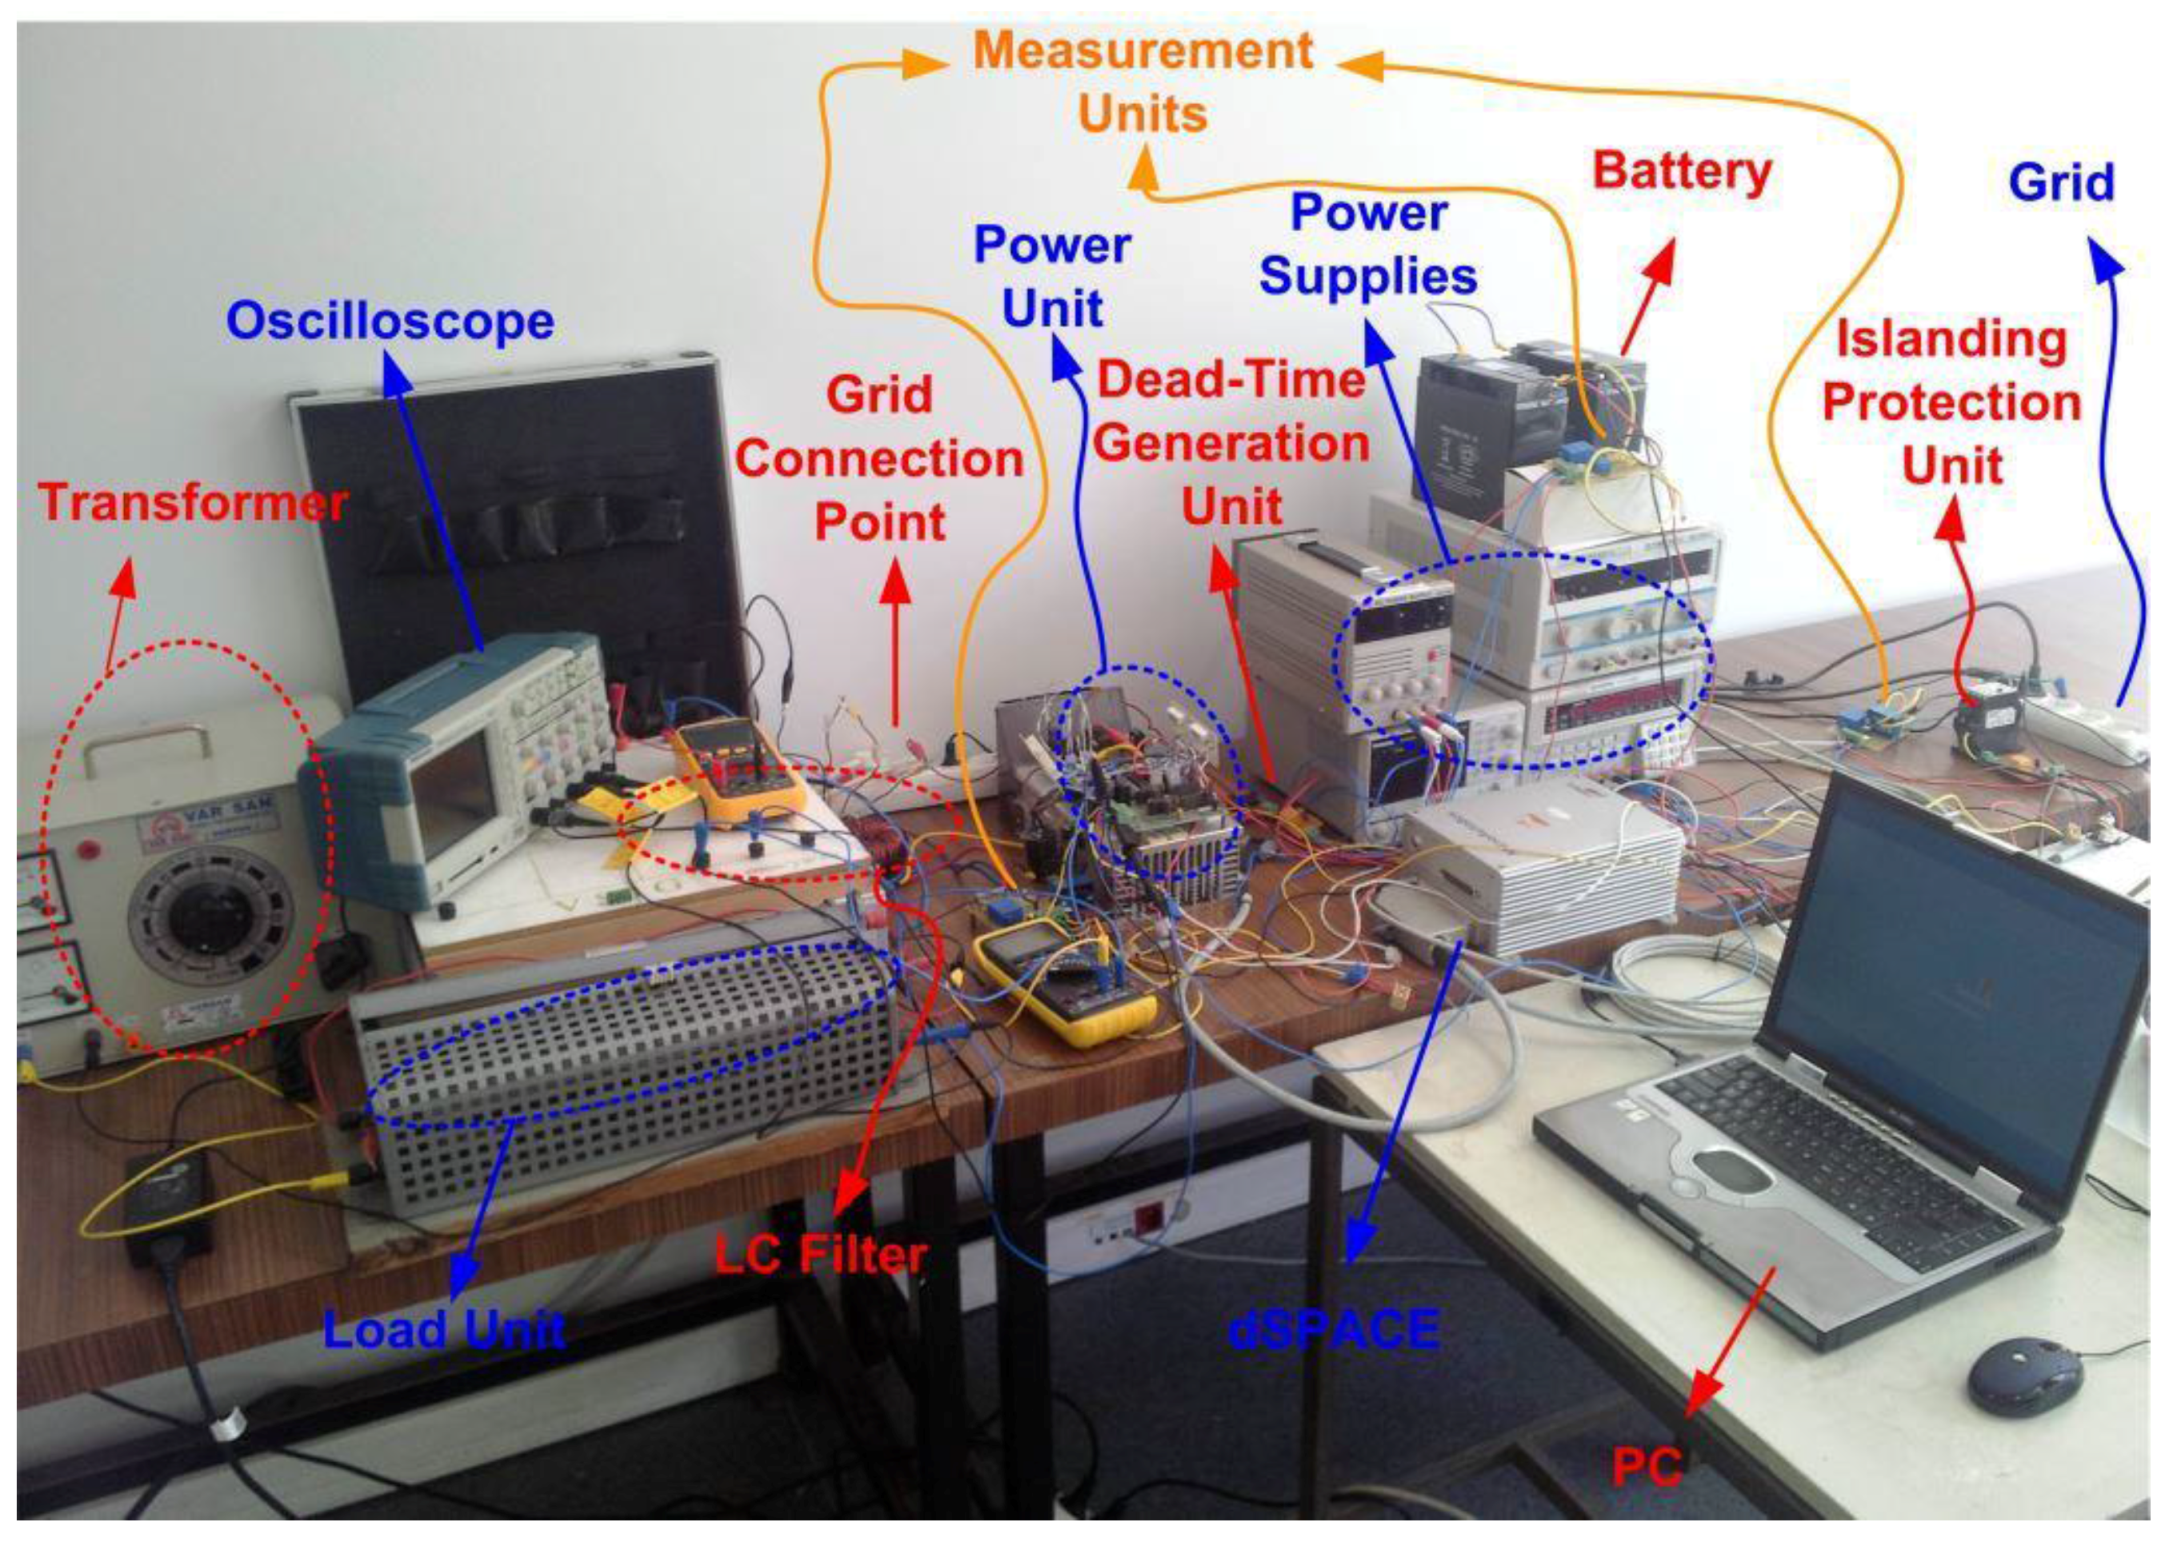
An experimental test platform is built to verify the controller system design and to implement a successful connection between the GEV and the end-user premise. The parameters of the components used in the test platform are normalized to certain values in order to reduce high costs, minimize the size of the components, and achieve flexible controllability. This test platform consists of a battery, a power unit (inverter), measurement units, an islanding protection unit, a dead-time generation unit, and a dSPACE control unit. The block diagram of the mentioned system is given in
Figure 6. The test platform for experimental studies is shown in
Figure 7. Also, the values of components used in the test platform are given in
Table 2.
2.2.1. Control Algorithm
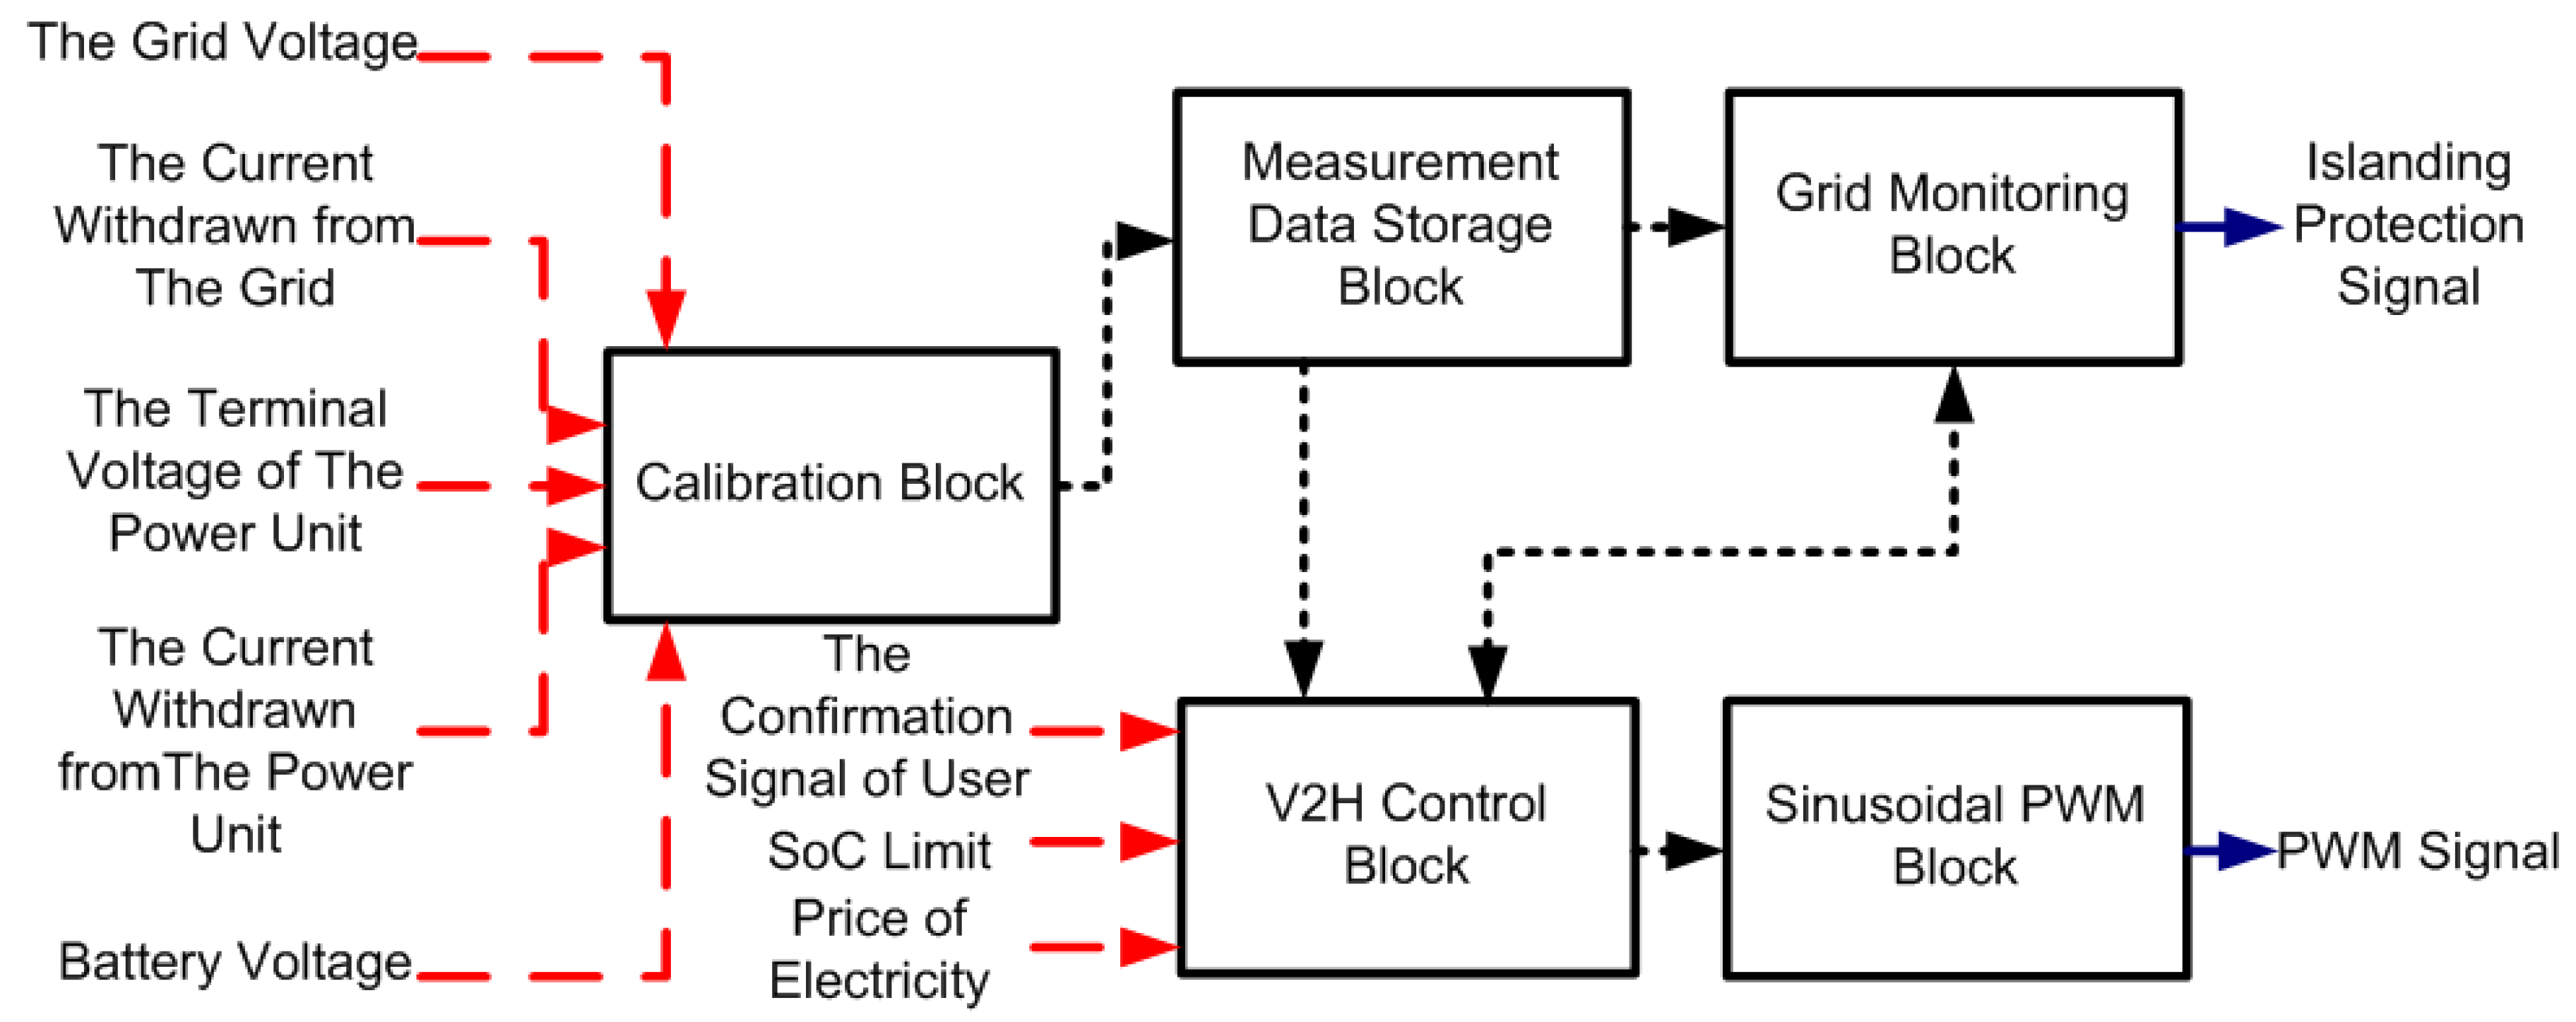
The control algorithm was developed utilizing MATLAB & Simulink and SimPowerSystems. A dSPACE embedded control unit is used as the controller in experimental studies. The control algorithm of the test platform, as illustrated in
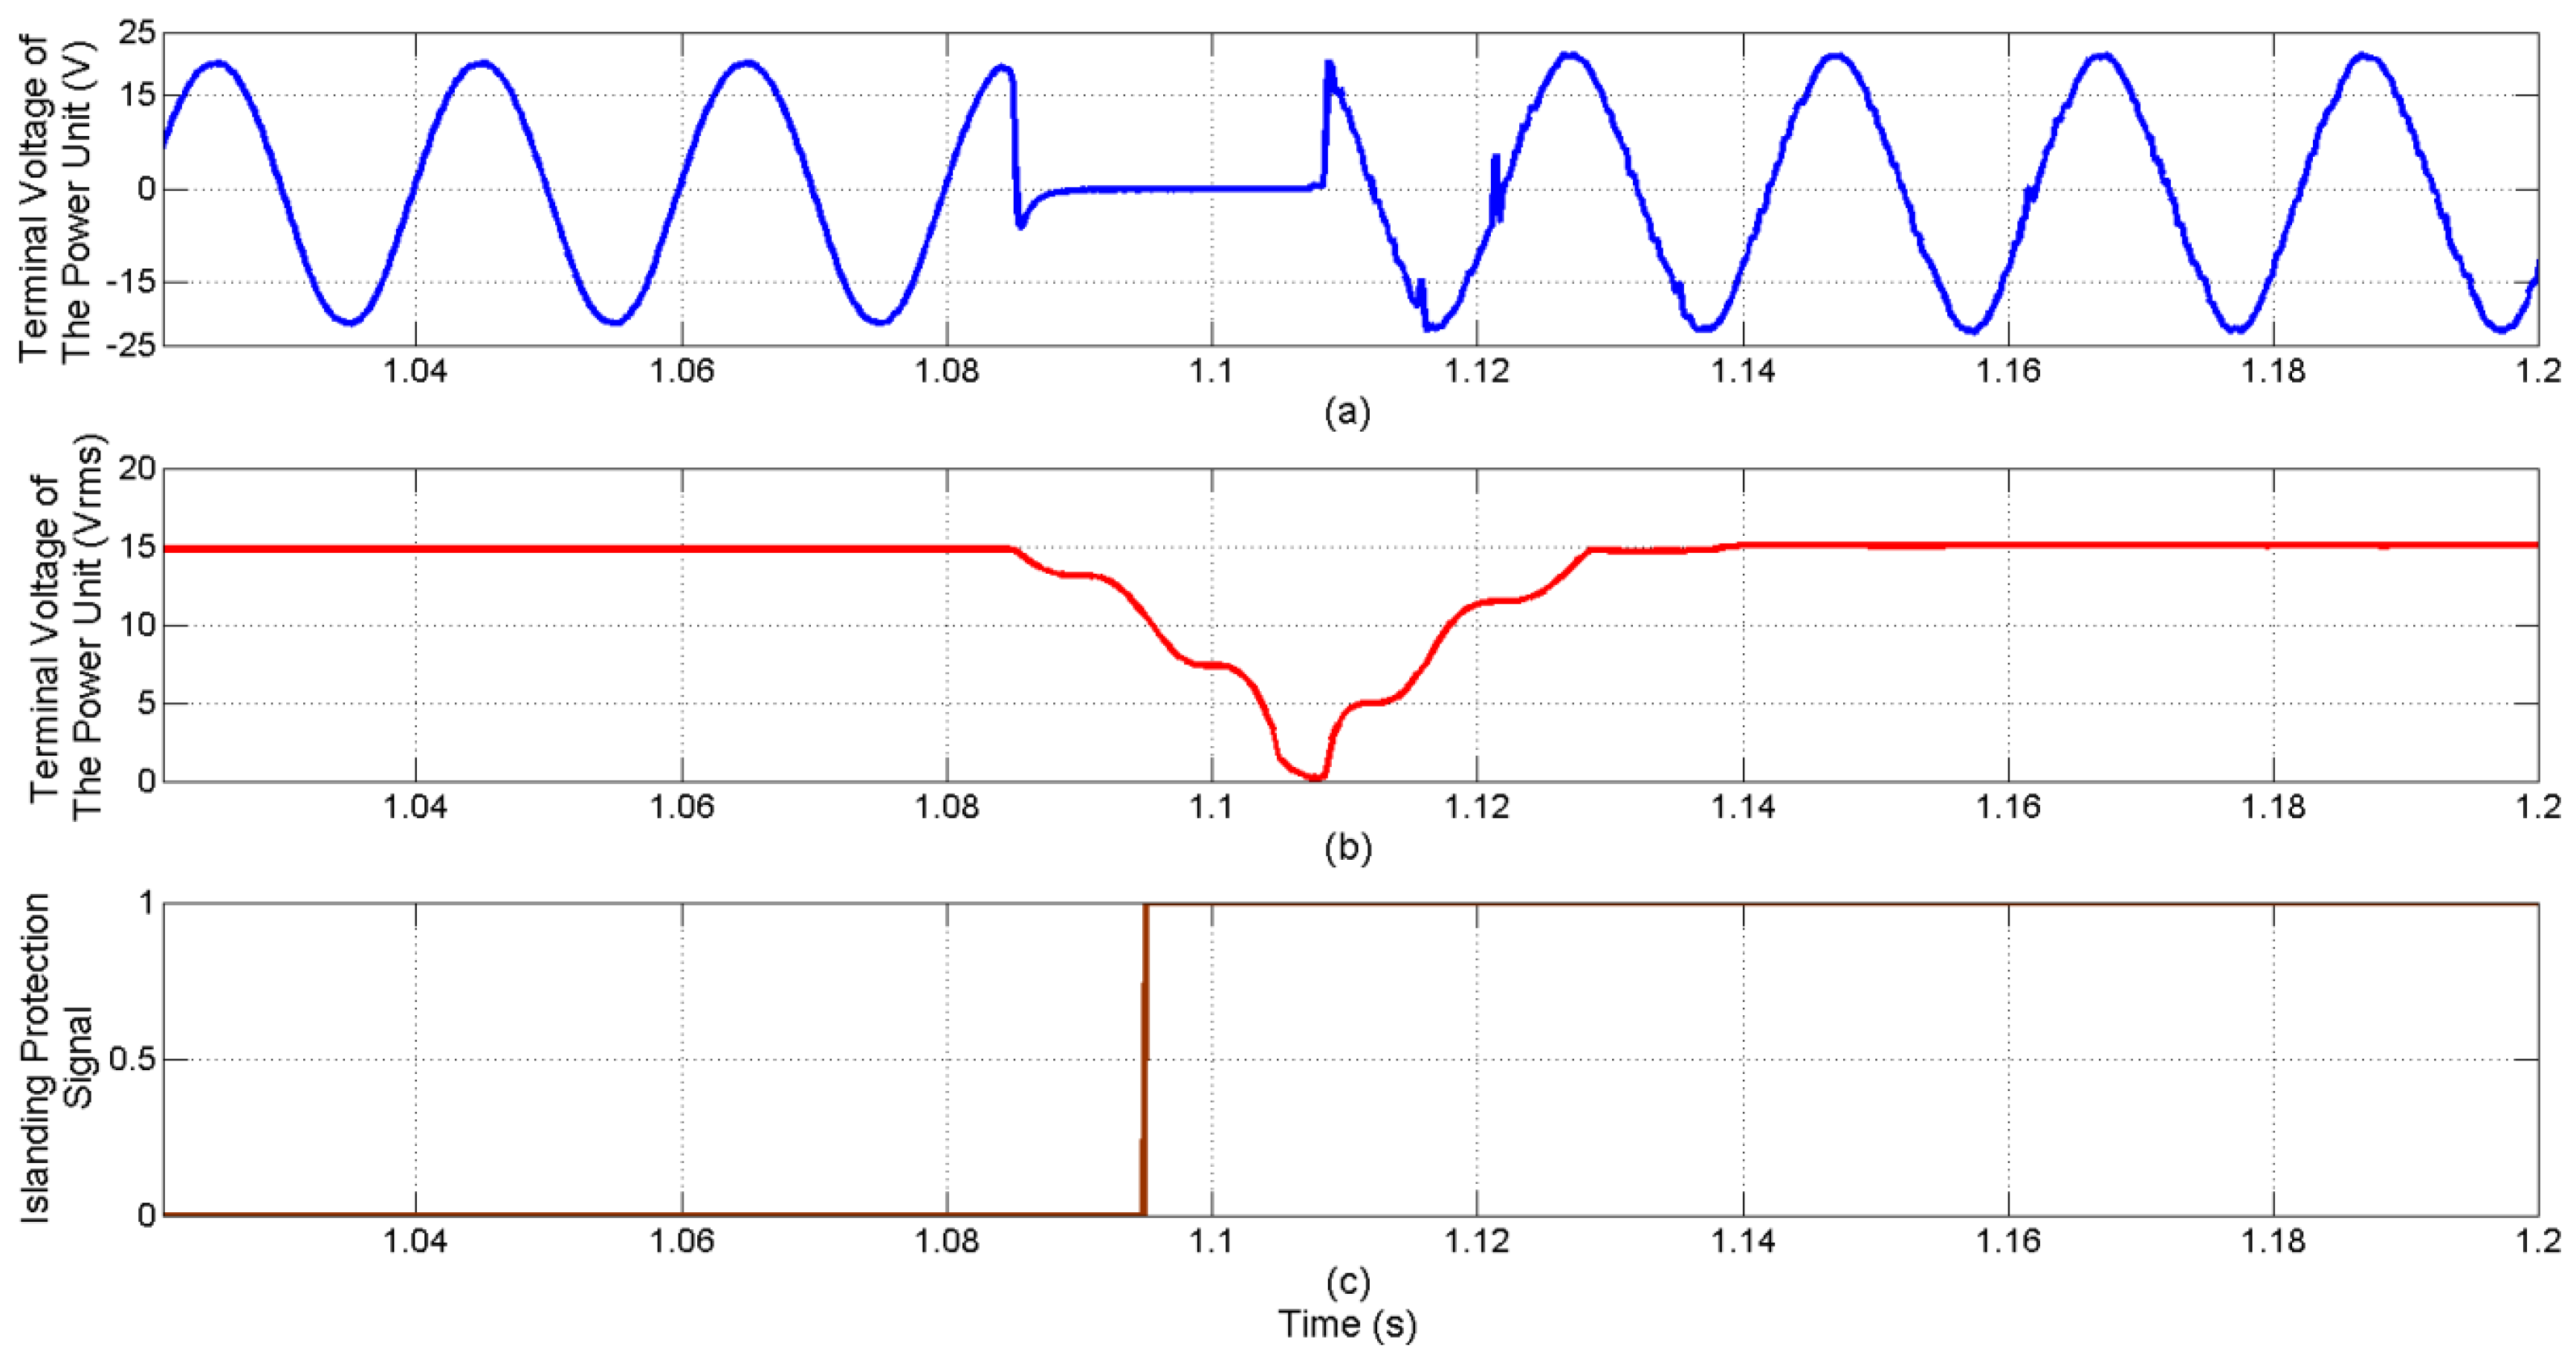
Figure 8, includes eight input and two output signals. Five of the input signals are measurement data taken from sensors. At first, these measurement data enter the calibration block and signals are converted to the actual values. Then, the calibrated signals enter the data storage block. The grid voltage information is sent to the grid monitoring block from the data storage block. The information of incoming grid voltage is checked if it is in the voltage range specified by the grid monitoring block. Accordingly, the islanding protection signal is generated. Also, some data are sent to the V2H control block, which provides safe system operation. These data are the battery voltage and the terminal voltage of the power unit, respectively. Furthermore, the V2H control block receives the confirmation signal of the end-user, SoC limit, the price of electricity, and the islanding protection signal from the grid monitoring block. Depending on these inputsV2H operation is started by generating SPWM signal. The SPWM signal generated by dSPACE is applied to the power unit through the dead-time generation unit in order to perform the energy transfer from the battery to the load. In addition to this generated signal, the dSPACE control unit transmits another control signal to the islanding protection unit for commissioning and decommissioning procedures. Lastly, the SPWM block operates according to the confirmation signal of the end-user and generates the driving signal required for the power unit. In this experimental study, the SPWM block for the power unit is operated at 10 kHz.
2.2.2. Operation of the Test Platform
Initially, the battery group and the power unit representing a GEV are connected to the grid connection point via a transformer. However, in this study, GEV is operated as a UPS and therefore the charging of the battery is not included in the experimental study and the power unit is employed only for discharging the battery. The reason for using a transformer in the test platform is the quite low level of battery voltage according to the grid voltage. At the beginning of the experimental study, the grid supplies the load and GEV is in standby mode, depending on the status of the power grid. After a while, the power failure occurs on the grid side and the load does not remain energized. As a result of this fault, the recommended V2H operating mode will take action. From this moment, the power unit requires the formation of the necessary conditions to operate as an UPS. Those conditions are:
If the initial SoC of the battery is greater than the reference SoC limit,
If the end-user gives permission for V2H,
If the islanding protection process is realized (the grid is isolated from loads and power unit),
If the voltage value of the power unit is approximately zero regarding the measurement unit signal,
If the price of electricity is greater than the reference price value (optional).
If all of the foregoing conditions are met, the control system formed by dSPACE allows GEV to be operated as a UPS. In this V2H operating mode, the power unit is operated as voltage-controlled and the power flow is provided from the battery to the loads.
The last step is the termination of this operation mode. There are several conditions for the termination of this operation mode. The mentioned conditions for operation termination are:
If the SoC of the battery is lower than the reference SoC limit,
If the end-user cancels the operation status,
If the measurement signals of the grid side show existence of energy (if the voltage value of the power grid is within appropriate values for standards),
If the price of grid electricity is more than the reference value (optional).
As a result of the provision of one or more termination conditions, dSPACE terminates sending signals to the power unit through the dead-time generation unit. After that, dSPACE receives and evaluates data coming from sensors. As a result of this evaluation, dSPACE interrupts the signal of the islanding protection unit (contactor) when there is no problem in terms of security (approximately two cycles). Consequently, the grid-load connection can be realized again.
4. Conclusions
Recently, a great number of studies have been performed on GEVs, which are considered to provide zero emissions. In these studies, it is declared that this GEV technology will gradually become widespread in the near future. As it is well known, an energy storage unit that provides the required power for a vehicle is employed in GEVs. This energy storage unit should be recharged at charging points. Also, another reason for this type of GEV to be popular is that the vehicle can be connected to the grid. Nowadays, the interaction of GEV with the grid is bi-directional, as is the charging process. However, GEVs can be operated bi-directionally by modifying the design of a vehicle’s power unit or units. In such operating condition, a GEV can be operated as a UPS and supply the energy demand of the consumption center.
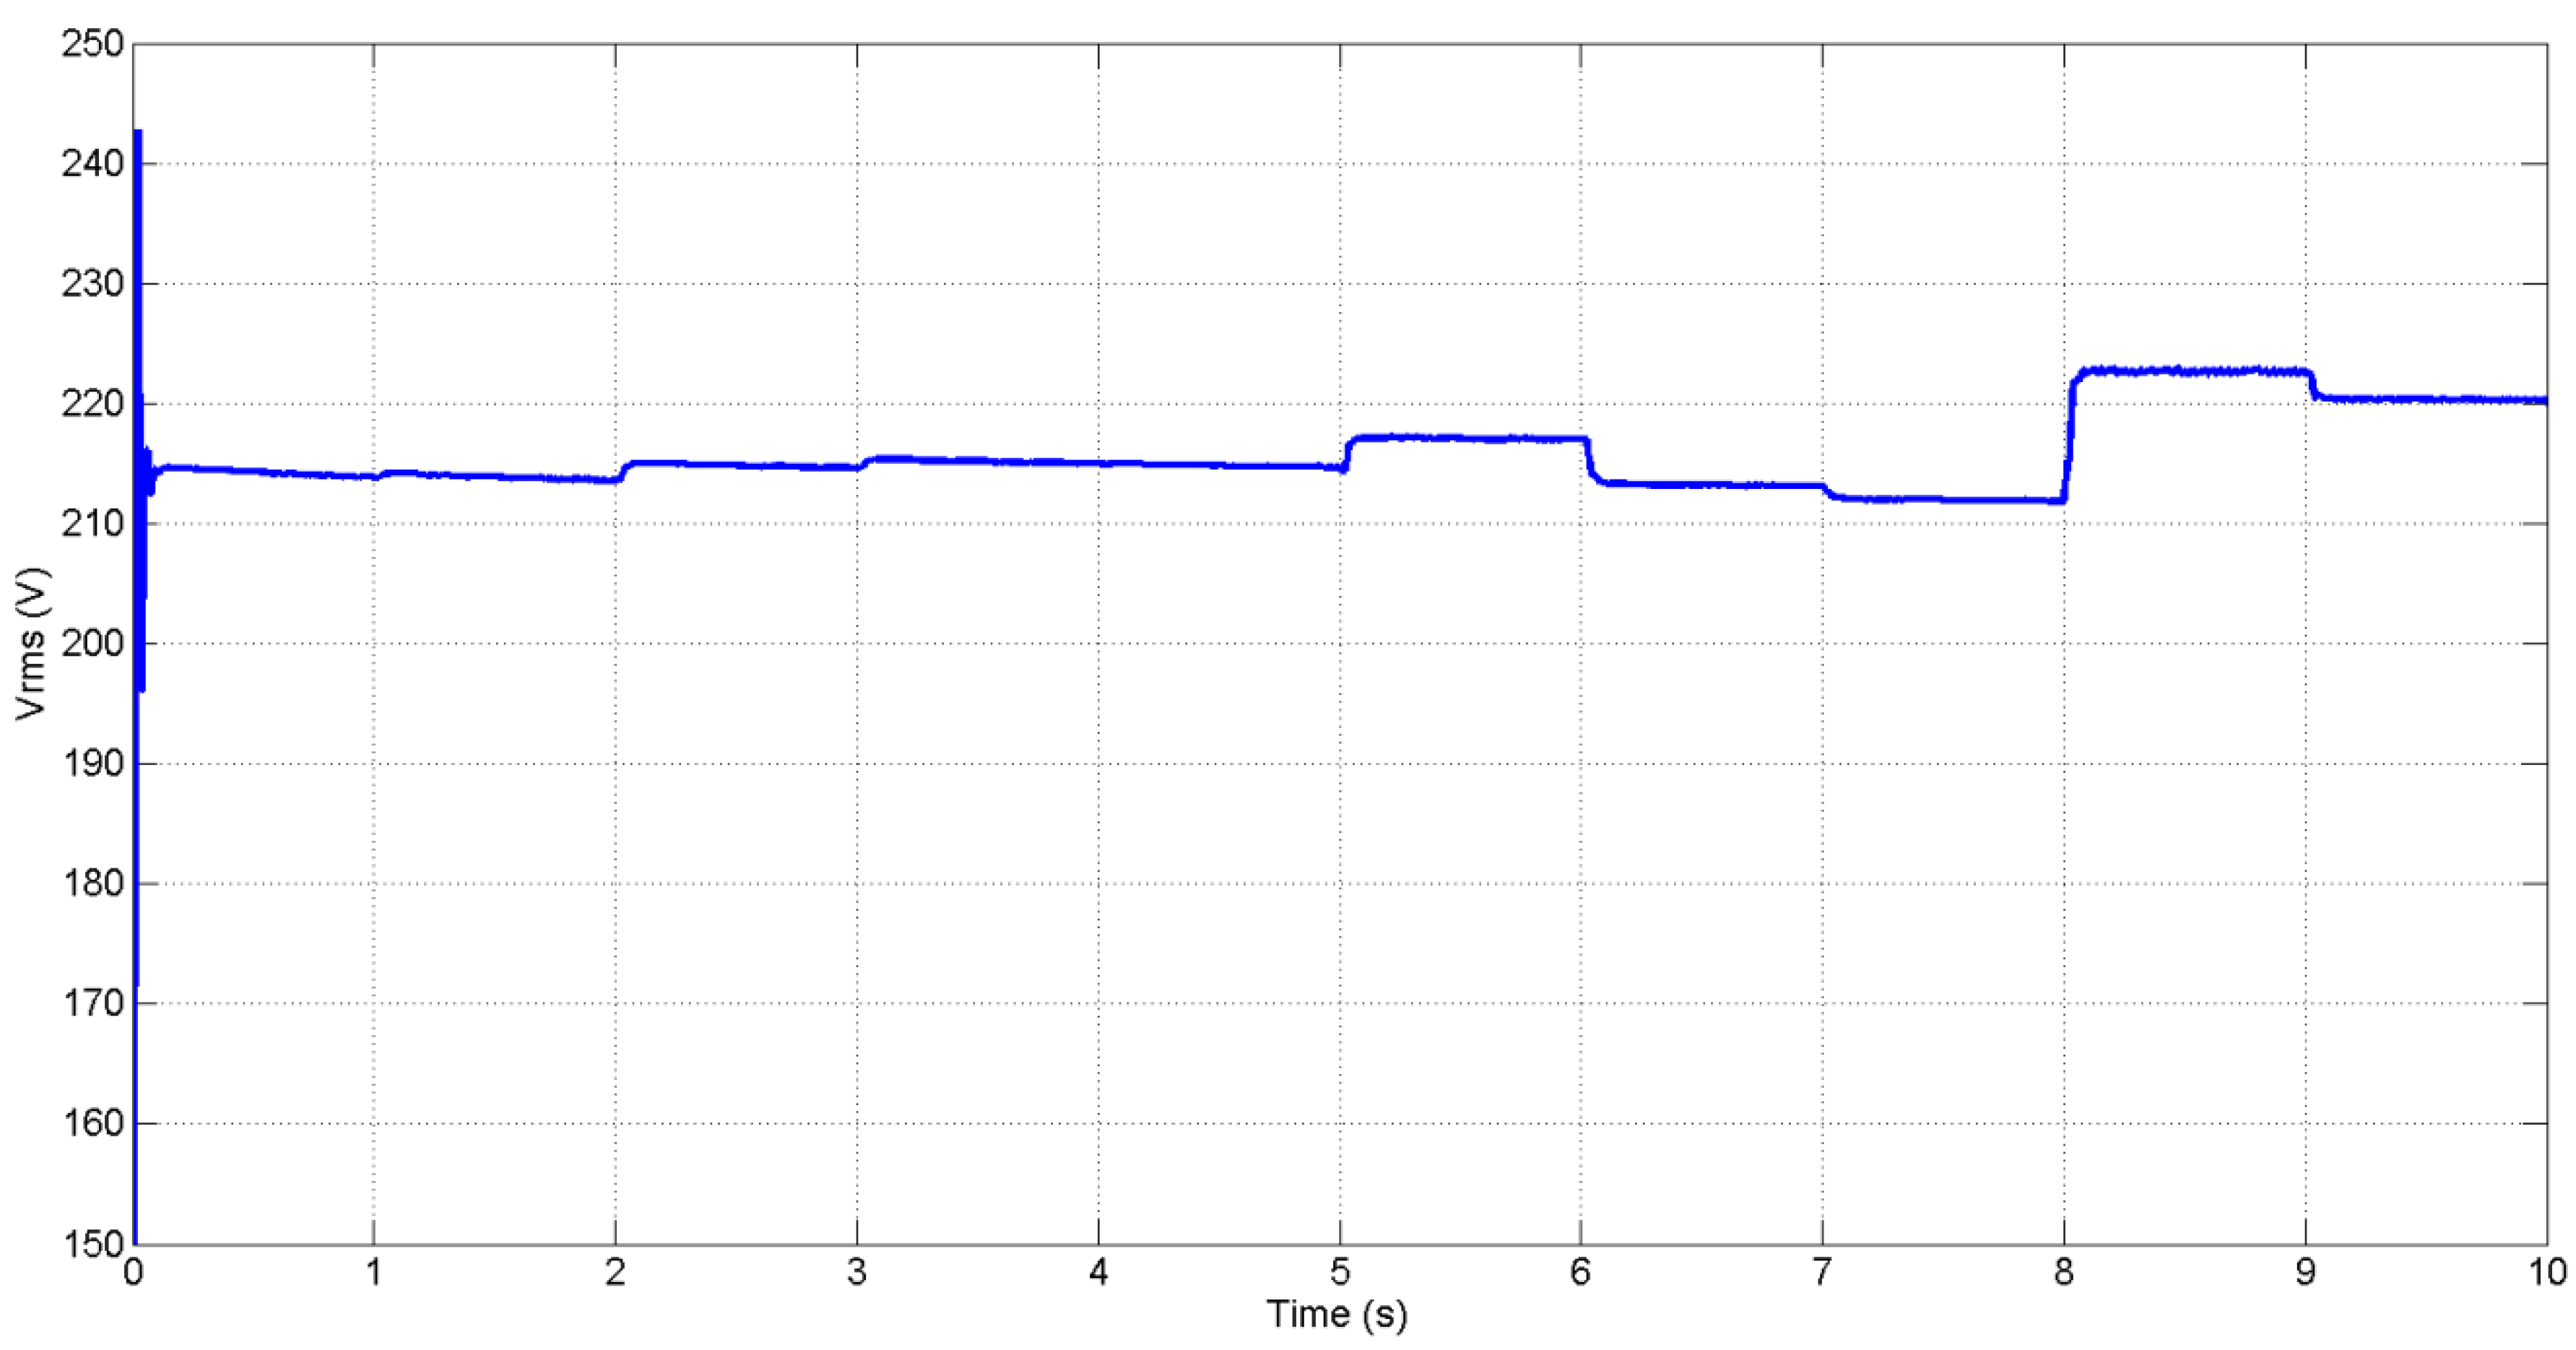
Before starting the study, it was assumed that battery of a GEV can supply a portion of an end-user premise’s load. The test system was prepared primarily in a simulation environment for testing and improving the accuracy of the planned system and algorithm and the system was tested with the real measured power data of a building. The voltage, frequency, etc., values remained within standards and the building could be supplied with high-quality energy. The results of the simulation study showed that the proposed test system can be used successfully in daily life as a UPS.
Afterwards, the test platform was established to present the verification of the controller system design and to implement a successful vehicle–home connection. The experimental results showed that the established test platform performed successfully under normalized conditions and can be practically implemented. The activation and deactivation of the power unit and islanding protection unit were realized in as rapid (approximately two cycles) and safe a way as possible when energy was interrupted on the test platform.
To this end, it should be noted that the idea of the V2H operating conditions has been confirmed by successful simulation and experimental studies. It is expected that the developed test platform can also be adapted to any GEV and end-user type, thus enabling GEVs to be employed for other purposes apart from transportation. In addition, this concept can also be used in different situations, such as emergency disasters such as earthquakes and blackouts.


