Article

Application of the Extension Taguchi Method to Optimal Capability Planning of a Stand-alone Power System

1
Department of Electrical Engineering, National Chin-Yi University of Technology, No. 57, Sec. 2, Chung-Shan Rd., Taiping District, Taichung 41170, Taiwan
2
Department of Industrial Engineering and Management, National Chin-Yi University of Technology, No. 57, Sec. 2, Chung-Shan Rd., Taiping District, Taichung 41170, Taiwan
*
Author to whom correspondence should be addressed.
Energies 2016, 9(3), 174; https://doi.org/10.3390/en9030174
Submission received: 17 October 2015 / Revised: 11 January 2016 / Accepted: 26 February 2016 / Published: 8 March 2016

Abstract

:
An Extension Taguchi Method (ETM) is proposed on the optimized allocation of equipment capacity for solar cell power generation, wind power generation, full cells, electrolyzer and hydrogen tanks. The ETM is based on the domain knowledge containing the product specifications and allocation levels provided by suppliers and design factors since most of the renewable energy equipment available in the market comes with a specific capacity. A proper orthogonal array is used to collect 18 sets of simulation responses. The extension theory is introduced to determine the correlation function, and factor effects are used to identify the optimized capacity allocation. The hours of power shortage are simulated using Matlab for all capacity allocations at the lowest establishment cost and the optimized capacity allocation of loss of load probability (LOLP). Finally, the extension theory, extension AHP theory, ETM and Analytic Hierarchy Process (AHP) are used to determine the optimized capacity allocation of the system. Results are compared for the above four optimization simulation methods and verify that the proposed ETM surpasses the others on achieving the optimized capacity allocation.

1. Introduction

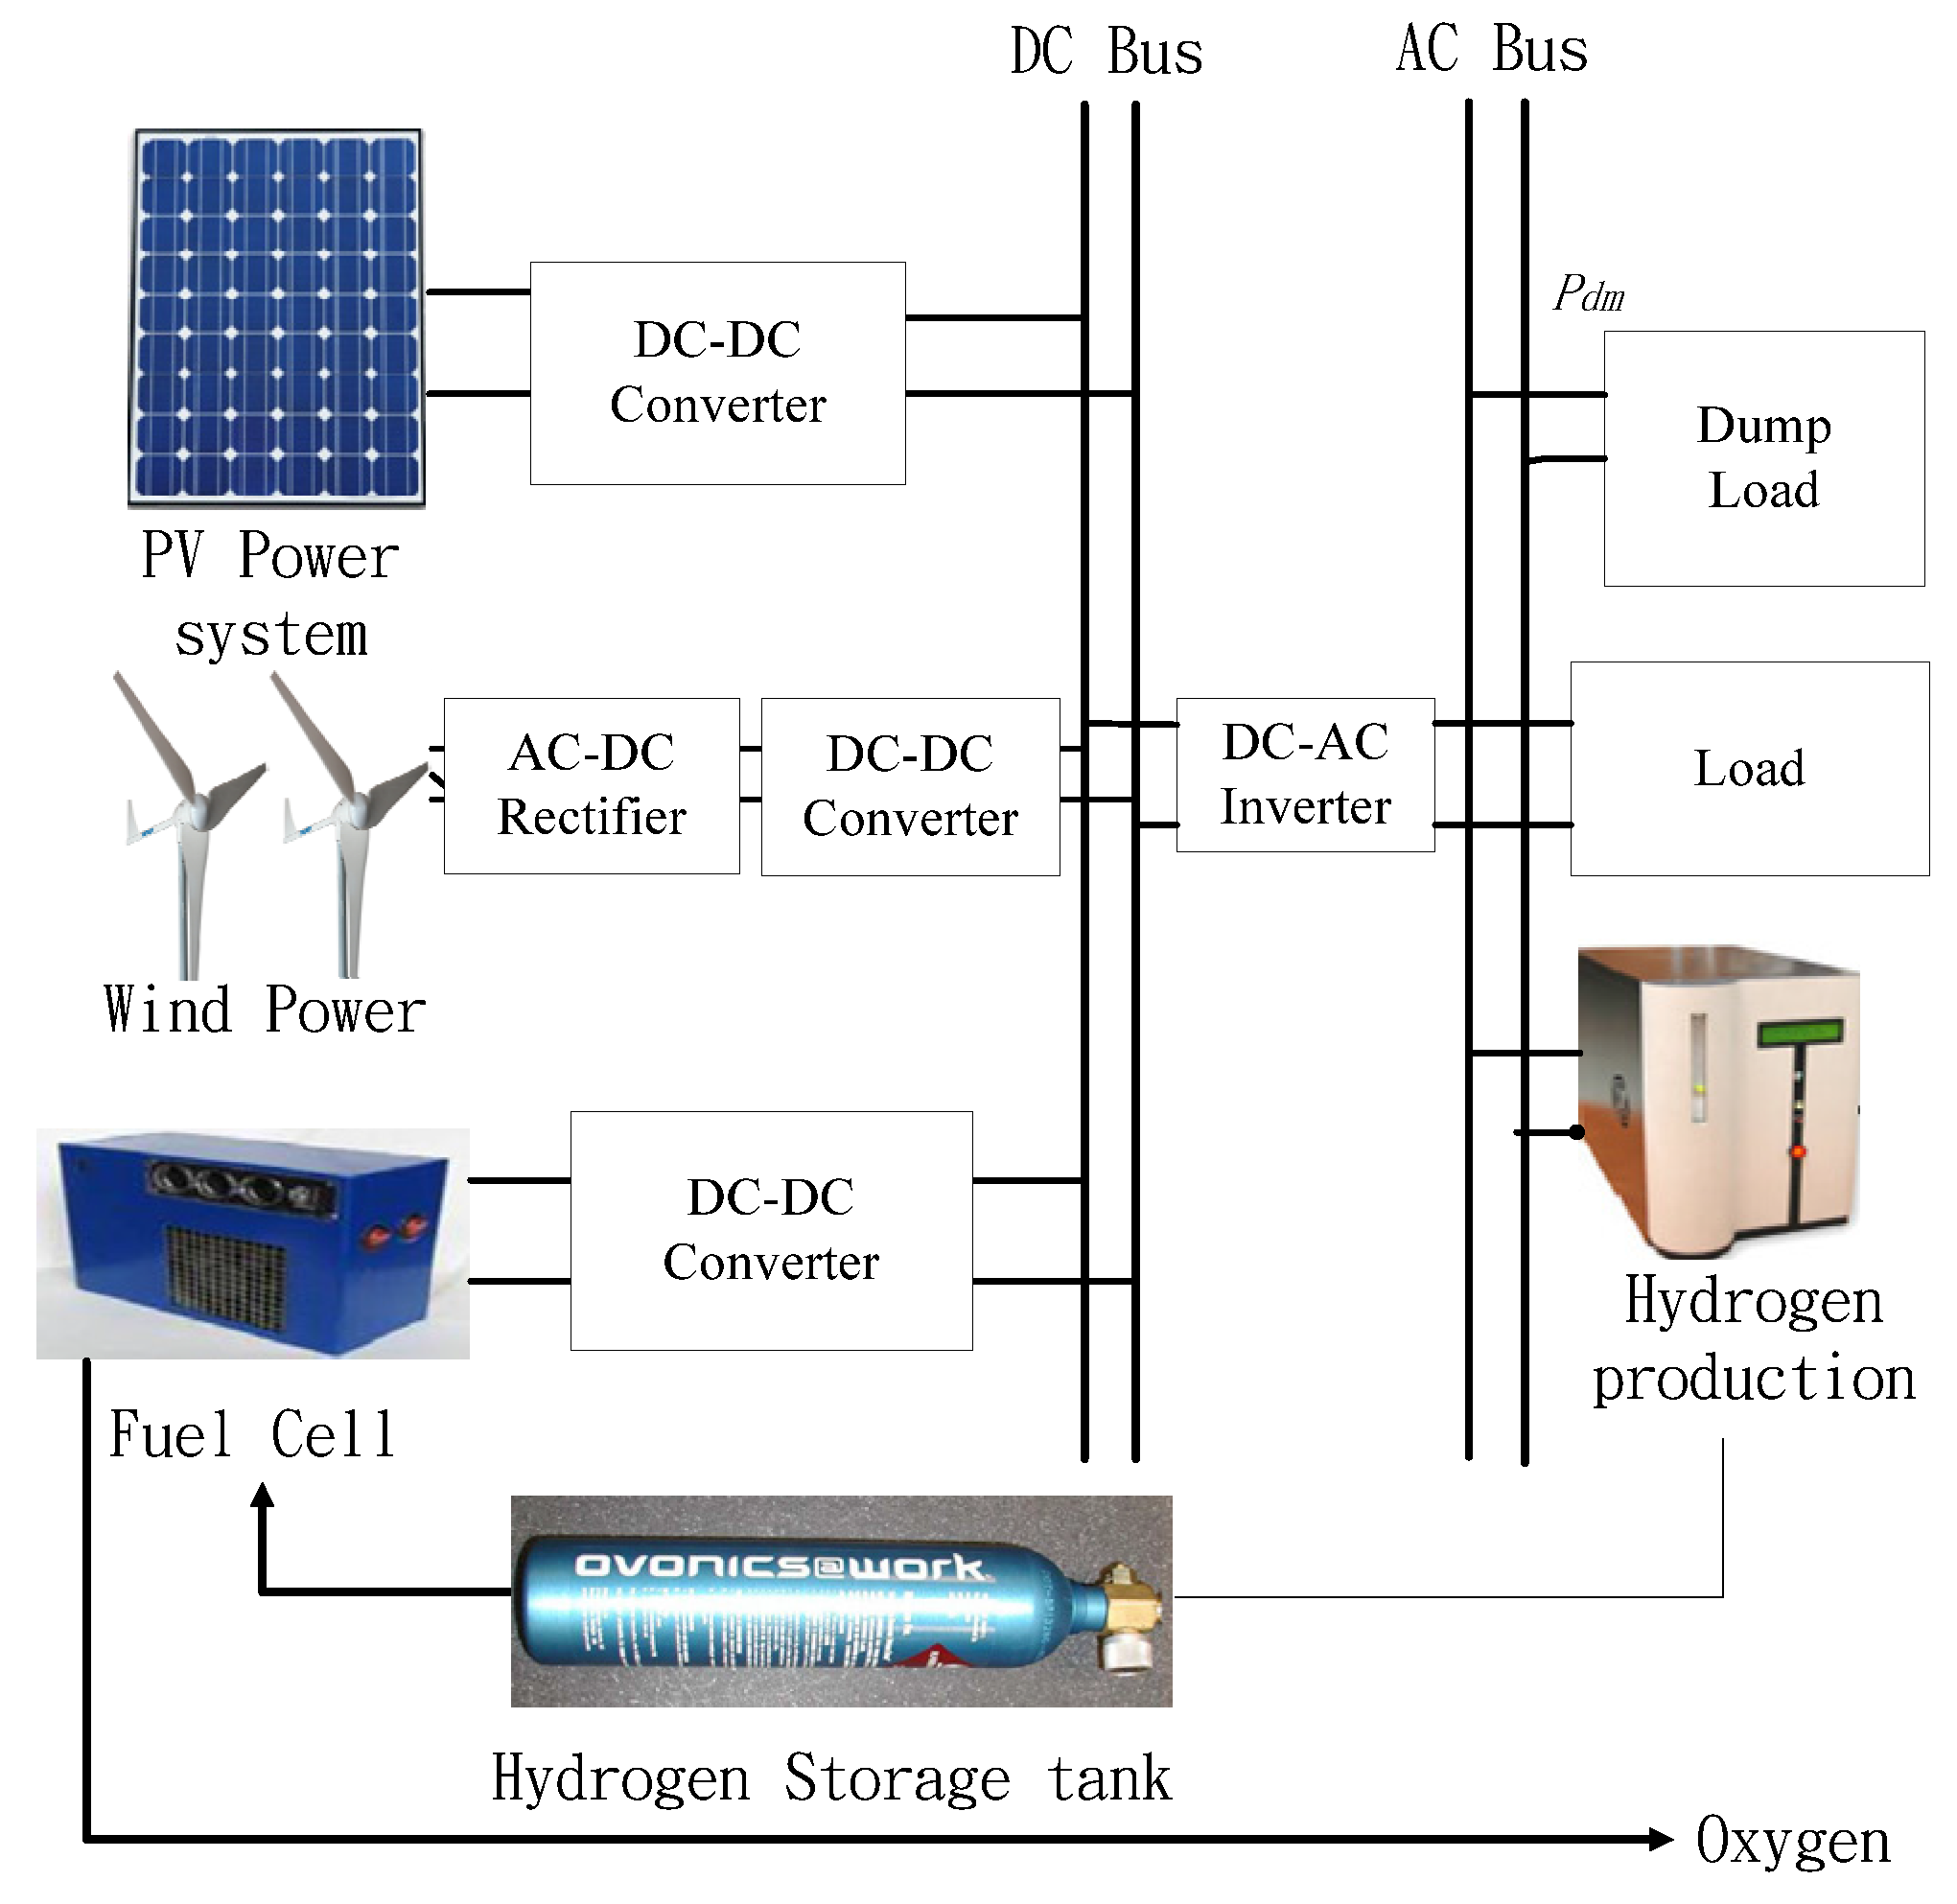
This paper integrates the renewable energy equipment of the photovoltaic (PV) power system, wind power, fuel cell, electrolyzer and hydrogen tank into one stand-alone power system. The optimized capacity allocation is an important issue for a stand-alone renewable energy system. A stand-alone renewable energy system is usually installed in remote mountains, on an island or where the utility power grid does not reach. A poor capacity allocation will not balance the power supply and demand and waste the costs for the system establishment. The simulated analysis shall be the reference of capability configuration [1,2]. The allocation of system device capacity affects the stand-alone power system [3,4]. When the device capability configuration is not appropriate, it may cause power shortages, or generate too much electricity while the system is unavailable, which wastes money [5,6]. On the contrary, with reasonable system allocation, the operation of power supply system will be set at the optimum cost.
Nelson et al. applied particle swarm optimization on the optimal sizing of a stand-alone wind/fuel cell power system [7]. They presented the unit sizing and cost analysis of stand-alone hybrid wind/PV/fuel cell power generation systems. Ekren et al. [8] used simulated annealing method for the size optimization of a PV/wind hybrid energy conversion system with battery storage. The drawback of this method is that it takes too much computing time and the computing results needs to be adjusted through experience to fit in the specifications of the common practical products.
Yang et al. [9] applied genetic algorithm to calculate the optimal system configuration with relative computational simplicity. Some commercial software like HOMER [10], IHOGA [11] were developed to figure out the optimal allocation. Based on the simulated weather data, this study estimates the possibility of loss of load probability (LOLP) for one or more years. Taguchi quality engineering was developed and advocated by Dr. Taguchi Genichi [12] in 1950. The orthogonal array experiment design and analysis of variance (ANOVA) were used for the analysis with a limited experimental data to effectively improve product quality [12]. The Taguchi method is widely applied in the manufacturing field, but this study is the first to apply the Taguchi method in the optimization of hybrid power systems.
This paper combines the extension theory with the Taguchi method, selects the proper design factors and levels via the orthogonal array to greatly decrease the number of experiments to acquire the optimum experiment result through the classical domain and neighborhood domain extension to narrow down and find the optimum capability planning. The advantages of the proposed ETM include: (1) the optimization process is subject to the specifications of practical equipment; (2) fast computing speed; and (3) the results could be directly applied on the real situation.

2. System Model

The stand-alone power system is divided into electricity generation, energy storage and standby energy. Electricity generation is formed by the wind power and PV power system using the kinetic energy of wind and the solar luminous energy. Although the wind and solar complementary systems make up for each other’s deficiencies as shown in Figure 1, where the natural energy generating capacity cannot create a continuous power supply all the time due to weather variations. Therefore, energy storage equipment is required. When the electricity generated is enough, it shall launch the electrolyzer to produce the hydrogen, and store the latter in the hydrogen tank. When the generating capacity is insufficient, it could use the hydrogen in the hydrogen tank and the fuel cell to satisfy the load as shown in Figure 2. The dump load is also included as a component in the system to consume the excess electricity when renewable power is abundant and the storage system is fully charged. In order to make a system device with the most cost-saving and most efficient power supply capacity, the system capability configuration must operate optimally.

2.1. The Objective Function

Normally, this system uses wind power and PV power system, and makes use of wind-light complementarity feature to generate electricity. If wind turbines and solar cell cannot supply rated load, then determine whether there is hydrogen can be used, and then use hydrogen to satisfy load. The loss of load hours βH will increase if hydrogen is not sufficient. The calculation process is shown in Figure 2, where PW is power capacity of wind power, PPV is power capacity of the PV power system, PL is load capacity.
The above βH of the system can be used to calculate the loss of load probability (LOLP) βP. Bringing βP into the algorithm is to solve the contradiction of load capacity, loss of load, and cost. The calculation of βP is shown in Equation (1):
β P = β H T
βP per hour is often expressed as 0 or 1. When βP is 1 in one hour, it indicates that the power system cannot supply the rated load [3]. The more times a 1 is recorded in total time T, the poorer the reliability of the independent power system.
Many methods and cost functions are available, and differences exist among them. Considering a stand-alone power system, especially in a remote area that the utility power grid cannot reach, the possibility of LOLP and the return on investment are the most two important factors in Taiwan. According to the cost planning of available products, cost Bc and LOLP are equally important. The sum of weights is 1, and the weights of cost (λ1) and LOLP (λ2) are set as 0.5. The weights vary depending on different system requirements. The objective function of the paper is shown in Equation (2):
M i n F = β C ( p u ) × λ 1 + β p ( p u ) × λ 2
where:
B c ( p u ) = B c ( k ) B c   min B c   max B c   min
B p ( p u ) = B p ( k ) B p   min B p   max B p   min
In addition, we also calculate the investment recovery period of the total power generation, and the total recovery period is shown in Equation (5):
Y C = C t ( E p × G p C t × C p )
where YC is the return period on investment, Ct is the setup cost, Ep is total power generation, Gp is the power unit cost, and Cp is bank interest rate in Taiwan.

2.2. Mathematical Models of Solar Photovoltaic

Silicon is the most easily obtainable material used for manufacturing semiconductors, and it is plentiful on the planet. Currently silicon is the main material for solar cells. Photovoltaic modules are major formed by serially/parallelly connecting solar cells together, and usually photovoltaic module structures contain large PN junction diodes. When solar cells are illuminated by sunlight, they will convert light energy into electrical energy. Being serially or parallelly connected in a module, a solar cell will have a different impact on the current and voltage of array output. When a parallelly connected solar cell is added, it will increase the array current; when a serially connected solar cell is added, it will increase the array voltage, where Iph is the current generated by solar cell when it is illuminated by sunlight, [4], and the equations of the solar energy equivalent circuit are shown in Equations (6) and (7):
I P H = Z × I S C ( 1 + K o × ( T P V T r ) )
P P V = n p I P H V n p I s a t V [ e ( q B K T P V V n s ) 1 ]
where Z is illuminance, ISC is a current on a light intensity 1000 W/m2 and ambient temperature 298 K, Isat is the reverse saturation current, np is the number of solar cells connected in parallel, ns is the number of solar cells in series, Ko is the short circuit current correction coefficient, B is an ideal parameter which is 1, K is the Boltzmann constant (1.3806 × 10⁻²³ J/K), Tpv and Tr are the real and reference temperature of the solar cell.

2.3. Mathematical Models of Wind Power

Wind turbines obtain kinetic energy from wind, mainly from blades touched by air flow when the Earth rotates. Wind energy will rotate blades; the wind turbine blade shaft will convert wind energy into useful mechanical energy, and this is followed by the conversion of mechanical energy into electrical energy. Due to the aerodynamic effect, the blade rotor will be rotated by the force of the wind, and the aerodynamic force is divided into lift force and drag force to produce torque on the blades [5]. The output power of the wind turbine is converted into mechanical energy, and the equation generated by wind power generation is shown as in Equation (8) [6]:
P A = 1 2 ρ π R 2 V w 3
When the wind speed is constant, the wind turbine power output is proportional to the square of wind turbine’s diameter. When a wind turbine’s diameter is fixed, its power output is proportional to the cube of wind speed, when wind diameter and wind speed remain unchanged. A wind turbine’s power output is proportional to CP [13], and the wind output equation is shown as in Equation (9):
P w = C p × ( T S R ) × P A
where ρ the is air density (kg/m3), R is the radius of the rotor blade (m), VW is wind speed (m/s), TSR is the wind turbine’s blade tip speed ratio, and Cp is the wind turbine’s performance index.
When the wind speed reaches Voff, the turbine will generally lock the rotor and suspend power generation in order to prevent the wind turbine from operating at speeds which may damage the blades, and this wind speed is called the shutdown wind speed. On the contrary, when the wind speed is lower than Von, although the wind turbine can continue generating electricity, usually its operation will be suspended to prevent the wind turbine from disconnecting from/connecting to the power system too frequently, and this wind speed is called the cut-in wind speed. Based on Equation (10), the typical curve of the wind power system is shown in Figure 3 [14]:
P w ( V W ) = { 0 C p × ( T S R ) × ( 1 2 ρ π R 2 V w 3 ) 0 | V w < V o n V o n V w V o f f V w > V o f f }
where Vw is the current wind speed, Von is the starting wind speed, and Voff is the ending wind speed.

2.4. Mathematical Models of Fuel Cell

Fuel cells are a kind of device that converts chemical energy into electrical energy. The voltage of a single fuel cell is too low to be practical (approximately 0.6 to 0.8 volts), so it is necessary to serially connect fuel cells together in order to raise the power output voltage [15]. Fuel cells are subject to some losses when converting chemical energy into electrical energy. For fuel cells, the power output can reach its highest value only in a reversible state, but the power output is less than the ideal power because it is subject to some restrictions in actual operation. The fuel cells used in this study are proton exchange membrane fuel cells, and the expression governing these fuel cells is given by Equation (11):
V F C = E N e r m o V a c t V o h m i c V c o n
where, VFC is output voltage, ENermo is the voltage of the reversible cell (thermal electric potential of fuel cell), Vact is the activation overpotential, Vohmic is the ohmic overpotential (ohmic overvoltage produced by the resistance effect of electrons passing through the electrode and protons passing through the exchange membrane), Vcon is the concentration overpotential (concentration overpotential caused by the reduction of reaction gas concentration).
In Equation (11), ENermo is the thermodynamic reversible voltage output by a single open circuit. Results obtained through the Nernst equation at a reference temperature of 25 °C are shown in Equation (12):
E N e r n s t = Δ G 2 F + Δ S 2 F ( T T 0 ) + R T 2 F [ ln ( P H 2 ) + 1 2 ln ( P O 2 ) ]
where, the Gibbs Free Energy change value is indicated by ΔG (J/mol), F is the Faraday constant (96487C), ΔS is the entropy value change, R is the universal gas constant (8.314 J/K·mol), PH2 and PO2 are the pressures of hydrogen and oxygen needed by fuel cell, T is the working temperature of fuel cell and T0 is the reference temperature. ΔG, ΔS and T0 under standard temperature and standard atmospheric pressure are substituted into Equation (12) to obtain the simplified Equation (13):
E N e r m o = 1.229 0.85 × 10 3 ( T 298.15 ) + 4.31 × 10 5 T × [ ln ( P H 2 ) + 0.5 ln ( P O 2 ) ]
Vact in Equation (11) is the voltage drop produced by the activated anode and cathode, which is shown in Equation (14):
V a c t = [ ξ 1 + ξ 2 T + ξ 3 ln ( C O 2 ) + ξ 4 T ln ( I F C ) ]
IFC in Equation (14) is the current of the fuel cell, CO2 (atm) the oxygen concentration and ξi (i = 1–4) are the characteristic coefficients of all fuel cells. Vohmic voltage drop in Equation (11) will cause a voltage loss of the fuel cell due to the resistance in charge transfer, in conformity with Ohm’s Law, see Equation (15):
V o h m i c = I F C ( R M + R c )
The Ohmic loss of a fuel cell can be minimized through use of a thin electrolyte membrane and conductive materials. RC in Equation (15) is the resistance of the contact electron current, which is deemed as constant in the literature since it can’t be obtained within the working temperature of proton exchange membrane fuel cell. RM is the resistance of the proton exchange membrane, which can be obtained through an empirical formula, see Equation (16):
R M = ρ M × l A c
ρ M = a / b a = 181.6 [ 1 + 0.03 I F C A C + 0.062 ( T 303 ) 2 ( I F C A C ) 2.5 ] b = [ ψ 0.634 3 ( I F C A C ) ] exp [ 4.18 ( T 303 T ) ]
AC in Equation (16) is the activation area of the fuel cell (cm2), while the thickness of the electrolyte membrane is expressed by l (cm), and the resistance of the electrolyte membrane ρM (Ω∙cm) indicates the coefficient, which is given by Equation (17). Parameter Ψ is the water content of membrane. The value of Ψ falling at 14 indicates an ideal relative humidity of 100%. However, the value of Ψ generally falls in the oversaturation region of 22–23, which is an adjustable parameter.
The voltage loss produced by a fuel cell in large-current operation is Vcon, indicating the concentration loss caused by diffusion limited mass transfer, see Equation (18):
V c o n = B × ln ( 1 J J max )
In Equation (18), B is the constant of a fuel cell of any type, which is determined by the fuel cell and its operation status. J is the current density (mA/cm2) produced by the fuel cell, Jmax is the largest current density, which is determined between 500 and 1500 (mA/cm2). Due to electrochemical action, the nitric oxide and carbonic oxide discharged by fuel cell is quite abundant. Thus, the invention of hydrogen energy converters with economic effectiveness and high efficiency will promote future commercial use. A typical 200 W fuel cell characteristic curve is as shown in Figure 4.

2.5. Objective Function Setting and Limitation

A well-optimized system will reduce costs to a minimum while satisfying the load demand. The targeted function of this paper is as Equation (2) [16], in which, the commercial market product has the consumption costs shown in Table 1.
According to the regular market specifications of power equipment, the minimum power supply needs to satisfy the Equation (19) as follows:
i = 1 ( P W + P V + P F C ) P L O A D + P E + P d m

3. Extension Taguchi Method

To optimize the allocation of equipment capacity, this paper proposes an optimization method combining extension theory and the Taguchi method. In 1983, the concept of extension theory was proposed to solve the contradictions and incompatibility problems. Based on some proper transformation, some problems that cannot be directly solved by given conditions may become easier or solvable [17]. One of the commonly used techniques in engineering fields is the Laplace transformation. The concept of fuzzy sets is a generalization of well-known standard sets to extend their application fields. Therefore, the concept of an extension set is to extend the fuzzy logic value from [0,1] to (−∞, ∞), which allows us to define any data in the domain and has given promising results in many fields [18,19,20]. Extension theory is used to calculate the comprehensive correlative degree of each group of the simulation experiment, then the analytical method average value of the Taguchi method is used to select the optimum capability configuration system and assess whether the selected group is the optimum result [21]. If the output result is optimal, then the process is done; otherwise, the extension correlative degree shall be recalculated. The advantage of this method is the ability to find the optimum solution in the shortest time and to limit the number of experiment trials needed. The calculation steps are as described below:
Step 1. Setting the level and design
This paper selects five three-level design factors in order to conform to the basic principle of an L18 orthogonal array. The design factors are used to reduce the power shortage probability while not ignoring the equipment cost. Thus the price is also set as a design objective. The design factor and the corresponding levels are shown in Table 2. The five three-level design factors are wind power, PV power, hydrogen tank, fuel cell, and electrolyzer. For example, the numbers of the wind power equipment designed for three corresponding levels are 1, 2, and 3. The numbers of equipment of each level for the design factors in Table 2 are subject to adjustment according to the setup costs, and the optimal results could be different.
Step 2. Using the proper orthogonal array
The Taguchi method significantly reduces the number of experimental configurations to be studied. Originally, there are 35 = 243 experiments in the full factorial design, and the L18 orthogonal array can accommodate five three-level design factors in only 18 experiments to efficiently collect experimental results to find the optimized factor combination. The proposed L18 orthogonal array table is shown in Table 3.
Step 3. Calculating the initial result
According to the experimental combinations in the orthogonal array, Matlab is applied to generate the 18 different electric power generation system quantities in the stand-alone power system which could simulate 18 different systems, and calculate each electric power generation system quantity price and power shortage hours, respectively. The results are shown in Table 3.
Step 4. Calculating the per-unit values
The simulated experiment data cannot be compared or calculated for the unit reference value difference, thus it requires per-unit value calculation to get the physical quantity relative to the reference value [22]. The necessary equation is as shown in Equations (3) and (4).
Step 5. Establishing the matter-element
In extension theory, N is given as the name of an object for the definition of the object, and the quantity value of its character c is v. The orderly combination is taken as the fundamental element describing the object, namely the matter-element. The name of the object may not be expressed by the single matter-element, but expressed by the multi-dimensional matter-element. The multi-dimensional matter-element assumes the object has n characters respectively c1, c2cn, and its corresponding quantity value is v1, v2vn. Putting the above S p u g ( k ) into v, the multi-dimensional matter-element expression is as shown in Equation (20), and the second group is placed after calculating the correlation functional value:
R t = [ N β c ( p u ) V t 1 β p ( p u ) V t 2 ]
Step 6. Establishing the classical domain and neighborhood domain
In extension theory, the positional relation of one point to two sections must be considered. If V o = a , b and V p = c , d are two sections in the real domain, it shall firstly confirm the classical domain and the neighborhood domain before getting the matter-element in. Establishing the system’s matter-element model, the defined classical domain is as Equation (21) and the neighborhood domain is as Equation (22). Defining the range according to the design factor demand, in extension theory, the classical domain is the expected value, and the neighborhood domain is the overall range.
R o = [ s y s t e m β p ( p u ) 0.7713 , 1.1739 β c ( p u ) 0.5181 , 1.1242 ]
R p = [ s y s t e m β p ( p u ) 0.1539 , 1.1739 β c ( p u ) 0.1827 , 1.1242 ]
Step 7. Calculating the correlation values
According to the definition of distance, we confirm the correlation function and use Equation (23) for assessment. If the value to be measured is within the classical domain, it shall be calculated by the method of Equation (23a); if the value to be measured is outside the classical domain, it shall be calculated in the method of Equation (23b) to get the correlation function.
K i ( v i ) = { ρ ( v i , V o j ) | V o j | , v i V o j ( a ) ρ ( v i , V o j ) ρ ( v i , V p j ) ρ ( v i , V o j ) , v i V o j ( b )
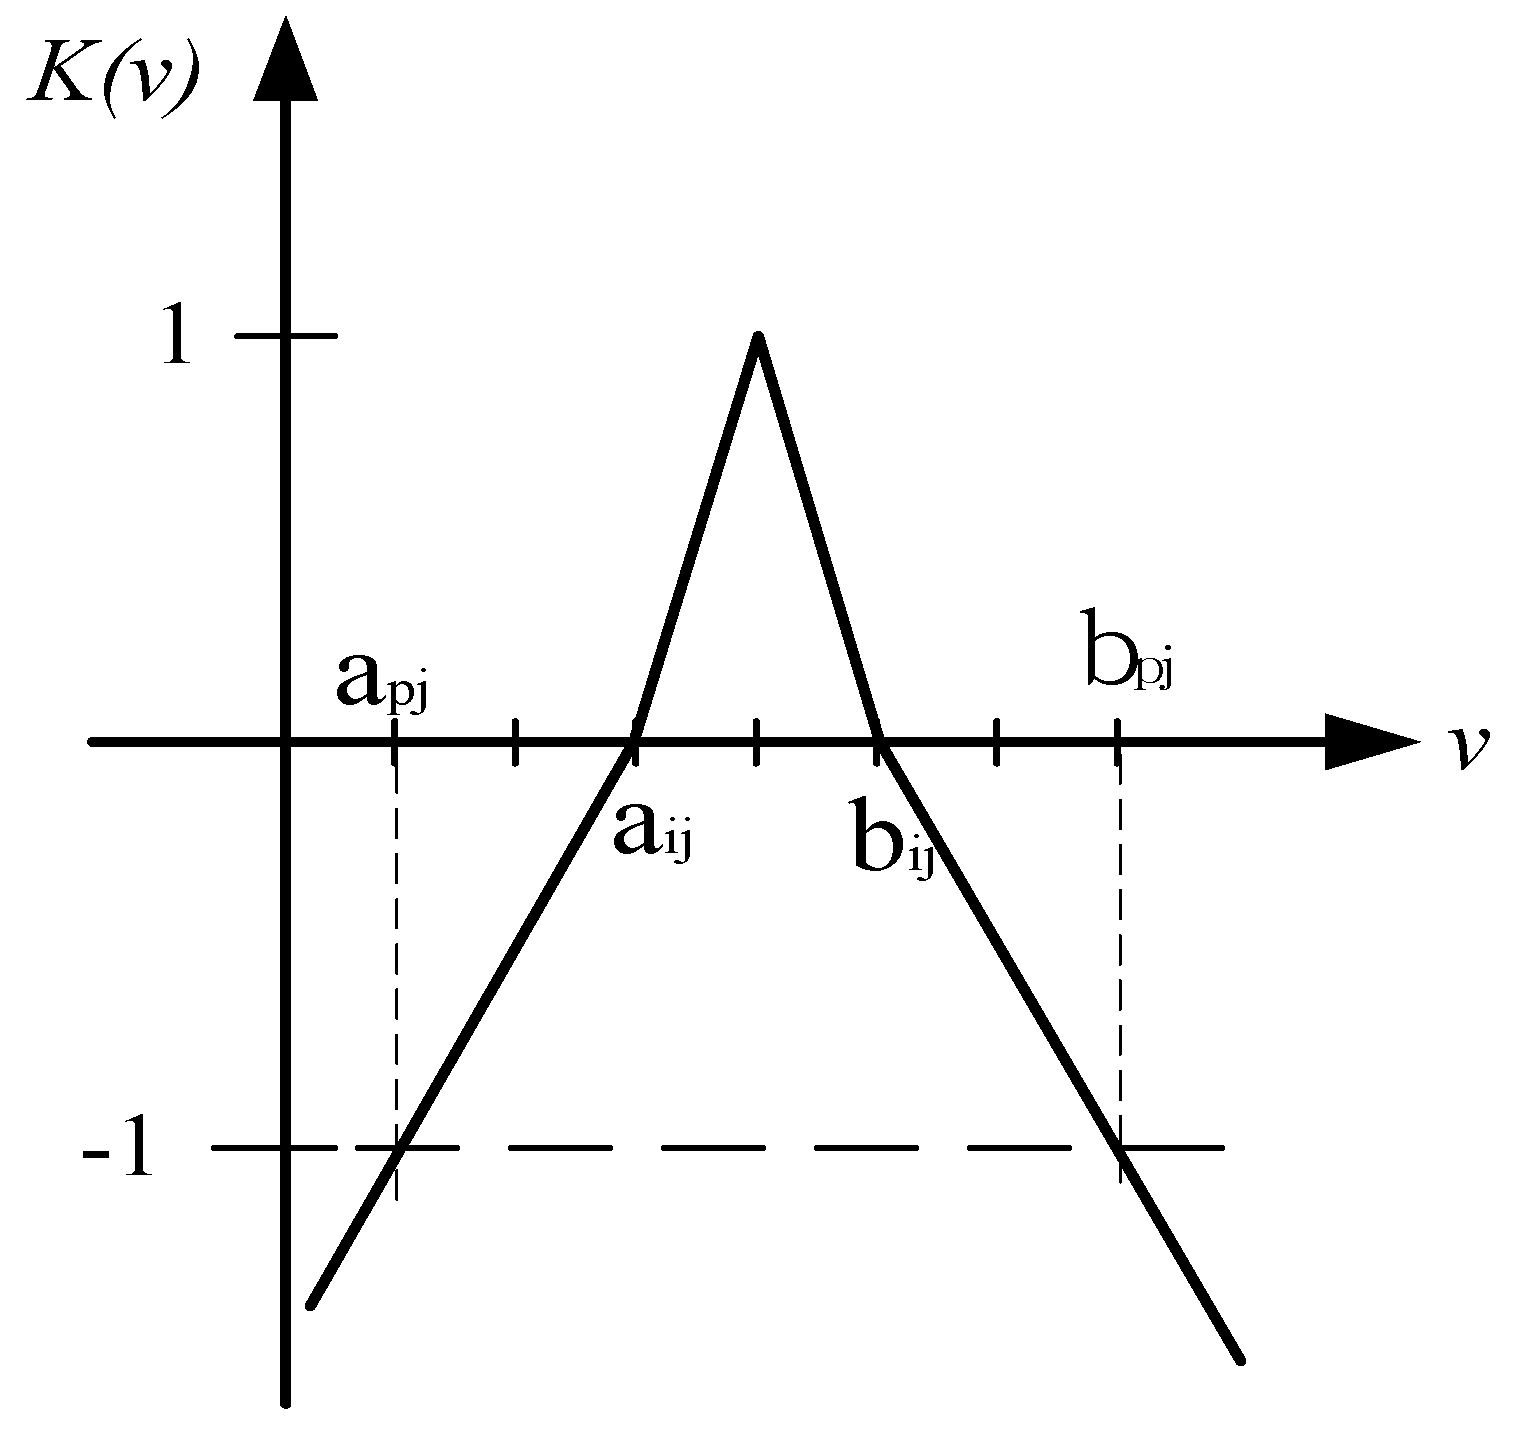
The proposed extension relation function can be shown as Figure 5, where 0 ≤ K(v) ≤ 1 corresponds to the normal fuzzy set. It describes the degree to which v belong to V. When K(v) < 0, it indicates the degree to which v does not belong to V.
Step 8. Comprehensive correlation degree
In the stand-alone power system, normally, the power shortage hours have higher priority than cost and the correlation degree function α1 is set at 0.62 and α2 is at 0.38 as in Equation (24), the result is given as shown in Table 4.
K ( p ) = i = 1 n α j K i ( v i )
Step 9. Average value analysis
Average value analysis uses the Taguchi method to calculate the influence of the factor effects to confirm the optimal factor combination by taking the average value analysis of levels for each factor by normalizing each level of comprehensive correlative degree of Table 5 according to the L18 orthogonal array grade in Table 4 to calculate the average value. The average value analysis is as shown in Equation (25), and the result is as shown in Table 6.
m ¯ = 1 n i = 1 n K ( p )
Step 10. Solution of optimum system parameter
Through the analysis of factor effects, the maximum stand-alone power system optimum allocation can be selected through average value analysis of the Taguchi method as shown in Table 6.

4. Simulated Result and Discussion

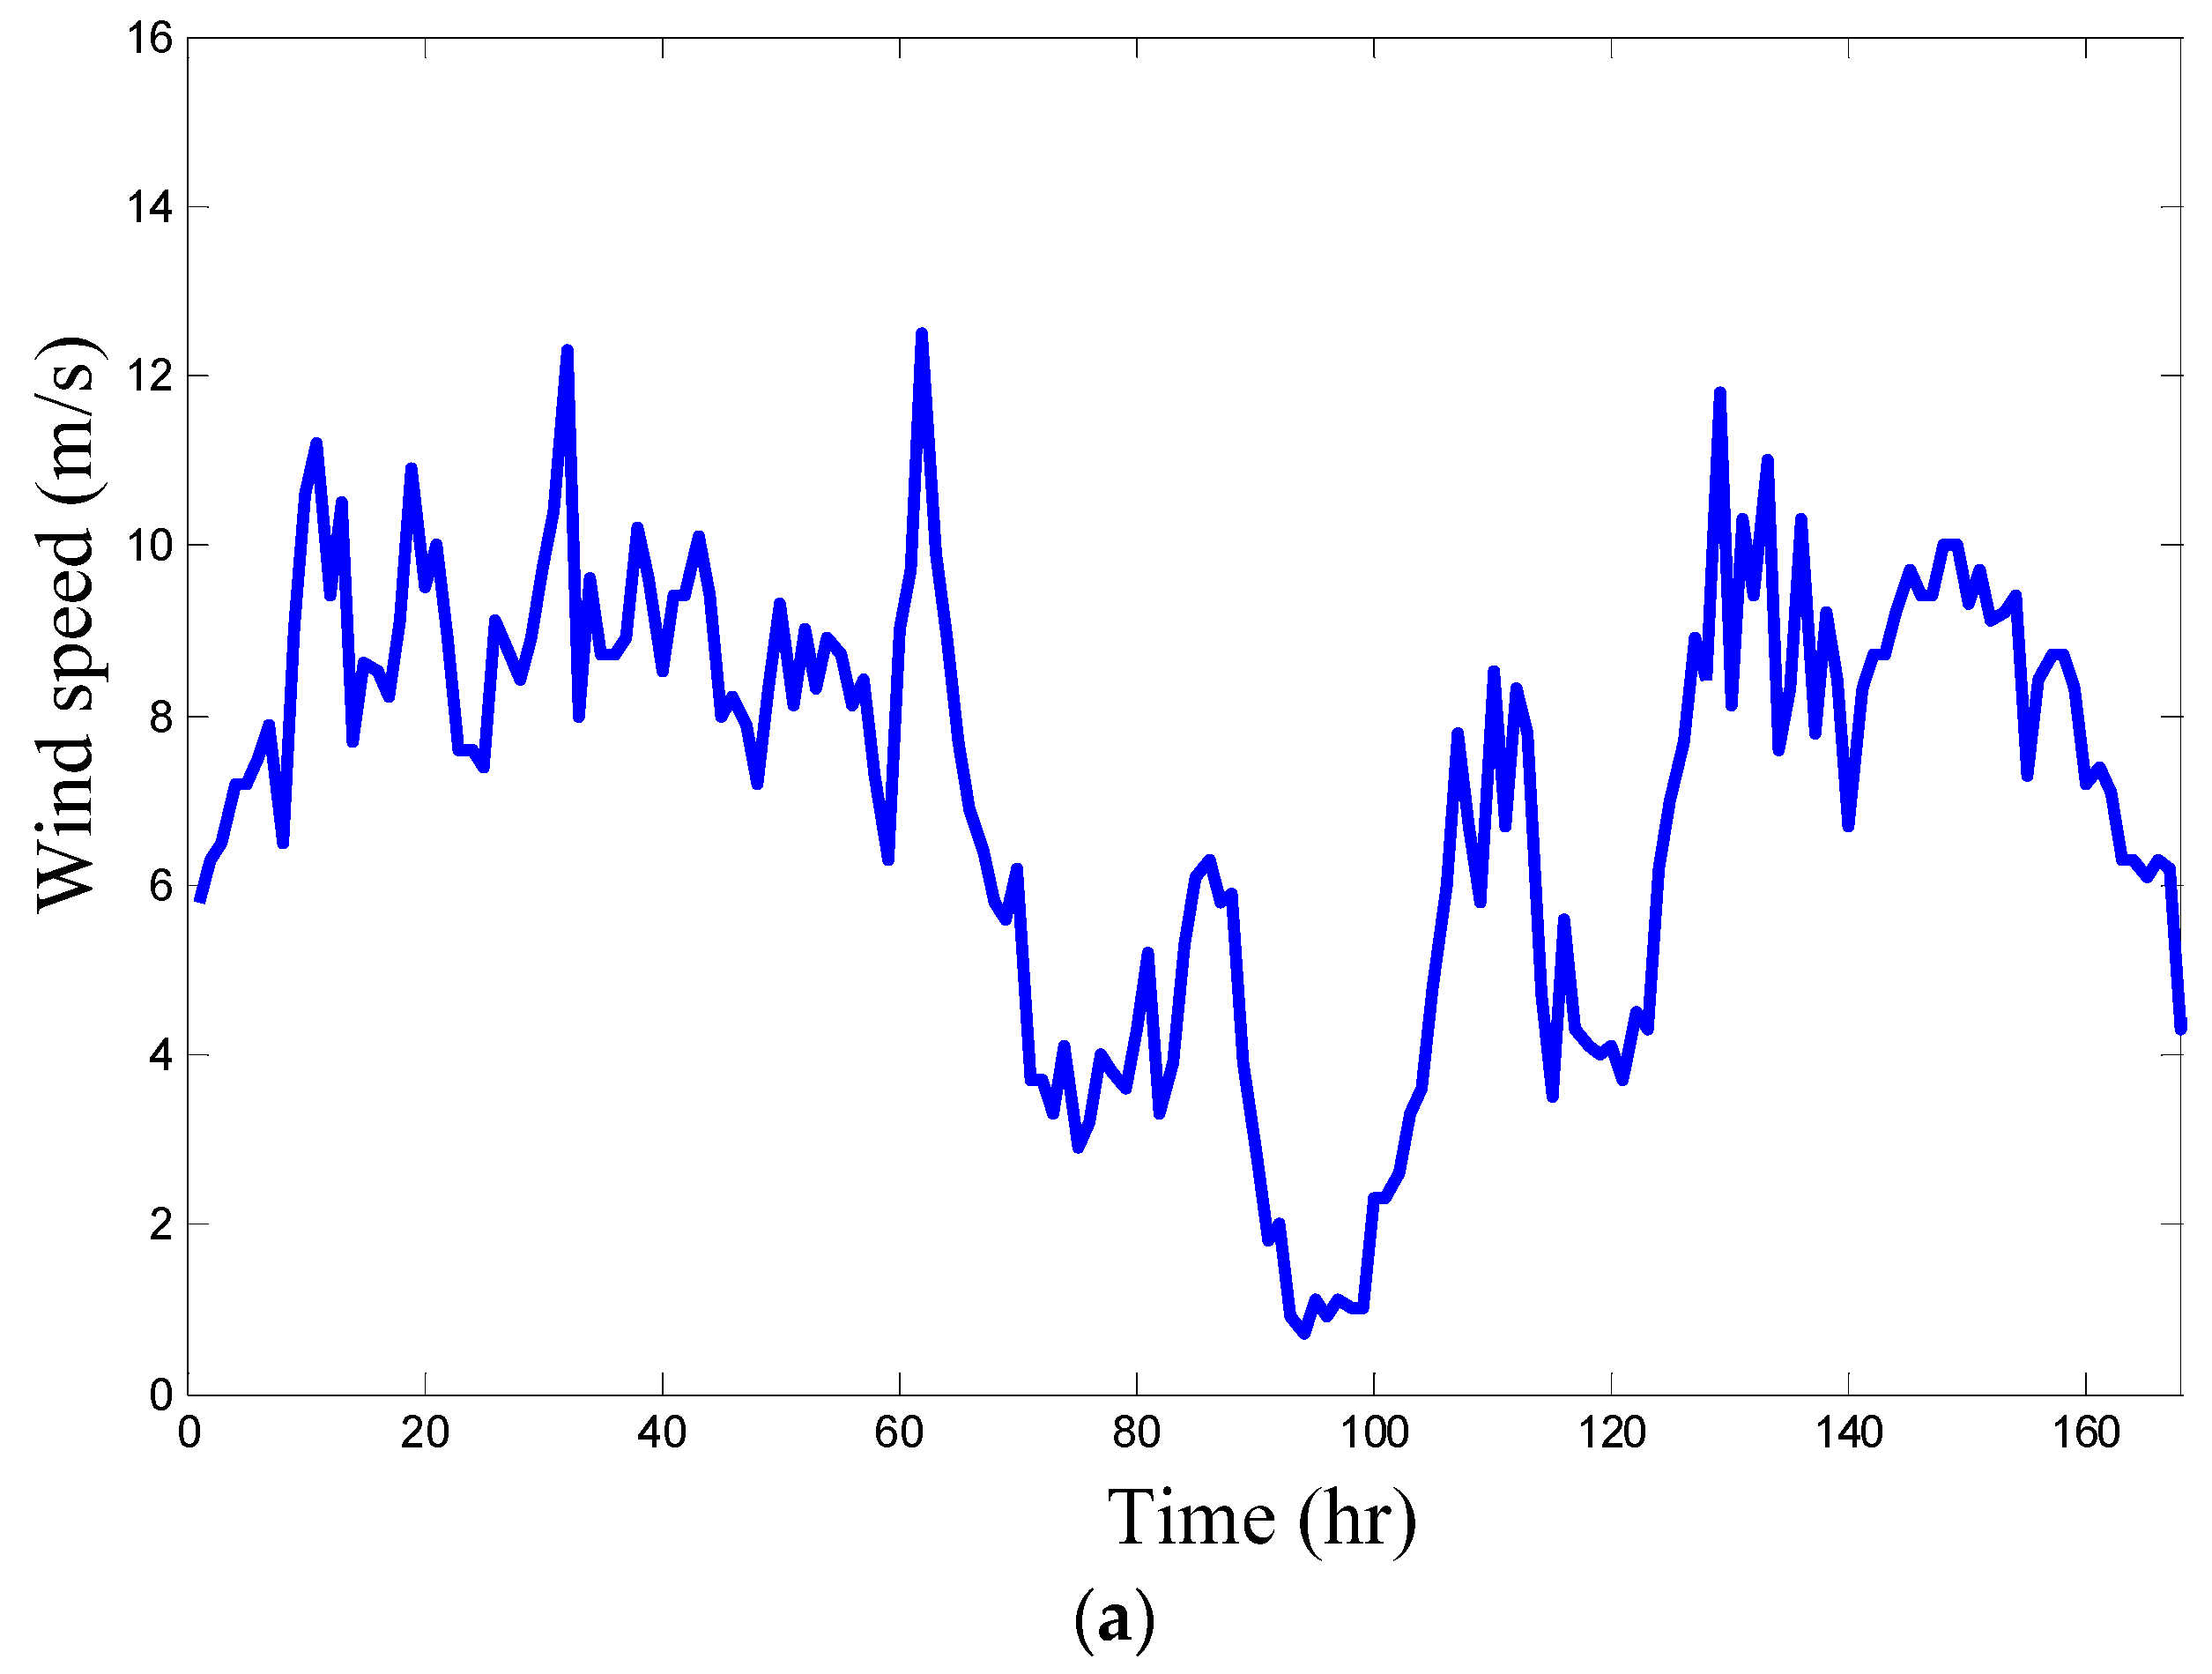
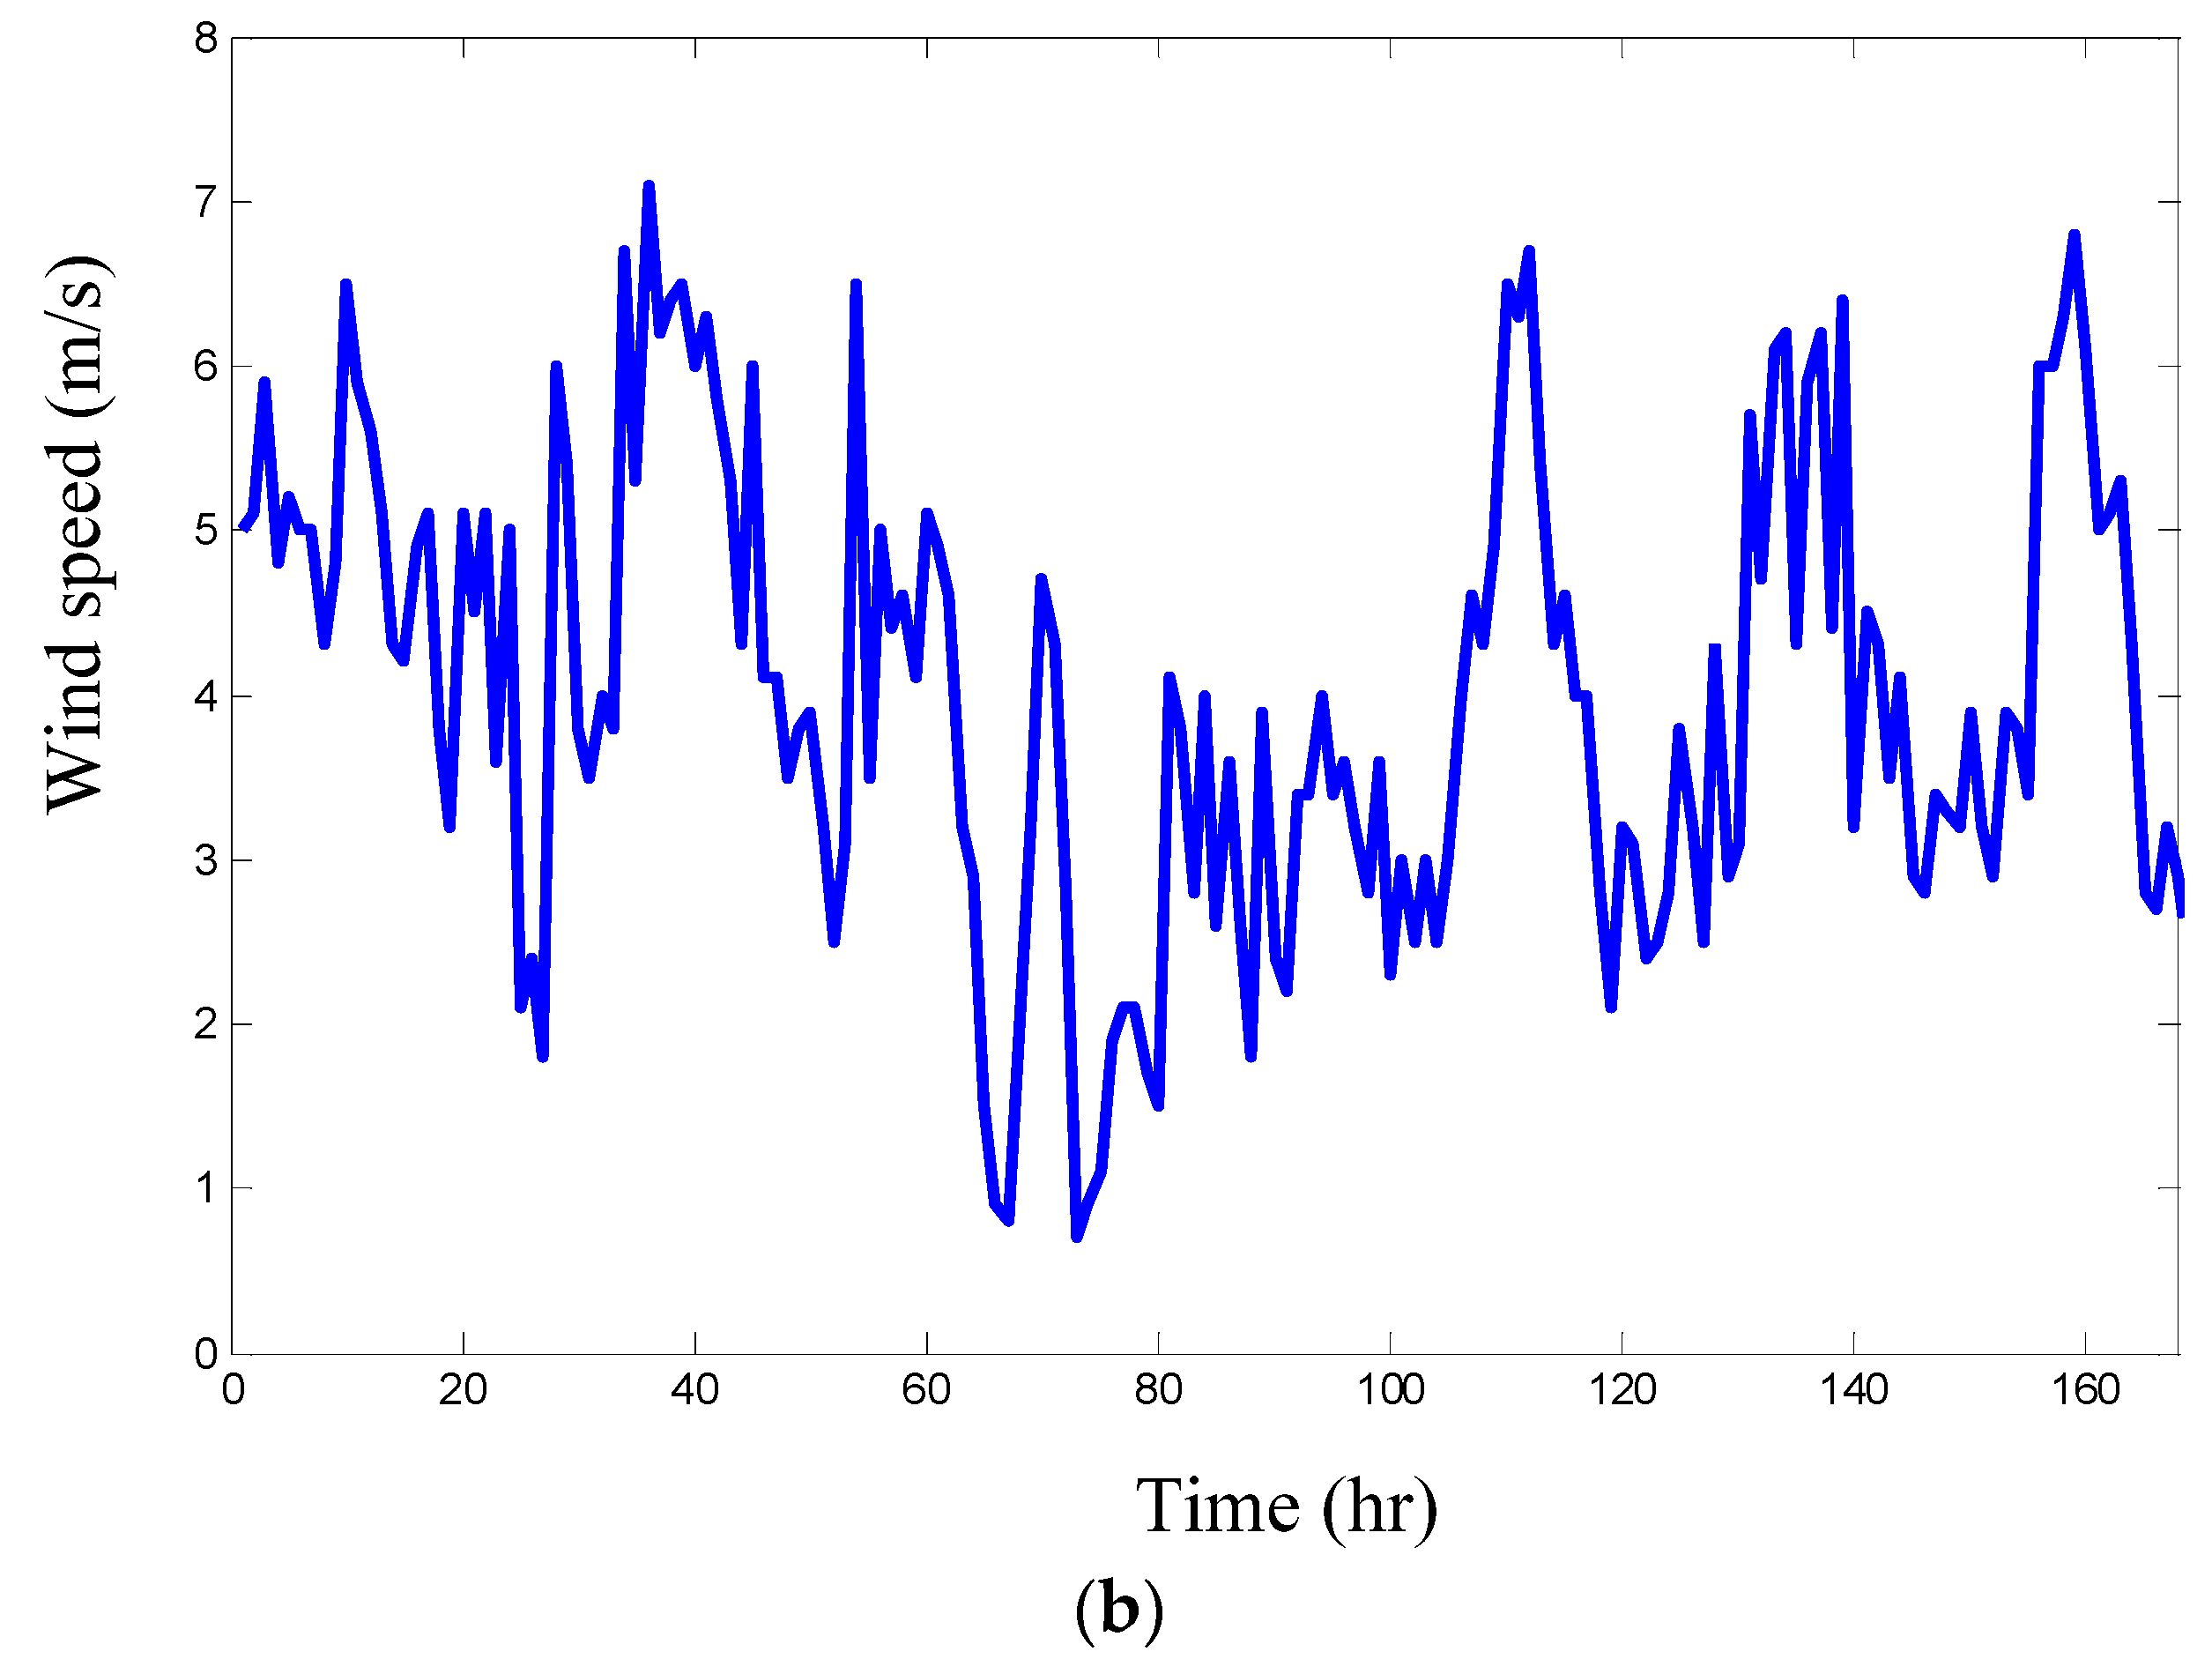
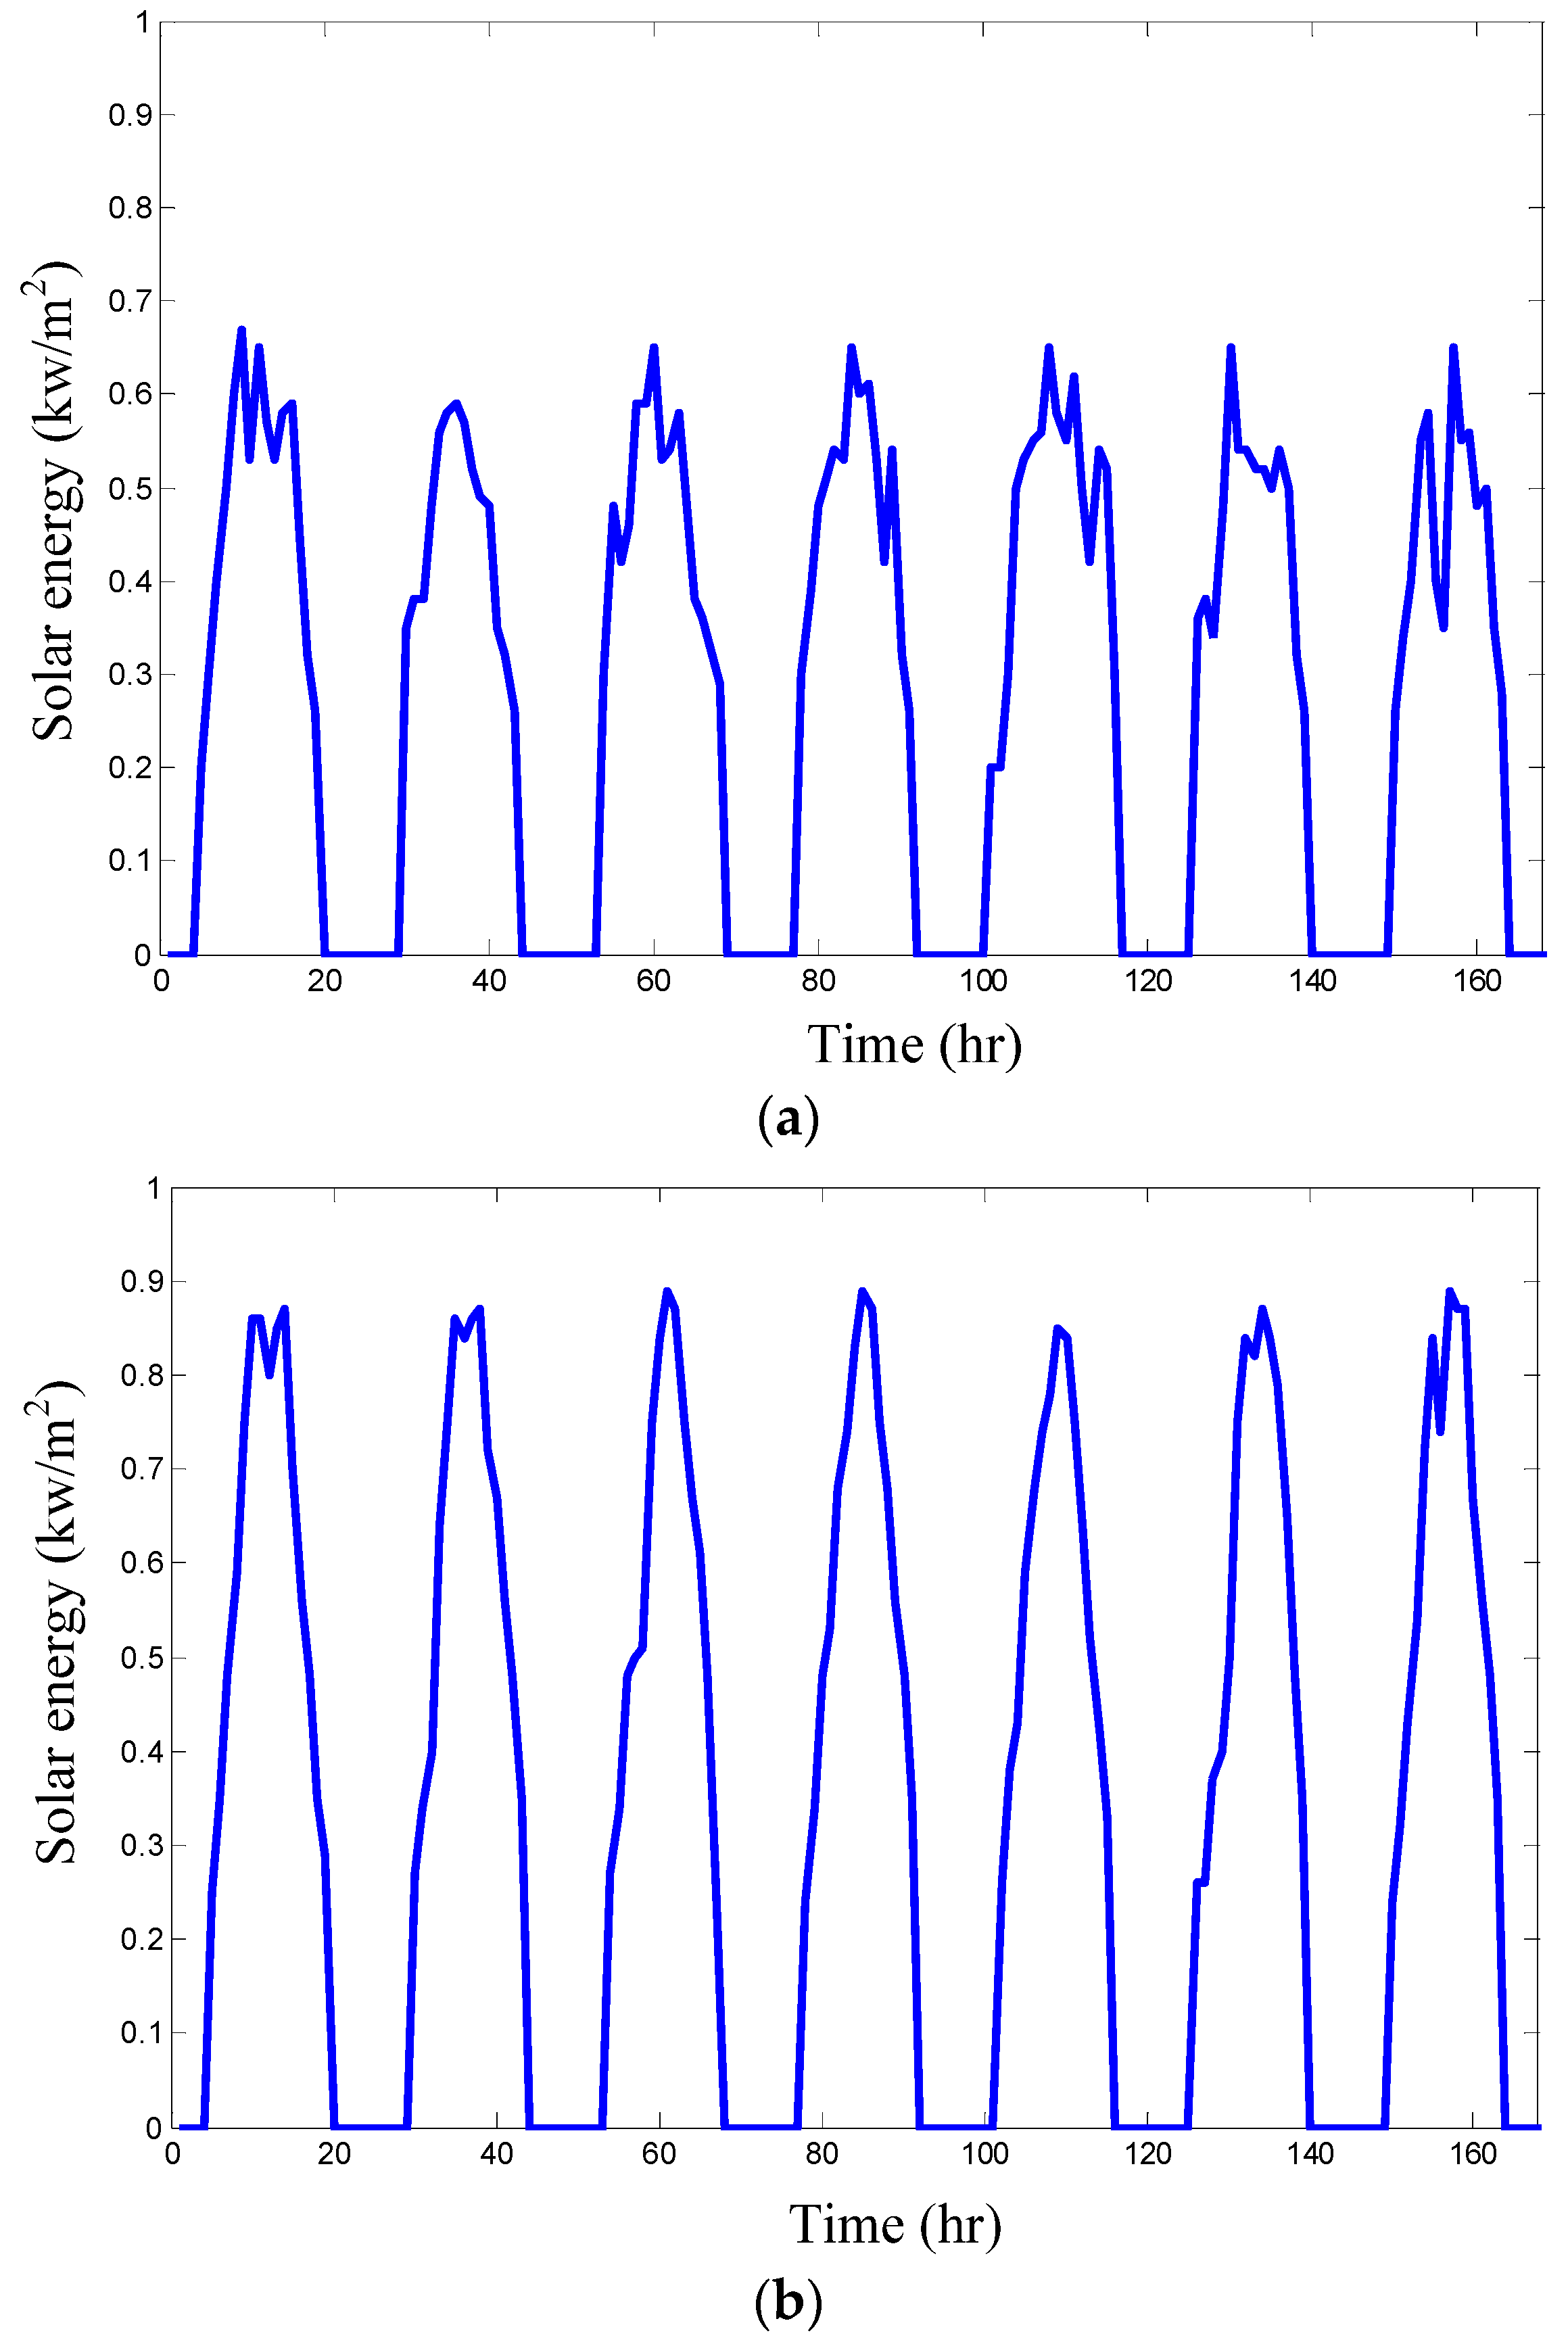
This study’s simulation adopts the weather data of the Wuci area in central Taiwan in 2014, provided by Taiwan Central Weather Bureau, to compare the wind speed and the illumination of the winter and summer, as shown in Figure 6 and 
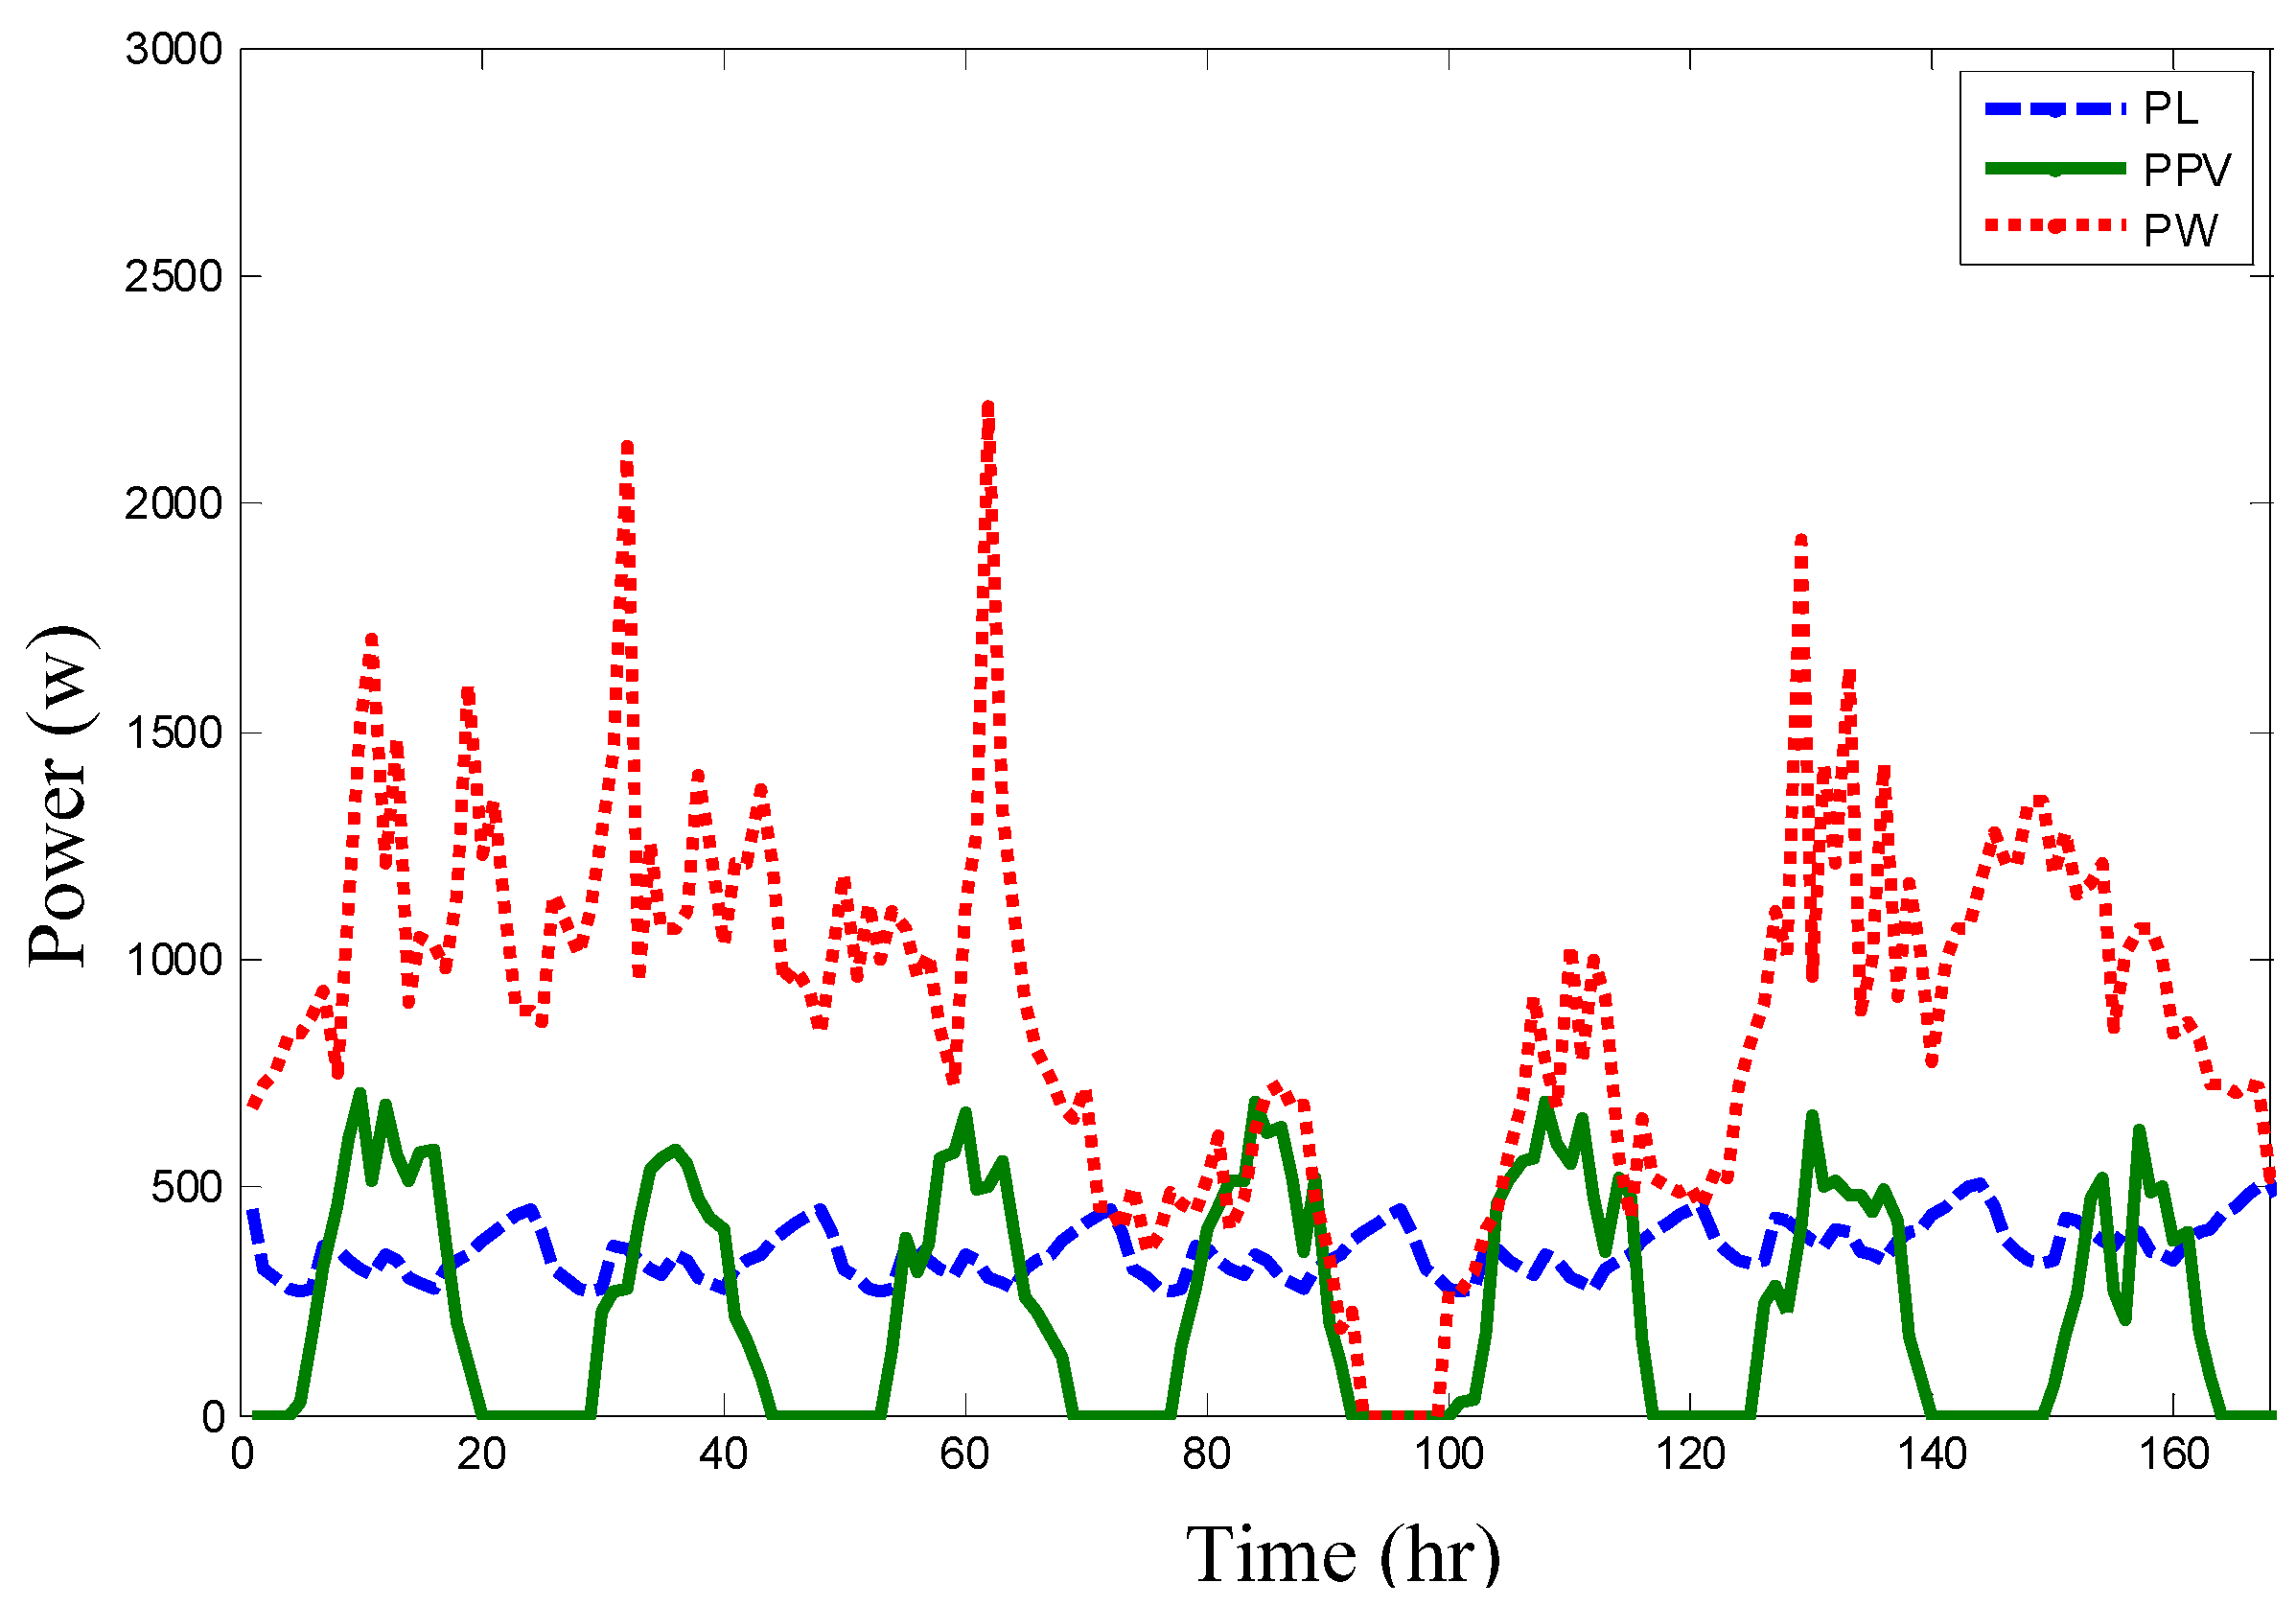
Figure 7. The sun radiates directly on the Southern Hemisphere, and the illumination is small and the wind power is strong in Taiwan. The load power (PL), wind (pw) power and PV power (PPV) of the calculated optimum allocation are shown in 
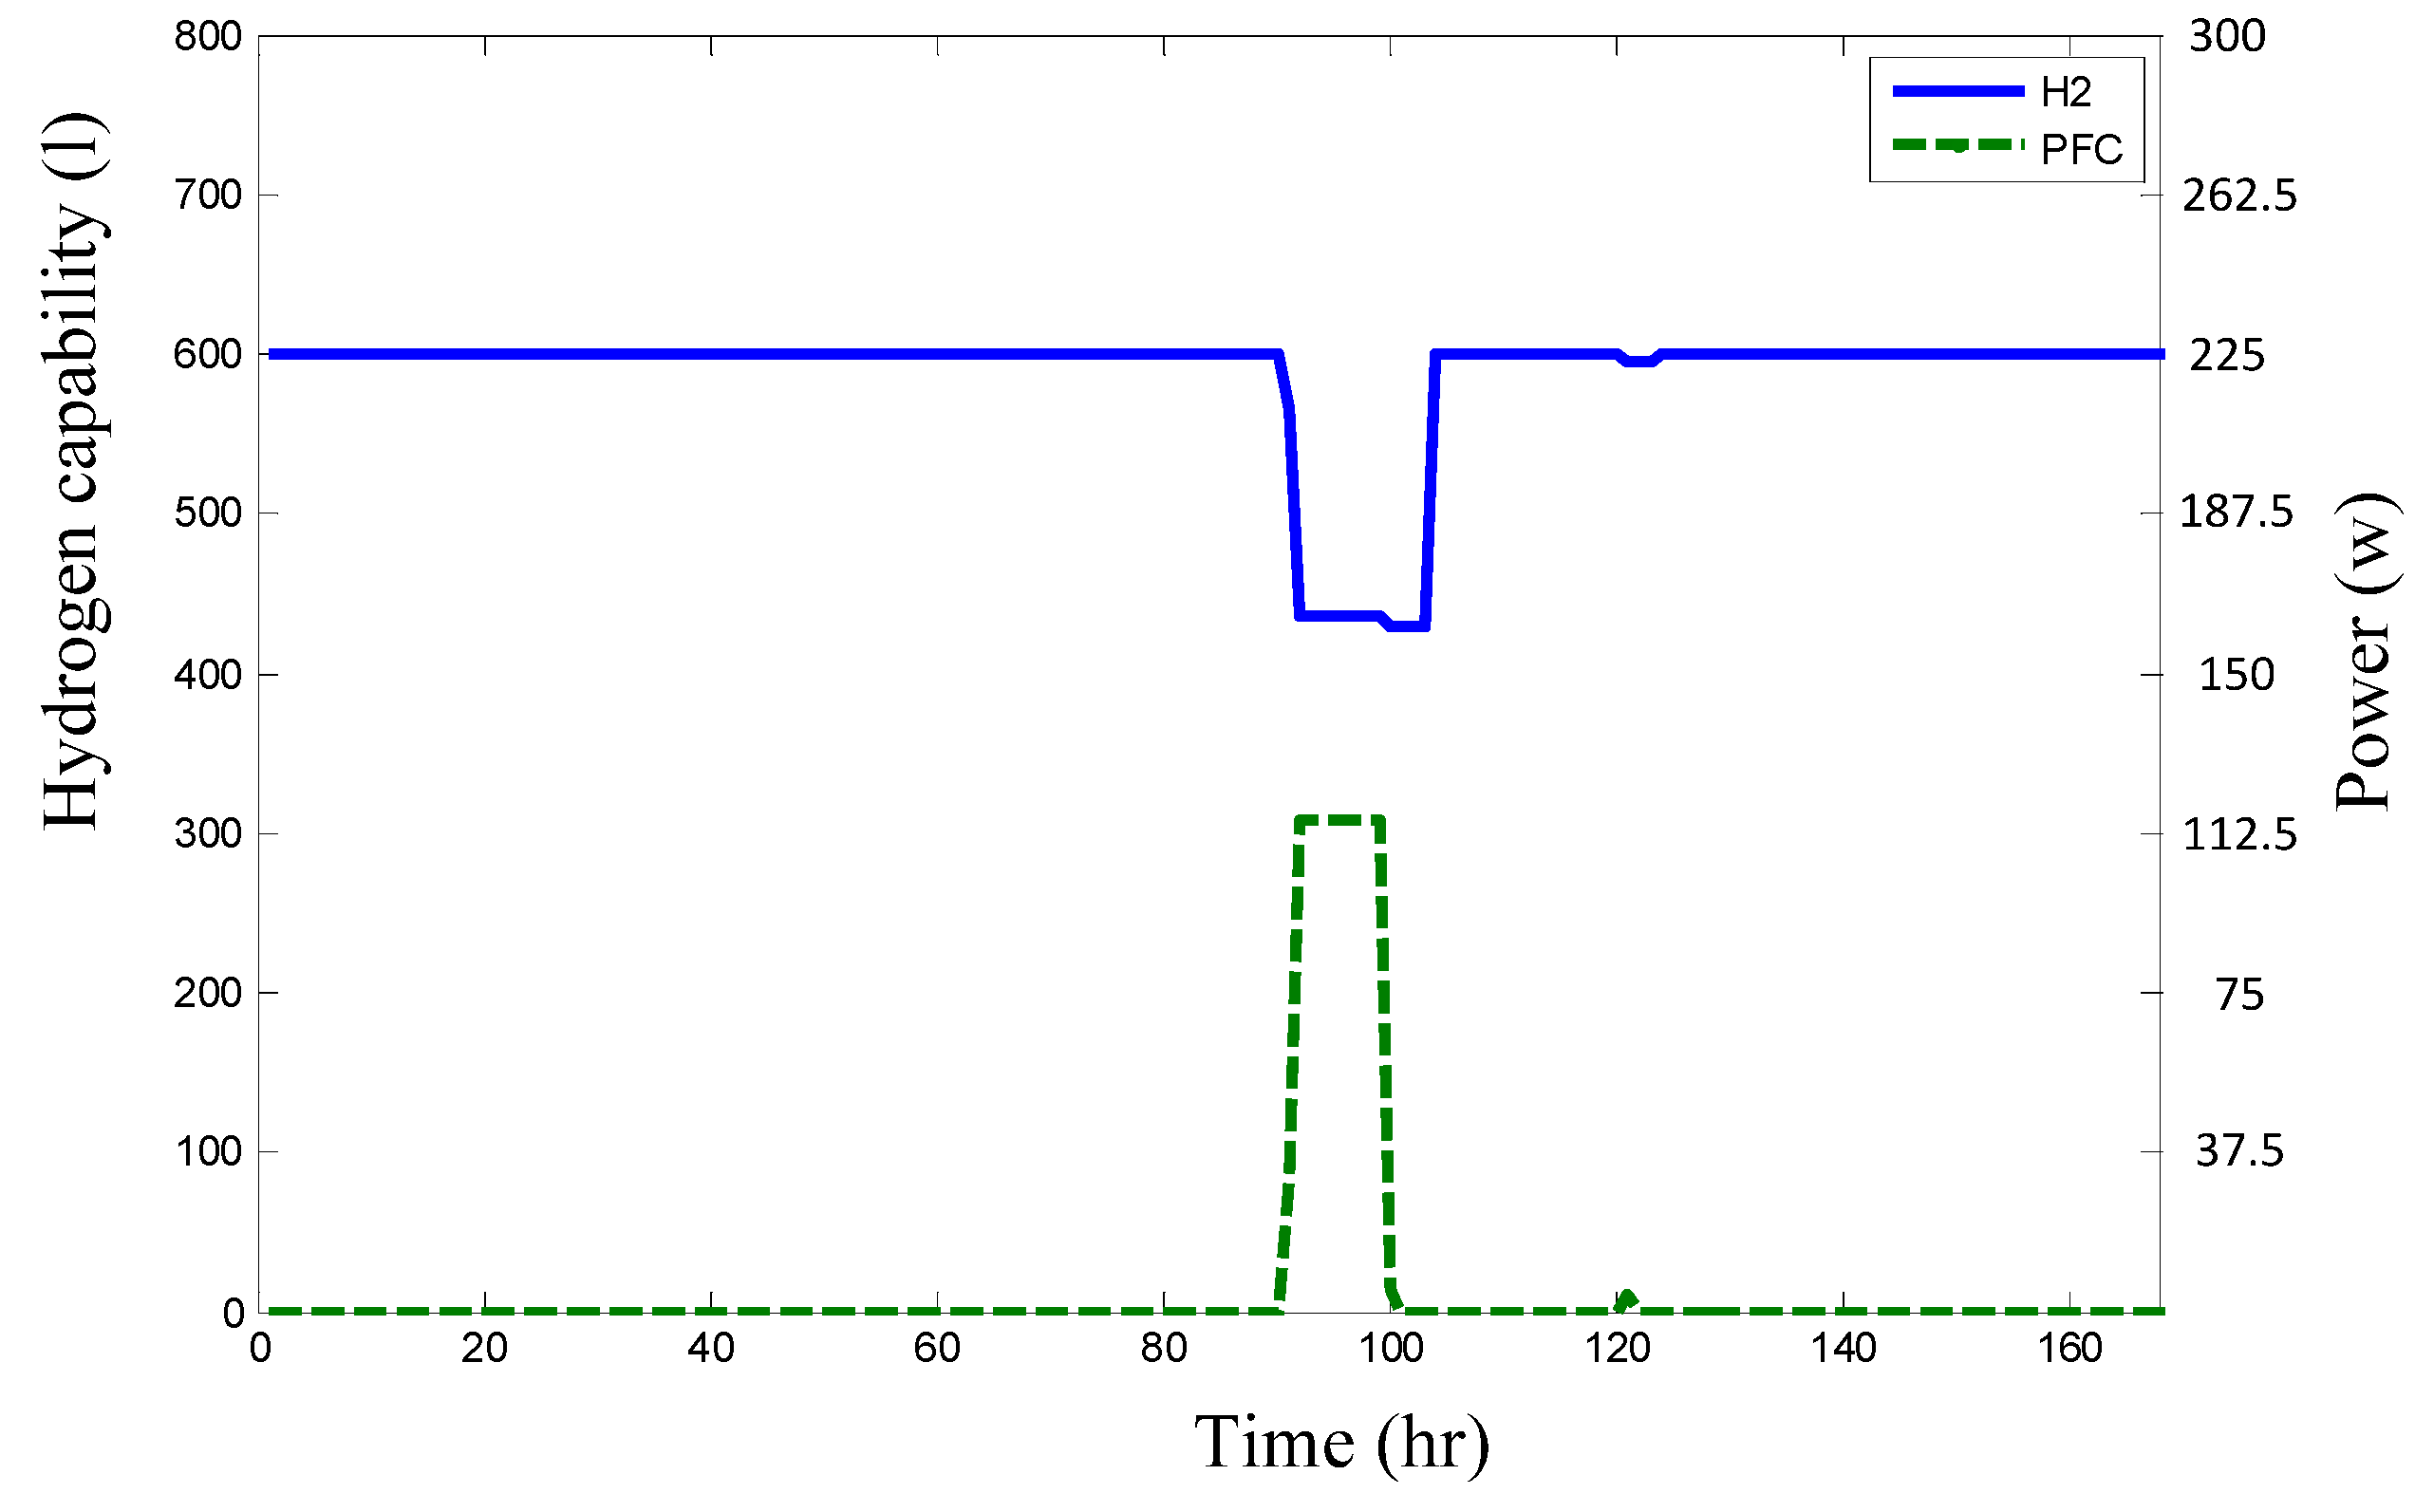
Figure 8. If the amount is less than the generating capacity load, fuel cells will supply the load power, as shown in 
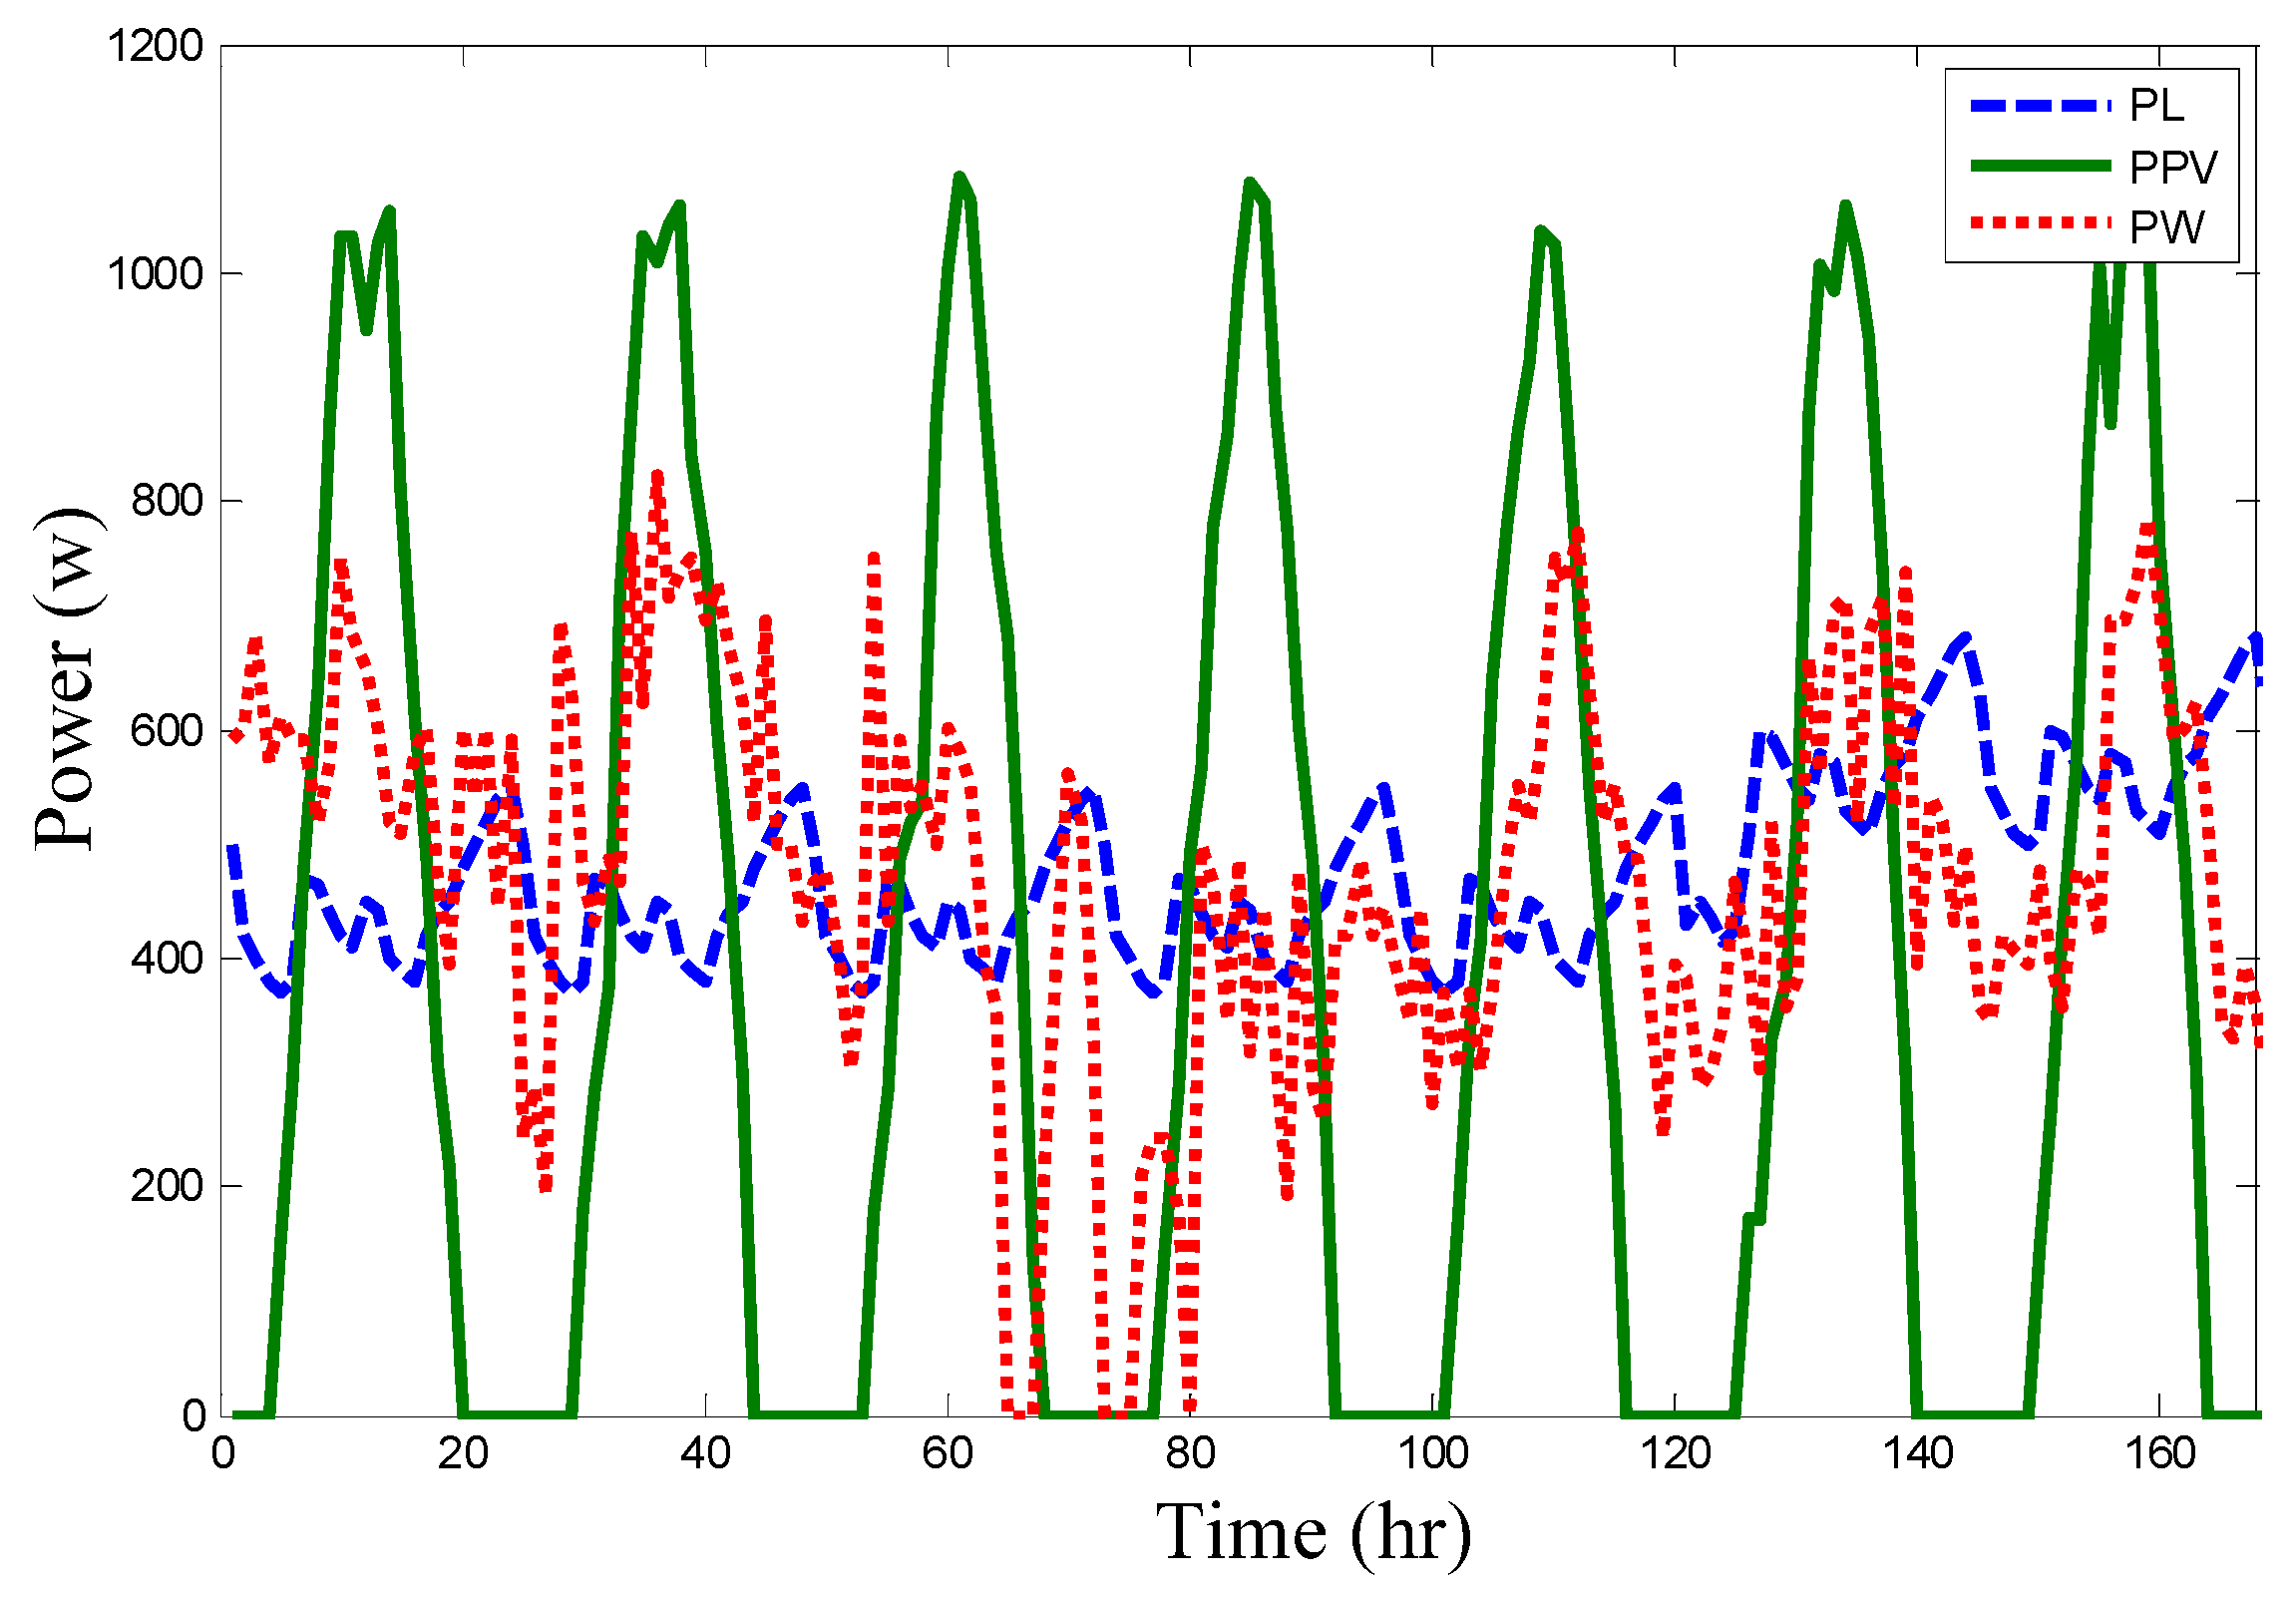
Figure 9. In summer, the load power (PL), wind (pw) power and PV power (PPV) of the calculated optimum allocation are also shown in 
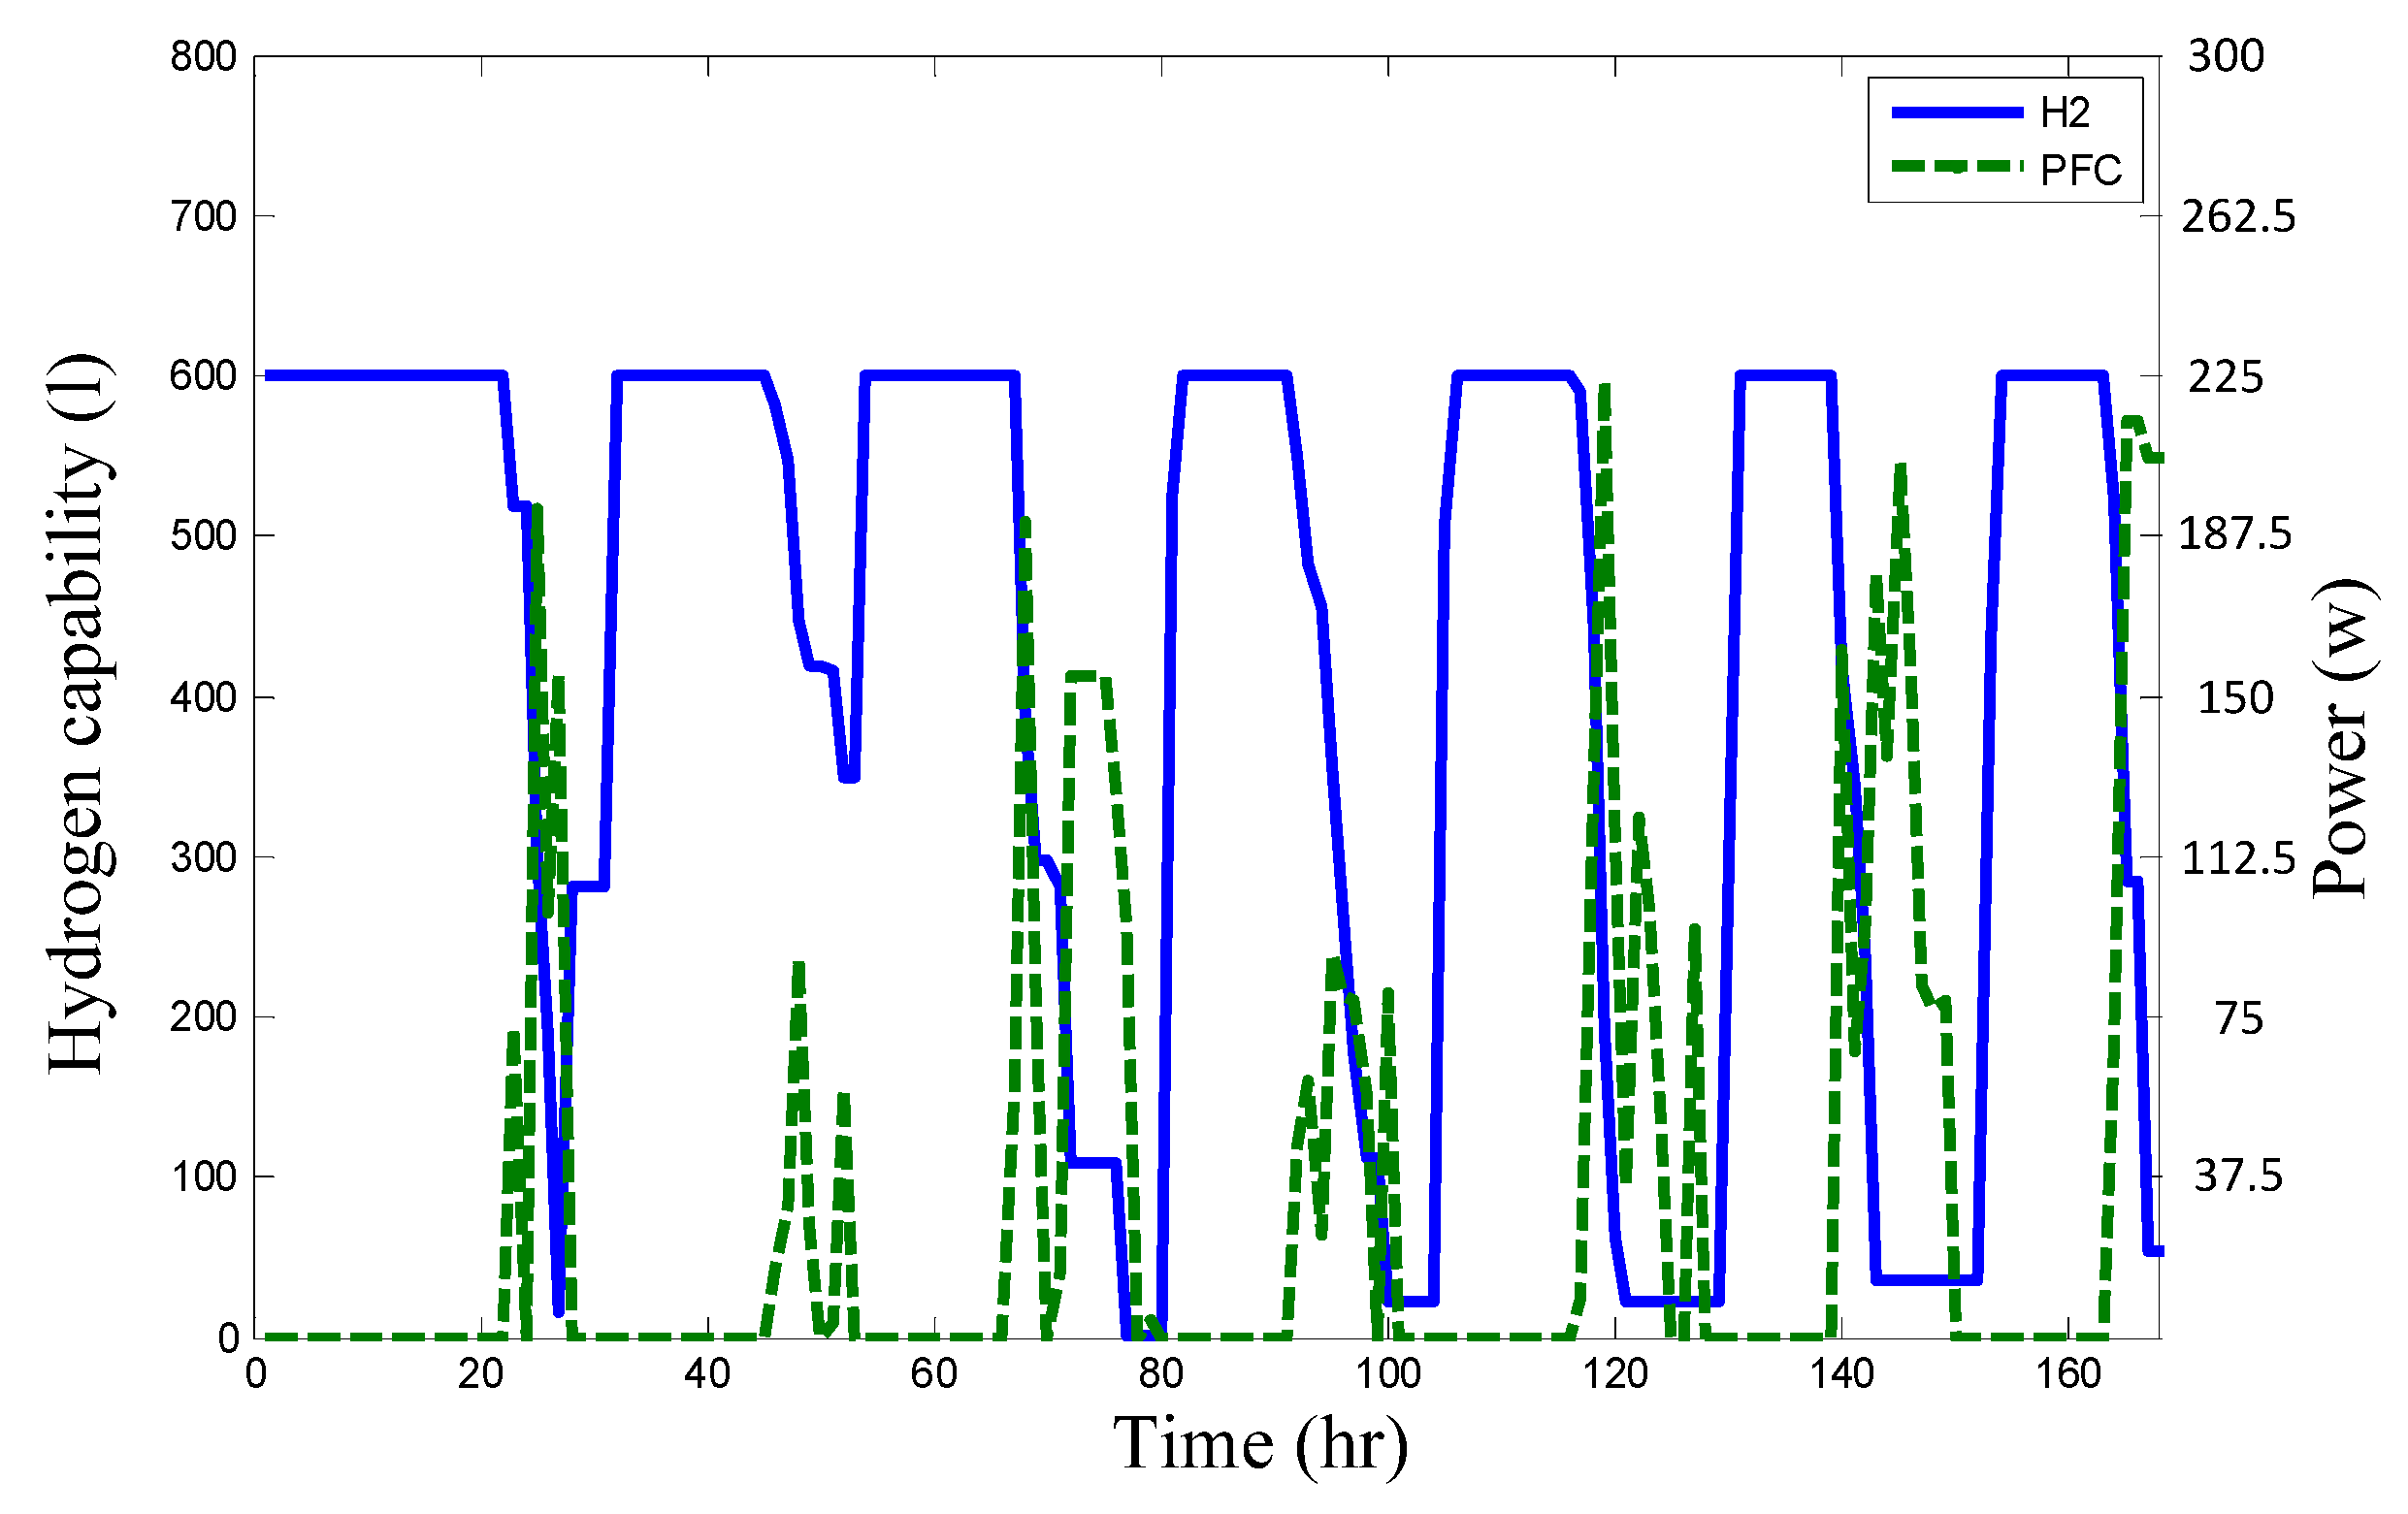
Figure 10. If the amount is less than the generating capacity load, fuel cells power will be used to supply the load, as shown in 
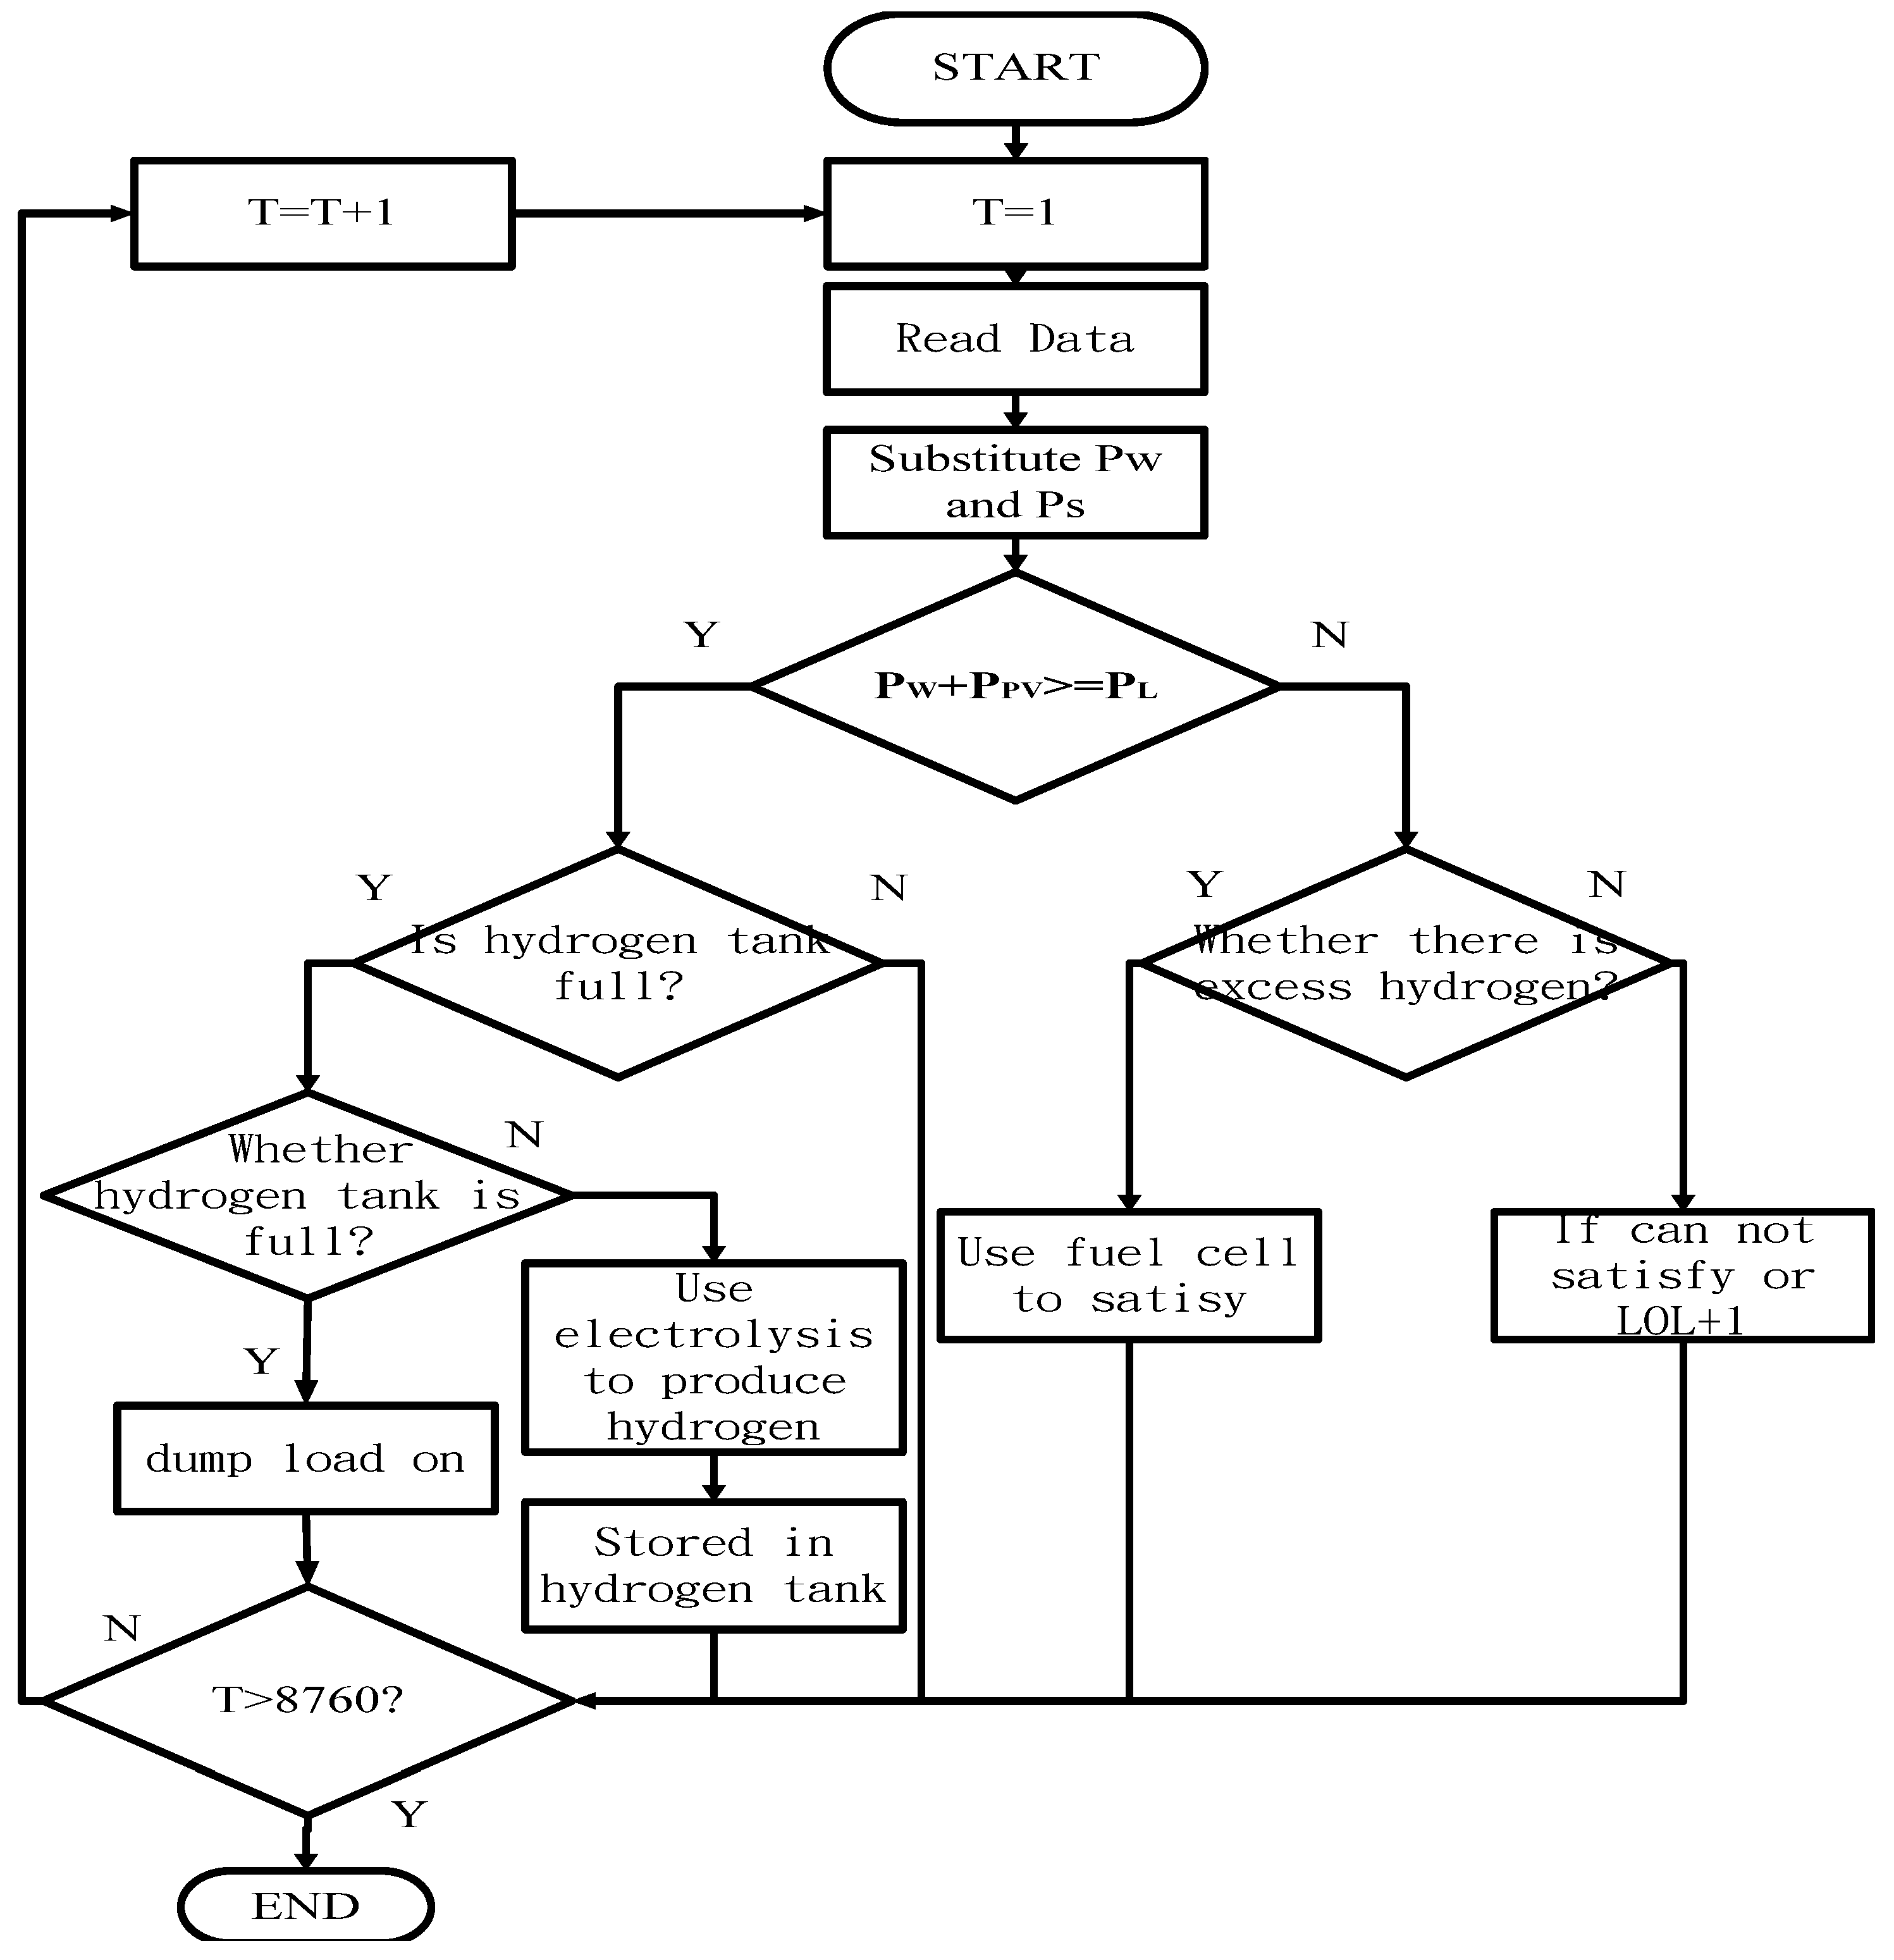
Figure 11. In summer, the sun directly radiates on the Northern Hemisphere, the PV power increases in energy. However, there are usually windless situations in the summer, and the operation of the wind power generator is suspended during typhoon season, thus wind power generation shall decrease. Generally, during the daytime, solar energy is abundant and the use of the fuel cells is not required, and the system is able to produce hydrogen for extra needs. At night, there is no illumination, and only wind power generation provides energy. The fuel cells shall use the hydrogen to support the load. At night, in addition the home electricity usage increases, therefore, in the stand-alone power system, the fuel cell does not need much generating capacity, but needs more hydrogen tanks for standby to supplement the load demand.
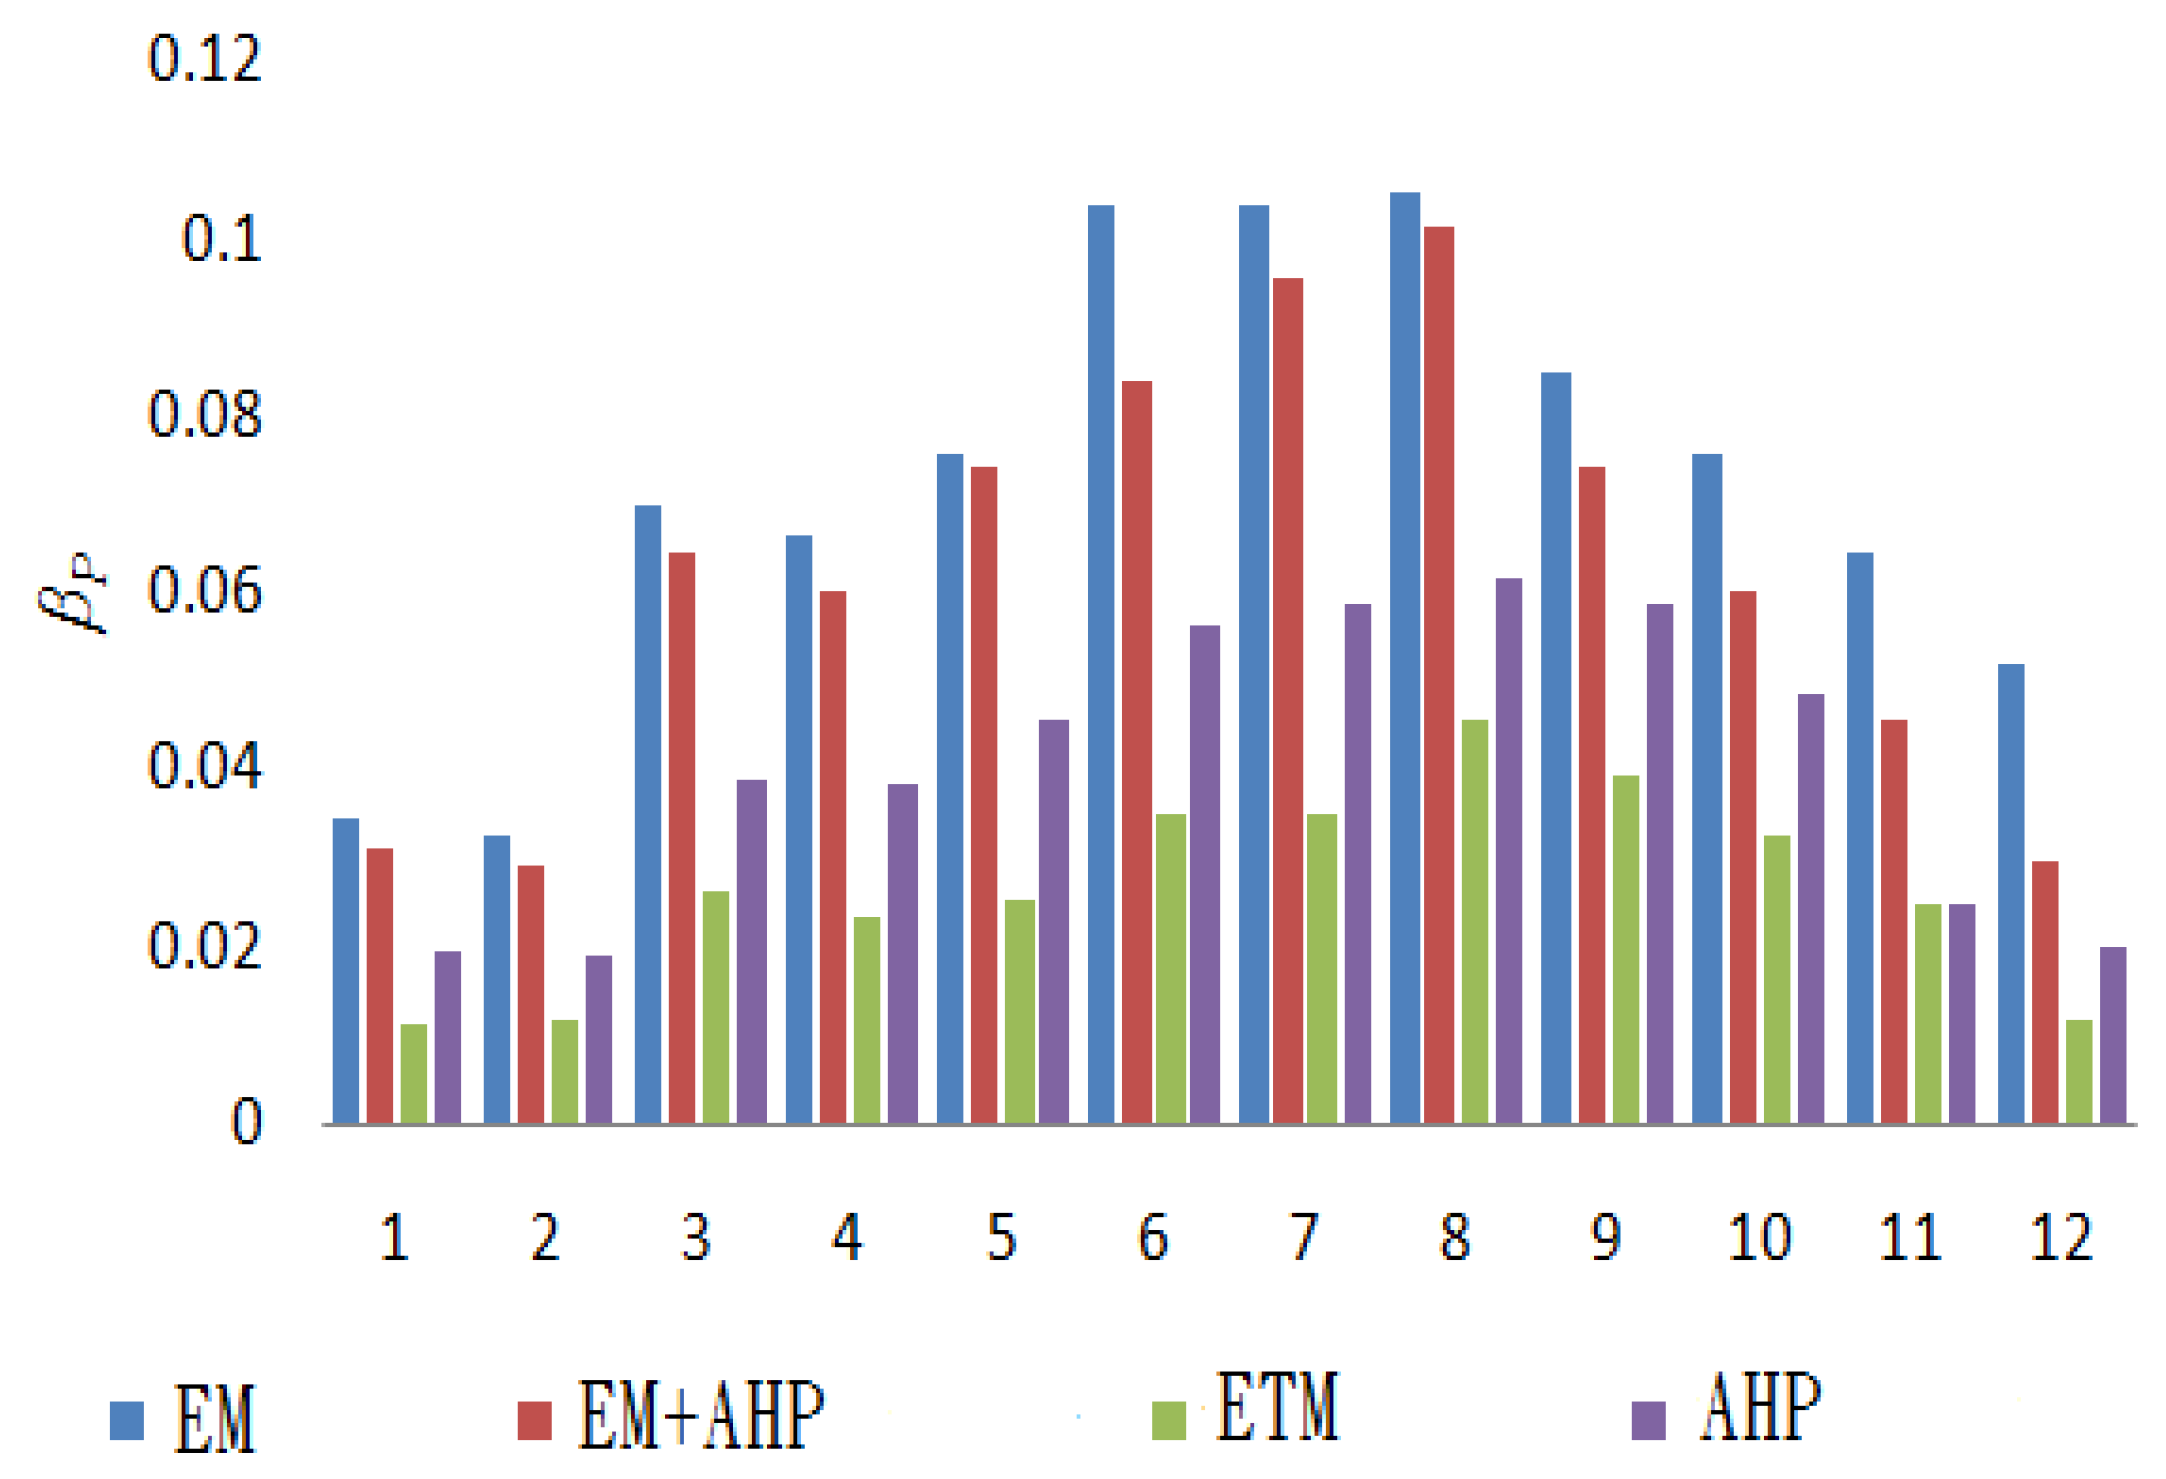
The optimum allocation into the weekly and monthly average data shall be simulated to compare the probability of shortage allocated for the four types of algorithms, as shown in Figure 12.
The extension hierarchical method firstly adopts the extension classical domain and neighborhood domain, taking the matter-element to be measured to calculate the correlation function and extension distance, and forming the contrast matrix by the empirical law to establish hierarchical analysis method to conform to the requirement of consistency and gain weight. Comparing AHP and the Extension Taguchi Method (ETM), although the power shortage hours of AHP are good, the allocation of the ETM is better than with other optimum methods.

5. Conclusions

This study aims to compare the performance of the extension theory, extension AHP theory, ETM and Analytic Hierarchy Process (AHP) in determining the optimized capacity allocation of stand-alone power systems based on calculating the power shortage probability and construction cost. Through the experiments setting of orthogonal array, ETM is used to significantly reduce the number of experiments to efficiently verify the best factor combination for the capacity allocation. Results show that the ETM’s allocation parameters are the best among all models, and the conclusion of this paper are as follows:
(1)
This paper proposes an optimum capability planning combining the extension theories and Taguchi method to solve the SAPS optimum problem; the proposed model reaches the optimal solution efficiently.
(2)
The proposed ETM needs to firstly specify the level and design factor. To guarantee the experimental results, the domain knowledge and expert experience are required when setting the design factors and their levels.
(3)
Since the specifications of commercial equipment are pre-specified, the optimum system allocation can be practically achieved by using the proposed ETM.
(4)
With fast computation speed, the proposed ETM can be easily applied to mathematical models with complicated objective functions and power systems, and the generated results could be directly implemented on practical equipment without further experimental adjustments.

Acknowledgments

This work was supported in part by the Ministry of Science and Technology, Taiwan. Under the grant no: 104-2623-E-167-001-ET.

Author Contributions

Meng-Hui Wang conceived and designed the experiments; Mei-Ling Huang wrote the papper; Zi-Yi Zhan analyzed the data; Chong-Jie Huang performed the experiments.

Conflicts of Interest

The authors declare no conflict of interest.

References

  1. Karki, R.; Billinton, R. Considering renewable energy in small isolated power system expansion. In Proceedings of the 2003 Canadian Conference on Electrical and Computer Engineering, Montreal, QC, Canada, 4–7 May 2003; pp. 367–370.
  2. Ai, B.; Yang, H.; Shen, H.; Liao, X. Computer-aided design of PV/wind hybrid system. IEEE Photovolt. Energy Convers. 2003, 3, 2411–2414. [Google Scholar] [CrossRef]
  3. Chen, H.C.; Bai, W.X. Dynamic modeling and simulation of renewable energy based hybrid power generation systems. In Proceedings of the 8th Intelligent Living Technology Conference, Taichung, Taiwan, 7 June 2013; pp. 1048–1055.
  4. Hiyama, T.; Kouzuma, S.; Imakubo, T.; Ortmeyer, T.H. Evaluation of neural network based real time maximum power tracking controller for PV system. IEEE Trans. Energy Conv. 1995, 10, 543–548. [Google Scholar] [CrossRef]
  5. Li, F.T.; Chao, Q.; Dai, X.J. The research of wind power optimal capacity configuration in hydraulic power system. In Proceedings of the Third International Conference on Electric Utility Deregulation and Restructuring and Power Technologies, Nanjing, China, 6–9 April 2008; pp. 2569–2574.
  6. Chandel, S.S.; Ramasamy, P.; Murthy, K.S.R. Wind power potential evaluation of 12 locations in western Himalayan region of India. Renew. Sustain. Energy Rev. 2014, 39, 530–545. [Google Scholar]
  7. Nelson, D.B.; Nehrir, M.H.; Wang, C. Unit sizing and cost analysis of stand-alone hybrid wind/PV/fuel cell power generation systems. Renew Energy 2006, 31, 1641–1656. [Google Scholar] [CrossRef]
  8. Ekren, O.; Ekren, B.Y. Size optimization of a PV/wind hybrid energy conversion system with battery storage using simulated annealing. Appl. Energy 2010, 87, 592–598. [Google Scholar] [CrossRef]
  9. Yang, H.X.; Zhou, W.; Lu, L.; Fang, Z.H. Optimal sizing method for stand-alone hybrid solar-wind system with LPSP technology by using genetic algorithm. Sol. Energy 2008, 82, 354–367. [Google Scholar] [CrossRef]
  10. HOMER ENERGY. Available online: http://www.homerenergy.com (accessed on 4 March 2016).
  11. IHoGA (Improved Hybrid Optimization by Genetic Algorithms). Available online: http://personal.unizar.es/rdufo/index.php?option=com_weblinks&view=category&id=9&Itemid=119&lang=en (accessed on 7 March 2016).
  12. Taguchi, G.; Elsayed, E.A.; Hsiang, T.C. Quality Engineering in Production Systems; McGraw-Hill Book Co.: New York, NY, USA, 1989; pp. 1–10. [Google Scholar]
  13. Small wind turbines, 1–6 kW. Greenspec. Available online: http://www.greenspec.co.uk/building-design/small-wind-turbines/ (accessed on 4 March 2016).
  14. Borowy, B.S.; Salameh, Z.M. Optimum Photovoltaic Array Size for a Hybrid Wind/PV System. IEEE Trans. Energy Conv. 1994, 9, 482–488. [Google Scholar] [CrossRef]
  15. Steiner, N.Y.; Mocoteguya, P.; Candussoc, D.; Hissel, D.; Hernandez, A.; Aslanides, A. A review on PEM voltage degradation associated with water management: Impacts, influent factors and characterization. J. Power Sources 2008, 183, 260–274. [Google Scholar] [CrossRef]
  16. Lingfeng, W.; Singh, C. Compromise between cost and reliability in optimum design of an autonomous hybrid power system using mixed-integer PSO algorithm. In Proceedings of the International Conference on Clean Electrical Power, Capri, Italy, 21–23 May 2007; pp. 682–689.
  17. Cai, W. The extension set and incompatibility problem. J. Sci. Explor. 1983, 1, 81–93. [Google Scholar]
  18. Dingwall, R.B. Development and product integration of a reliable optoelectronic system using Taguchi method. In Proceedings of the Annual Reliability and Maintainability Symposium, Orlando, FL, USA, 29–31 January 1991; pp. 541–546.
  19. Huang, K.H.; Shu, W.C. Multi-objective optimized design of permanent magnet motor by using the taguchi method with robust rules. In Proceedings of the 9th Intelligent Living Technology Conference (ILT2014), Taichung, Taiwan, 6 June 2014; pp. 202–205.
  20. Wang, M.H.; Chao, K.H. Application of the Extension Neural Network-Type 3 to Defect Recognition of Car Engine. ICIC Express Lett. 2012, 6, 417–423. [Google Scholar]
  21. Wang, M.H.; Huang, M.L.; Liou, K.J. Application of Extension Theory with Chaotic Signal Synchronization to Detect Islanding Effect of Photovoltaic Power System. Int. J. Photoenergy 2015, 2015. [Google Scholar] [CrossRef]
  22. Wang, M.H.; Huang, M.L.; Liou, K.J. A Novel Islanding Detection Method for Grid Connected Photovoltaic Systems. IET Renew. Power Gener. 2015, 6, 700–709. [Google Scholar] [CrossRef]
Figure 1. System architecture.
Energies 09 00174 g001
Figure 2. Operation flowchart of the proposed stand-alone power system.
Energies 09 00174 g002
Figure 3. Typical curve of a wind power system [14].
Energies 09 00174 g003
Figure 4. Characteristic curves of the tested fuel cell. (a) Characteristic curves of power-current under different humidity; (b) Characteristic curves of power-current under different hydrogen pressures; (c) Characteristic curves of power-current under different temperatures.
Energies 09 00174 g004
Figure 5. The proposed extension relation function.
Energies 09 00174 g005
Figure 6. The curves of the typical weekly wind speed (a) winter; (b) summer.
Energies 09 00174 g006aEnergies 09 00174 g006b
Figure 7. The curves of the typical solar illuminance (a) winter; (b) summer.
Energies 09 00174 g007
Figure 8. The power curves of the power system in the first week of December.
Energies 09 00174 g008
Figure 9. The curves of the hydrogen capability and fuel cell power in the first week of December.
Energies 09 00174 g009
Figure 10. The power curves of the power system in the first week of June.
Energies 09 00174 g010
Figure 11. The curves of the hydrogen capability and fuel cell power in the first week of June.
Energies 09 00174 g011
Figure 12. Annual Power Shortage Probability (LOLP).
Energies 09 00174 g012
Table 1. Cost of Each Design Factor.
Equipment NameEquipment CostUnit CapacityCost (USD)
Wnd powerCW1000 W688
PV power systemCPV230 W565
Hydrogen tankCHT40 L235
Fuel CellCFC100 W1250
ElectrolyzerCE100 W1563
Table 2. The design factors and their corresponding levels.
Design FactorsLevel 1Level 2Level 3
Wind powerQW123
PV powerQPV345
Hydrogen tankQHT101520
Fuel CellQFC345
ElectrolyzerQE234
Table 3. The orthogonal array of L18.
L18QWQPVQHTQFCQE
111111
212222
313333
421122
522233
623311
731213
832321
933132
1011332
1112113
1213221
1321231
1422312
1523123
1631323
1732131
1833212
Table 4. This research’s level and design factor table.
L18βPCost (USD)
10.3592711,609
20.3250016,162
30.2777720,715
40.2152715,110
50.1583319,663
60.1430515,777
70.1041617,286
80.0731617,150
90.0833318,174
100.3638818,022
110.3347215,300
120.2805515,164
130.1944415,972
140.1597216,775
150.1847217,803
160.0944419,711
170.0930516,050
180.0763816,853
Table 5. Comprehensive Correlative Degree.
L18Comprehensive Correlative Degree
1−0.02697
2−0.15052
3−0.74338
40.110458
5−0.39659
60.162556
70.059634
80.068294
9−0.07669
10−0.45393
11−0.45393
120.006634
130.064505
140.046478
15−0.14816
16−0.30322
170.216926
180.118986
Table 6. Optimum Parameters of the ETM.
ParameterLoadQWQPVQHTQFCQE
Level221112
Optimum quantity500 W231033

