1. Introduction
The current world energy scenario is the result of various socio-economic trends leading to an increasing demand of resources and energy consumption per capita.
Due to the above, it is necessary to develop a global energy restructuration that significantly changes the current patterns of energy generation and consumption, encouraging sustainable development.
Since the beginning of the century, there has been a discussion about the current energy mix model, based on fossil fuels, such as oil, coal and natural gas. Nowadays, the limitations of this model are unquestionable from the economic (high energy price), the social (inequality and energy poor) and the environmental (adverse implications for the environment) point of view.
In order to achieve a sustainable solution for the energy future, it is especially important to take into account renewable energies, but nuclear energy is also very important to help us satisfy the recent increase of electricity demand and, at the same time, reduce the carbon dioxide emissions.
Regarding nuclear energy, it is necessary to take into account other aspects, such as technology and nuclear proliferation, and to assess all of the nuclear fuel cycle options in order to develop a national strategy that will be economically, environmentally and socially sustainable.
Waste management has always been the key point in all discussions about nuclear energy. Therefore, it is absolutely essential to make a suitable long-term plan about how to manage the used fuel assemblies. Nowadays, there are two possible options: the open cycle, which consists of directly disposing the used nuclear fuel assemblies in a deep geological repository (DGR), and the closed cycle, in which the spent nuclear fuel is reprocessed to recover fissile and fertile materials that are recycled in order to reduce fresh fuel consumption. Both options imply that, prior to the final management of the waste product, the used fuel assemblies need to be treated and stored in an interim storage facility, and also, both of them require a deep geological repository (DGR).
Even though these are the currently available technologies, there is a future possibility that is being researched: the advanced closed cycle, in which fast reactors are introduced, whereas, at the same time, the reprocessing is improved. This also allows the multi-recycling of fissile and fertile materials and the full closure of the fuel cycle. However, a DGR is still required to manage and dispose of the residual actinides and fission products.
All of the back-end strategies require a DGR at the fuel cycle final stage. However, there are significant differences in the associated costs for each strategy, derived from two main influences: the reduction in the volume needed and the energy density. For the closed cycle, the volume required for the DGR is about 1/5 of the open cycle DGR volume, but taking into account the energy density, the DGR costs for the closed cycle represent approximately 25% of the DGR costs for the open cycle [
1].
As it is well-known [
1,
2,
3,
4,
5], one of the most important back-end costs in the closed cycle comes from reprocessing, while in the case of the open cycle, it is the DGR; ergo, both of them have advantages and disadvantages. However, looking through various comparative studies of these strategies, where the economical aspect has been analyzed, they all conclude that the cost variation between the closed and open cycle is nearly 10%, as shown in the last economic analysis carried out by Moratilla [
6].
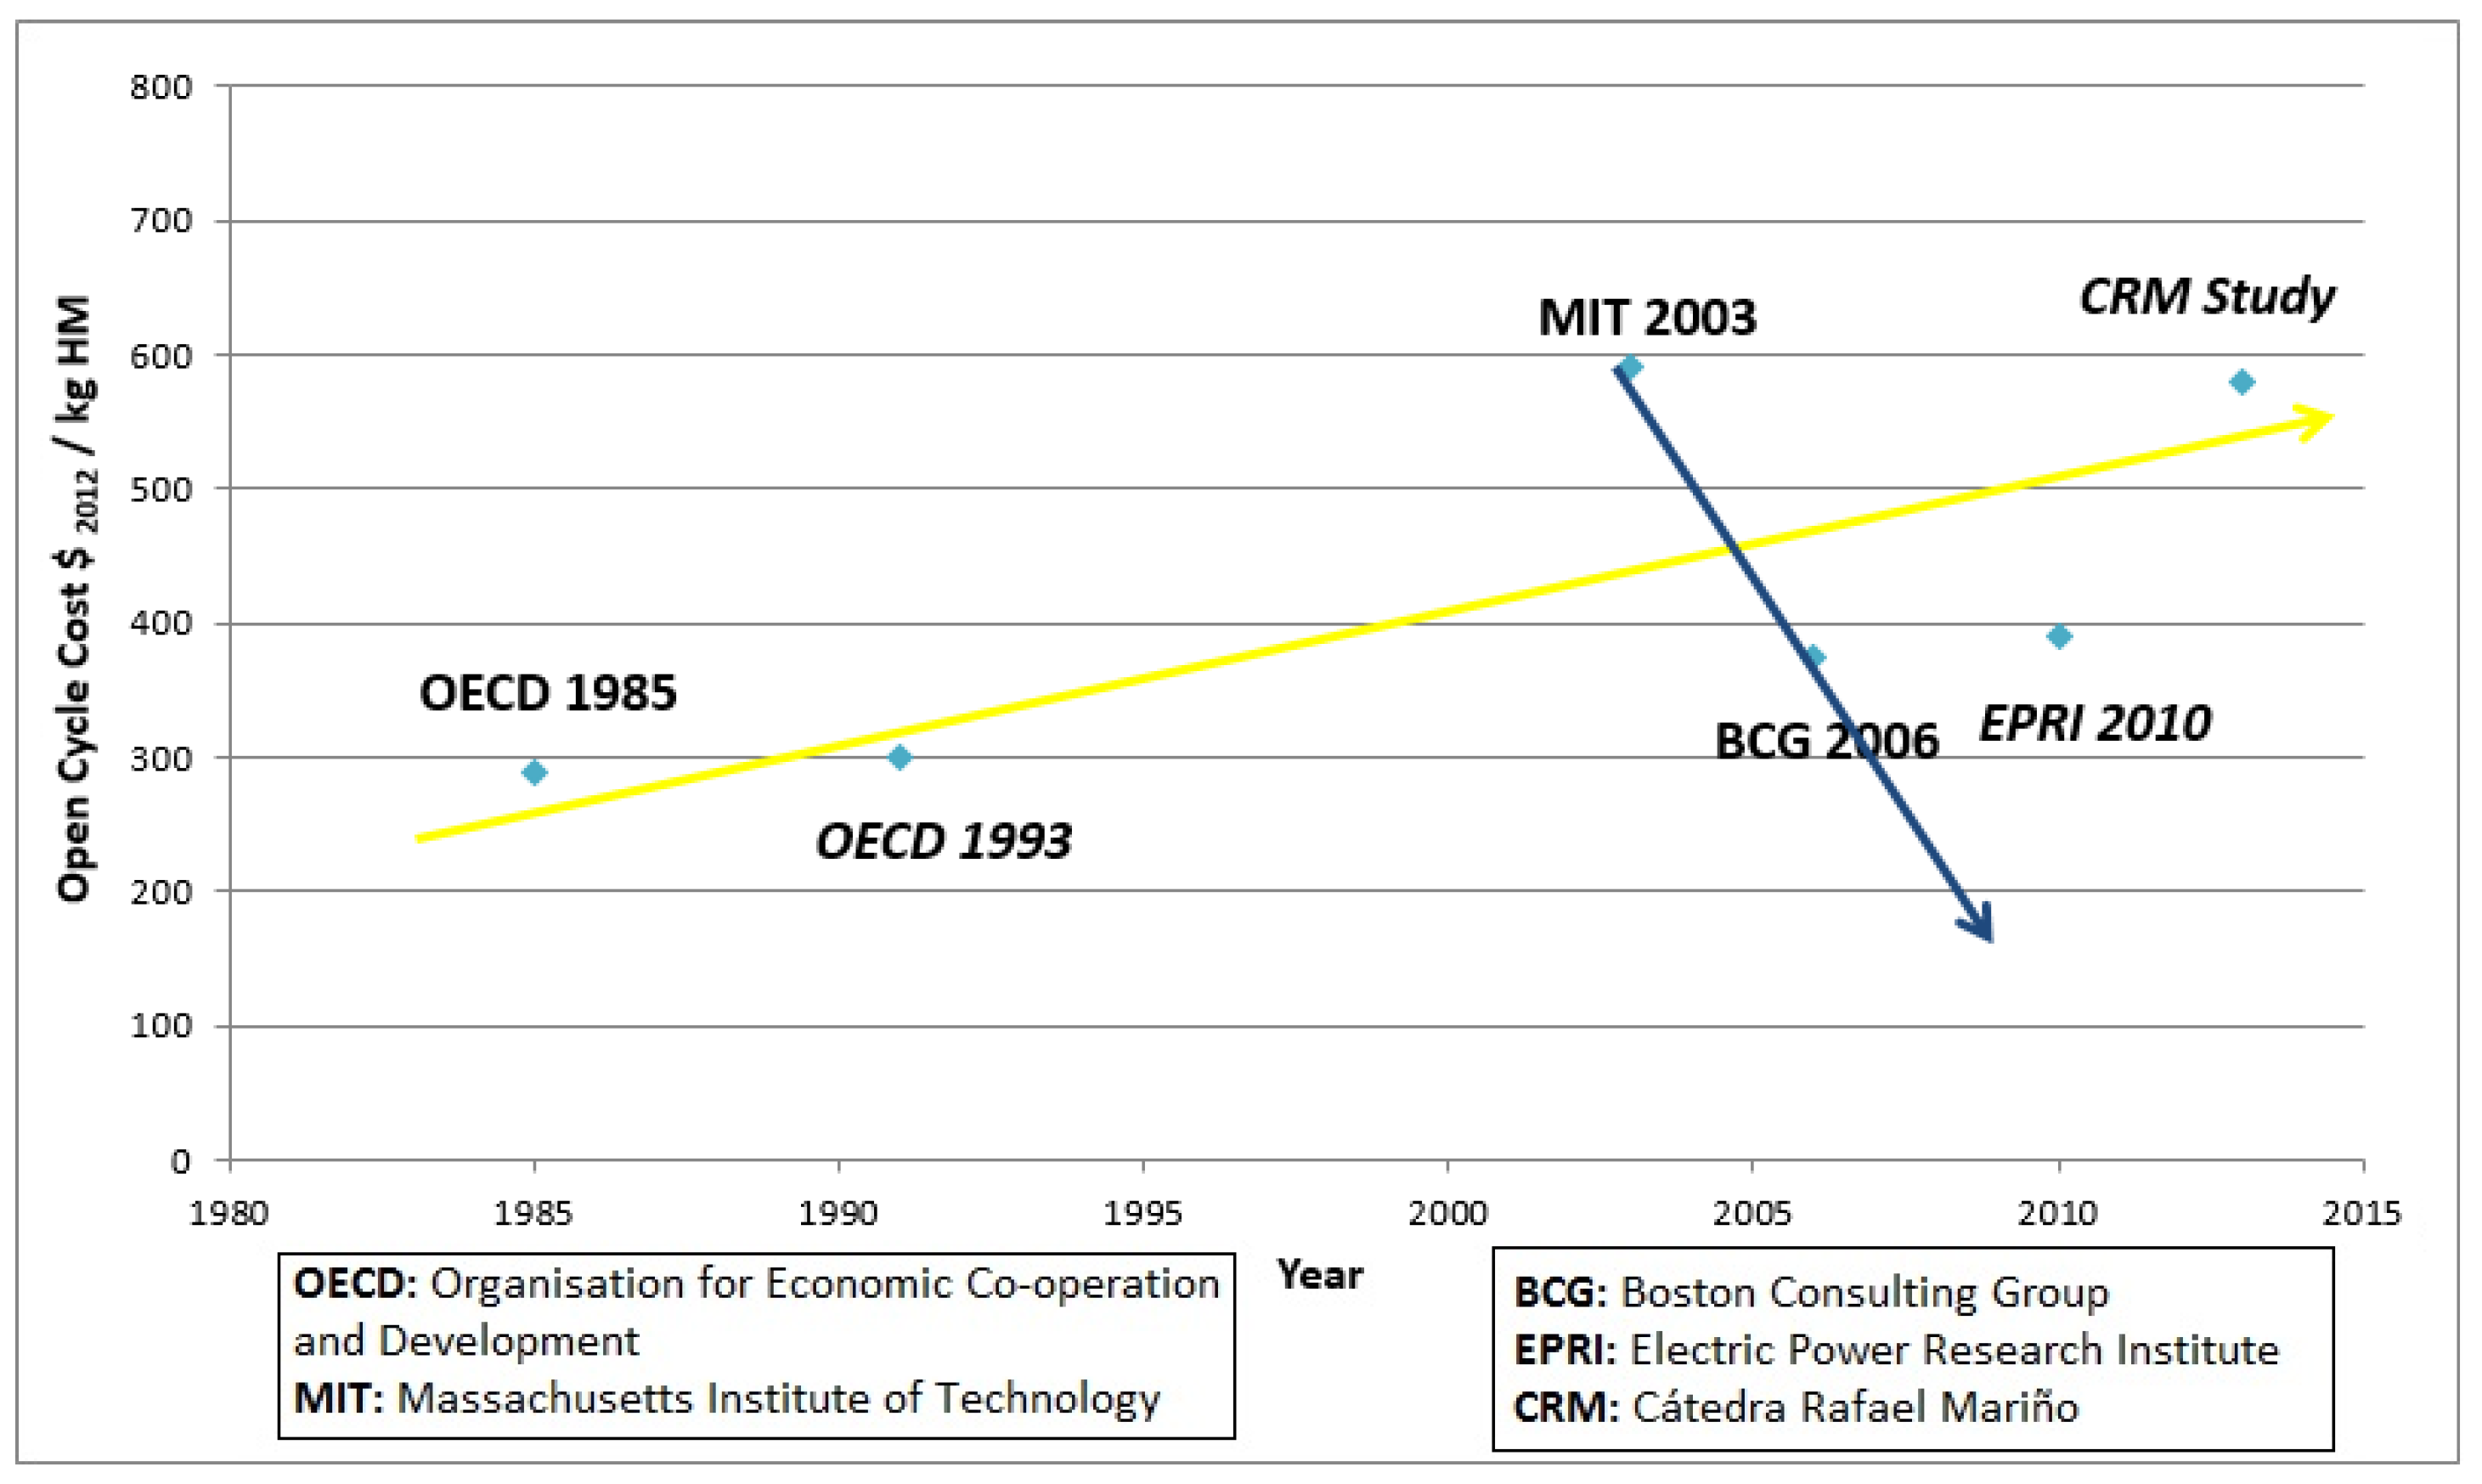
In order to make a long-term sustainable decision adopting one or another cycle, it is also important to determine the tendency of the costs involved. According to some international studies, the cost of creating a DGR for the open cycle is estimated to be increasing, as shown in
Figure 1. This is mainly due to the newly-identified requirements about the DGR, as it was concluded in the article published by Moratilla [
7].
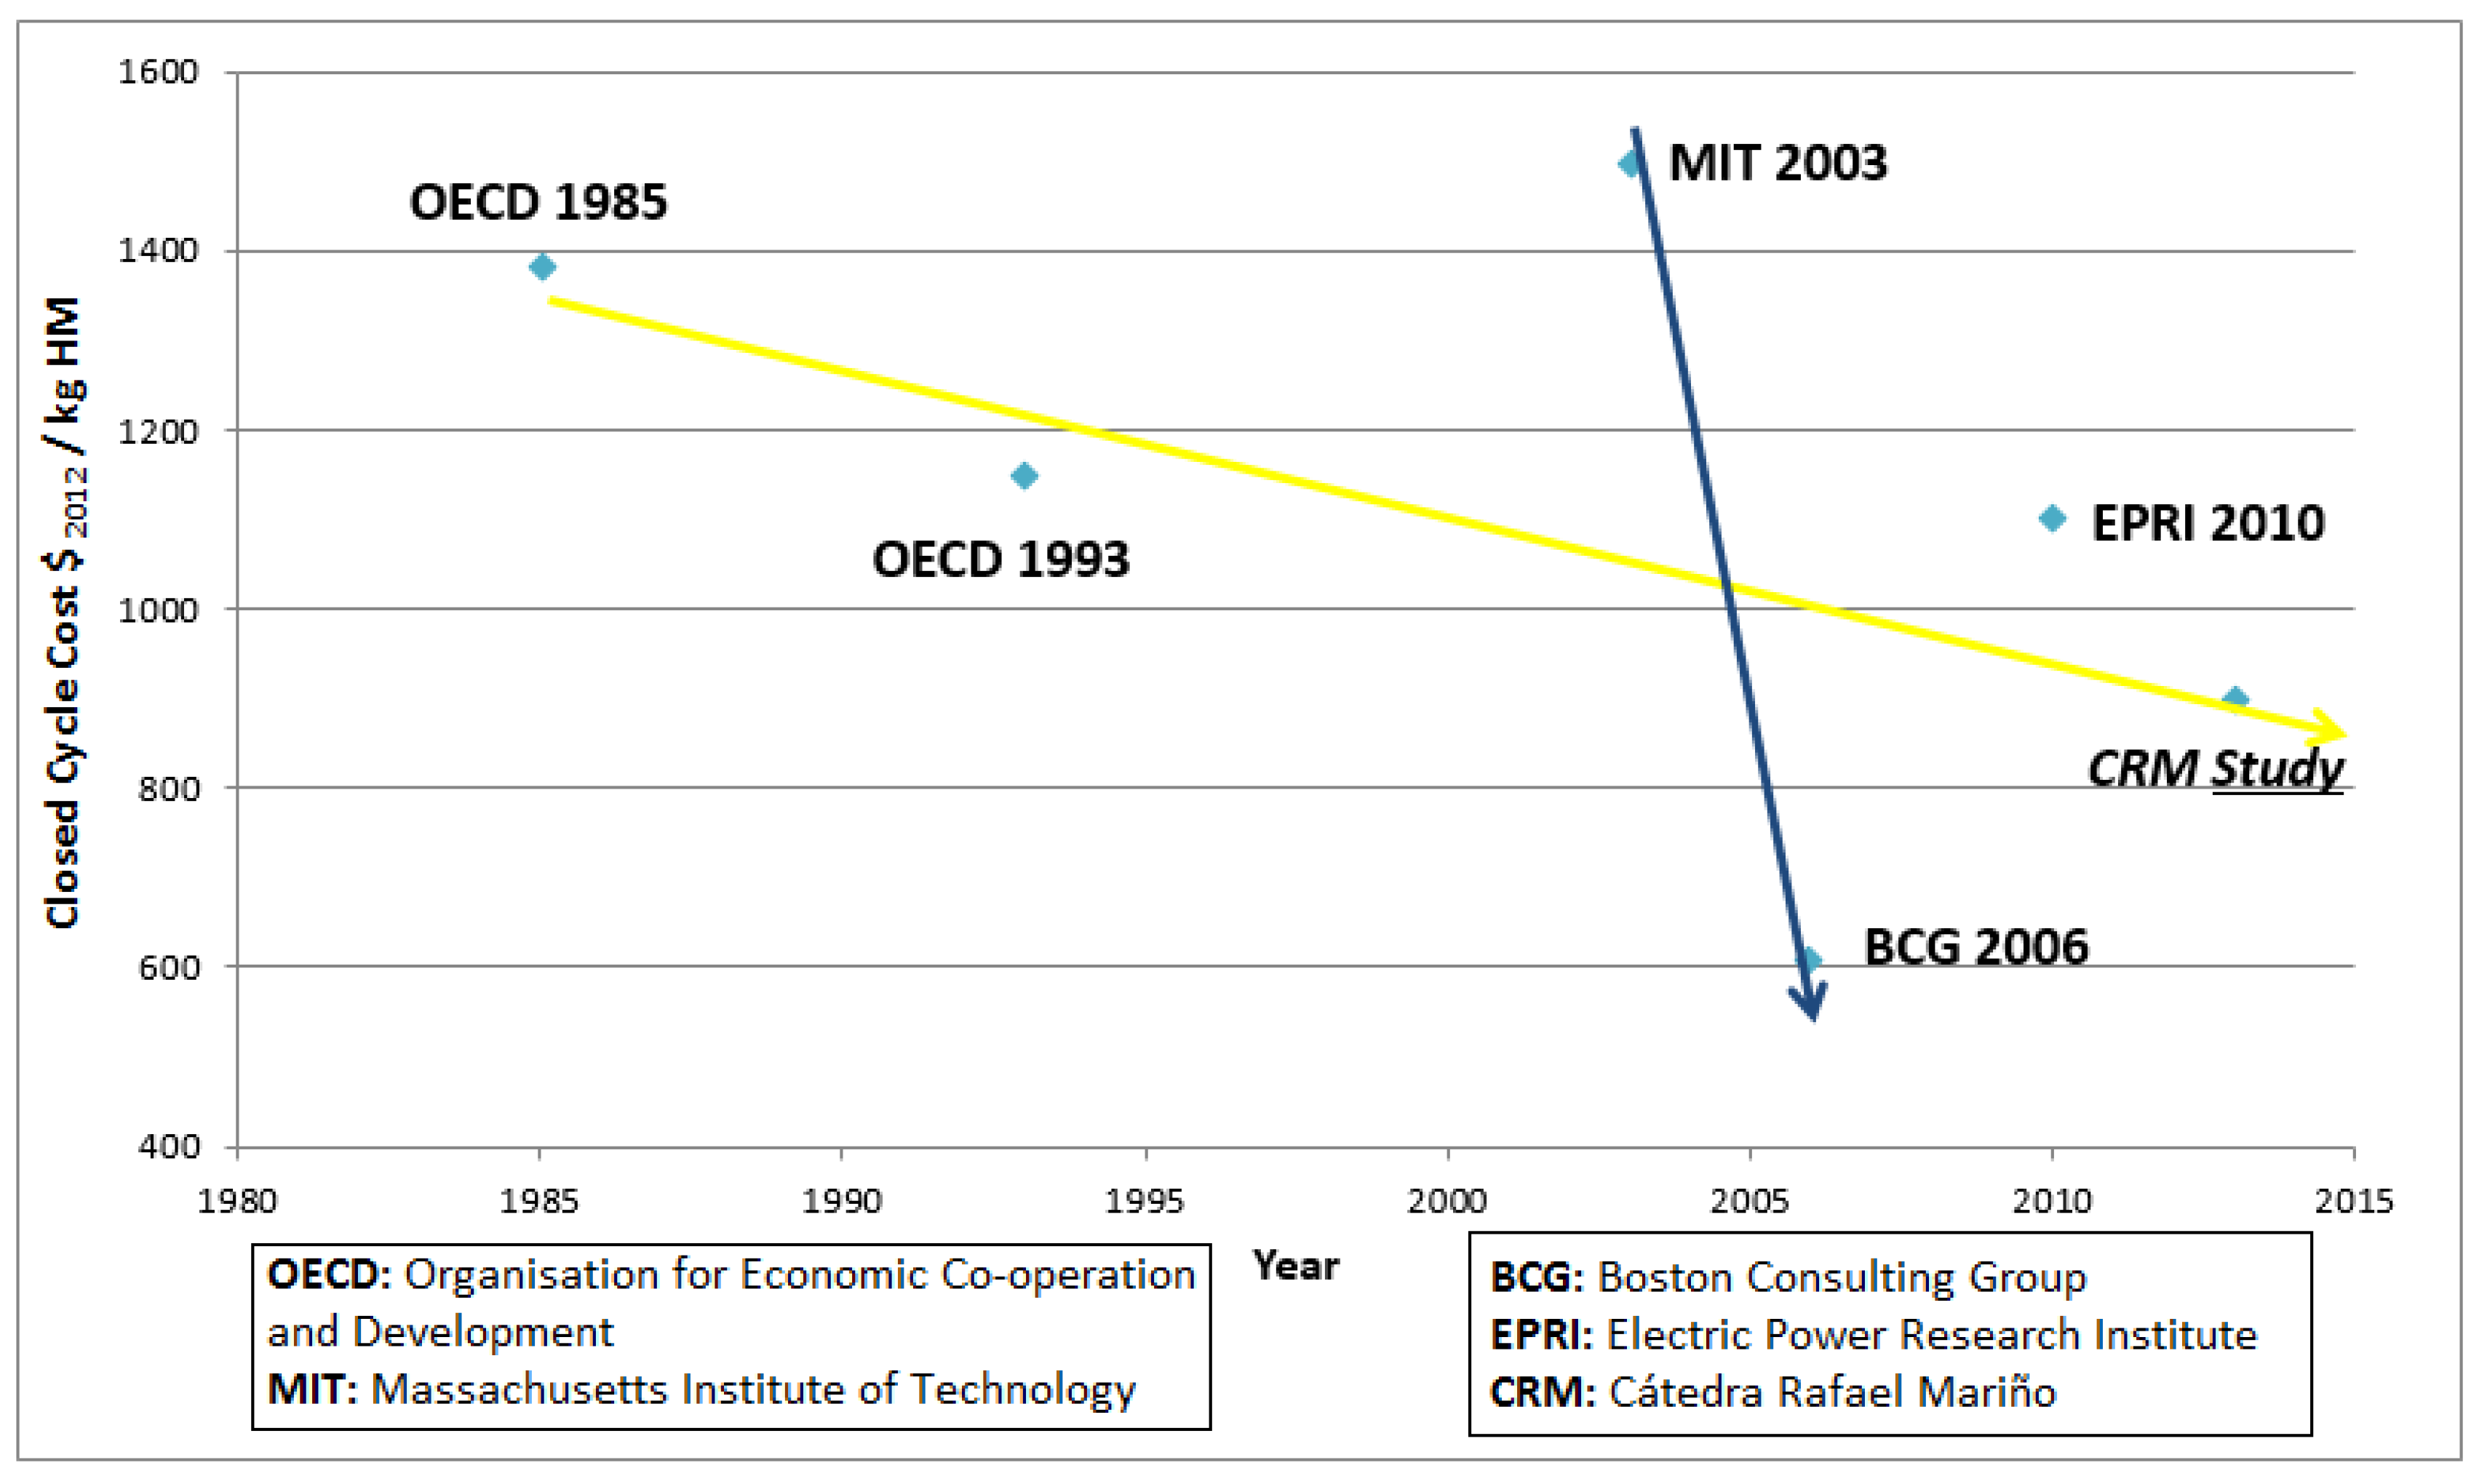
On the other hand, the costs of the closed cycle are estimated to be decreasing, as it can be found in
Figure 2. The maturity of the technology used and its constant optimization are the key points of this evolution.
Therefore, in order to make a suitable decision concerning the nuclear cycle, it is necessary to take into account some other factors, such as the intangible asset or the current energy regulations of each country. For example, P. Högselius [
8] explains that military ambitions and non-proliferation, technological culture, political culture and civil society, geological conditions and energy policy are the five main broad explanatory factors that are needed in order to analyze the differences in spent nuclear fuel policies between each country. Moreover, another important factor to consider is the tax policy of each country, as it has been explained for the Spanish scenario in different articles [
6,
9].
Analyzing the energy strategies of different countries, there are some of them, such as Sweden and Finland, that have assumed an open cycle strategy, having to construct deep geological repositories, whereas there are others that have decided to adopt the closed cycle, having to reprocess, recycle and, afterwards, vitrify and compact non-usable residue materials to be stored in the DGR. Some of the countries that have adopted the latter alternative, such as France, India, Japan, Pakistan, Russia and, more recently, China, have reprocessing facilities. However, there are other countries, such as the Netherlands, which reprocesses all of the used fuel, but they do not have the required facilities, which is possible by recycling abroad and storing the reprocessed vitrified waste.
In Europe, the communication about the opinion of the European Economic and Social Committee [
10], which was requested and published by the European Commission, is expected to decrease the number of European countries that lack a definitive decision. This communication recommends a European Energy Dialogue (EED) that will contribute to the implementation of the Energy Union.
Nevertheless, there are countries, such as Spain, which have still not made a decision about which strategy to adopt. Hence, for these countries, there are many factors and methods that have to be taken into consideration when comparing different strategies. Currently, the most frequently-used tool to compare various technologies or processes is the levelized cost of electricity (LCOE). G. De Roo and J.E. Parsons [
1] have developed the first methodology in order to calculate the LCOE extended to the reprocessing strategy.
2. Methodology
As described before, in order to make a comparison between the different back-end strategies, a tool that allows us to analyze various technologies is the LCOE, which is defined as the net present value of the unit-cost of electricity over the lifetime of a generating asset. This tool is able to compare the lifecycle cost of electricity generation with different technologies or within the same technology class.
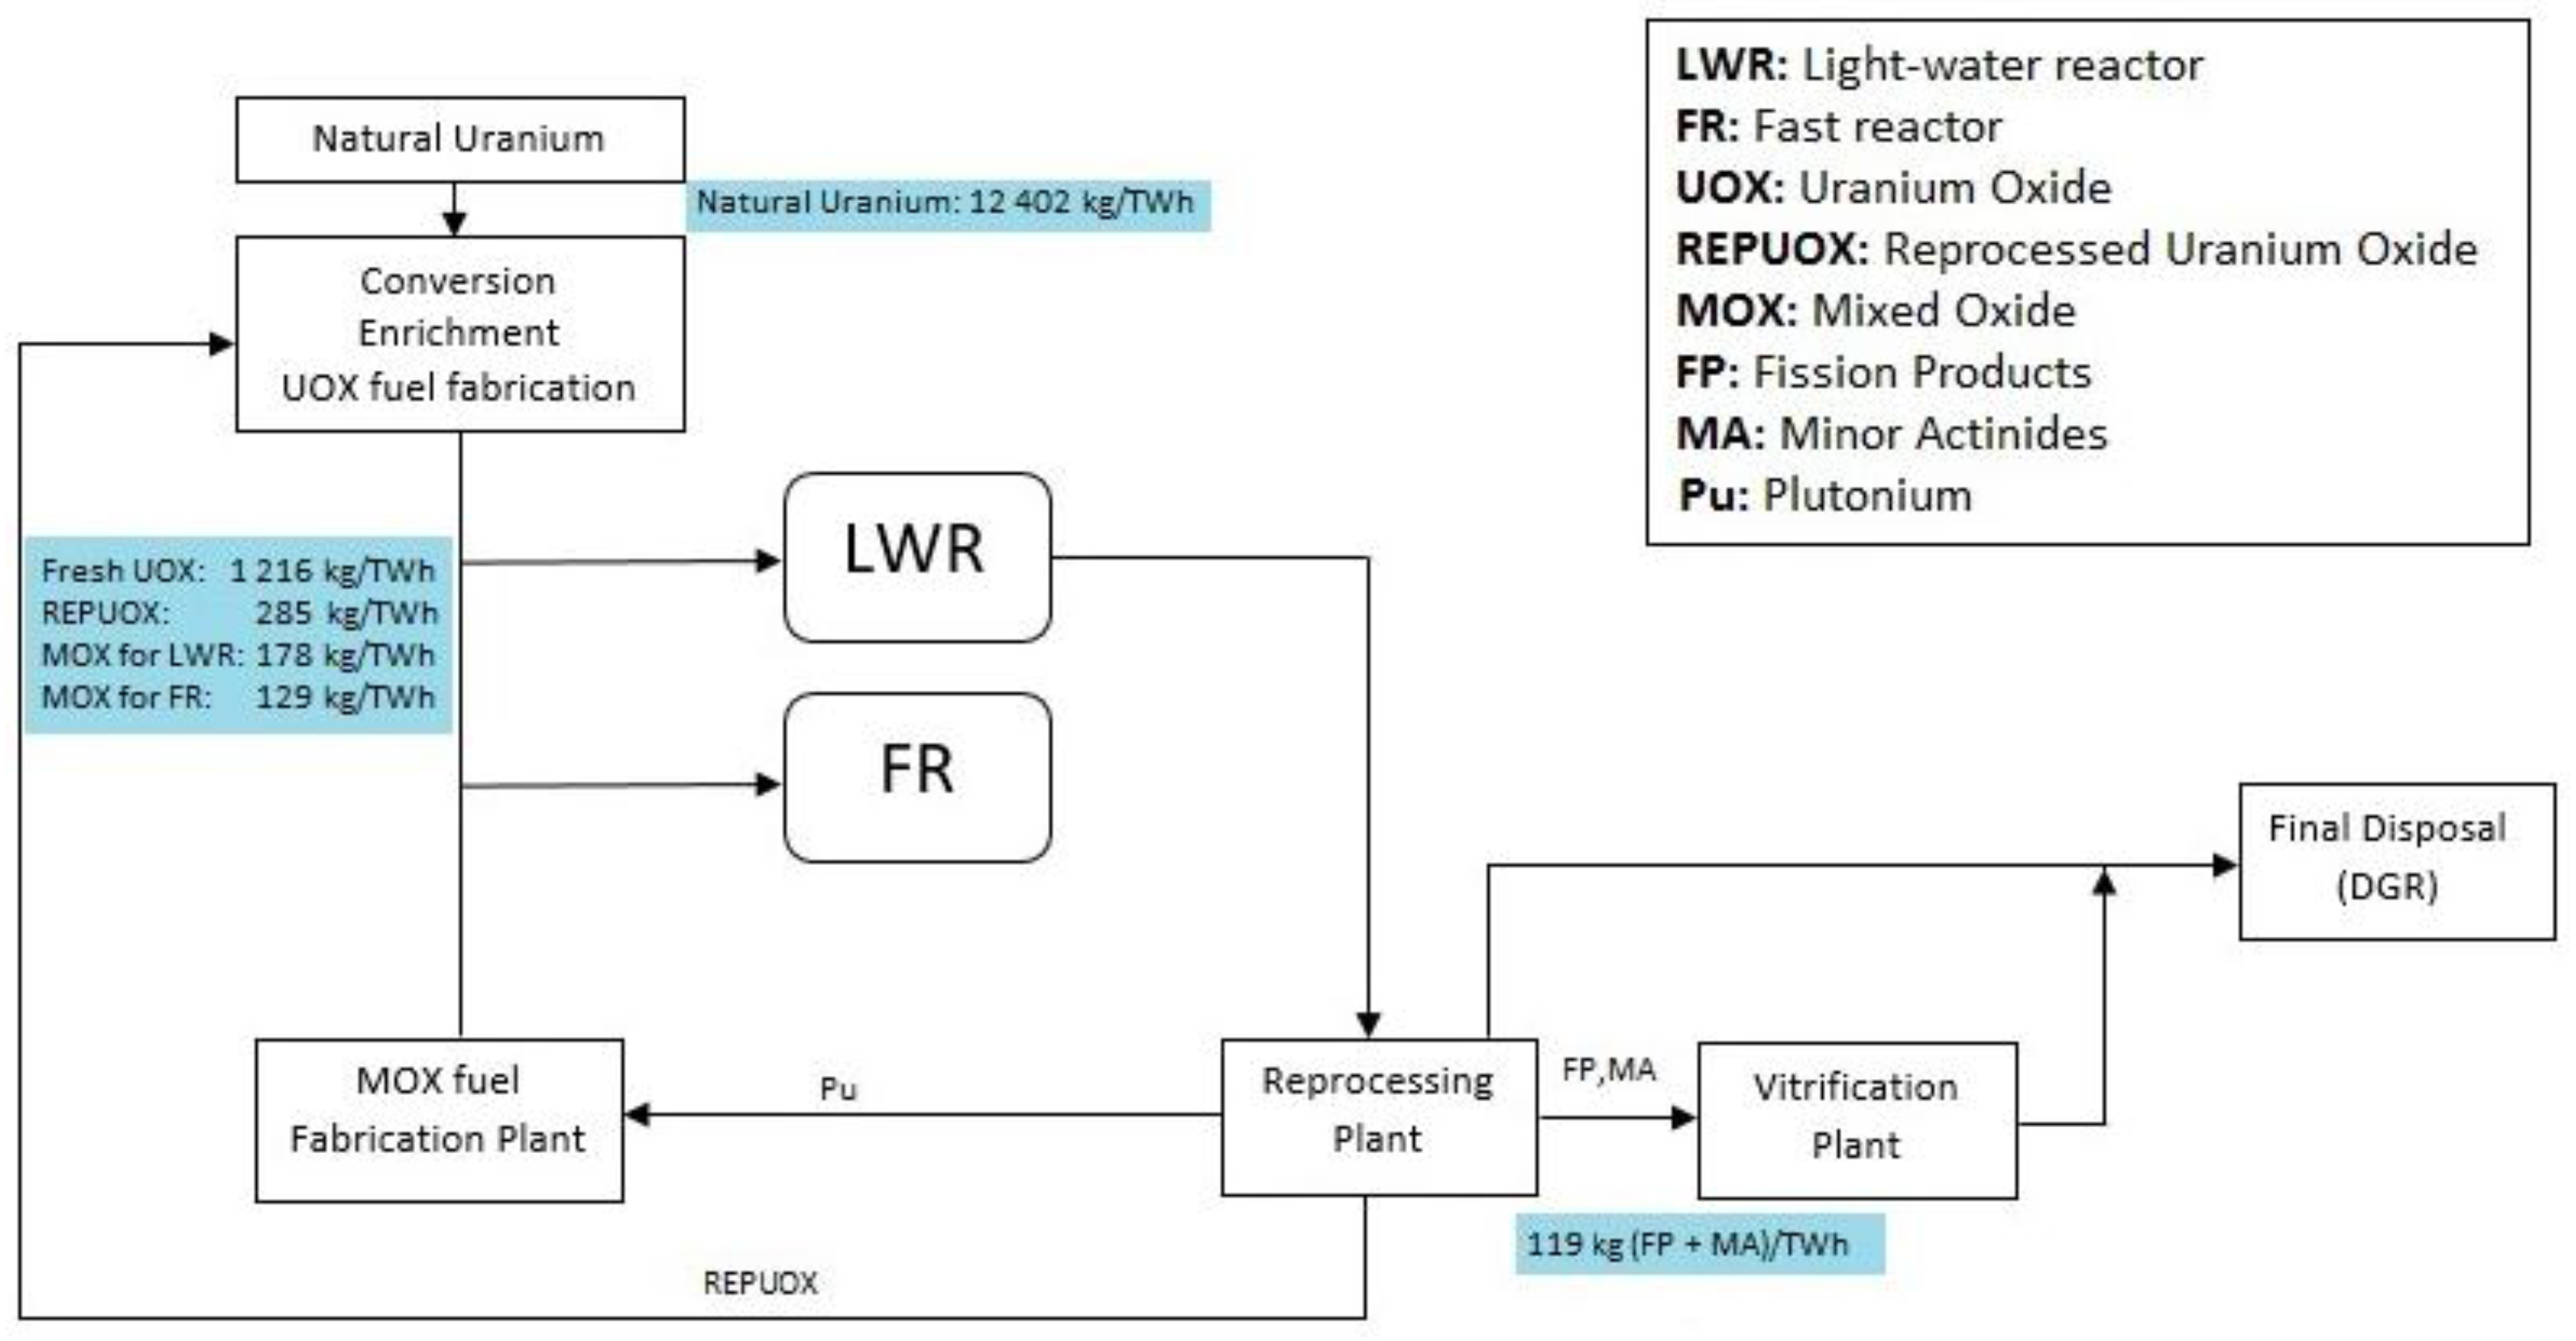
In this article, the front-end and the back-end costs of the nuclear fuel cycle are analyzed using the LCOE. The front-end costs correspond to the nuclear fuel cycle expenditures incurred prior to the arrival at the nuclear power plant (NPP): natural uranium extraction, conversion and enrichment costs, uranium oxide (UOX) fuel fabrication and reprocessed uranium oxide (REPUOX) fuel fabrication for the closed cycle. The back-end costs are those related to the spent nuclear fuel management: interim storage, encapsulation, DGR, reprocessing (for the closed cycle), etc.
For this study, data have been gathered from the Nuclear Energy Agency (NEA) of the Organisation for Economic Co-operation and Development (OECD) [
11], where costs are analyzed for different back-end strategies. Therefore, first, in order to analyze the LCOE for the back-end of the nuclear fuel cycle, there are four main costs that have to be taken into account for each facility implied in the process:
Investment cost: for each facility, it corresponds to the initial investment cost; the units are in $.
Closure cost: the closure cost of the facility once it reaches the end of its life cycle; the units are in $.
Operations and Maintenance (O&M) cost: the costs related to the operation and maintenance of the facility during its operational years; as it depends on the years the facility is running (its operational lifetime), this cost is given in $/year.
Transport cost: The cost related to the shipment of the spent nuclear fuel amongst facilities; as in the previous case, this cost depends on the number of years in which transportation is required (which correspond to some of the facilities operational lifetime), so this cost is also given in $/year.
In order to calculate the back-end levelized cost of electricity, there are three economic factors that have to be applied:
- -
Capital recovery factor (): This factor is used to convert each cost into a stream of equal payments over the NPP operational lifetime, as it is the period of time when the profits are produced. The
is calculated in Equation (1).
where
is the discount rate and
is the NPP operational lifetime.
- -
Discount factor (): This is the factor by which the investment and closure costs must be multiplied in order to obtain the present value. The
can be obtained as shown in Equation (2).
where
is the
between the time the nuclear power plant starts to be operational (Year 0) and the time the back-end facility starts to operate.
- -
Conversion factor (): This factor is applied to the costs that, instead of being a one-time expenditure, depend on the time the facility is operating. It calculates the total O&M and transportation costs during the facility operational lifetime.
where
is the discount rate and
is the facility operational lifetime.
The can be obtained as the sum of the partial costs applying the previously-exposed factors, as is shown in Equation (4).
where
k corresponds to each facility implied in the process.
Once the LCOE for the back-end has been calculated, in order to obtain a more realistic vision of the global cost of the nuclear fuel cycle, the LCOE is also obtained for the front-end. The costs affecting the
, obtained from the data gathered in the OECD/NEA report [
7], are: natural uranium cost, natural uranium conversion cost, UOX enrichment cost, UOX fuel fabrication cost and, for the closed cycle back-end strategies, also the REPUOX enrichment cost and the REPUOX fuel fabrication cost.
All of these costs are in $/kg, so in order to obtain the LCOE, it is necessary to multiply them by the kg/TWh of fuel required for each back-end strategy and stage of the front-end process. The is shown in Equation (5).
where the costs of REPUOX are only applied for the closed cycle back-end strategies
Finally, the LCOE is obtained as the addition of and .
3. Results
The purpose of this paper is to analyze the costs of the back-end of the nuclear fuel cycle for different production scenarios and for three NPP operational lifetime situations.
For the analysis, three back-end strategies have been considered according to the OECD/NEA report [
11]:
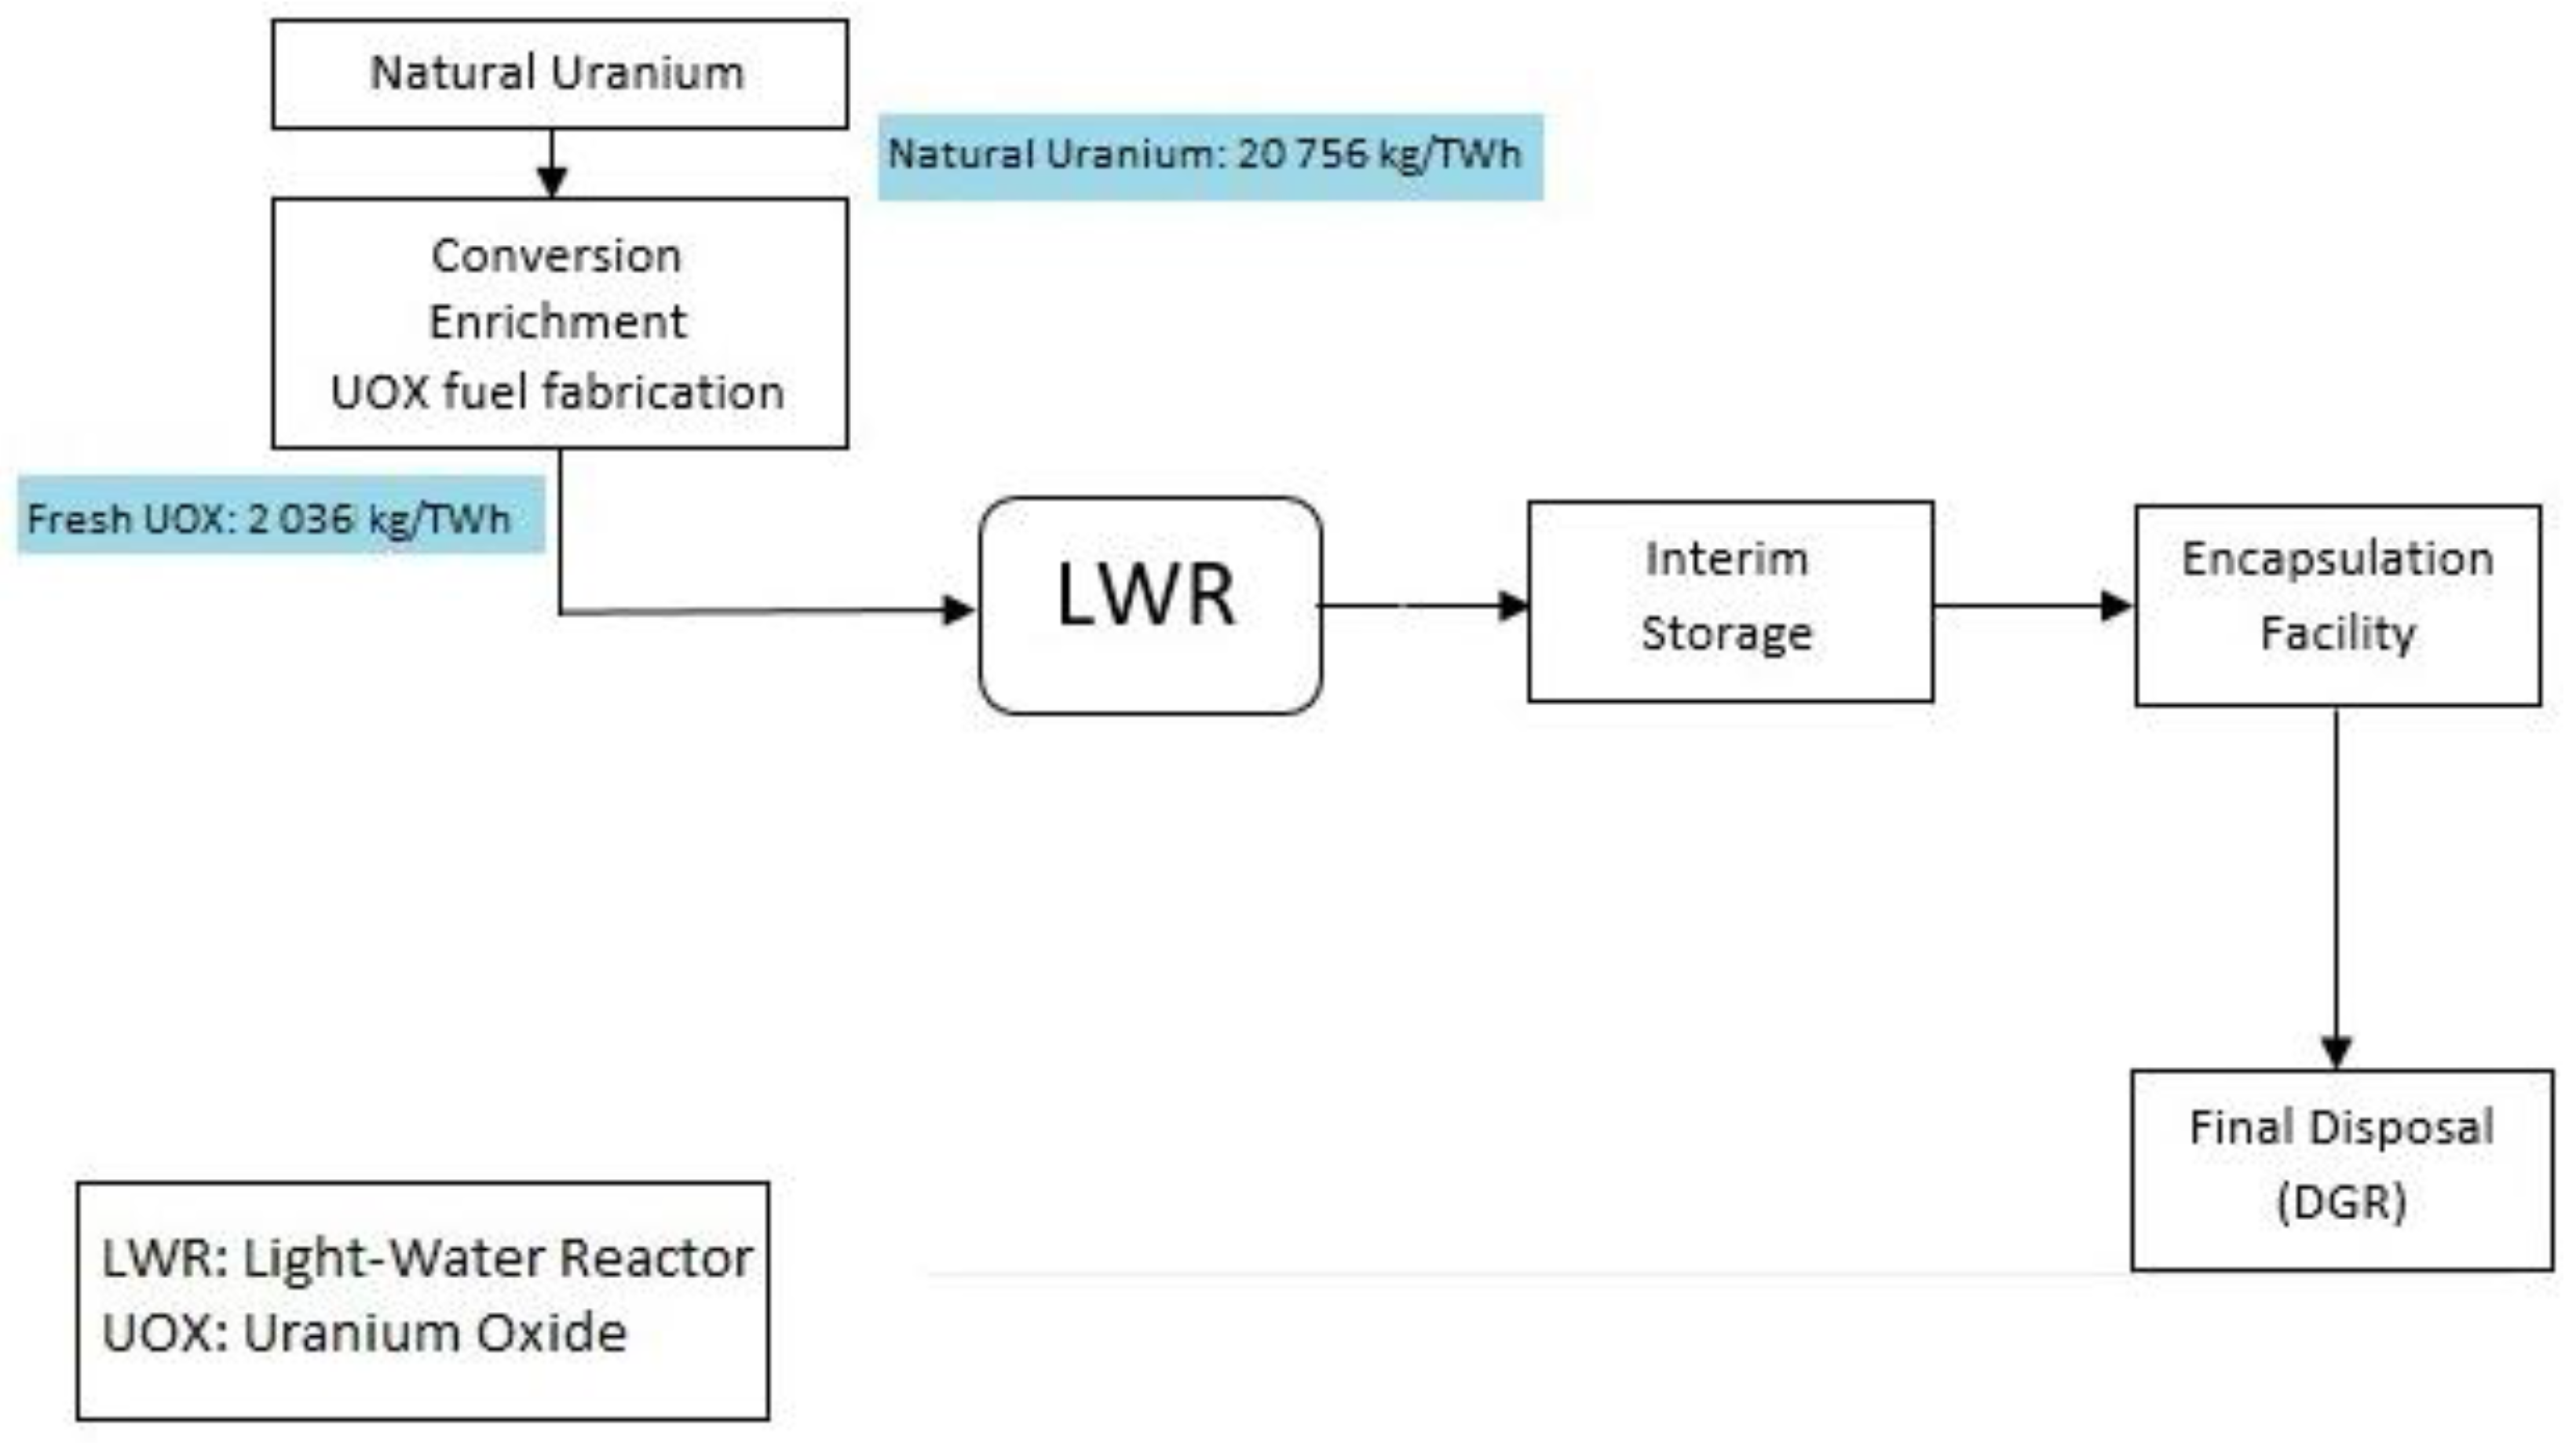
- -
OFC (once-through fuel cycle) or direct disposal: the SNF (spent nuclear fuel) is stored, encapsulated and, finally, disposed in the DGR, as shown in
Figure 3.
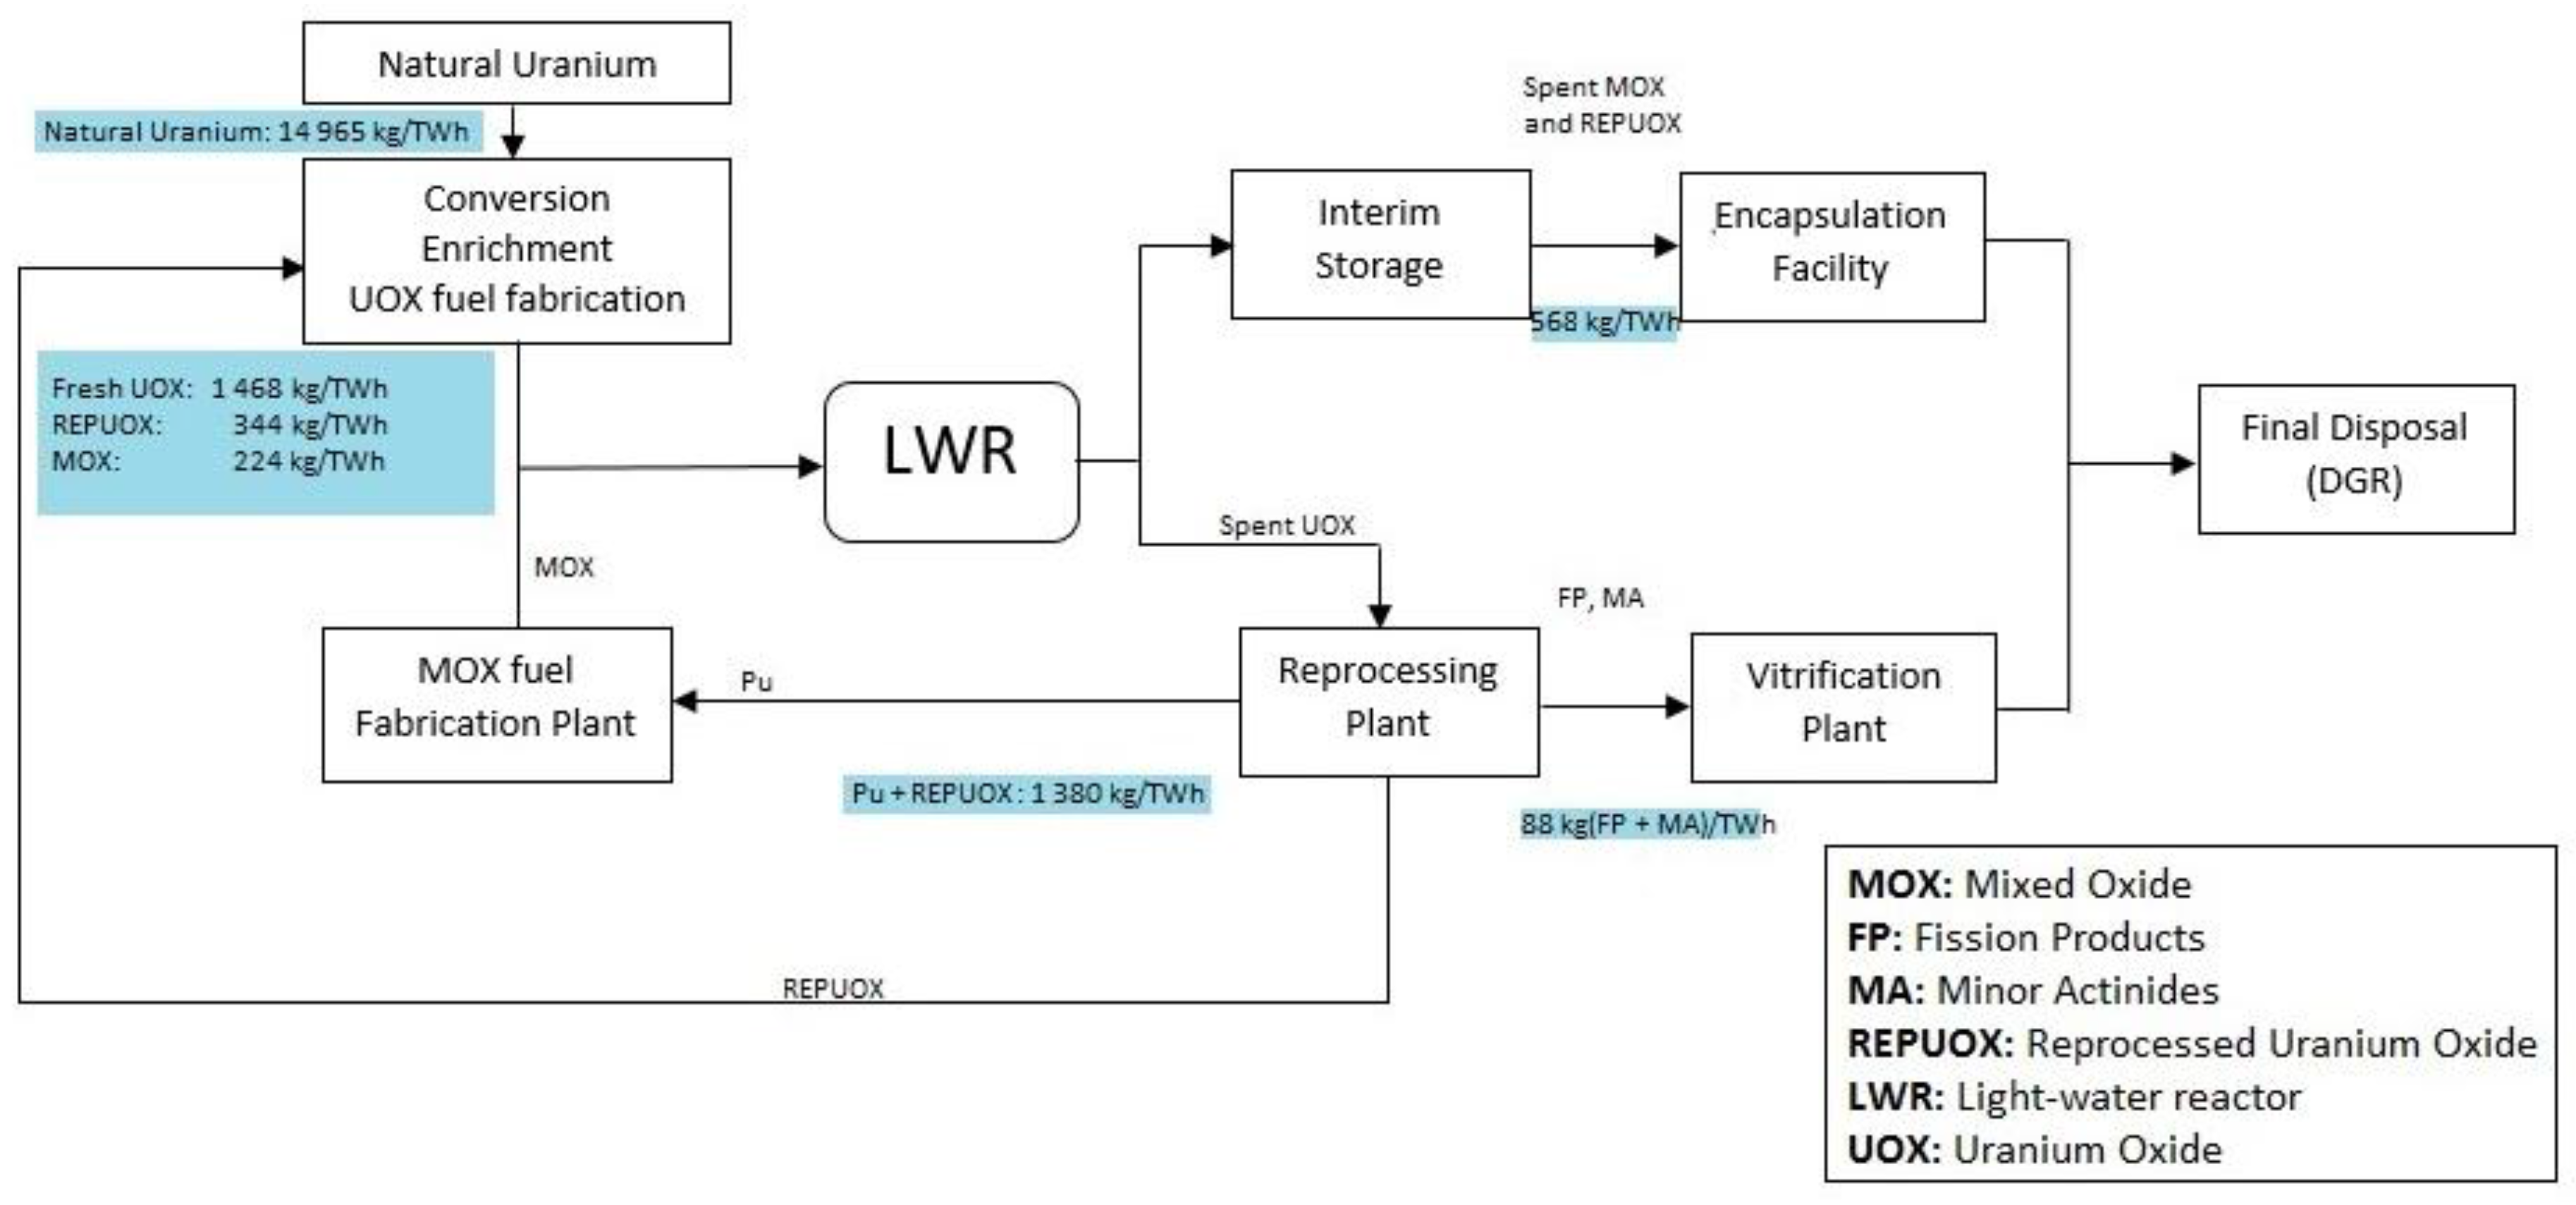
- -
Partial recycling: the SNF is reprocessed, and the recovered fissile materials are recycled in the form of MOX (mixed oxide) and REPUOX fuel. Then, the irradiated bundles are stored, encapsulated and disposed in a DGR. This cycle is shown in
Figure 4.
Some assumptions and considerations have been made in order to proceed with the calculations, some of which derive from the OECD/NEA report [
11]:
- -
All of the back-end facilities are assumed to be ready and operational exactly at the time when they are needed.
- -
All facilities’ investment costs are considered overnight capital costs.
- -
SNF is cooled down at the reactor site for seven years.
- -
For the OFC and partial recycling strategies, SNF or MOX and REPUOX irradiated bundles are then transported to the interim storage facility where they are stored for 50 years before the final disposal.
- -
For the partial recycling and AFC strategies, an integral reprocessing facility is considered, including a reprocessing plant, an FP (fission products)/MA (minor actinides) vitrification plant and a recycling plant (MOX fuel fabrication).
- -
For the AFC strategy, the share of FRs in the fleet is assumed to be 17.5%, with a cost premium of 20%.
- -
Four electricity production scenarios are considered: 25 TWh/year, 75 TWh/year, 400 TWh/year and 800 TWh/year.
- -
The calculations are made for 40, 60 and 80 years NPP operational lifetime and discount rates of 0% and 3%.
- -
The results are obtained in 2010 USD.
Using the methodology previously explained and the data provided by the OECD-NEA [
11], the LCOE can be obtained for all of the different scenarios considered.
3.1. Analysis for Different NPP Operational Lifetime Scenarios
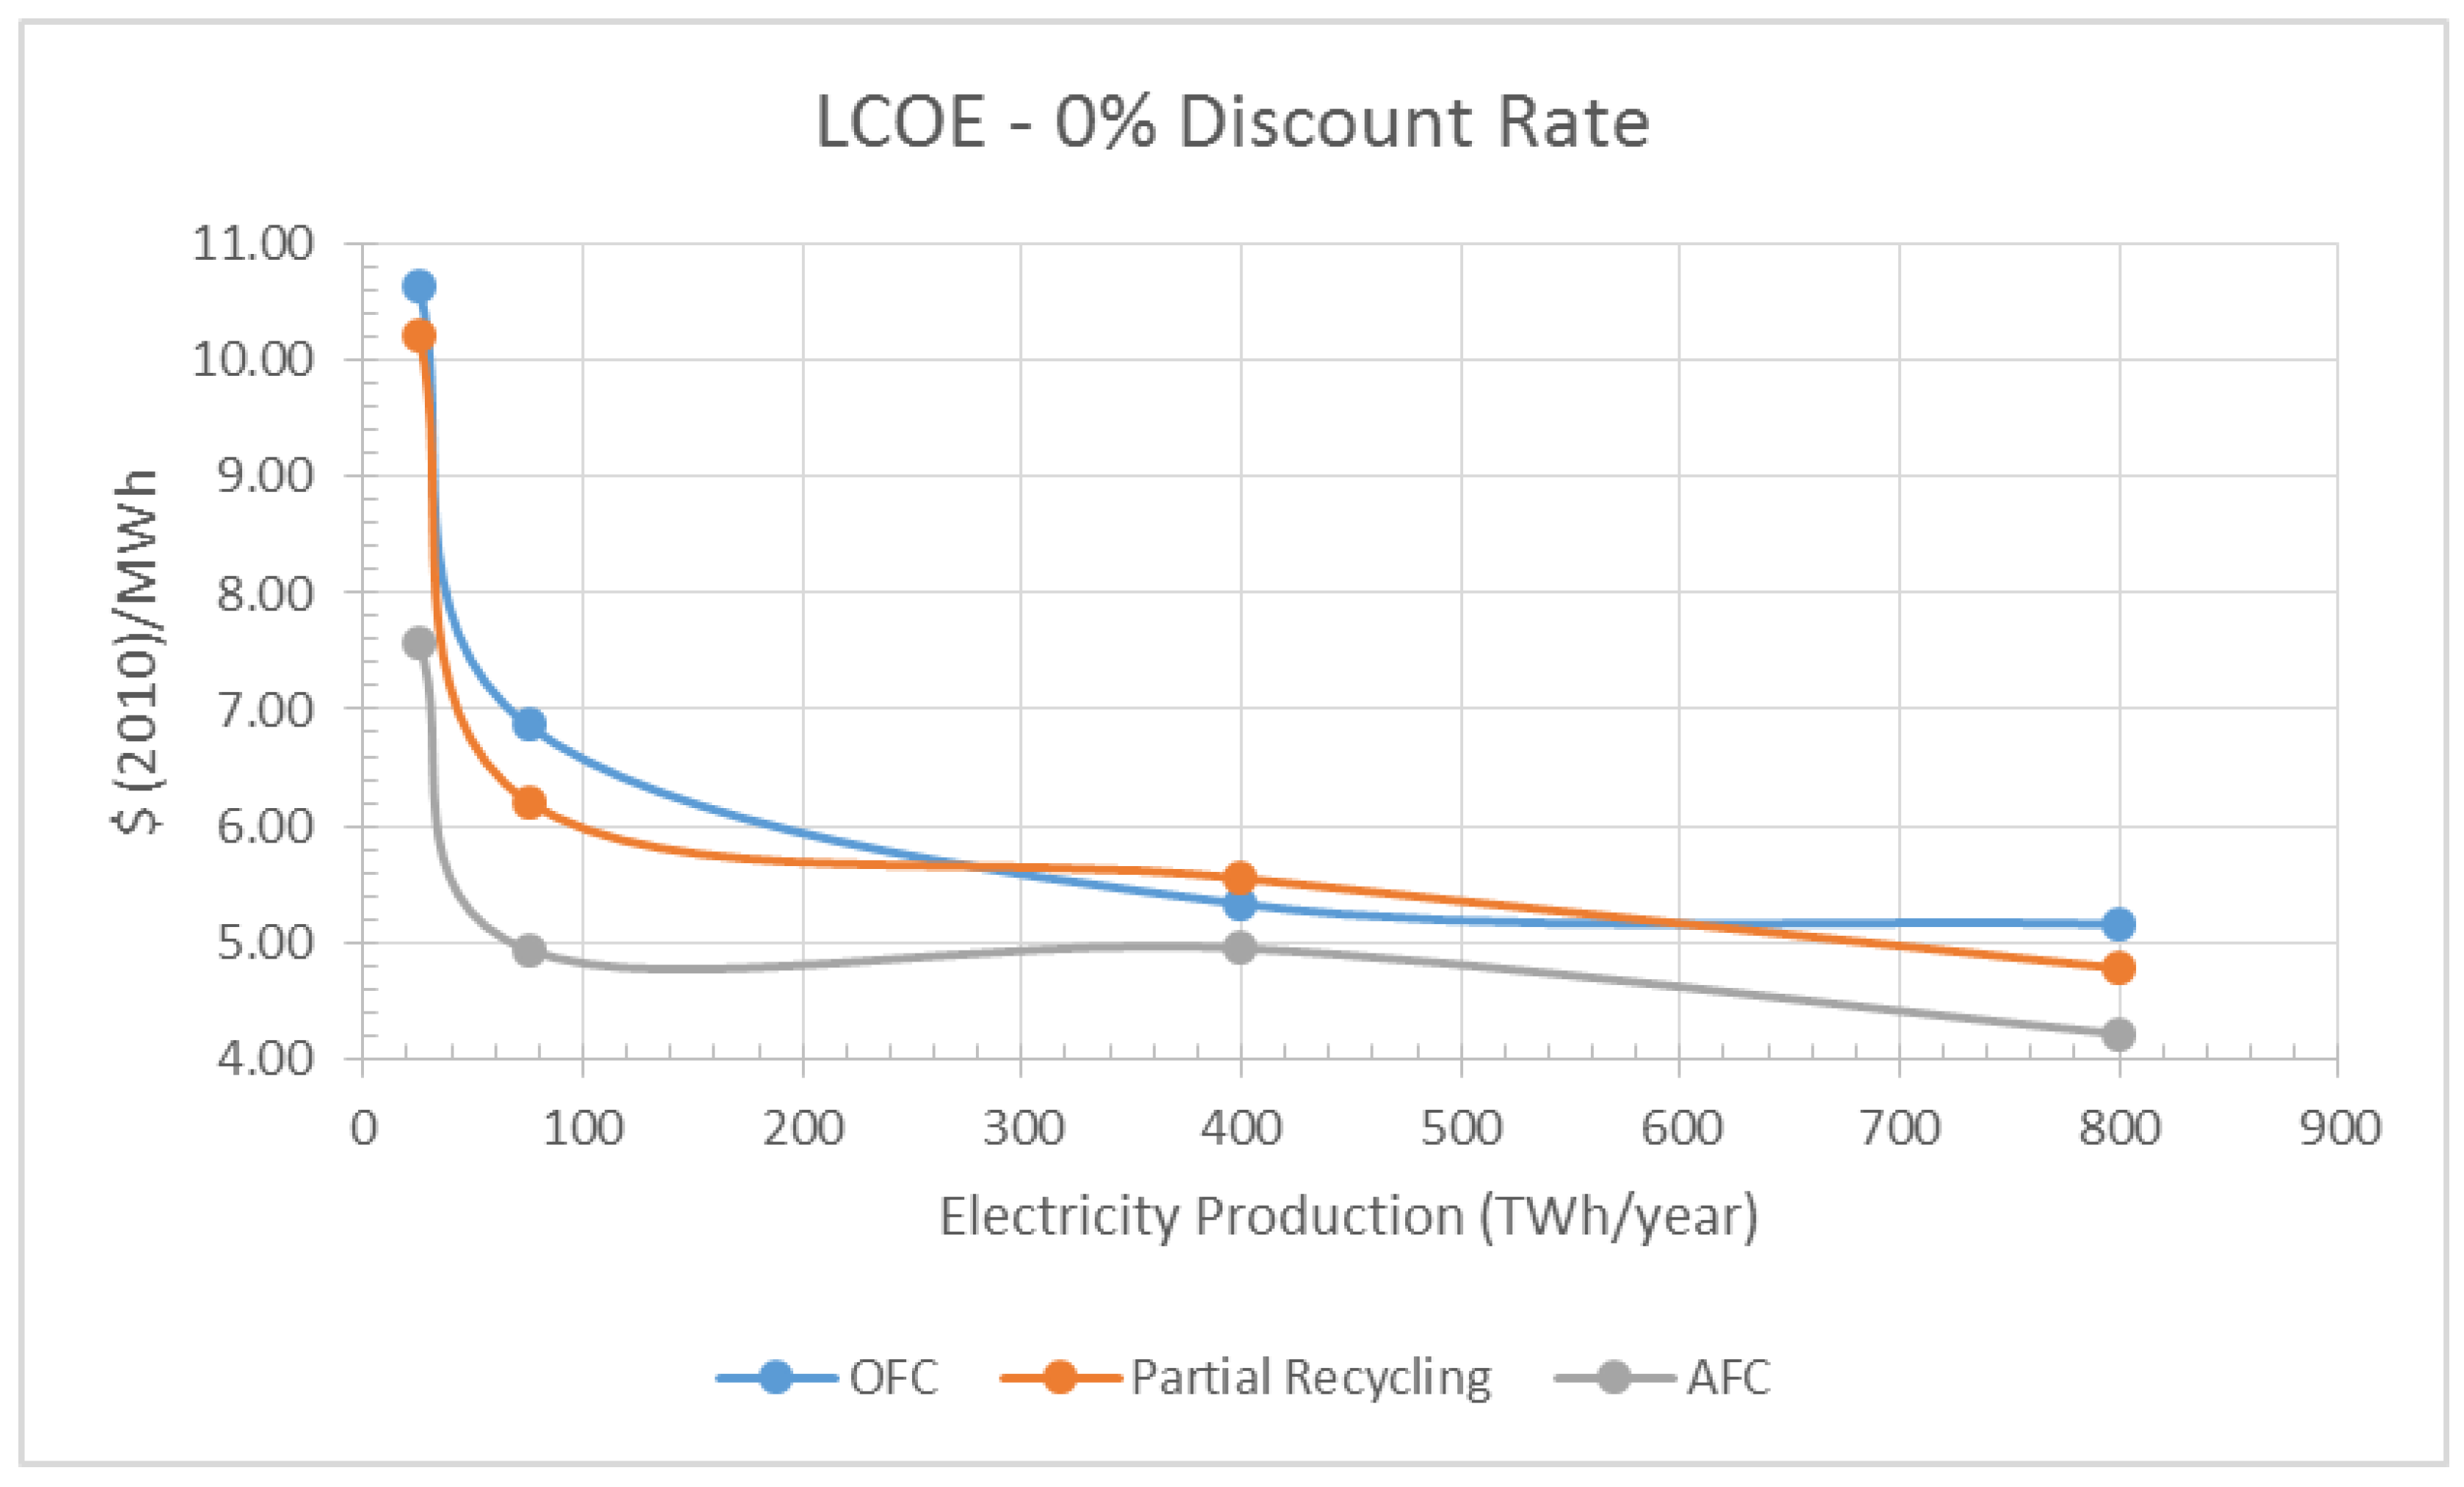
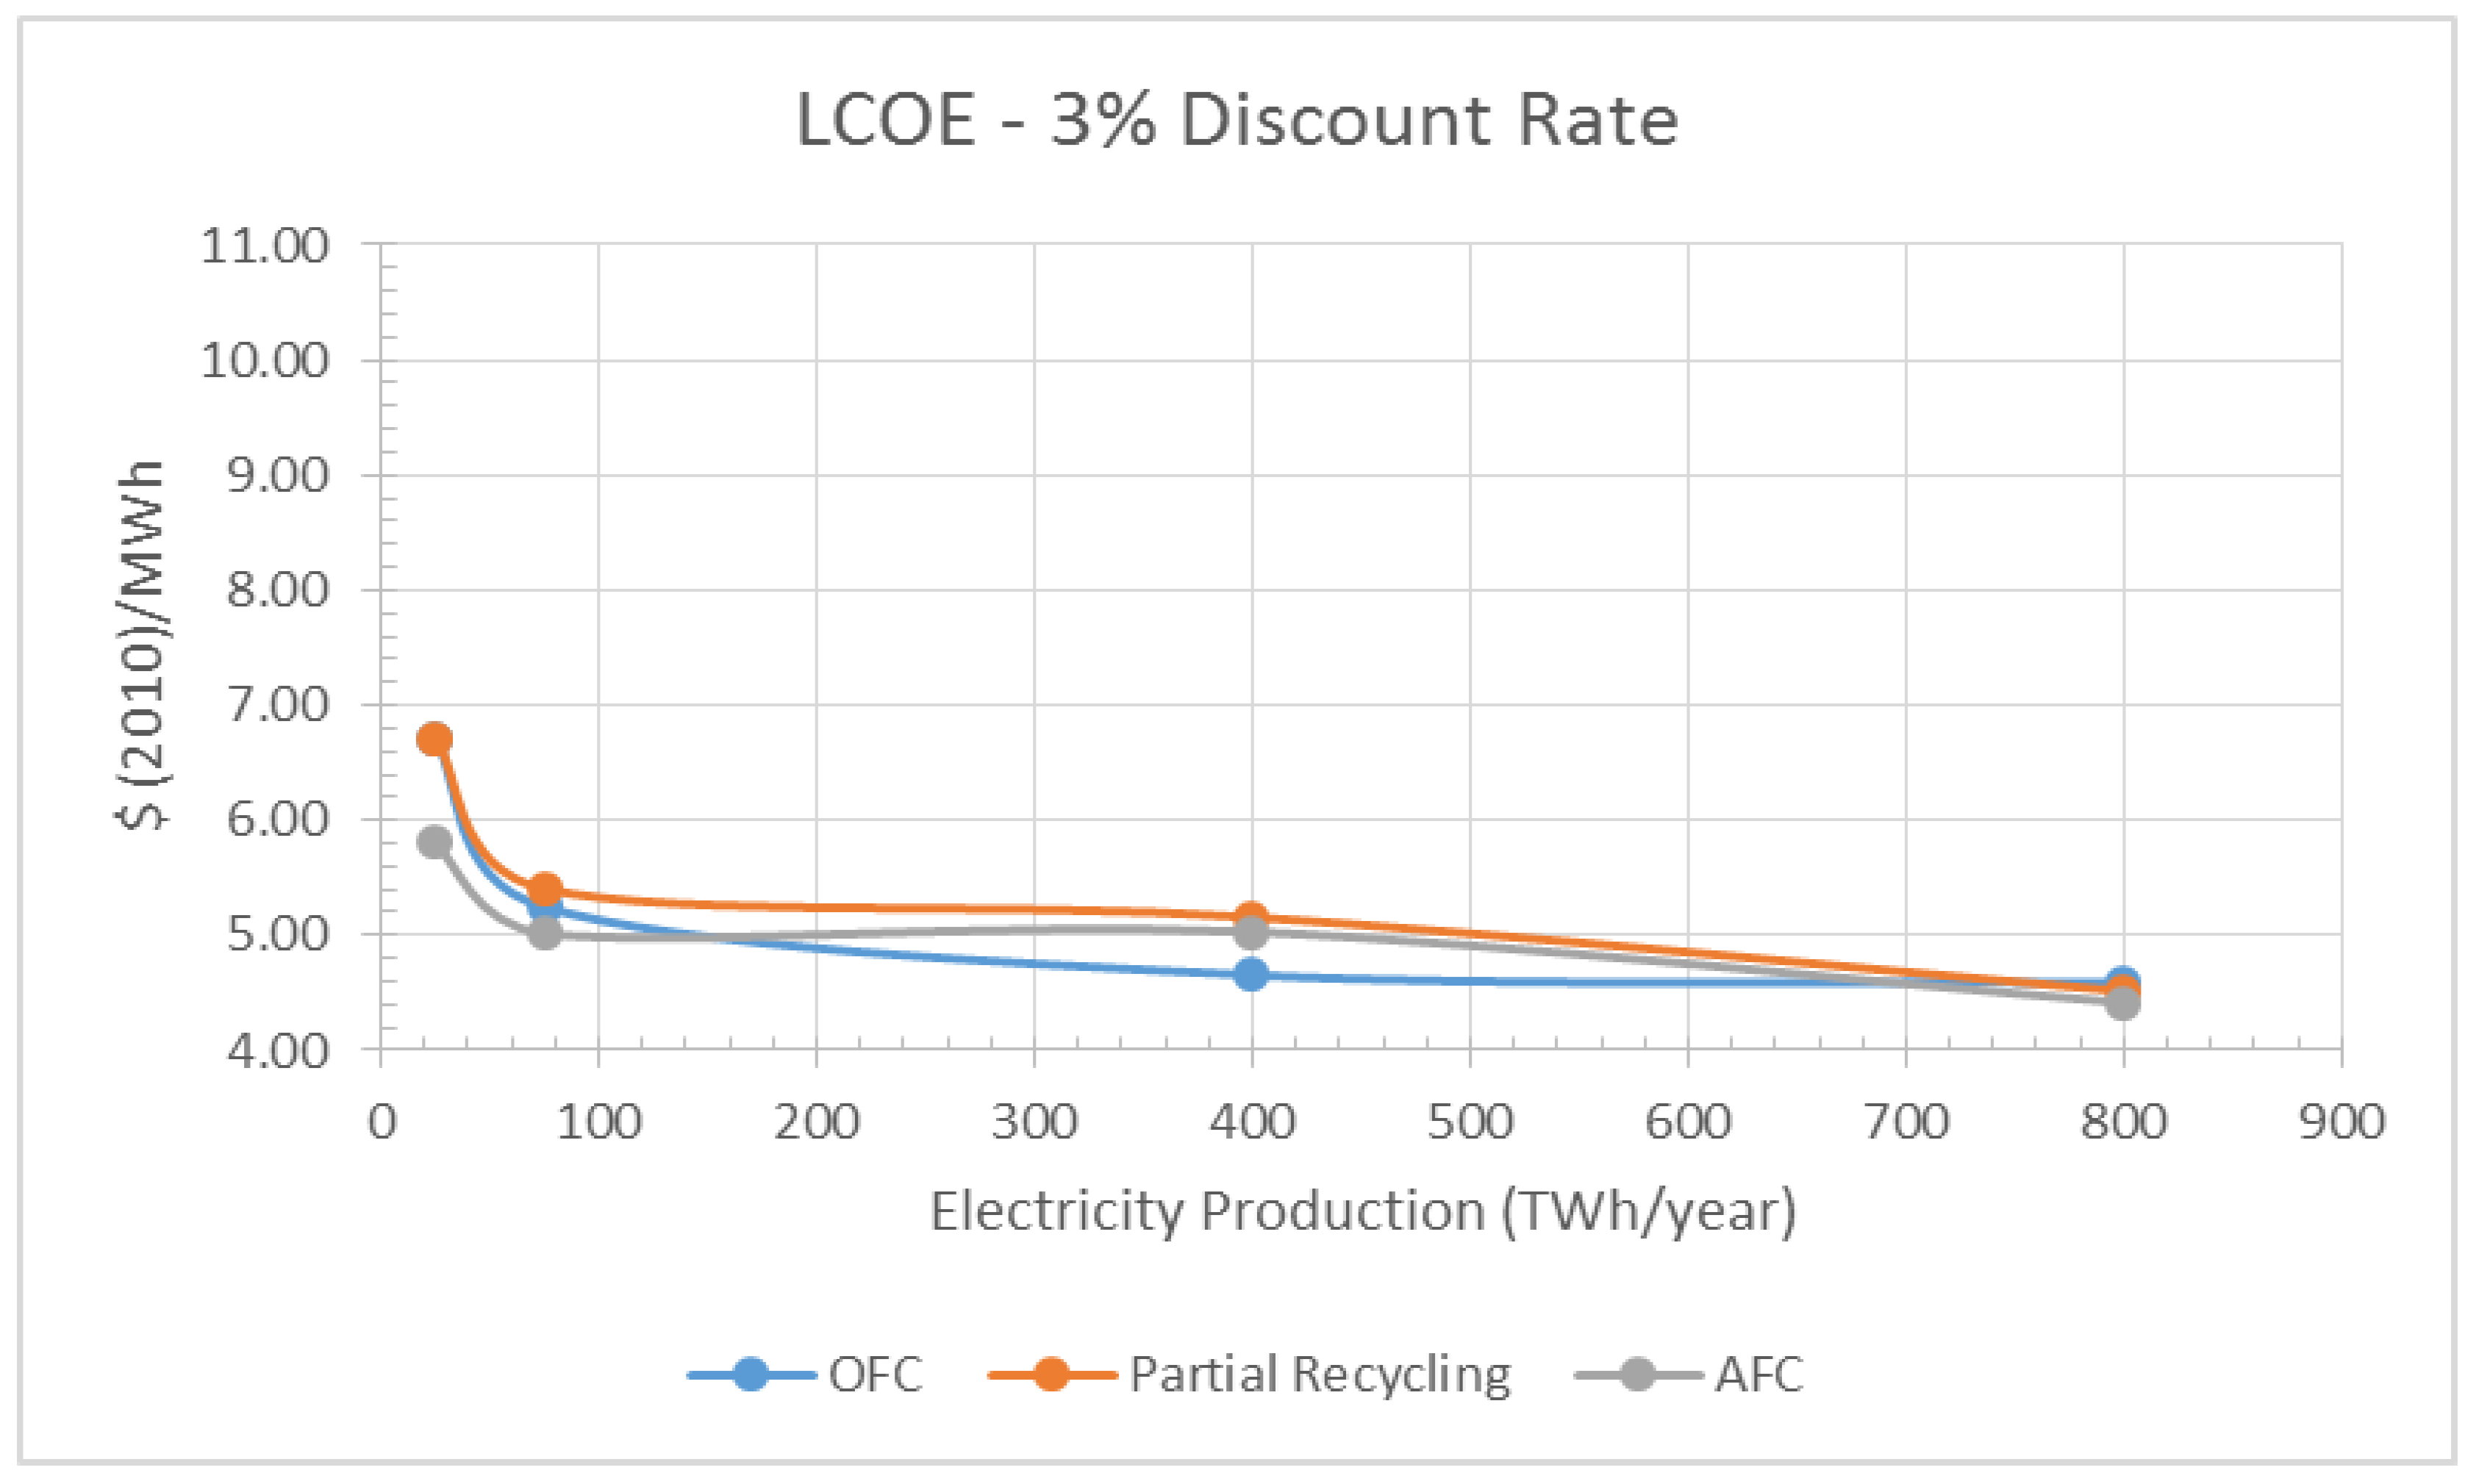
In order to visualize the effects of the NPP operational lifetime in the costs of the back-end of the nuclear fuel cycle, an analysis of the different strategies has been made for a 40-, 60- and 80-year lifetime.
- ➢
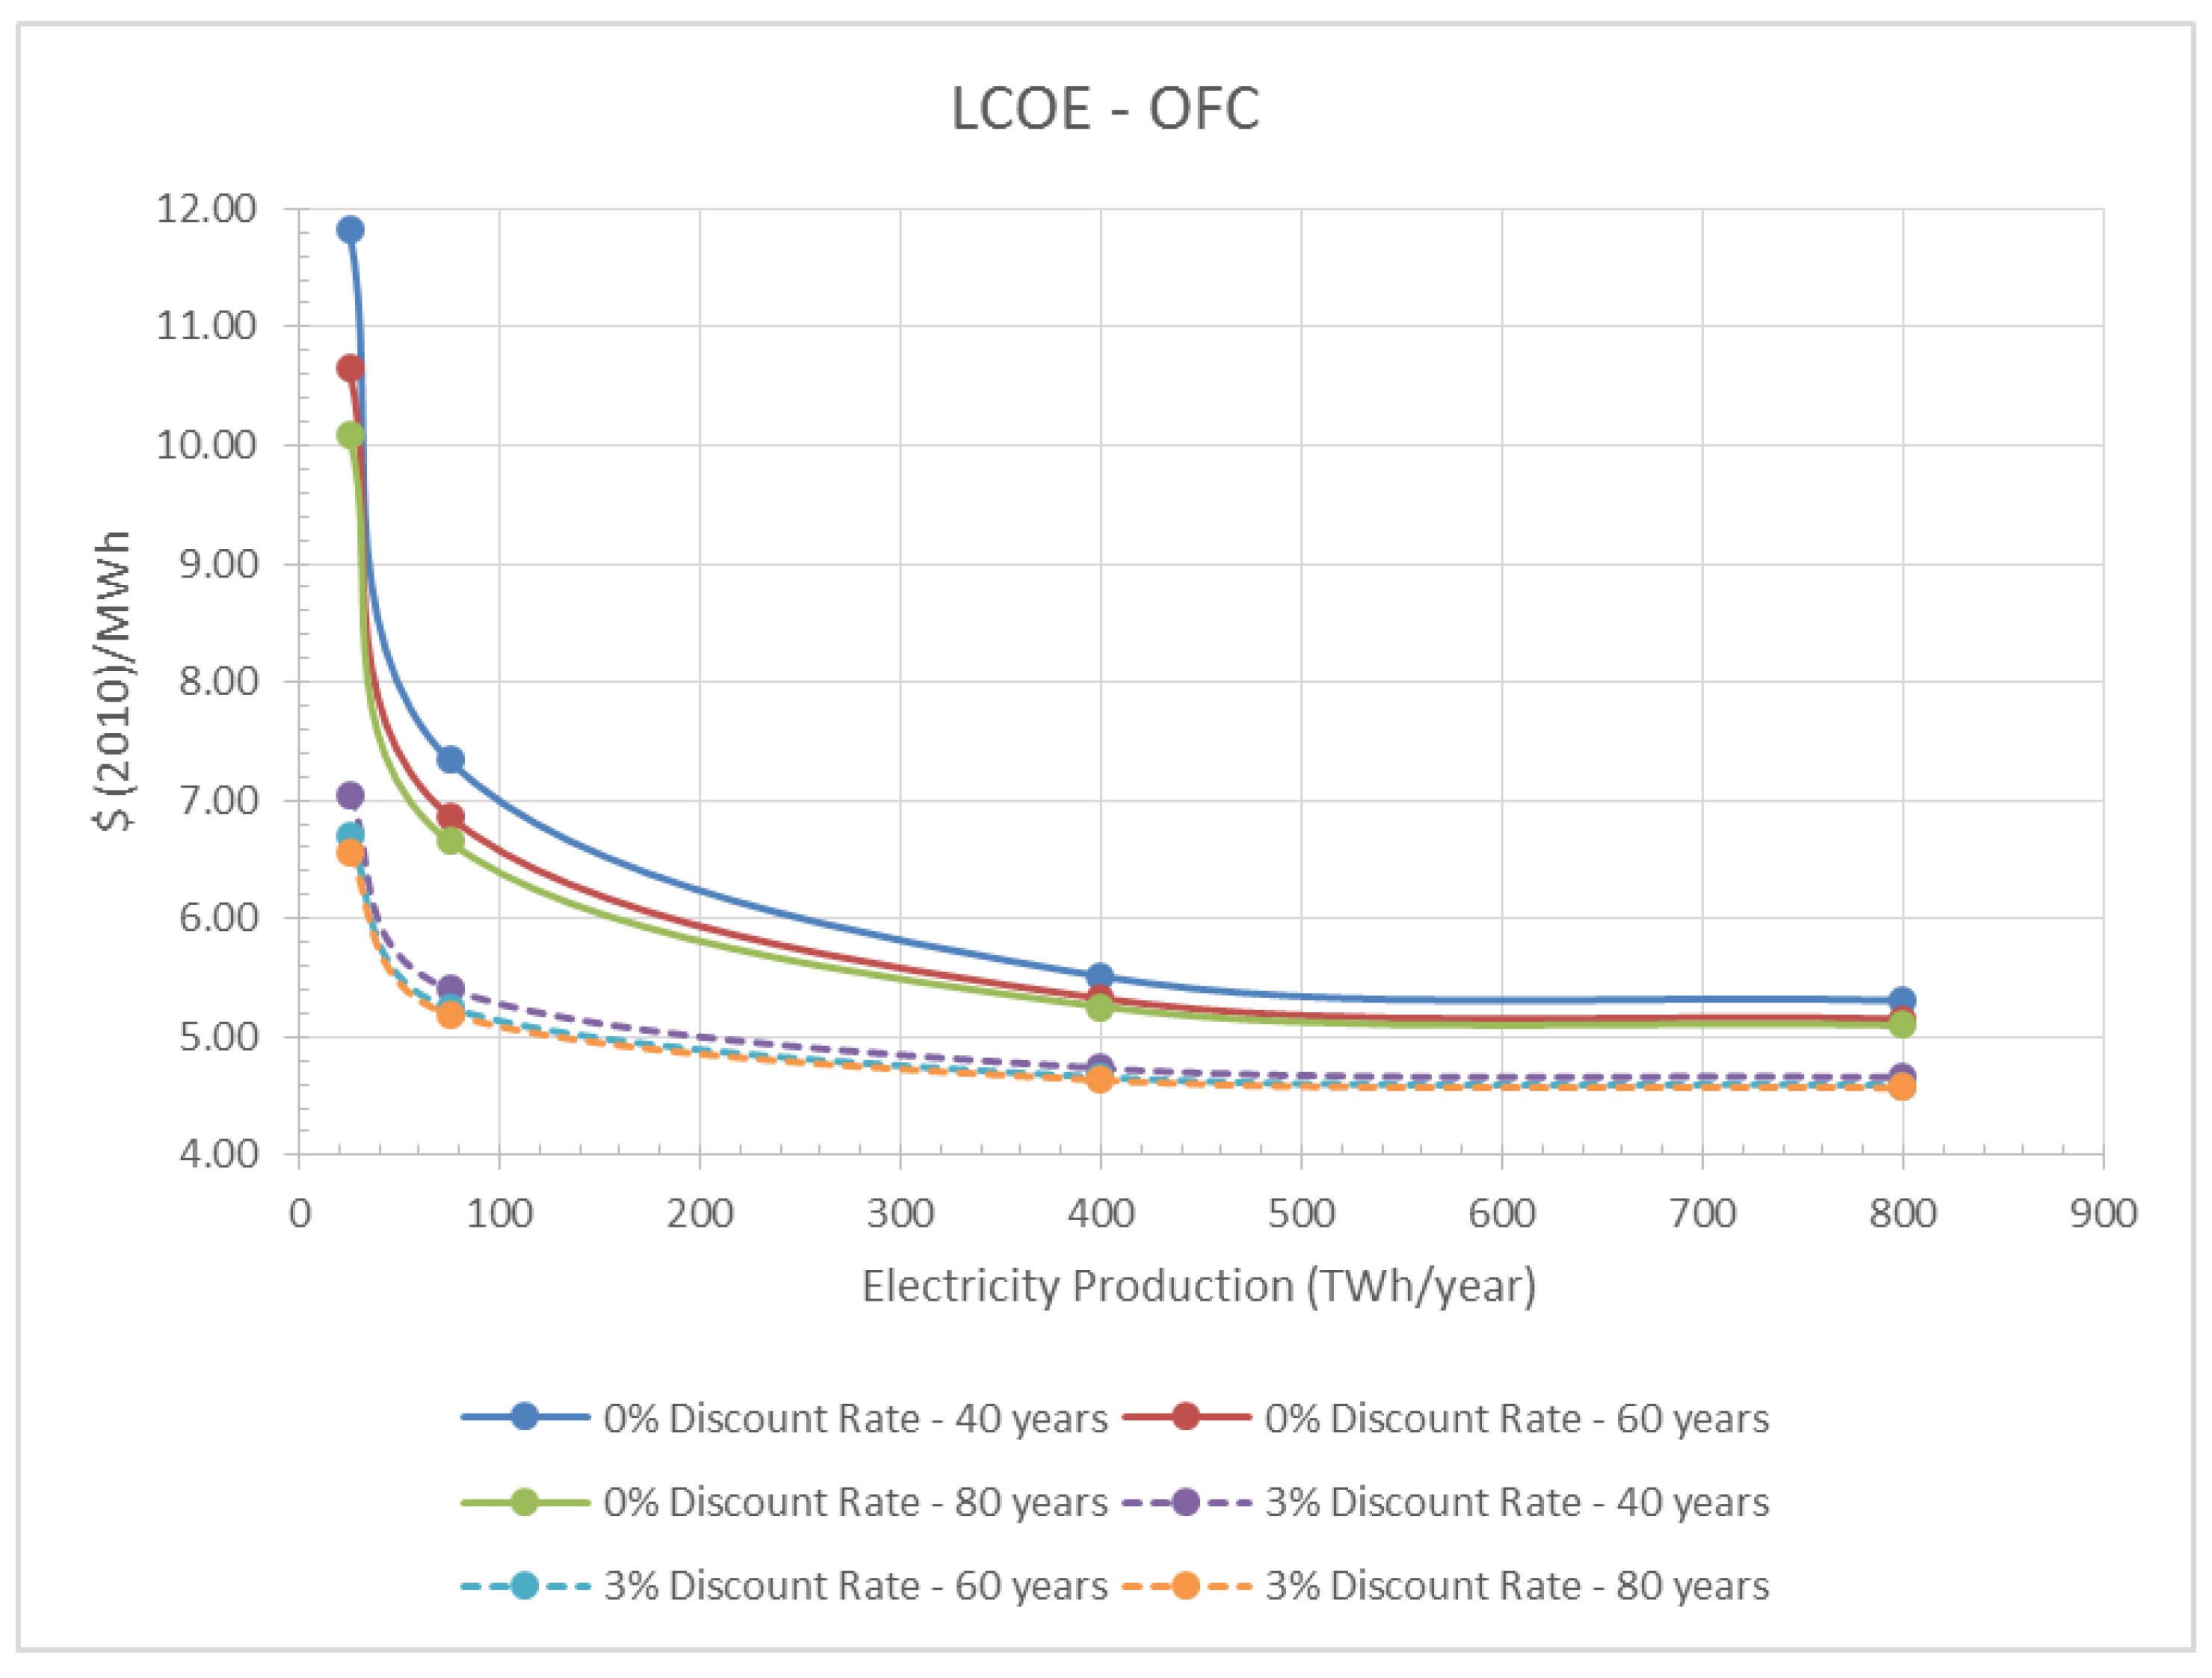
OFC Strategy
The results of the LCOE for the direct disposal strategy are presented in
Table 1.
Figure 6 represents these results for discount rates of 0% and 3%.
The tendency of the LCOE curves is to decrease when the electricity production increases, which is an expected result, because, even though the total cost in $ is higher, this cost increment is thoroughly compensated by the increase in MWh.
From these curves, it can also be noted that the LCOE decreases when the NPP operational lifetime is higher. This happens because, when the NPP lifetime is higher, more years of generating profits are taken into account, which compensates the costs of the back-end facilities’ operational years.
However, the decrease of the LCOE is not proportional to the number of years the operational lifetime is increased: from 40 years to 60 years, the reduction is higher than from 60 to 80 years. This happens because the factors that are applied to the different costs have exponential values, so the LCOE decreases rapidly for low capacities and slower when the capacity increases.
Furthermore, when the discount rate is increased, both the effect of the variation in the NPP operational lifetime and the total LCOE are reduced. Additionally, another observation that can be made is that, for capacities higher than 400 TWh/year, the curve becomes almost flat, which is due to the fact that the increase in the cost is really low compared to the increase of capacity.
- ➢
Partial Recycling Strategy
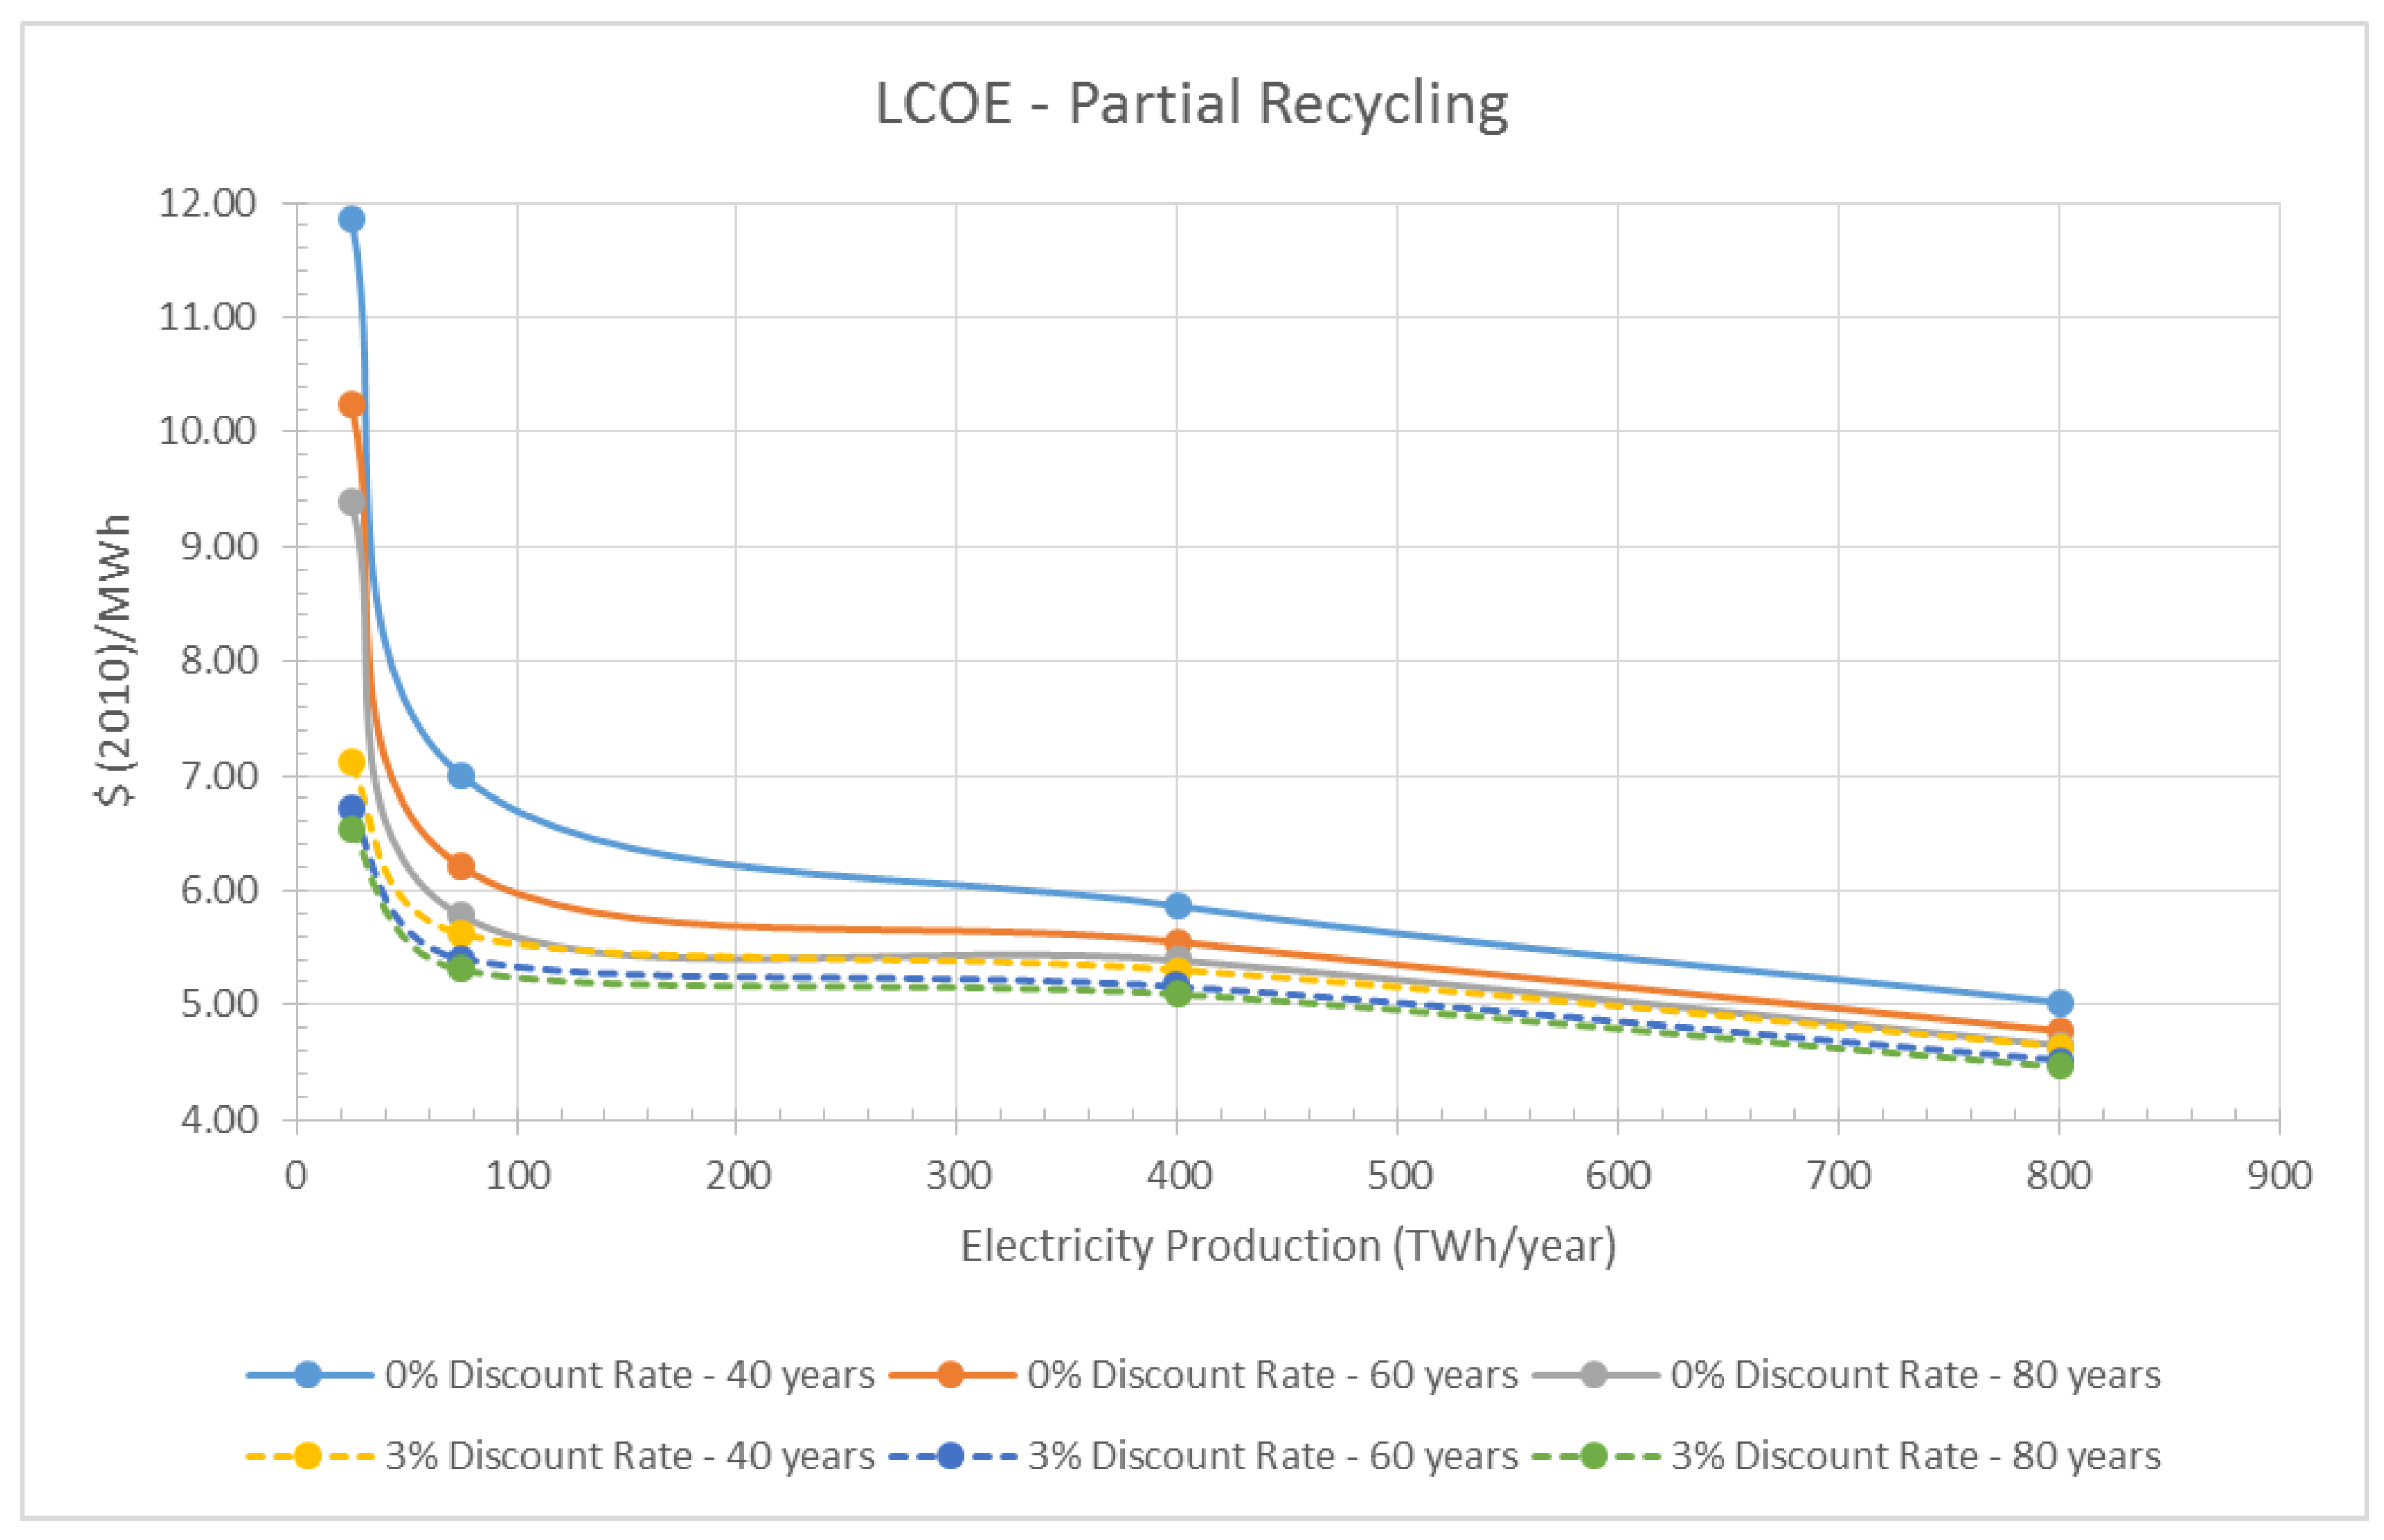
The results of the LCOE for the partial recycling strategy are presented in
Table 2.
Figure 7 represents these results for discount rates of 0% and 3%.
As it can be observed in
Figure 7, the tendency of these curves is very similar to the previous case: the LCOE decreases when the electricity production increases, and the effect from the NPP operational lifetime is the same as observed before.
Nevertheless, the discount rate has a minor effect on the costs compared to the previous case, and a change in the slope of around 400 TWh/year is observed. This is due to the fact that the model used to calculate the reprocessing facility costs is a piecewise function of the UOX heavy metal production: for capacities lower than 400 TWh/year, the sub-function is linear, and for higher capacities, the sub-function follows a scaling law. This way, the change from a steeper slope to a less pronounced one in 400 TWh/year entails a downturn in the LCOE function.
- ➢
AFC Strategy
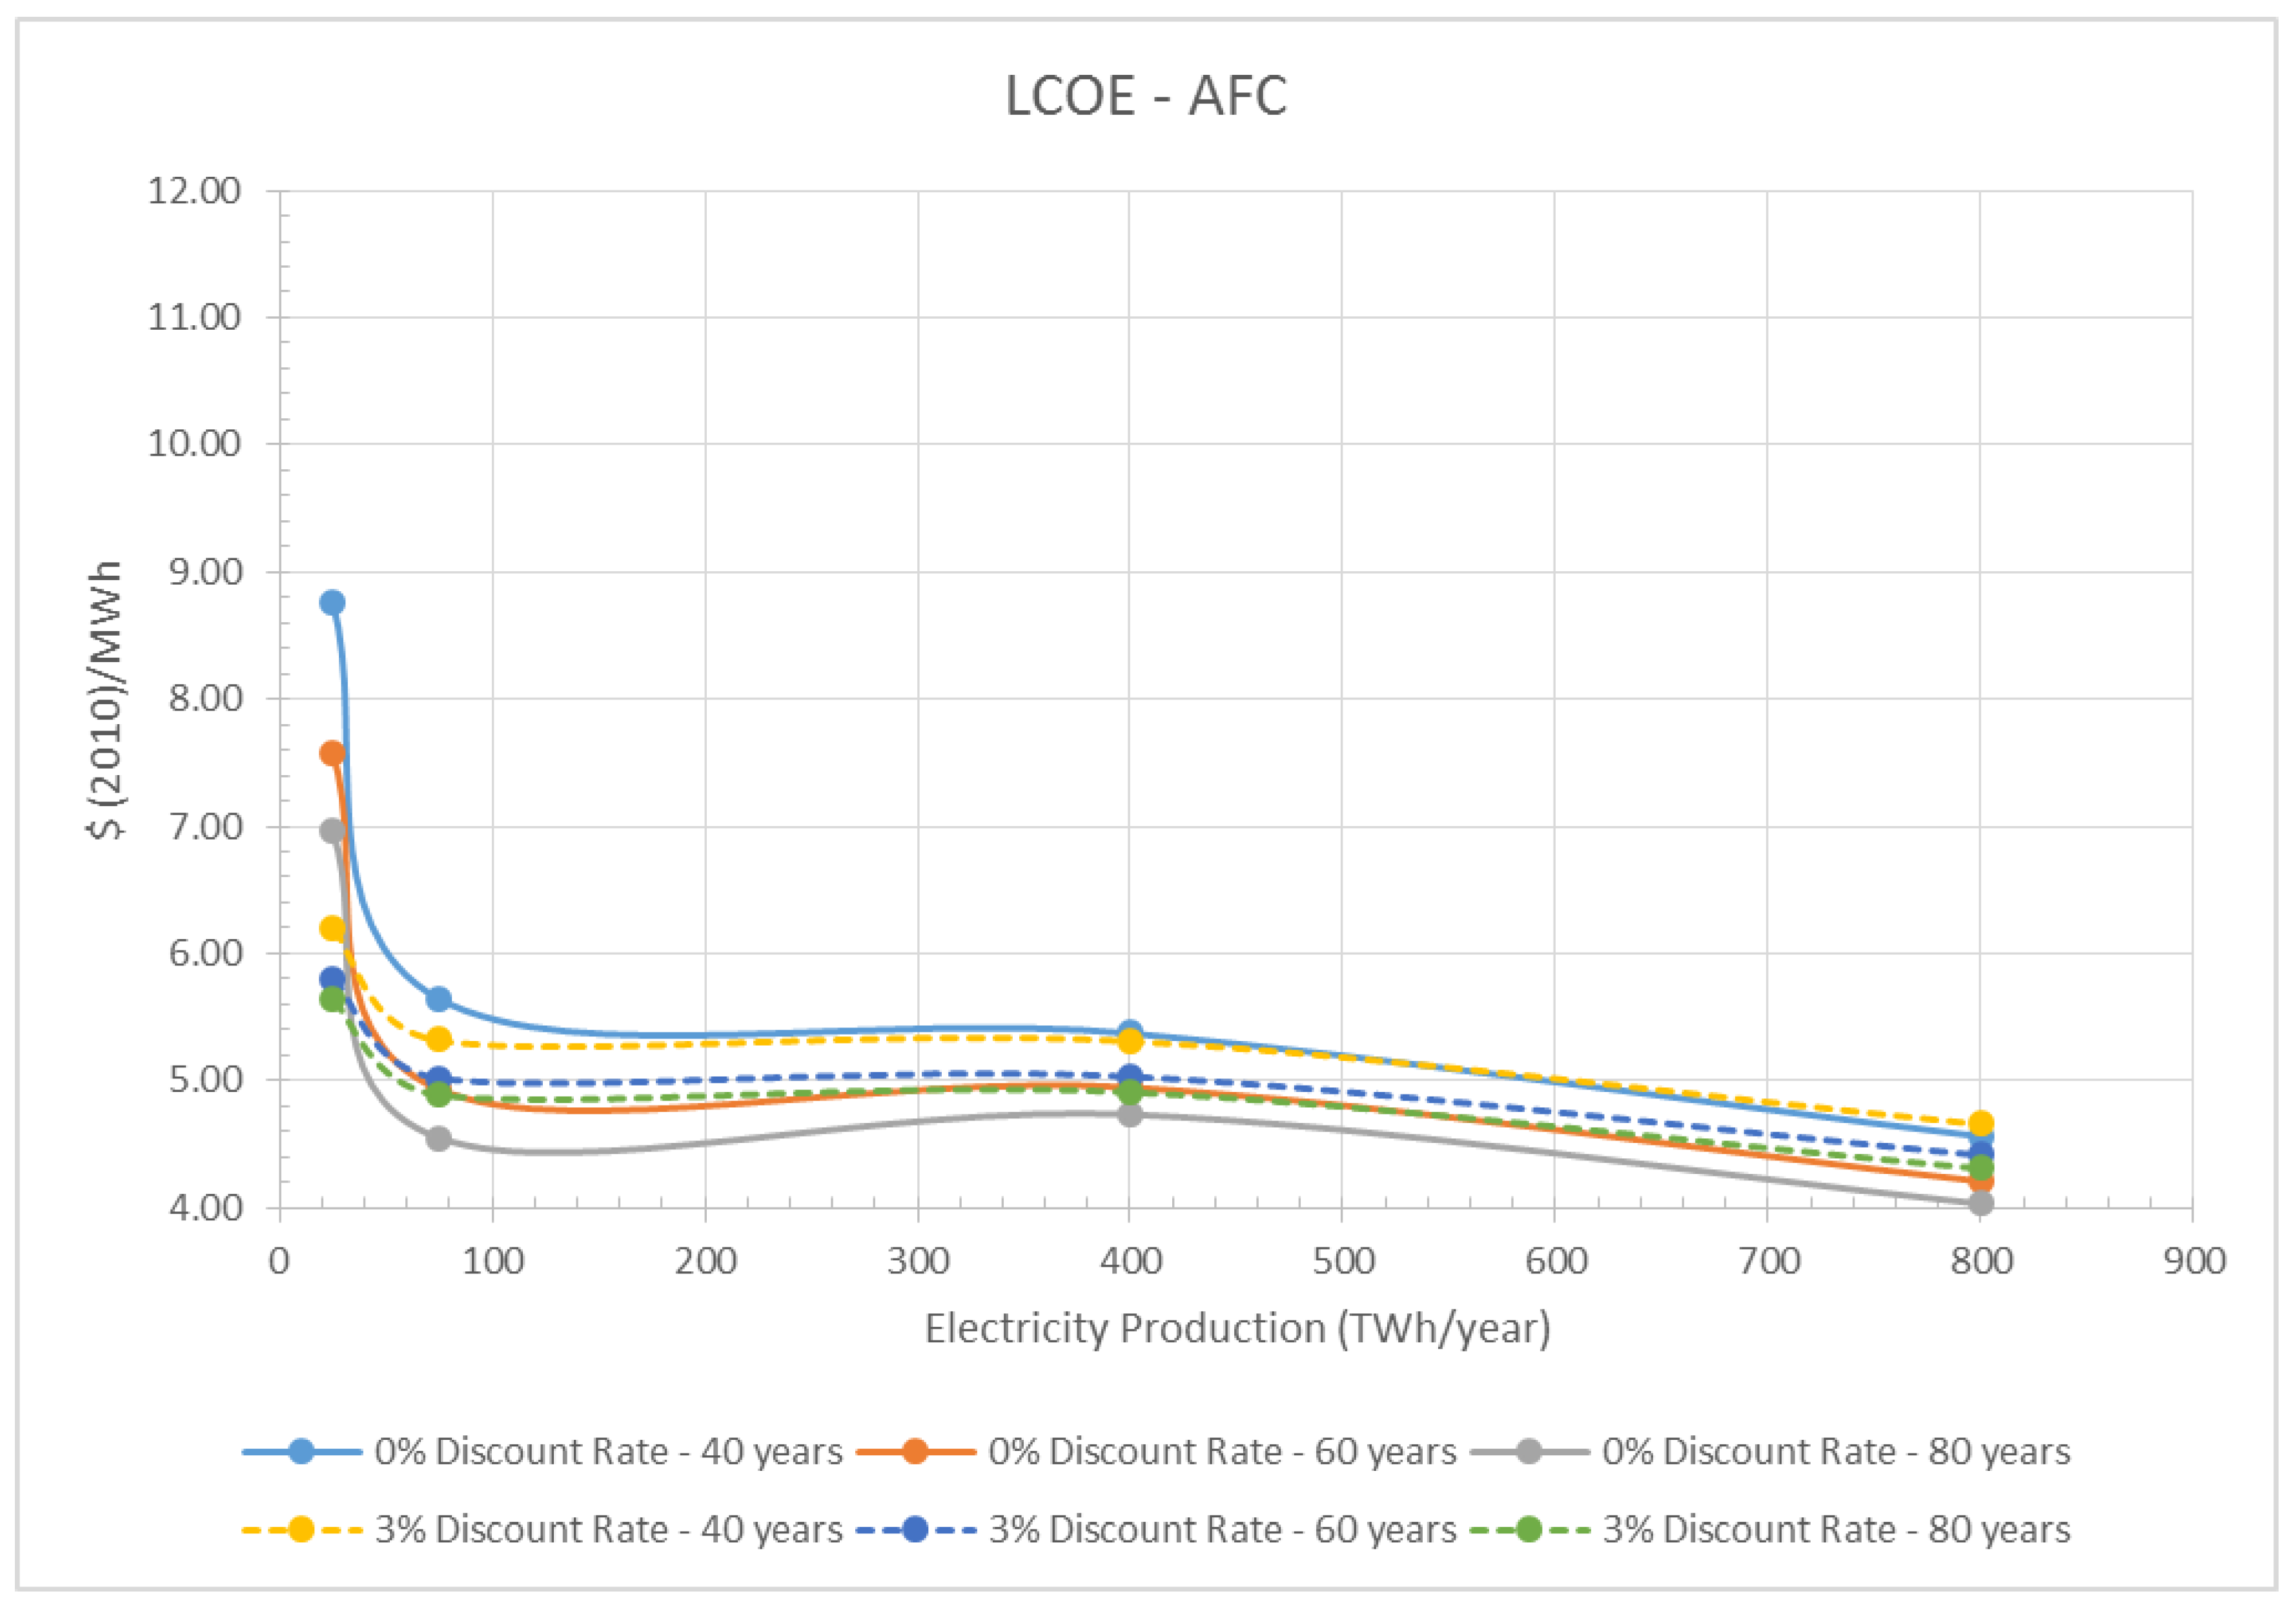
The results of the LCOE for the AFC strategy are presented in
Table 3.
Figure 8 represents these results for discount rates of 0% and 3%.
In
Figure 8, it can be observed that the effect of the NPP operational lifetime is higher than in the previous cases studied. This happens because the investment costs are higher for the AFC strategy, so the number of years the NPP is operating has a stronger impact on the cost.
It can also be noted that there is the same tendency as in the partial recycling strategy, which happens, as explained before, because of the scaling law applied from 400 TWh/year onwards.
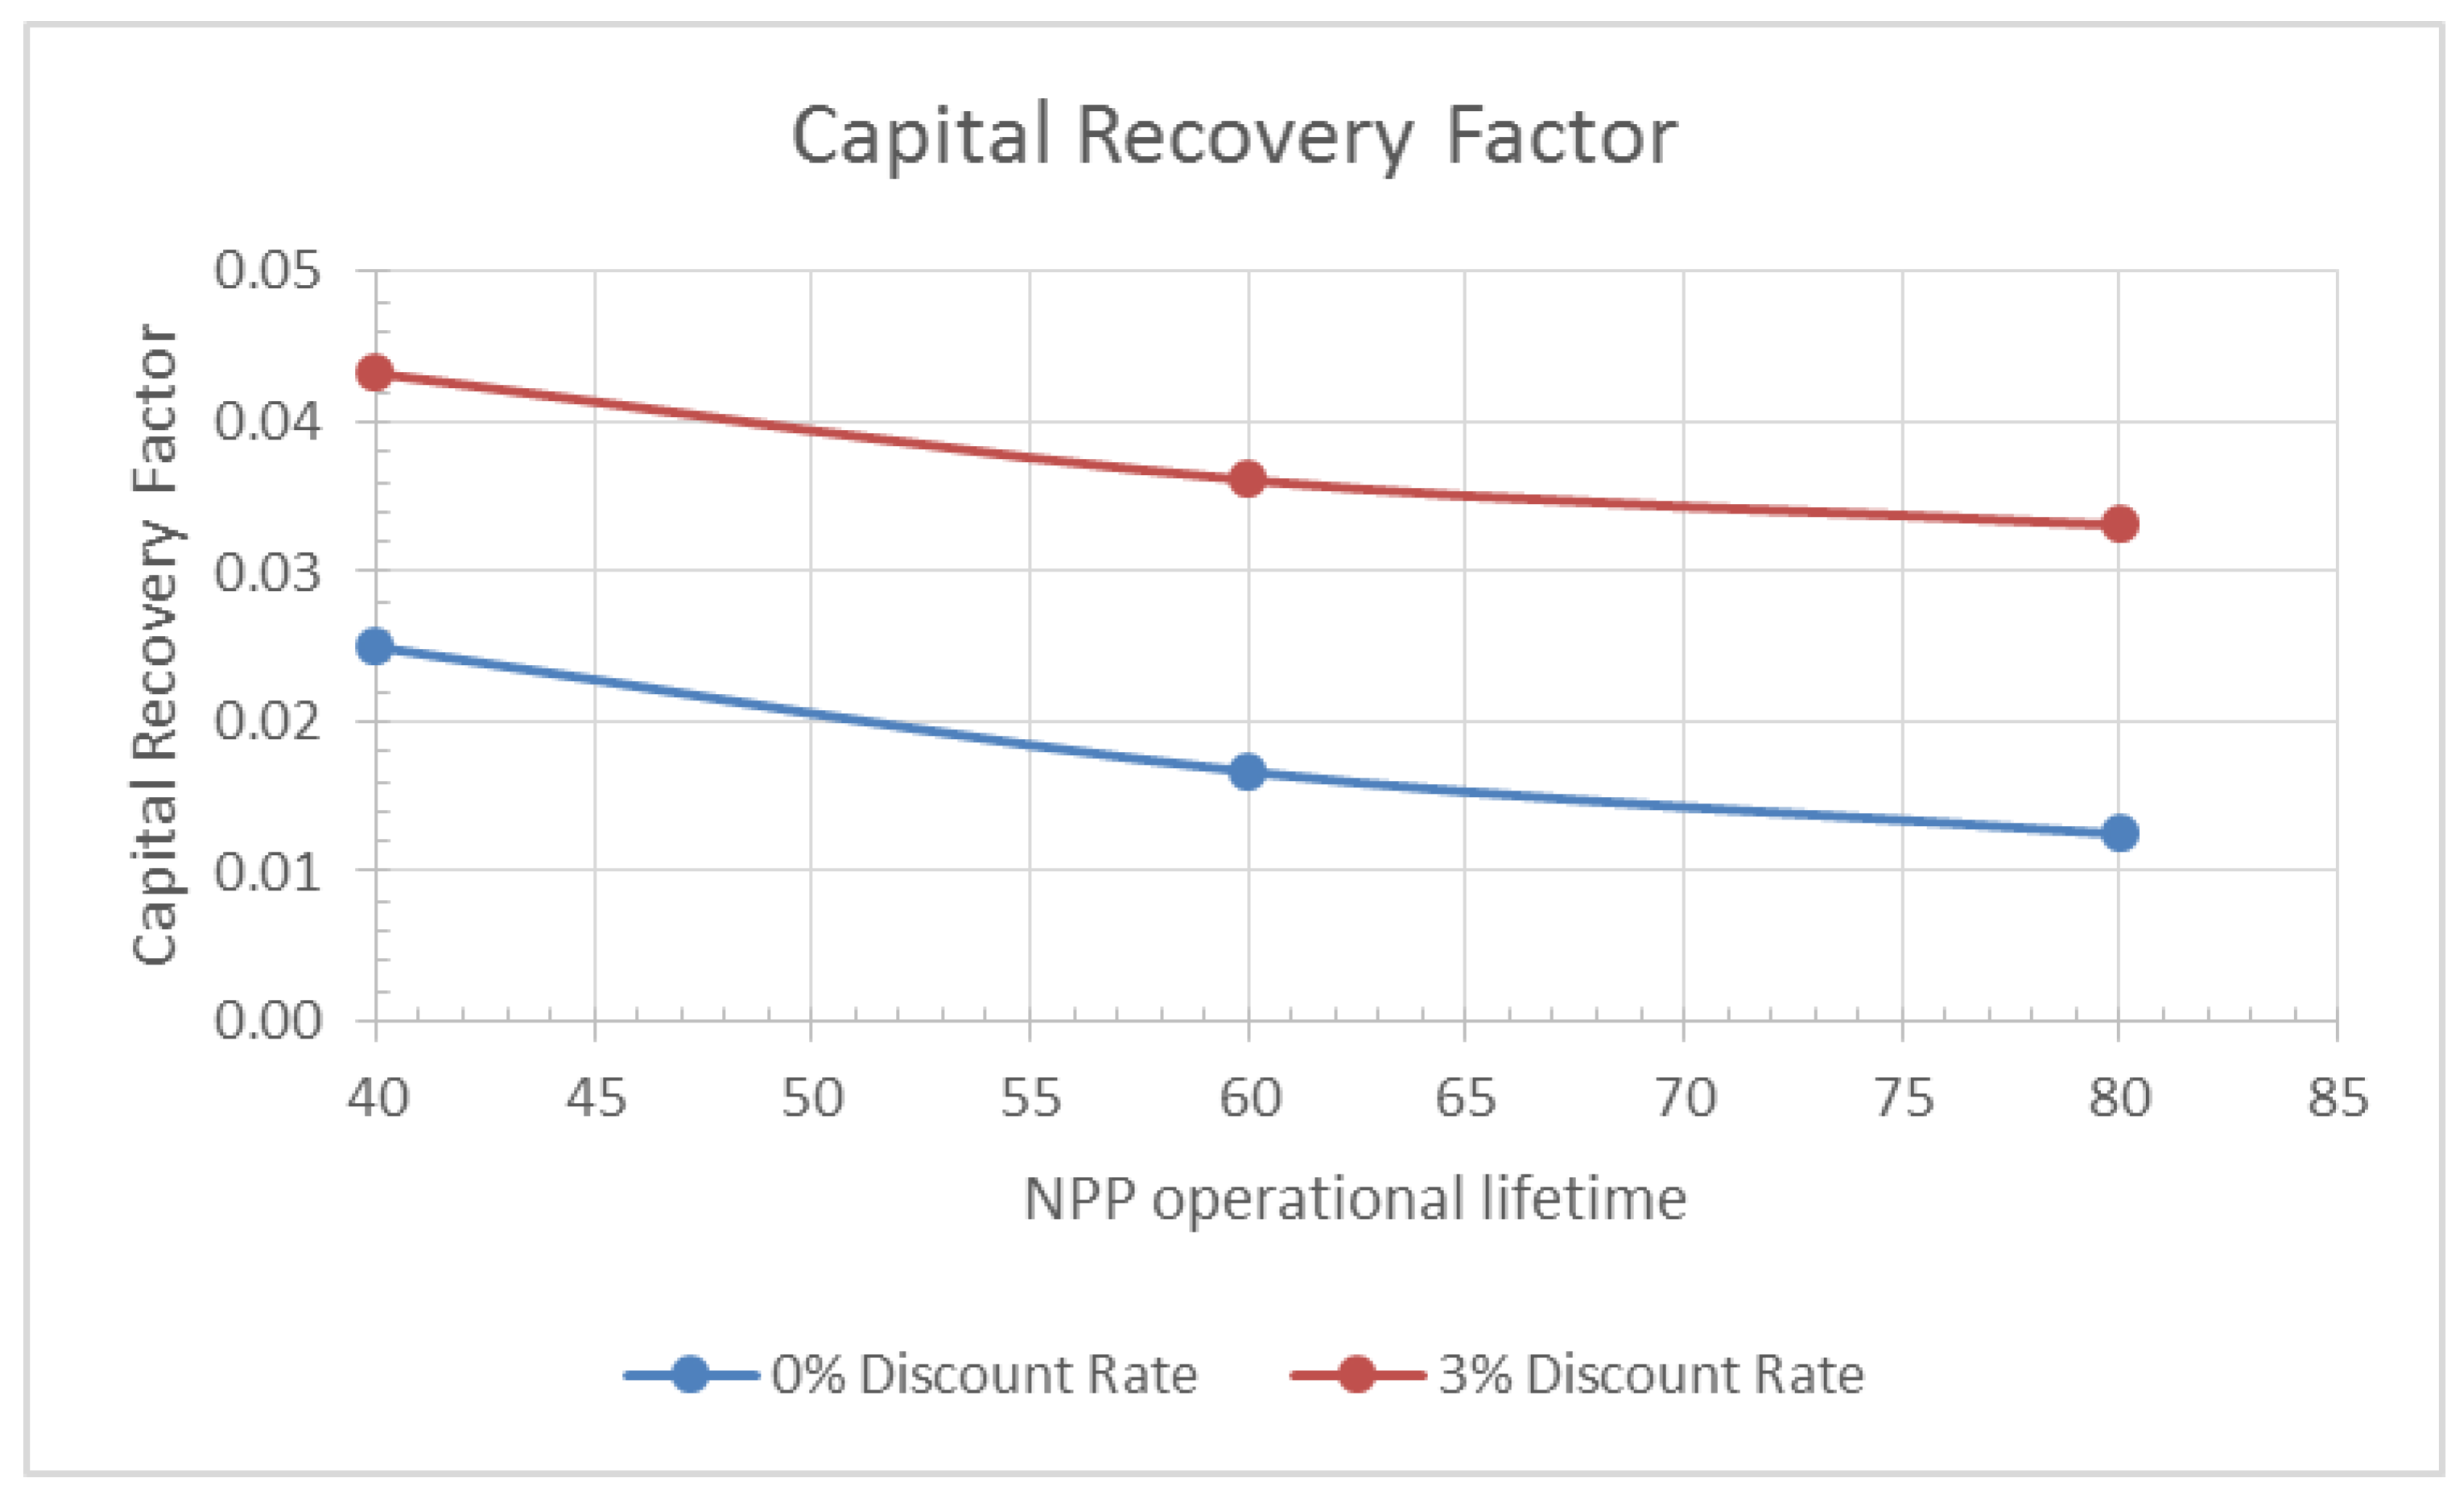
Finally, in order to visualize the non-linearity observed when the NPP operational lifetime is increased (the cost increase is not the same from 40 to 60 years as from 60 to 80 years),
Table 4 and
Figure 9 present the capital recovery factor.
As it can be observed, the increase in the capital recovery factor is lower from 60 to 80 years than from 40 to 60 years, which explains why the LCOE has a similar behavior.
3.2. Comparison of Different Strategies
After carrying out an analysis to compare the effect of the NPP operational lifetime on the LCOE, a comparison amongst the different back-end strategies is realized in order to be able to comprehend the variations in the costs when the electricity production changes.
Due to the similarities in the tendencies of the curves within the same strategy for different lifetime scenarios, this analysis is realized only for the 60-year NPP lifetime case.
The results of the LCOE for the different strategies are presented below in
Table 5 for discount rates of 0% and 3%.
Figure 10 and
Figure 11 show that the most profitable strategy is the AFC. This is due to the fact that, even though the FRs and the integral reprocessing plant costs are high, they are thoroughly compensated by the savings in the front-end cost, because of the reduction in the natural uranium requirements.
This result is clearly observed in
Figure 10. However, in
Figure 11, with a discount rate of 3%, when the electricity production is 400 TWh/year, the LCOE is higher in the AFC than in the OFC strategy.
Concerning the partial recycling strategy, the results are more variable. When a discount rate of 0% is applied, the costs for this strategy are lower than for the OFC strategy, except when the electricity production is 400 TWh/year. However, for a 3% discount rate, the LCOE for the partial recycling strategy is higher than the OFC LCOE in every case. This is due to the fact that, for the OFC strategy, the discount rate effect is higher than for the partial recycling.


 ,
, 


