Article

Study of the Injection Control Strategies of a Compression Ignition Free Piston Engine Linear Generator in a One-Stroke Starting Process

School of Mechanical Engineering, Beijing Institute of Technology, Beijing 100081, China
*
Author to whom correspondence should be addressed.
Energies 2016, 9(6), 453; https://doi.org/10.3390/en9060453
Submission received: 26 February 2016 / Revised: 25 May 2016 / Accepted: 2 June 2016 / Published: 14 June 2016

Abstract

:
For a compression ignition (CI) free piston engine linear generator (FPLG), injection timing is one of the most important parameters that affect its performance, especially for the one-stroke starting operation mode. In this paper, two injection control strategies are proposed using piston position and velocity signals. It was found experimentally that the injection timing’s influence on the compression ratio, the peak in-cylinder gas pressure and the indicated work (IW) is different from that of traditional reciprocating CI engines. The maximum IW of the ignition starting cylinder, say left cylinder (LC) and the right cylinder (RC) are 132.7 J and 138.1 J, respectively. The thermal-dynamic model for simulating the working processes of the FPLG are built and verified by experimental results. The numerical simulation results show that the running instability and imbalance between LC and RC are the obvious characters when adopting the injection strategy of the velocity feedback. These could be solved by setting different triggering velocity thresholds for the two cylinders. The IW output from the FPLG under this strategy is higher than that of adopting the position feedback strategy, and the maximum IW of the RC could reach 162.3 J. Under this strategy, the prototype is able to achieve better starting conditions and could operate continuously for dozens of cycles.

1. Introduction

Due to its unique structure and working principle, the free piston engine has the advantages of mechanical simplicity, low frictional losses, high efficiency, high suitability for multi-fuel or homogeneous charge compression ignition (HCCI) operation, and low emissions [1,2,3,4,5,6,7,8]. The history of the research and development on free piston engines can be divided into two phases [2]. Since Pescara invented the free piston engine in 1928, this type of engine developed quickly in applications like gas compressors or gas generators. However, limited by the factors summarised in [2], the research on these types of free piston engines stagnated after the 1960s. In recent decades, dramatic developments in the technologies of electrical motors and electronic control have made it possible to address the research difficulties of free piston engines, and most importantly, extended the research concerns to applications of a free piston engine coupled with a linear motor or a hydraulic sub-system [9,10,11,12,13,14,15,16,17,18]. The compression ignition (CI) free piston engine coupled with a linear motor (FPLG) is the very type of free piston engine studied in this paper, and a detailed illustration of structure and the operating principle of this type of free piston engine can be found in [2]. The CI FPLG has the characteristics of being difficult to start and control, crude combustion, and high cyclic fluctuations [2,19]. Thus, this type of FPLG requires accurate parameter matching, a new operation scheme and an advanced control strategy [4,5,6,14]. Previous literature studies on FPLG [14,19,20,21,22,23,24,25,26,27] mostly focused on spark ignition types. Some researchers performed research work on the hydraulic CI free piston engine (FPE), but nearly no reports are found on CI FPLG. In addition, we find in reports from the literature that both simulation and experiments on FPLG performed by related institutions are mainly focused on the systematic mechanism of the engine and there is essentially no specific research on the fuel injection strategy, which is very important for the starting and running performance of CI FPLG.
This paper mainly considers the study of the injection control strategies in the one-stroke starting process on CI FPLG prototype. For FPLG, there are two starting modes, one of which is the oscillation starting mode [28], i.e., the linear electric machine operates as a motor and drives the mover reciprocate left and right to compress the in-cylinder gas until the firing conditions are obtained. However, if the linear motor force is high enough to compress the gas to reach fire conditions in one stroke, then the FPLG can be started in the so-called one-stroke starting process. The one-stroke starting process can be described as follows: a linear motor drives the mover to compress the gas in the cylinder of one side (defined as “launch cylinder”), for example, for the LC in this paper, the fuel is injected into the cylinder at a proper moment. As the in-cylinder pressure and temperature of LC reach the ignition thresholds, the in-cylinder mixture will burn and expand to drive the mover to the other side; as a result, the engine begins to operate. The permanent magnet rod rigidly connecting to the pistons slides inside the linear generator’s stator coil, transforms the mover’s mechanical energy partly into electric energy and partly transfers to the opposed cylinder. The one-stroke starting process can shorten the starting time, and has a stronger robustness.
The fuel injection strategy involves the control of many parameters or items, such as injection timing, injection shape, injection pressure, injection pulse width, injection orifice diameter, injection angle, and injection fuel mass. Different injection parameters, which are related to several aspects of engine’s overall parameters, are set in the different design steps or operation conditions. The adjustable injection parameters must be optimised according to the operation conditions. Based on the basic model or existing scheme, sketchy parameters are selected to implement the simulation models; the results, such as indicated work and emission, will be used to optimise the scheme. Next, the optimised scheme will be applied on the prototype to obtain the test results, and the parameters are finally amended referring to the result. An injection fuel quality and injection timing map is obtained by varying the operation conditions and repeating the same process again.
Through calibrating in advance, the free piston control system adjusts the load, injection fuel value and injection timing to control the piston motion characteristics. While the injection fuel value is proportional to the energy released in the cylinder, the optimisation of injection timing corresponds to the in-cylinder combustion condition. According to the relevant literature [14,19,20,21,22,23,24,26,27], almost all of the injection schemes use a position injection strategy, i.e., when the piston moves to the set position, the fuel is injected into the cylinder. However, the motion characteristics of FPLG differ greatly from CE, and the details regarding the relationship between the injection position and the engine performance have not yet been reported. Another notable aspect is that the injection timing signal of CE is the crank angle value, which is not suitable for FPE. As mentioned above, the injection timing of FPE uses the piston position as the injection signal. However, under set conditions, while the piston velocity variation of CE with respect to the crank angle is very low, the variation and interaction of FPLG between cycles are obvious. Thus, even at the same position, the piston velocity may be very different, and the in-cylinder conditions, such as gas flow, differ greatly too. The in-cylinder gas flow condition has a great influence on combustion, and the piston velocity may better represent the in-cylinder gas flow condition. Thus, a question arises, is it better if the piston velocity signals are set as the injection trigger references? Based on the above analysis, this paper mainly considers two problems regarding the one-stroke starting process in a CI FPLG:
  • Using the piston position signal (“triggering position”) to trigger the injection system, study the characteristics of the one-stroke starting process.
  • Using the piston velocity signal (“triggering velocity”) to trigger the injection system, test if the velocity signal trigger is better.
In this research, a mathematical model is established based on the experimental rig; according to the mathematical model, the simulation model is designed and the model’s parameters are assigned after testing the the experimental rig parameters. Next, the in-cylinder gas pressure results of the simulation and the experiment are compared to verify the simulation model. Both the test and simulation methods are used to study the injection control strategy of the position feedback, and the simulation model is thus further amended. By differentiating the position signals with respect to the time interval and then smoothing it, a test of the velocity feedback injection control strategy is also performed. Finally, after analysing the results from the experiment and simulation, it is found that the strategy of velocity feedback can achieve a slightly higher IW and that the prototype can operate in a better status.

2. Prototype Test Bench

The prototype test rig of the CI FPLG is constructed as shown in Figure 1. The rig mainly consists of two two-stroke diesel engines, a linear motor, a high-pressure common rail fuel injection system, the control system of linear motor, and the scavenging system. Figure 2 shows the physical prototype, whose main specifications are listed in Table 1.

2.1. Test

The test rig is established to collect data, such as in-cylinder transient gas pressure, position of piston assembly, gas pressure in scavenging chambers, and so on. As shown in Figure 2, the in-cylinder gas pressure sensors are fixed in the cylinders’ heads, and the pressure signal is transmitted to the PC through the charge amplifier and the data acquisition (DAQ) card. The encoder of the selected commercial motor is used to measure the piston position. The test results can be read by software protocol, and the data acquisition program is developed in LabVIEW. The measurement devices used are listed in Table 2.

2.2. Motor Control

The driver controlled by the controller provides 380 V three-phase alternating current. The controller processes position signals from the encoder and exchanges information with a PC to enable the linear motor operate according to the program.

2.3. Scavenge

Because of the low scavenging efficiency of two-stroke engines, the external constant pressure air supply system is designed. The system contains a constant-pressure tank, an air-blower, and air inlet pipes. The air-blower compresses air into the constant-pressure tank, in which the gas pressure can be regulated at 1.25 bar to 1.5 bar. The tank supplies fresh air for scavenging chambers through air inlet pipes.

2.4. Injection

Fuel is provided by the high-pressure common rail fuel injection system. A high-pressure fuel pump sustains the fluid pressure for the rail. Fuel is sent into the injector through a high-pressure fuel tube and then is injected into cylinders after the needles have opened. When the mover of the linear motor moves to the pre-set position, a 24 V pulse signal from the controller is triggered and transmitted to the injection signal processing system. The signal triggers the injection signal processing system to generate the current that drives the electromagnetic valve used to open the injectors. After the trigger signal from the controller changes into a low level, the injector closes. Detailed fuel properties and injection parameters are listed in Table 3 and Table 4, respectively.

3. Mathematical Models and Model Validation

3.1. Mathematical Models

3.1.1. Dynamic Model

Figure 3 shows the force diagram of the FPLG mover. The mover contains two piston assemblies and a linear motor slider; all three of the parts are rigidly connected. The sum of forces acting on the moving parts determines the motion character of the mover. According to Newton’s Second Law, the dynamic model in the cycle without combustion can be described as:
m d 2 x d t 2 = δ F motor F f + ( p Lc p Rc ) A c + ( p Rs p Ls ) A s ( δ = ± 1 )
where the reference position for the piston stroke x is at the middle point of the prototype, friction force Ff is the sum of friction between the piston rings and the cylinder wall, the slider and the coil, and the rods and the seal rings. Fmotor is the electromagnetic force that acts on the slider. According to the working principle, in the first cycle of the one-stroke starting process, gas in the LC is compressed by the linear motor, and then the electrical energy is transformed into gas compression energy; in the expansion stroke, the IW of the LC or RC is absorbed partly by the linear motor. Thus, in the first cycle when the gas of the LC is compressed, Fmotor is positive; subsequently, it becomes negative, as shown in Equation (1). The in-cylinder gas pressures pRc and pLc act on the heads of the respective pistons, whereas the scavenging back pressures pRs and pLs act on the piston chambers.

3.1.2. Thermodynamic Model

In the one-stroke starting process, when the in-cylinder gas is compressed, the thermodynamic process in the cylinder can be described by:
{ d p Lc d t = γ p Lc V L d V L d t + γ 1 V L d Q Lht d t d p Rc d t = γ p Rc V R d V R d t + γ 1 V R d Q Rht d t
where QLht and QRht are the heat transfer losses that occur through the cylinder wall, the piston head and the cylinder head, respectively. Because the in-cylinder gas temperature has a great influence on the ignition point of diesel, the factor of heat transfer must be considered in the thermodynamic model. The heat transfer process of the left side is modelled according to Hohenberg [22]:
Q Lht t = α A ( T T w )
where:
α = 130 V 0.06 ( p 10 5 ) 0.8 T 0.4 ( U _ + 1.4 ) 0.8
The right side has the same heat transfer model as the left side. When the gas-fuel mixture burns in the combustor, the thermodynamic model changes to:
{ d p Lc d t = γ p Lc V L d V L d t + γ 1 V L ( d Q L d t d Q Lht d t ) d p Rc d t = γ p Rc V R d V R d t + γ 1 V R ( d Q R d t d Q Rht d t )
where the zero-dimensional single zone model is used to describe the combustion heat release process in the cylinder.
The Wiebe function is widely used as a heat release model. Although the prototype’s cylinder bore is only 60 mm, the operating frequency is relatively lower than that of conventional high-speed diesel engines. Thus, the single-stage Wiebe function is chosen. Taking QL as an example, the combustion heat release model is:
d Q L d t = Q in a ( n + 1 ) t comb ( t t 0 t comb ) n exp [ a ( t t 0 t comb ) n + 1 ]
The model of QR has the same form as that of QL.

3.1.3. Friction Force Model and Electromagnetic Force Model

As FPLG does not have a crankshaft and connecting rod mechanism, there is no piston side thrust, and the amount of friction is greatly reduced. The friction force is modelled as including both static and viscous components [6]:
F f = F s + f × d x d t
where Fs is the static friction force, f is the viscous friction force coefficient. During the starting process, the piston velocity and the in-cylinder temperature are low; thus, the viscous friction is not considered. The linear motor alternator force is proportional to the stator currents:
F m o t o r = k f × I
When the linear alternator functions as a linear generator, the induced electromotive force (EMF) can be described as:
ε = k v × d x d t
Thus, the electromagnetic force induced by the linear generator is proportional to the piston velocity and is given by the following equation:
F m o t o r = k f k v 1 R l + R s + j X d x d t = C e v
where I is the current in the stator, kf is the thrust force constant, kv is the back EMF constant, Rs and Rl are internal resistance of the coil and external load resistance, respectively, and X is the reactance of coil.

3.1.4. Ignition Delay Model

Because of the characteristics of the CI engine, a period of time is required for the gas pressure and temperature to reach the ignition threshold. In other words, the engine has an ignition delay period from fuel injection to combustion that lasts approximately 1 to 4 ms. We adopt the ignition delay model established by Wolfer [22] in 1938:
τ = 0.44 p i 1.19 e 46.50 T i
where pi and Ti represent the in-cylinder gas pressure and the temperature when injection occurs, respectively.

3.2. Model Validation

After establishing the simulation model based on the physical equations, the parameters in the model should be assigned and calibrated according to the experimental devices and the experimental conditions. For example, the specific heat ratio γ is considered over the range of 1.33 to 1.37. In the model of the combustion heat release rate, the parameter values, which are the key factors that influence variation of in-cylinder gas pressure, must be set precisely. In addition, several prototype parameters, such as bore, maximum stroke, and cycle fuel injection mass, should be checked and assigned in the model. All of the parameter values are finally set according to the parameters of Table 1, Table 3, Table 4 and Table 5.
Figure 4 shows the Simulink model of the working processes of the CI FPLG. Corresponding to Equation (1), the “force parts”—“Fe”, “Ff”, and “engine”— represent Fmotor, Ff, and the sum of the gas pressure forces acting on pistons, respectively. The acceleration value “a” is obtained by dividing the sum of the forces by the mover assembly mass “m”. Velocity value “v” is obtained by integrating “a” with respect to clock time, and position value “x” is obtained by integrating “v”. Signals “v” and “x” feedback to “force parts” to participate in computing, and they are set as the injection signals in the injection process.
Figure 5 shows the diagram of the “engine” part. The stateflow blocks—“mode select 1” and “mode select 2”—use the signals of “x”, “t”, “v” and “p” to indicate the logical relationships of the system operation conditions, such as the combustion process, the scavenge process, and the rebound process. The stateflow block control the injection strategy mode and the injection triggering signal thresholds. Blocks—“cylinder 1” and “cylinder 2”—compute the sum of the in-cylinder gas pressure and the scavenging back pressure forces using corresponding sub-modules.
After checking and calibrating the parameters, the simulation model is run; the calculated results of piston velocity-position traces and in-cylinder gas pressure are shown in Figure 6 and Figure 7, respectively. The simulated result agrees with the tested result very well. Thus, the model is feasible for simulation of the characteristics of the two injection control strategies.

4. Results and Discussion

Both simulation and experimental studies are conducted in this research. By comparing the results, on the one hand, the simulation result can help select the proper operation parameters for the test, and can help judge the errors from operation or measurement; on the other hand, the experimental results can verify the model’s validity and precision and further improve the model for subsequent research. In order to understand the in-cylinder process intuitively. The reference position for the injection “triggering position” is at the exhaust port close position of the corresponding cylinder.

4.1. Position Feedback Injection Strategy

4.1.1. Comparison of Test and Simulation Results

Figure 8 shows the test result of the in-cylinder gas pressure dynamics under the condition of changing injection triggering position. Figure 8a,b is the magnified views of in-cylinder gas pressure in the LC and the RC. To facilitate a comparison with the simulation model, the same changes of the injection triggering position are set in the model to obtain the corresponding in-cylinder gas pressure curves shown in Figure 8c,d. The values and timings of peak in-cylinder gas pressure of the simulation model are found to be in approximate agreement with the test results. The imaginary lines, which indicate the variation tendency of LC and RC, are also in agreement between the simulation and the experiment. Thus, we determine that both the simulation and the test result are reasonable and that the simulation model is appropriate for use in studying injection control strategies.

4.1.2. Engine Performance Analysis

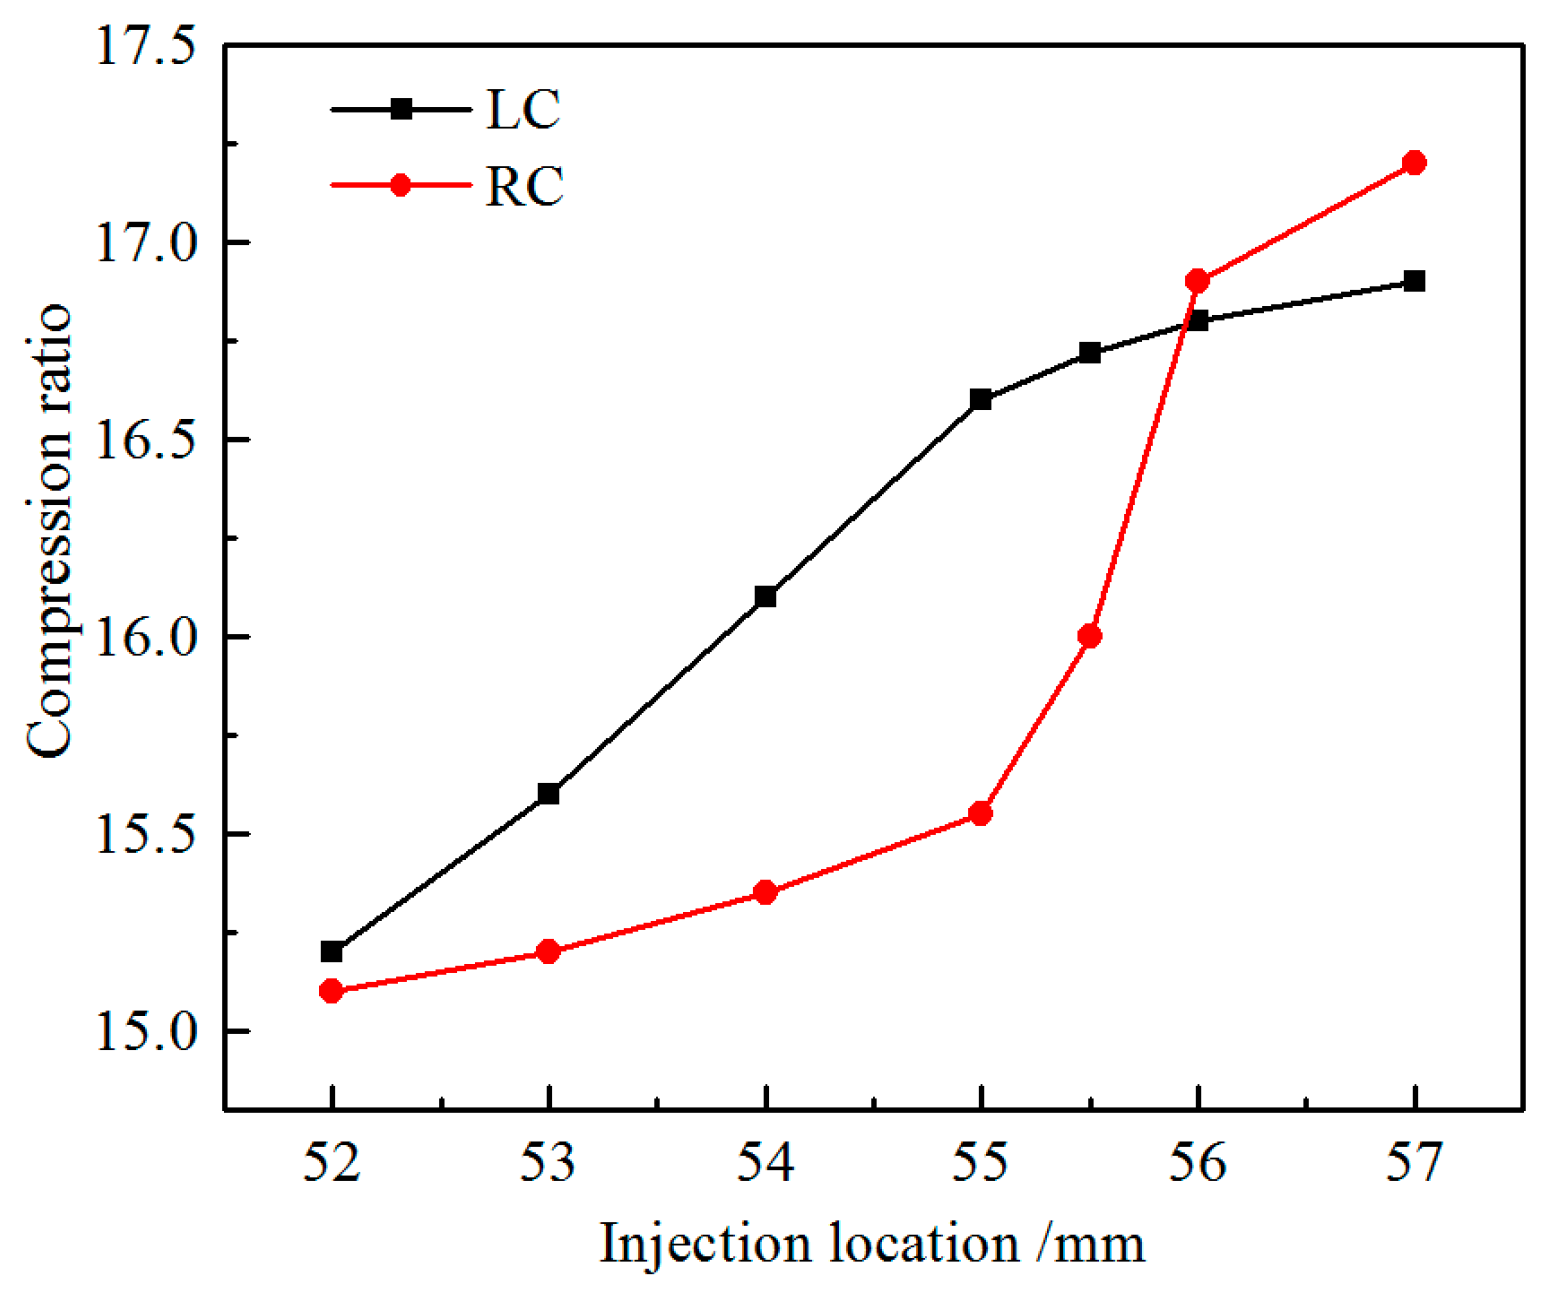
Without the crankshaft’s restraint, the compression ratio of FPLG is variable. On this test platform, the parameter can be calculated according to the mover position signal. Because the later ignition occurs before TDC, the compression ratio is higher. Figure 9 shows that, as the “triggering position” value increases, the compression ratio of the LC and the RC both increase. However, the rates of increase of the compression ratios of the LC and the RC are different: with the “triggering position” value increasing from 52 mm to 55 mm, the compression ratio of the LC increases at a relatively higher rate and then increases at a lower rate, whereas the RC first increases at a lower rate and then increases at a higher rate. As the compression energy of the LC is from a linear motor, the force of the motor is limited, and when the compression ratio is high enough, the motor force and the mover’s inertia cannot compress the in-cylinder gas any further.
Regarding the RC, the compression work is from the IW of the LC, when the injection position value is less than 55 mm, although the IW of LC rises as shown in Figure 10, relatively more IW of the LC is transformed into electrical energy consumed by the linear generator; thus, the compression ratio of RC rises slowly; when the “triggering position” value increases to between 55 mm to 56 mm, the good combustion heat release characteristic of the LC leads a higher growing rate of the compression ratio of the RC; when the ‘triggering position’ value increases to 57 mm, the IW of the LC decreases and the growth rate of compression ratio of RC reduces.
As shown in Figure 11, the peak in-cylinder gas pressure of the LC decreases with the increase of the “triggering position” value.
As shown in Equation (12), the thermal energy increment of gas in the cylinder includes the compression work due to the reduced cylinder volume, the quantity of heat produced by fuel combustion, and the loss caused by heat transfer:
E gas = W + Q L + Q Lht
The in-cylinder pressure from the initiation of burning to TDC is caused by an additive effect of the gas compression, the increased amount of substances, and the heat release. For the “launch cylinder”, the released heat is the major contributor to the pressure. Earlier injection timing causes a large amount of the fuel to burn during the compression stroke, resulting in higher in-cylinder gas pressure.
Partly differing from the LC, the peak in-cylinder gas pressure of the RC increases as the “triggering position” value changes from 52 mm to 55 mm, and then decreases if the “triggering position” value exceeds 55 mm. This behaviour occurs because, without the flywheel (energy storage equipment) and crankshaft’s restraint, the IW of the LC is partly converted directly into the compression energy of the RC. Thus, the in-cylinder gas pressure of the RC is mainly affected by both the IW variation of the LC and the injection timing variation of the RC. In addition, in the “triggering position” range of 52 mm—55 mm, the IW increase of the LC is the main cause of the increase of the peak in-cylinder gas pressure of the RC. When the injection position value is over 55 mm, the injection timing becomes the primary reason why the peak in-cylinder gas pressure of the RC decreases.
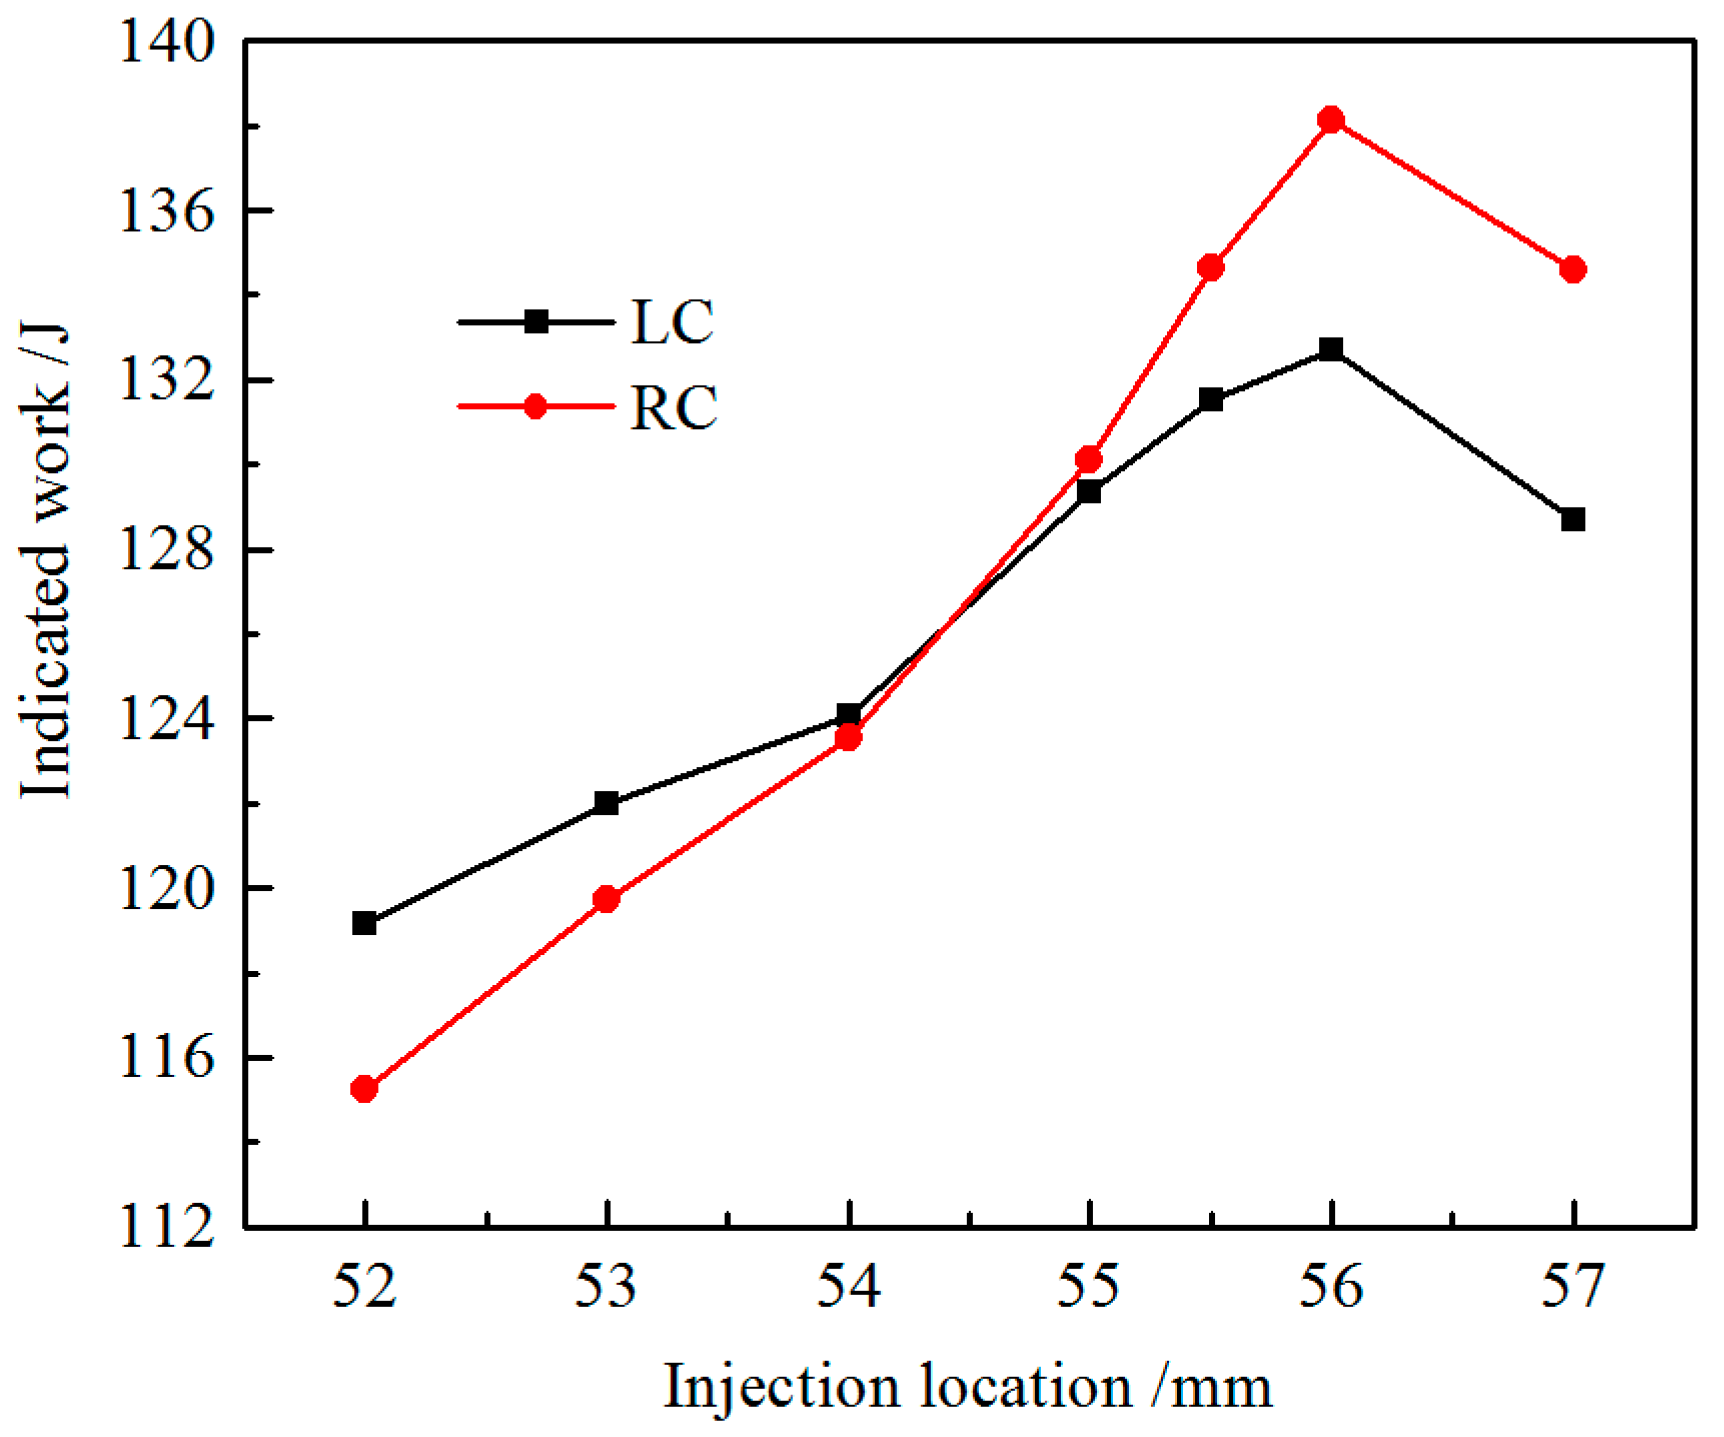
Based on the in-cylinder gas pressure and the mover position data, the IW can be calculated as a means to represent the work features of two cylinders. As shown in Figure 10, when the “triggering position” value is approximately 56 mm, the IW of the LC and the RC both achieve the maximal values (132.7 J of LC and 138.1 J of RC). This behaviour occurs because of the following processes: when the injection timing is too early, the poor combustion condition and the compression negative work cause the loss of the IW; when the injection timing is too late, a large fraction of the fuel is ignited after TDC and the constant volume degree of combustion declines, thereby causing the reduction of IW. We also find that when the “triggering position” increases before 56 mm, the IW of the RC increases more quickly than that of the LC. As mentioned above, in the expansion stroke of the LC, the piston assembly motion is directly affected by the IW of the LC; the increase of the IW of the LC increases the compression ratio and the peak in-cylinder gas pressure of the RC, thereby causing the IW of the RC to increase. In addition, the increase of the “triggering position” value of the RC also increases the IW of the RC, i.e., both of these factors lead to the higher rate of increase of the IW of the RC. Certainly, this phenomenon reflects the one-stroke starting process mechanism, rather than the performance differences of the two cylinders.
According to analysis described above, in the starting process under the position feedback injection strategy, the change laws of the compression ratio, the peak in-cylinder gas pressure, and the IW of the “launch cylinder” LC, along with the change of the “triggering position” values, are similar to the change laws of the CE. However, because of the characteristic of FPLG, the laws of the RC are different from the laws of the CE. For example, the shape of the peak in-cylinder gas pressure of the RC has the form of a parabola. In the one-stroke staring process, because the compression energy of the LC is from a motor, the characteristics of the LC are partly related to the linear motor force; the characteristics of the RC can reflect the FPLG operation features under the condition that the one-stroke starting succeeds in the LC. Considering the variation tendency of the IW, the “triggering position” value of 56 mm is optimised for the one-stroke starting process under this strategy.

4.2. Velocity Feedback Injection Strategy

During the research process, using the position feedback injection strategy, we found that after starting the engine, the prototype frequently misfired. As mentioned above, this phenomenon is mainly caused by the characteristics of FPLG, such as high interaction between cycles, high variation, and instability. At the same position, the mover’s velocity may vary substantially, and thus the in-cylinder conditions differ substantially as well.
For the FPLG, because of the lack of mechanical restraint, the thermal energy produced by combustion is first converted into the mover’s kinetic energy; thus, the mover’s velocity is relative to the last cycle’s combustion condition, and the interaction between cycles is caused by the mover’s motion. Thus, the velocity signal reflects the operation condition of the prototype, and an injection system using the velocity signal to optimise the injection timing should improve the operation performance.
This injection strategy uses the mover’s velocity directly: when the mover’s velocity reaches the pre-set “triggering velocity”, fuel is injected into the cylinder. In this research, we first run the simulation model to analyse this strategy briefly and obtain a feasible experimental parameter scheme; afterwards, the test result is obtained by conducting a series of tests.

4.2.1. Injecting at the Same “Triggering Velocity”

In this case, the “triggering velocity” values of the two cylinders are set to be the same. After modifying the simulation model in injection triggering mode and some other specific details, the simulation model was run. Figure 12a shows the values of the feature points, such as injection timing, exhaust port opening timing, and TDC. We find that in this “triggering velocity” range, as the “triggering velocity” value increases, the piston reaches the LDC and the RDC in advance, and the position value of the LDC decreases whereas that of the RDC increases. Figure 12b shows that, along with the increasing of the triggering velocity, the peak in-cylinder gas pressure of the LC declines in a linear tendency, whereas that of the RC increases linearly. As the “triggering velocity” value increases, the differences between the in-cylinder gas pressures of the two cylinders become obvious. The phenomenon is partly caused by the different compression work sources of the two cylinders during the one-stroke starting process--the gas of the LC is compressed by the motor force and that of RC is compressed by the IW of the LC. The compression work can influence the mover’s motion, and the motion characteristic will influence the combustion further.
According to the simulation results, when there is a big substantial difference of in-cylinder gas pressure between the two cylinders, the peak in-cylinder gas pressure can reach 14.7 MPa, which far exceeds the maximum gas pressure value under the injection strategy of position feedback.
Because the injection timing is determined based on the kinetic energy of the mover, the combustion condition is supposed to be less sensitive to cycle variation of the mover’s motion. Thus, the combustion efficiency of this strategy may be higher than that of the other control strategy.

4.2.2. Injecting at Different “Triggering Velocity” Values

Considering the asymmetry of the two cylinders above, in this part, the “triggering velocities” of two cylinders can be set as different values; thus, the difference problem between the two sides can be restrained.
The IW is calculated to estimate the engine’s performance under the injection strategy of velocity feedback and to make a comparison with the position feedback injection strategy. Figure 13 shows the IW of the LC vs. “triggering velocity”, and 
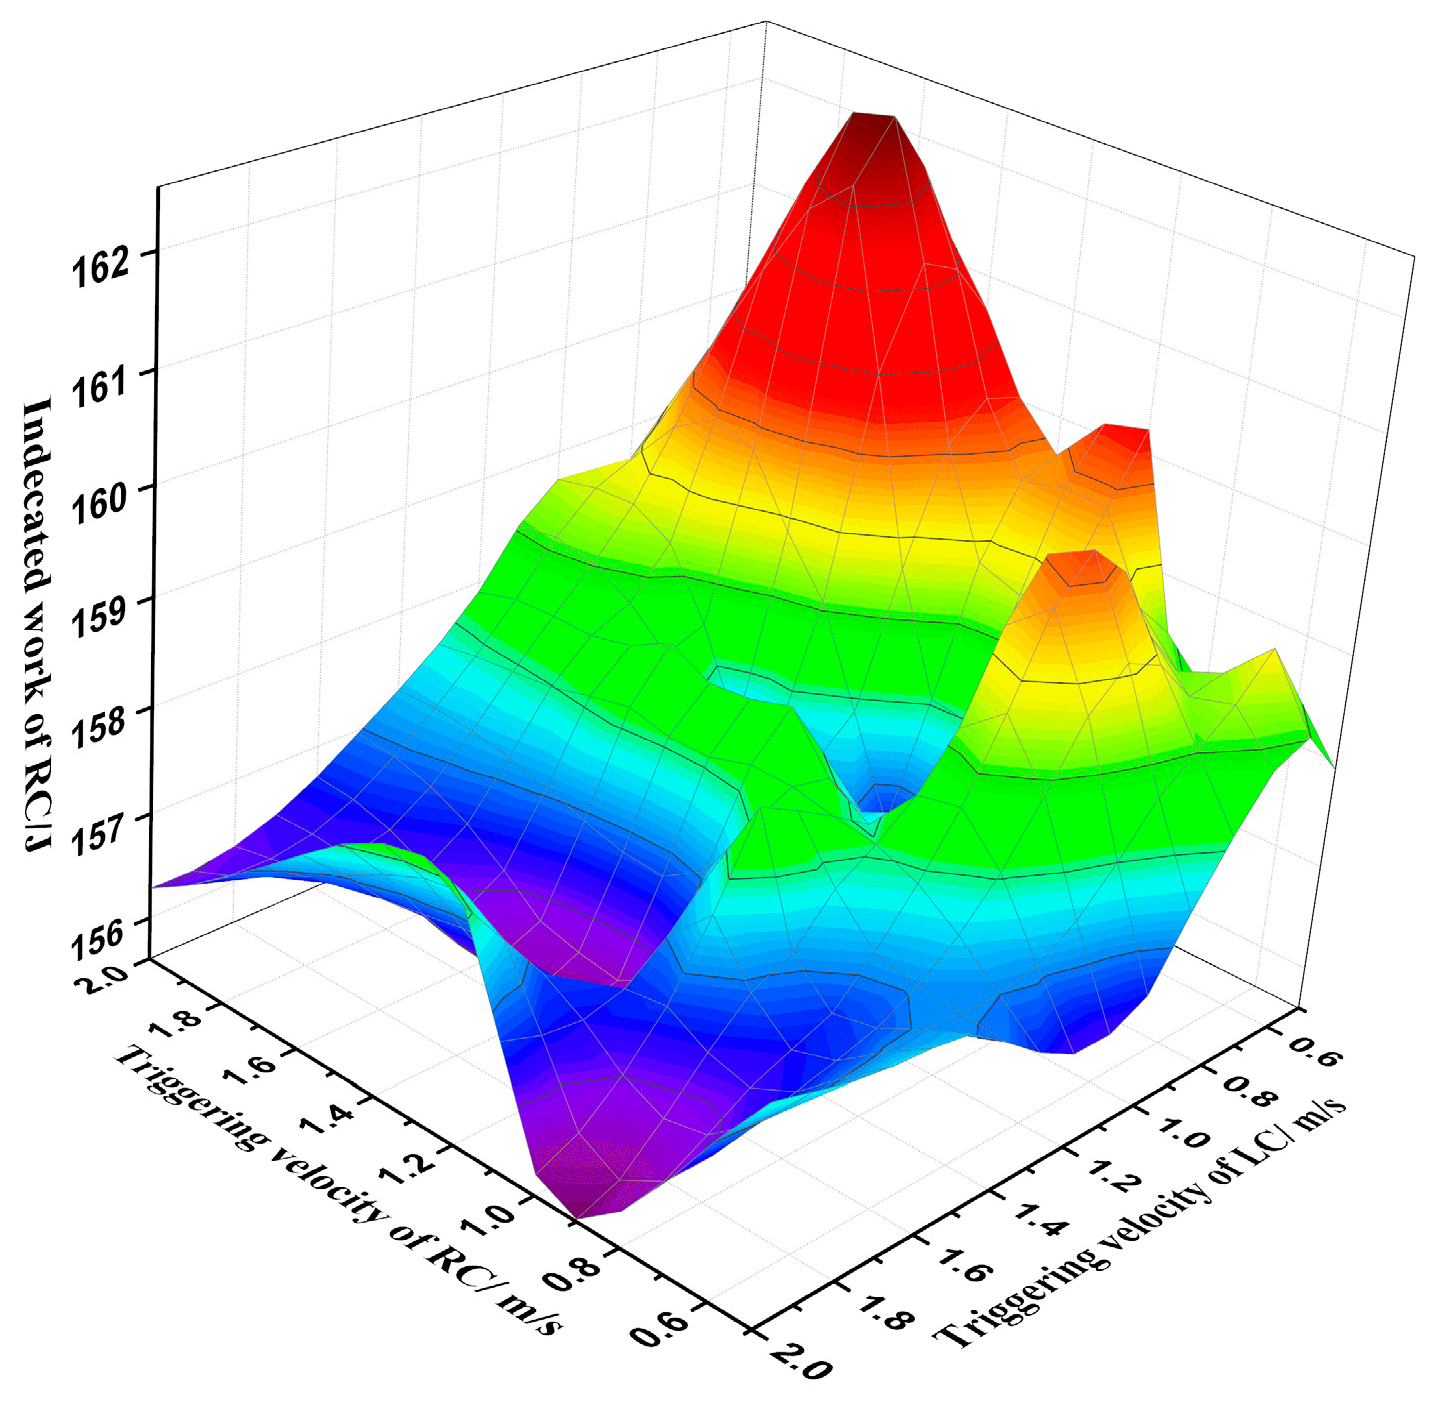
Figure 14 shows the map of the IW of the RC vs. the two cylinders’ “triggering velocity” values.
The IW of the LC exhibits a monotonic decreasing trend with the increase of “triggering velocity”. The greater “triggering velocity” of CI FPLG correspond to the greater fuel injection advance angle in a conventional engine. This phenomenon is the reason for the trend shown in Figure 13. To be specific, the higher triggering velocity indicates that more fuel is ignited before TDC; thus, the compression negative work and heat transfer losses reduce the IW.
The IW map of the RC presents a “hump” shape. As analysed above, the IW of the RC is affected by both the IW of the LC and the “triggering velocity” of the RC; thus, the appearance of two peaks is reasonable. The peak value of IW of the RC reaches 174.8 J, thus, the IW in this strategy is greater than that in the injection strategy of position feedback.
By differentiating the position signal with respect to the sampling time interval, the controller can use the velocity signal to trigger the injection system. After setting different “triggering velocity” schemes of the two cylinders, we conducted a series of tests. On the basis of the in-cylinder gas pressure data and the piston position data, the IW of the RC and the LC were calculated. Figure 15 shows that the IW tendency of the LC coincides with the simulation result. To compare the IW of the RC with the simulation result, we convert the final test result of the three-dimensional vector (“triggering velocity” of the LC, “triggering velocity” of the RC, IW of the RC) to matrix gridding using the interpolation method. Comparing Figure 16 with Figure 14, we find that the map shape of the test result is similar to that of the simulation, and the peak value is approximately 162.3 J, with an error in a reasonable range.
Figure 17 shows the contrast diagram of the in-cylinder gas pressure under the same experimental condition for the two injection strategies. On the basis of the injection strategy of position feedback, the operation condition of this prototype is extremely unstable (the controller drives the motor automatically when the peak in-cylinder less than a pre-set value). In contrast, for testing with the injection strategy of velocity feedback, the prototype can achieve a better starting condition and is able to continuously operate over dozens of cycles. This test result not only verifies the feasibility of using velocity as the injection triggering signal but also indicates that the strategy may provide advantages, according to the characteristics of the FPE.

5. Conclusions

A CI FPLG prototype and the experimental rig were constructed, and the simulation model was verified by the experimental result. Based on the experimental bench and the numerical model of a prototype CI FPLG, two injection control strategies based on piston position feedback and velocity feedback respectively were studied, which resulted in the following main findings:
  • As the “launch cylinder”, the LC’s condition is mainly determined by the motor force and the ignition timing. The compression ratio and the peak in-cylinder gas pressure variation trends are similar to those of the CE. Under the injection strategy of position feedback, when the “triggering position” value increases, the compression ratio of the LC increases and the peak in-cylinder gas pressure declines. The maximum IW value of this prototype occurs when the injection value is 56 mm.
  • The compression energy of the RC is influenced by the IW of the LC, subtracting the part absorbed by the linear motor. Under the injection strategy of position feedback, the trend of the peak in-cylinder gas pressure of the RC has the form of a parabola, and the maximum value of this prototype’s peak in-cylinder gas pressure occurs when “triggering position” value is 55 mm. Increasing the “triggering position” from 55 mm up to 56 mm, the compression ratio increases largely, and the IW of the RC reaches the maximum value. The IW of the LC and the RC reach the maximum values of 132.7 J and 138.1 J, respectively.
  • Under the injection strategy of velocity feedback, if the “triggering velocity” values of two cylinders are the same, then there exists a substantial difference of peak gas pressures when the “triggering velocity” is relatively high. Different setting values of the triggering velocity in the LC and the RC can address the problem. In this manner, the IW of the LC ranges from 141.4 J to 149.0 J, and the IW map shape of the RC has two peaks, with the maximum value of 162.3 J. Thus, this strategy can contribute to a higher IW compared to the other strategy.
  • Because of the lack of mechanical restraint and a flywheel-like device, the combustion condition largely affects the mover’s motion characteristics, and the coupled relationship between the motion and combustion makes the next combustion vary largely again. This high variation causes the operation conditions to differ largely at the same position; however, the velocity signal could better indicate the operation condition of the prototype. The test result demonstrates that the strategy of using the velocity signal can achieve a relatively better operating condition. Using the velocity signal to optimise the injection timing should improve the operation performance markedly.

Acknowledgments

The work is supported by National Nature Science Foundation of China (51006010) and Program of Introducing Talents of Discipline to Universities of China (B12022). The authors also thank the assistance of other people in the research group.

Author Contributions

Firstly, all of the authors formulated the experimental scheme. Huihua Feng checked and discussed the simulation results. He also confirmed the series of experimental parameters and arranged and organized the entire experimental process. Yuyao Guo participated in establishing the simulation model and constructed the test rig. Yu Song and Chendong Guo revised the paper. Zhengxing Zuo made many useful comments and experimental suggestions.

Conflicts of Interest

The authors declare no conflict of interest.

Abbreviations

FPEFree Piston Engine
CEConventional engine
FPLGFree piston engine linear generator
CICompression ignition
IWIndicated work
LDCLeft dead center
RDCRight dead center
TDCTop dead center
BDCBottom dead center
LCLeft cylinder
RCRight cylinder
Symbols
xPosition of piston assembly [m]
tTime [s]
mMass of piston assembly [kg]
AcCross sectional area of left cylinder [m2]
AsEffective action area of scavenge backpressure [m2]
FmotorMotor force [N]
FfFriction force [N]
PLcPressure in left cylinder [Pa]
PLsPressure in left scavenge chamber [Pa]
PRcPressure in right cylinder [Pa]
PRsPressure in right scavenge chamber [Pa]
VLVolume of left cylinder [m3]
VRVolume of right cylinder [m3]
γSpecific heat ratio
QLhcHeat transfer in left cylinder [J]
QRhcHeat transfer in right cylinder [J]
QLCombustion heat release of left cylinder [J]
QRCombustion heat release of right cylinder [J]
TGas temperature [K]
TwWall temperature [K]
AallHeat transfer area in cylinder [m2]
λHeat transfer coefficient [J/(m2K)]
Mean speed of piston assembly [kg]

References

  1. Casba, T.N. Linear Engine Development for series Hybrid Electric Vehicles. Ph.D. Thesis, West Virginia University, Morgantown, WV, USA, 2004. [Google Scholar]
  2. Mikalsen, R.; Roskilly, A. A review of free-piston engine history and applications. Appl. Therm. Eng. 2007, 27, 2339–2352. [Google Scholar] [CrossRef]
  3. Mikalsen, R.; Roskilly, A. Performance simulation of a spark ignited free-piston engine generator. Appl. Thermal Eng. 2008, 28, 1726–1733. [Google Scholar] [CrossRef]
  4. Mikalsen, R.; Jones, E.; Roskilly, A.P.A.P. Predictive piston motion control in a free-piston internal combustion engine. Appl. Energy 2010, 87, 1722–1728. [Google Scholar] [CrossRef]
  5. Mikalsen, R.; Roskilly, A.P. The control of a free-piston engine generator. Part 1: Fundamental analyses. Appl. Energy 2010, 87, 1273–1280. [Google Scholar] [CrossRef]
  6. Mikalsen, R.; Roskilly, A.P. The control of a free-piston engine generator. Part 2: Engine dynamics and piston motion control. Appl. Energy 2009, 87, 1281–1287. [Google Scholar] [CrossRef]
  7. Atkinson, C.M.; Petreanu, S.; Clark, N.N. Numerical Simulation of a Two-Stroke Linear Engine. SAE Pap. 1999. [Google Scholar] [CrossRef]
  8. Li, Q.; Xiao, J.; Huang, Z. Simulation of a two-stroke free-piston engine for electrical power generation. Energy Fuels 2008, 22, 3443–3449. [Google Scholar] [CrossRef]
  9. Blarigan, P.V.; Paradiso, N.; Goldsborough, S. Homogeneous charge compression ignition with a free piston: A new approach to ideal otto cycle performance. SAE Pap. 1998. [Google Scholar] [CrossRef]
  10. Goldsborough, S.S.; Blarigan, P.V. Numerical study of a free piston IC engine operating on homogeneous charge compression ignition combustion. SAE Pap. 1999. [Google Scholar] [CrossRef]
  11. Aichlmayr, H.T.; Kittelson, D.B.; Zachariah, M.R. Miniature free-piston homogeneous charge compression ignition engine-compressor concept-Part I: Performance estimation and design. Chem. Eng. Sci. 2002, 57, 4161–4171. [Google Scholar] [CrossRef]
  12. Aichlmayr, H.T.; Kittelson, D.B.; Zachariah, M.R. Miniature free-piston homogeneous charge compression ignition engine-compressor concept-Part II: Modeling HCCI combustion in small scales with detailed homogeneous gas phase chemical kinetics considerations unique to small dimensions. Chem. Eng. Sci. 2002, 57, 4173–4186. [Google Scholar] [CrossRef]
  13. Shoukry, E.; Taylor, S.; Clark, N. Numerical simulation for parametric study of a two-stroke direct injection linear engine. SAE Pap. 2002. [Google Scholar] [CrossRef]
  14. Nemecek, P.; Vysoky, O. Control of two-stroke free-piston generator. In Proceedings of the 6th Asian Control Conference, Bali, Indonesia, 18–21 July 2006.
  15. Jaeheun, K.; Choongsik, B.; Gangchul, K. Simulation on the effect of the combustion parameters on the piston dynamics and engine performance using the Wiebe function in a free piston engine. Appl. Energy 2013, 107, 446–455. [Google Scholar]
  16. Hung, N.B.; Lim, O.T. A study of a two-stroke free piston linear engine using numerical analysis. J. Mech. Sci. Technol. 2014, 28, 1525–1557. [Google Scholar] [CrossRef]
  17. Achten, P.A.J. A review of free piston engine concepts. SAE Pap. 1994. [Google Scholar] [CrossRef]
  18. Razali Hanipah, M.; Mikalsen, R.; Roskilly, A.P. Recent commercial free-piston engine developments for automotive applications. Appl. Therm. Eng. 2015, 75, 493–503. [Google Scholar] [CrossRef]
  19. Zhao, Z.; Wu, D.; Zhang, Z.; Zhang, F.; Zhao, C. Experimental investigation of the cycle-to-cycle variations in combustion process of a hydraulic free-piston engine. Energy 2014, 78, 257–265. [Google Scholar] [CrossRef]
  20. Hidemasa, K.; Tomoyuki, A.; Kazunari, M. Development of free piston engine linear generator System Part 1: Investigation of fundamental characteristics. SAE Pap. 2014. [Google Scholar] [CrossRef]
  21. Shigeaki, G.; Kaznunari, M.; Hidemasa, K. Development of free piston engine linear generator system Part 2: Investigation of control system for generator. SAE Pap. 2014. [Google Scholar] [CrossRef]
  22. Mao, J.; Zuo, Z.; Li, W.; Feng, H. Multi-dimensional scavenging analysis of a free-piston linear alternator based on numerical simulation. Appl. Energy 2011, 88, 1140–1152. [Google Scholar] [CrossRef]
  23. Feng, H.; Song, Y.; Zuo, Z.; Shang, J.; Wang, Y.; Roskilly, A.P. Stable Operation and Electricity Generating Characteristics of a Single-Cylinder Free Piston Engine Linear Generator: Simulation and Experiments. Energies 2015, 8, 765–785. [Google Scholar] [CrossRef]
  24. Xu., Z.; Chang, S. Prototype testing and analysis of a novel internal combustion linear generator integrated power system. Appl. Energy 2010, 87, 1342–1348. [Google Scholar] [CrossRef]
  25. Jia, B.; Tian, G.; Feng, H.; Zuo, Z.; Roskilly, A.P. An experimental investigation into the starting process of free-piston engine generator. Appl. Energy 2015, 157, 798–804. [Google Scholar] [CrossRef]
  26. Famouri, P.; Cawthorne, W.R.; Clark, N.; Nandkumar, S.; Atkinson, C.; Atkinson, R. Design and testing of a novel linear alternator and engine system for remote electrical power generation. In Proceedings of the IEEE power engineering society winter meeting, New York, NY, USA, 31 January–4 February 1999.
  27. Blarigan, P.V. Advanced internal combustion electrical generator. In Proceedings of the 2002 US DOE Hydrogen Program Review, Golden, CO, USA, 6–10 May 2002.
  28. Zulkifli, S.A.; Karsiti, M.N.; Aziz, A. Investigation of linear generator starting modes by mechanical resonance and rectangular current commutation. In Proceedings of the IEEE International Electric Machines and Drives Conference, Miami, FL, USA, 3–6 May 2009.
Figure 1. Functional schematic of the FPLG experiment rig.
Energies 09 00453 g001
Figure 2. FPLG experiment rig.
Energies 09 00453 g002
Figure 3. Free body diagram of the free-piston engine mover.
Energies 09 00453 g003
Figure 4. Simulink model of the whole CI FPLG.
Energies 09 00453 g004
Figure 5. Block diagram of the “engine” sub-model.
Energies 09 00453 g005
Figure 6. Piston velocity-position traces.
Energies 09 00453 g006
Figure 7. Experimental and simulation results.
Energies 09 00453 g007
Figure 8. Experimental and simulation curves of the in-cylinder gas pressure.
Energies 09 00453 g008
Figure 9. Compression ratio variation of LC and RC for different values of the “triggering position”.
Energies 09 00453 g009
Figure 10. IW variation of the LC and the RC for different values of the “triggering position”.
Energies 09 00453 g010
Figure 11. Peak in-cylinder gas pressure variation for different values of the “triggering position”.
Energies 09 00453 g011
Figure 12. Cycle feature points at the same “triggering velocity”. (a) Displacement; (b) In-cylinder gas pressure.
Energies 09 00453 g012
Figure 13. Indicated work variation of the LC for different values of the “triggering velocity” (simulation).
Energies 09 00453 g013
Figure 14. Indicated work map of the RC for different values of the “triggering velocity” (simulation).
Energies 09 00453 g014
Figure 15. Indicated work variation of the LC for different values of the “triggering velocity” (experiment).
Energies 09 00453 g015
Figure 16. Indicated work contour map of the RC for different values of the “triggering velocity” (experiment).
Energies 09 00453 g016
Figure 17. Comparison of the in-cylinder gas pressure for the two injection control strategies. (a) velocity signal feedback; (b) position feedback.
Energies 09 00453 g017
Table 1. Specifications of the FPLG.
ParameterValue
Bore60 mm
Maximum stroke length94 mm
Distance from exhaust port to cylinder head61.5 mm
Distance from scavenge port to cylinder head73.5 mm
Mass of the mover5.4 kg
Rated compression ratio16.5
Excess air coefficient1.7
Injector serial number (Bosch)0445110321
Table 2. Main test devices and sensors.
Test DeviceType
In-cylinder gas pressure sensorKistler 6052C
Charge amplifierKistler 5018A1000
Piston position sensorMotor built-in encoder
DAQ controllerNI PXIe-8135
DAQ CardNI PXIe-6358
Table 3. Fuel physicochemical properties.
PropertyValue
Cetane number45–55
Molar mass180 g/mol
Liquid density0.82–0.83 kg/L
Boiling point160–360 °C
Low calorific value 42,500 kJ/kg
Dynamic viscosity0.37 Pa·s
Kinematic viscosity(2.5–8.5) × 10−4 m2/s
Excess air coefficient0.48–1.85
Table 4. Injection parameters.
ParameterValue
Injection pulse-width0.7 ms
Cycle fuel injection mass6.9 mg
Number of nozzle holes3
Nozzle diameter0.13 mm
Spray angle140° CA
Rail pressure105 MPa
Table 5. Some parameters in the model.
ParameterValue
Static friction force100 N
Electromagnetic force coefficient290 N/(m/s)
Intake air temperature300 K
Cylinder wall temperature550 K
Intake air pressure1.4 bar
Heat ratio γ1.35

