
Greening the NetFPGA Reference Router


1
School of Electronic Engineering, Dublin City University, Dublin 9, Ireland
2
School of Electronic Engineering, Beijing University of Posts and Telecommunications, Beijing 100876, China
*
Author to whom correspondence should be addressed.
†
These authors contributed equally to this work.
Energies 2016, 9(7), 500; https://doi.org/10.3390/en9070500
Submission received: 3 April 2016
/
Revised: 27 May 2016
/
Accepted: 17 June 2016
/
Published: 29 June 2016
(This article belongs to the Special Issue Energy-Efficient and Sustainable Networking)
Abstract
:Energy efficiency is an important criterion in the design of next generation networks for both economic and environmental concerns. This paper presents an energy-efficient router that is able to dynamically adapt its routing capability in response to real-time traffic load, achieving energy proportional routing. The NetFPGA reference router, which operates at one of two frequencies (125 MHz or 62.5 MHz), requires a board reset to switch frequencies. We have modified the reference router to allow dynamic switching among five operating frequencies. Experiments with real traces indicate that, compared to the reference router, a 10% power reduction can be achieved through dynamic frequency scaling. When the router is further modified to support green traffic engineering and Ethernet port shut-down, power consumption can be reduced by 46% while maintaining the required quality of service. This allows the router to meet the instantaneous performance requirements while minimizing power dissipation. Similar results can be expected when these general power-saving principles are applied in future commercial routers.

1. Introduction
In information and communications technology (ICT) networks, the traditional design of network devices tends to primarily emphasize performance in terms of working speed. Power consumption, while given some attention, failed to be recognized as an important part of a family of design metrics, along with performance, reliability, security, etc. There are approximately one billion Ethernet connections all over the world [1]. The network devices were designed to translate improvements in digital circuits and operating frequency into performance, such as maximizing the router capacity at the cost of the highest and constant power consumption regardless of the traffic load.
The energy efficiency of ICT systems has now been universally recognized as an important factor motivated by economics and environment issues [2]. With the sharp increase in Internet traffic, broadband accesses, complex services and end users, power consumption in the ICT industry is increasing exponentially at an alarming rate. A detailed report [3] estimated that a huge increase in overall network power consumption is predicted for European ISPs from around 21.4 terawatt-hours (TWh) in 2010 to around 35.8 TWh in 2020, if no green technologies are adopted. Such a huge increase in power consumption could result in billions in energy costs. On the other hand, carbon dioxide (CO2) emissions from the ICT industry should never be ignored [4]. In 2010, a study [5] indicated that the ICT industry contributed about 2% of global CO2 emissions, which is equivalent to the entire airline industry.
Many approaches have been proposed to make ICT systems more energy efficient [6,7]. The majority of these proposed approaches can be divided into two categories: power scaling and sleep mode [8,9,10]. In the power scaling category, dynamic frequency scaling (DFS) offers an elegant solution for improving the energy efficiency of routers [11]. In this paper, an energy-efficient frequency-scaled router (FSR) with five different operating frequencies is implemented on the NetFPGA 1G board.
The FSR is based on the modification of the NetFPGA reference router [12]. The NetFPGA is used because it is supported by a community of open source hardware and software and because of its modular structure in the reference pipeline, which provides a fast way to develop and experiment on custom green mechanisms. Data plane power consumptions of the FSR at different operating frequencies are measured. Control policies governing the dynamic frequency scaling of the FSR are also discussed. The power savings are achieved at the cost of transition time overhead (e.g., packet loss and delay during frequency transitions). To minimize the transition overhead, the control policies are directly implemented in hardware, which reduces the transition time by more than 80% compared to a software implementation. Experiments using real traffic traces indicate that, with dynamic frequency scaling, the FSR can reduce power consumption by 10% compared to the reference router. When the FSR is used in conjunction with green traffic engineering and Ethernet port shut-down (which is not a core part of the work), results show that up to 46% of data plane power consumption can be saved while providing the required quality of service. A new project entry for the frequency-scaled router has been created in the NetFPGA GitHub repository [13]. The research carried out in this paper was part of the European FP7 low Energy COnsumption NETworks (ECONET) project, which has resulted in the European Telecommunications Standards Institute (ETSI) Standard 203-237 [14].
The rest of this paper is organized as follows. Section 2 reviews the related work. Section 3 presents the design and architecture of the reference router (RR) and the frequency-scaled router (FSR). Section 4 describes different frequency control policies adopted in the FSR for dynamic frequency scaling. Section 5 evaluates the frequency control policies and compares the power consumption between the frequency-scaled router and the original reference router. Section 6 concludes the paper.
2. Related Work
Traffic demands have been witnessing a sky-rocketing growth over the past decade. To keep pace with such growth, it is even more compelling to reduce power consumption while managing massive increases in Internet traffic and networking hardware. Economic reasons and environmental concerns on sustainable growth have created a demand for green communication networks. Many approaches have been proposed to manage energy and power issues, and the European Commission (EC) has launched a series of research projects to improve the energy efficiency of ICT in a variety of areas (e.g., wired networks, wireless networks, data centre, smart grids, etc.).
The Energy-Aware Radio and neTwork tecHnologies (EARTH) project aims to address the energy efficiency of mobile communication systems to reduce energy waste and improve the energy efficiency of mobile communications. Correia et al. proposed a holistic approach for energy-efficient mobile radio networks and a framework for energy efficiency evaluation (E3F) [15]. Auer et al. investigated the power consumption of mobile communication systems, and the power consumption of base stations is quantified in detail [16].
The Towards Real Energy-efficient Network Design (TREND) project investigated the energy efficiency of the electrical and optical layers of Internet Protocol over wavelength-division multiplexing (IP-over-WDM) networks [17]. The project also proposed energy-aware adaptive routing solutions (EA-ARSs) for the network operators. Chiaraviglio et al. proposed a approach to reduce the power consumption of backbone networks by turning off network nodes and links while guaranteeing full connectivity and link utilization constraints [18].
The Multi-Agent Systems and Secured coupling of Telecom and Energy gRIds for Next Generation smart grid services (MAS2TERING) project investigated the challenges of integrating ICT and energy infrastructures for future smart grids. Mourshed et al. proposed four strategic challenges at the intersection between ICT and energy infrastructures [19].
Among those green approaches, the following three works are the most similar to this work. The auto-negotiation scheme in the 802.3 standard takes about 100 ms to change data rates at a 1-Gb/s link data rate. Gunaratne et al. [1] proposed the adaptive link rate (ALR) that allows the speed of network links to be changed by adaptively switching to different processing states in response to the amount of data that is being transmitted.
Meng et al. [20] proposed a multi-frequency scaling (MFS) scheme that examines buffer usage inside a network device so that the components of the device could dynamically scale its capacity according to its buffer occupancy. In the MFS scheme, a clock (CLK) adapter is the hardware module for frequency scaling, and a multi-dual-threshold policy is adopted as the MFS control policy.
Pham et al. [21] proposed a power scaling mechanism on the NetFPGA OpenFlow switch that can adapt the operating clock frequencies of the FPGA processor and the link rates of the four Ethernet ports based on the actual traffic load. The power can be saved by changing the clock frequency from 125 MHz to 3.9 MHz in combination with four possible operation modes on each Ethernet port (idle, 10 Mb/s, 100 Mb/s and 1 Gb/s).
3. The Architecture of the Reference Router and the Frequency-Scaled Router
3.1. Reference Router
The NetFPGA reference pipeline is designed in a modular style [22]. In the pipeline, each stage is a separate module, which enables developers to design and implement their own project without starting from scratch. New functions like energy-efficient mechanisms can be integrated by adding custom modules or by modifications to the existing modules.
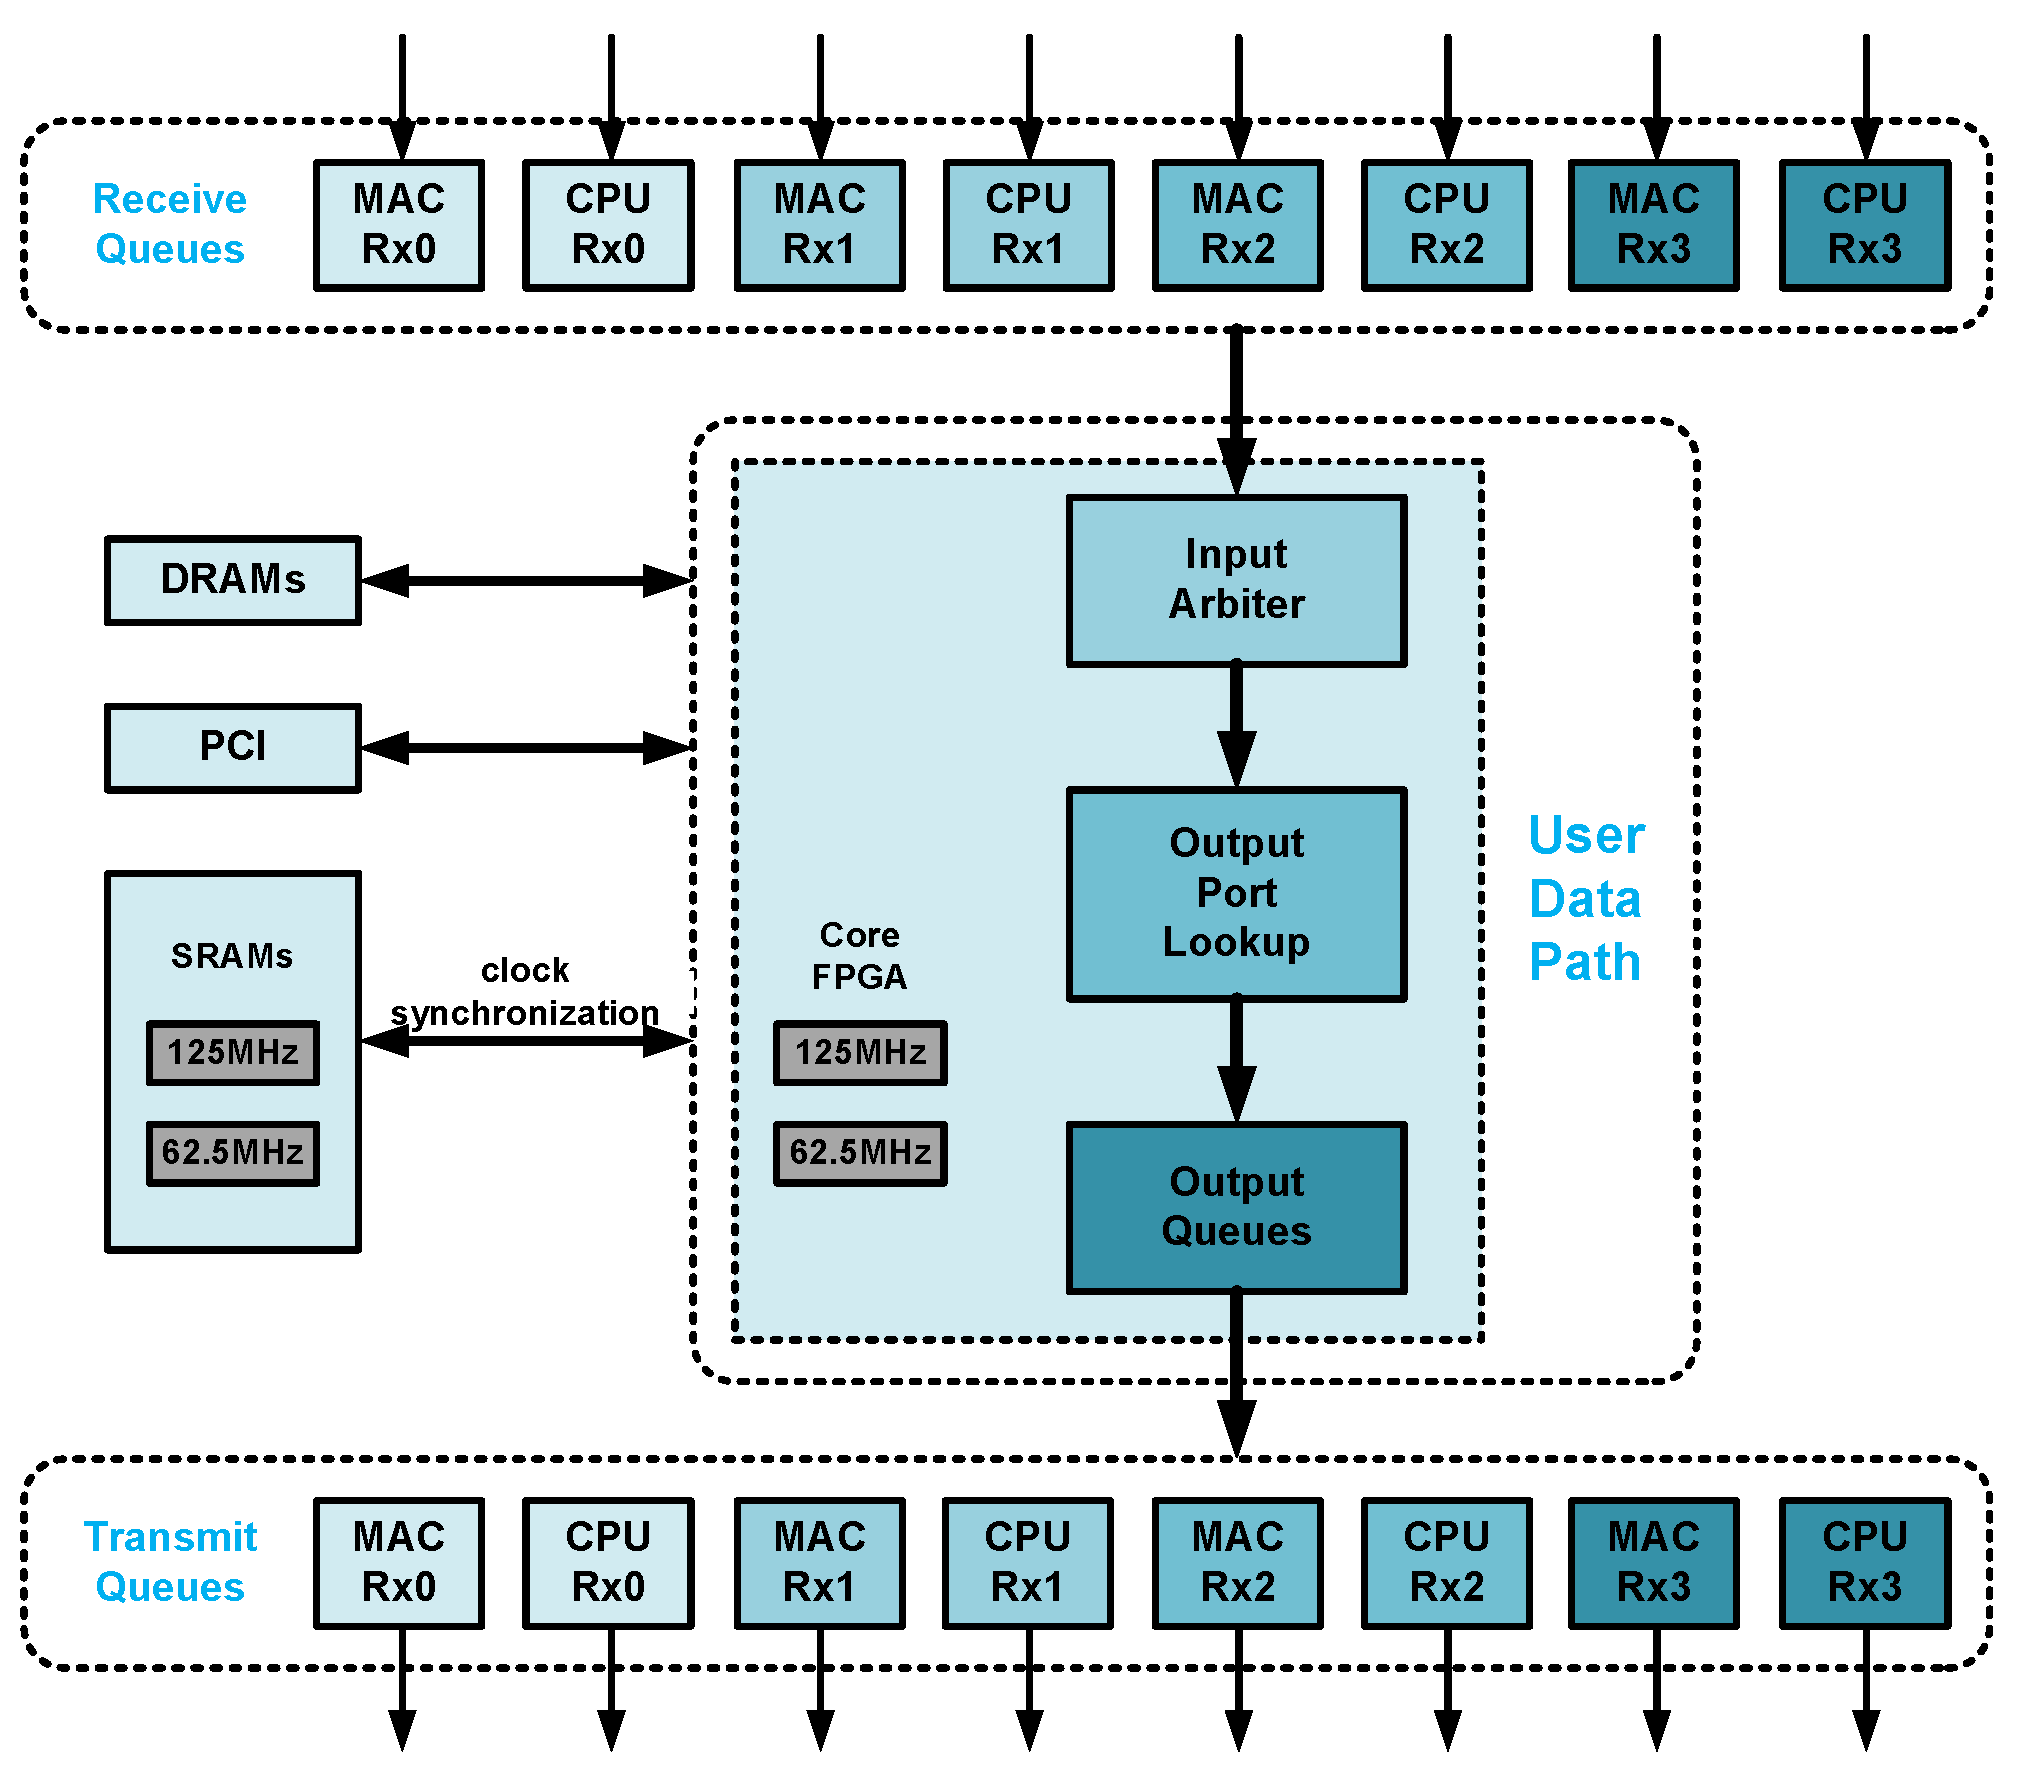
As shown in Figure 1, the NetFPGA reference pipeline consists of multiple modules, including eight receive queues, eight transmit queues and the user data path [23]. Both receive queues and transmit queues are divided into two groups: four media access control (MAC) interfaces and four central processing unit (CPU) direct memory access (DMA) interfaces. The receive queues receive packets from I/O ports, such as the Ethernet ports and the Peripheral Component Interconnect (PCI) over DMA, while the transmit queues send packets out of the I/O ports instead of receiving.
The pipeline in the user data path is 64 bits wide, and all of the internal module interfaces use the standard request grant first-in-first-out (FIFO) protocol [23]. In the user data path, the input arbiter module decides which receive queue to service next, pulls the packet from that receive queue and hands it to the output port lookup module. The output port lookup module decides out of which port a packet comes. After that decision is made, the packet is then handed to the output queues module, which stores the packet in the corresponding output queue and sends the packet out of the output queue when the corresponding transmit queue is ready to accept the packet for transmission.
3.2. Frequency-Scaled Router
In the RR, the two SRAMs use the same clock as used by the core logic FPGA processor for writing and reading data, to ensure that transmit queues could transmit data with little or no delay between packets [24]. An inbuilt register sets the operating frequency of the core logic FPGA to either 125 MHz or 62.5 MHz. However, due to the clock synchronization between the SRAMs and the core logic FPGA, the RR cannot switch the operating frequency of the core logic FPGA on the fly. When toggling the operating frequency of the RR between 125 MHz and 62.5 MHz, the frequency switching causes a board reset to restart the SRAMs and the core logic FPGA hardware with updated synchronous frequency. The board reset involves re-mirroring and reloading MAC addresses, IP addresses, the routing table and the Address Resolution Protocol (ARP) table into the core logic FPGA hardware, which takes approximately 2 ms. All of the buffered packets are lost during the board reset.
To eliminate the board reset problem, a custom module of asynchronous FIFO (AFIFO) is inserted between the SRAMs and the core logic FPGA. The AFIFO allows safe data exchange between the SRAMs’ clock domain and the core FPGA clock domain, where the two clock domains are asynchronous to each other. As shown in Figure 2, the AFIFO module can isolate the SRAMs alone and keep them running at 125 MHz constantly, while the operating frequency of the core FPGA can be tuned among allowed frequencies in response to actual traffic processing needs.
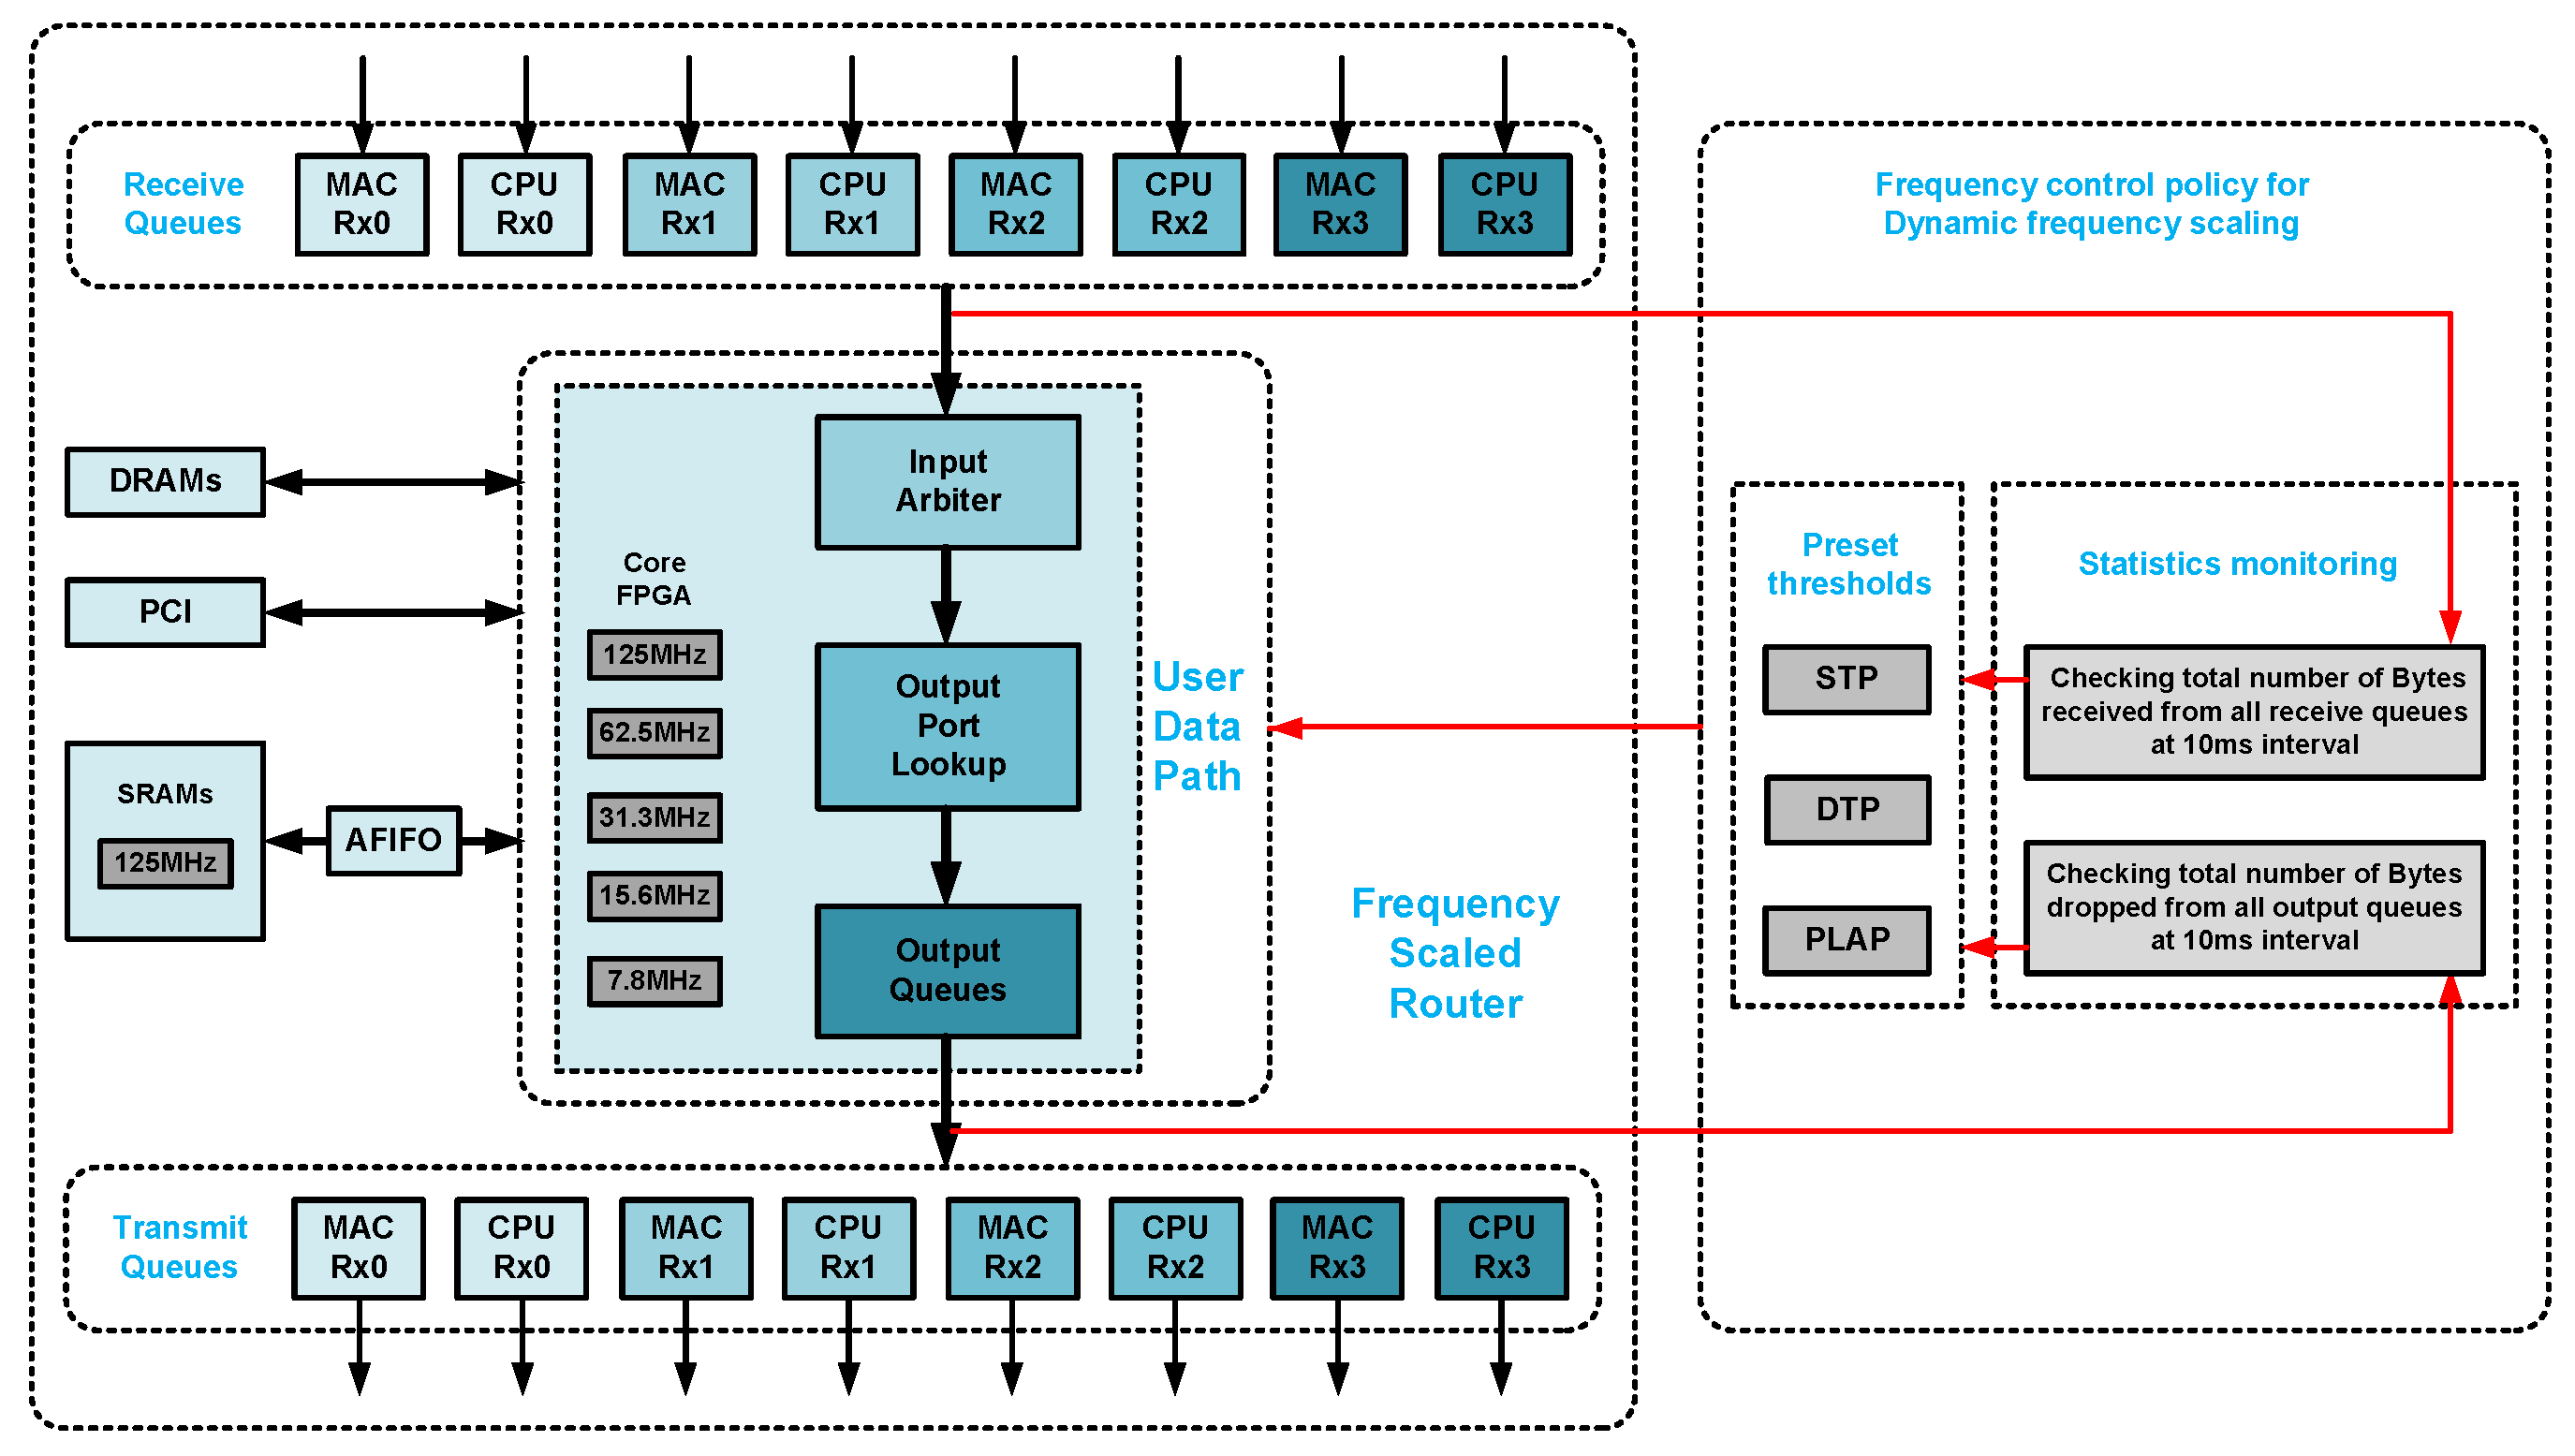
In the RR, the power consumption at these two frequencies (125 MHz and 62.5 MHz) with different numbers of active ports (zero to four) for different aggregated traffic loads (400 Mb/s to 4 Gb/s) and different packet sizes (140 bytes, 531 bytes and 1470 bytes) is reported in [25]. To quantify the power savings from energy proportional techniques, the FSR is developed to provide the core logic FPGA with five operating frequency options (125 MHz, 62.5 MHz, 31.3 MHz, 15.6 MHz and 7.8 MHz). This is accomplished by integrating custom frequency division modules into the digital clock manager (DCM) available on the core logic Virtex II FPGA. The custom frequency division modules in the DCM provide advanced clocking capability, which can generate new clock frequencies by dividing the source clock frequency with allowed divisors. In comparison to the RR, the three additional operating frequencies (31.3 MHz, 15.6 MHz and 7.8 MHz) in the FSR are derived from the source clock 125 MHz by simultaneous frequency division with three custom divisors (4, 8 and 16).
4. Frequency Control Policies for Dynamic Frequency Scaling
The dynamic frequency scaling on the FSR is implemented by reading and writing to the relevant memory-mapped I/O registers introduced in the FSR, which adaptively control the operating frequency in response to the instantaneous traffic load. Since the NetFPGA packages (NFPs) Release 2.0.0, a register system has been introduced in the reference pipeline. The registers in the register system can indicate the status information and set the control signals for each separate module.
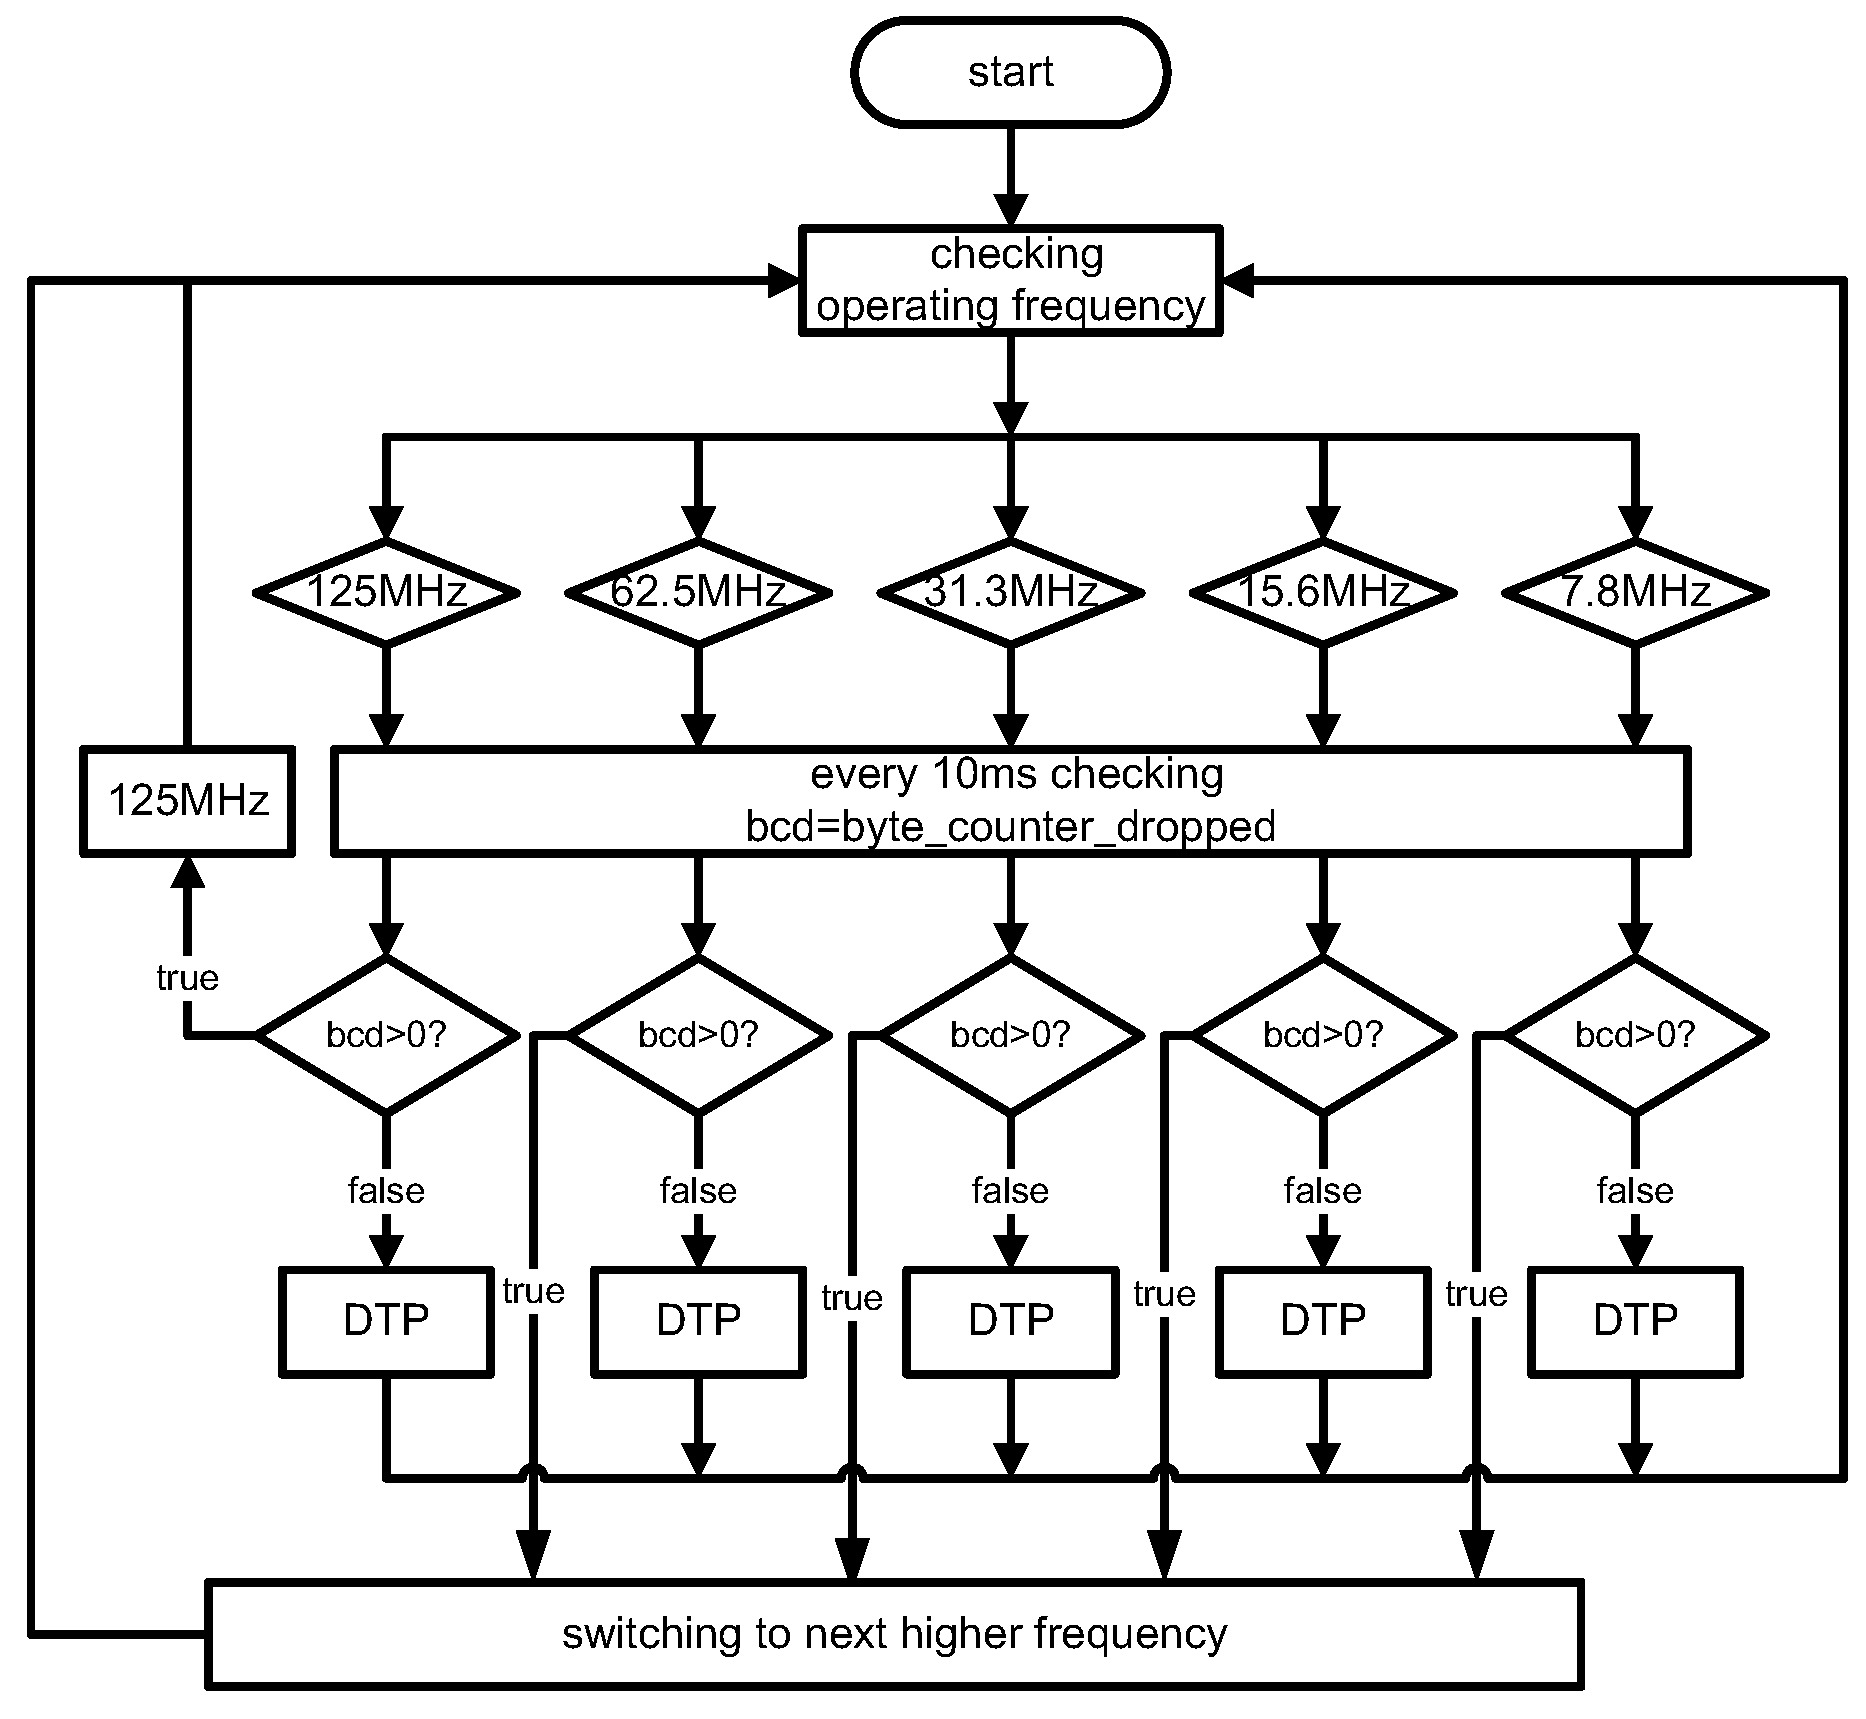
As shown in Figure 3, statistics monitoring and preset thresholds are adopted in the design of the frequency control policies of the proposed energy-efficient FSR. The statistics monitoring is designed to indicate the current core logic frequency, the total number of bytes received from all receive queues (byte_counter_received) and the total number of bytes dropped from all output queues (byte_counter_dropped) in a certain sampling period. The sampling period is extremely sensitive, because it directly determines the delay between the request for a new frequency and the actual frequency transition. Experimental results indicate that 10 ms is a reasonable interval time for the sampling period and is consistent with that used in implementing ALR [1]. The preset thresholds are adopted to divide the routing capacity into five grades in response to the incoming traffic load in the previous 10-ms sampling period. Different frequency control policies may have a different set of rules for setting the thresholds.
Frequency control policy is crucial in the FSR because it manages the operating frequency of the router, which in turn affects the power consumption and the performance of the router. An effective frequency control policy should manage the router to operate at the lowest frequency for as much time as possible without affecting user-perceived QoS. Significant increases to packet delay and loss could degrade the user experience, which is unacceptable. Three different frequency control policies are designed based on statistics monitoring and preset thresholds. These policies are used to determine when to initiate a frequency switching. The three implemented frequency control policies are: single-threshold policy (STP), double-threshold policy (DTP) and packet loss-aware policy (PLAP).
4.1. Single-Threshold Policy
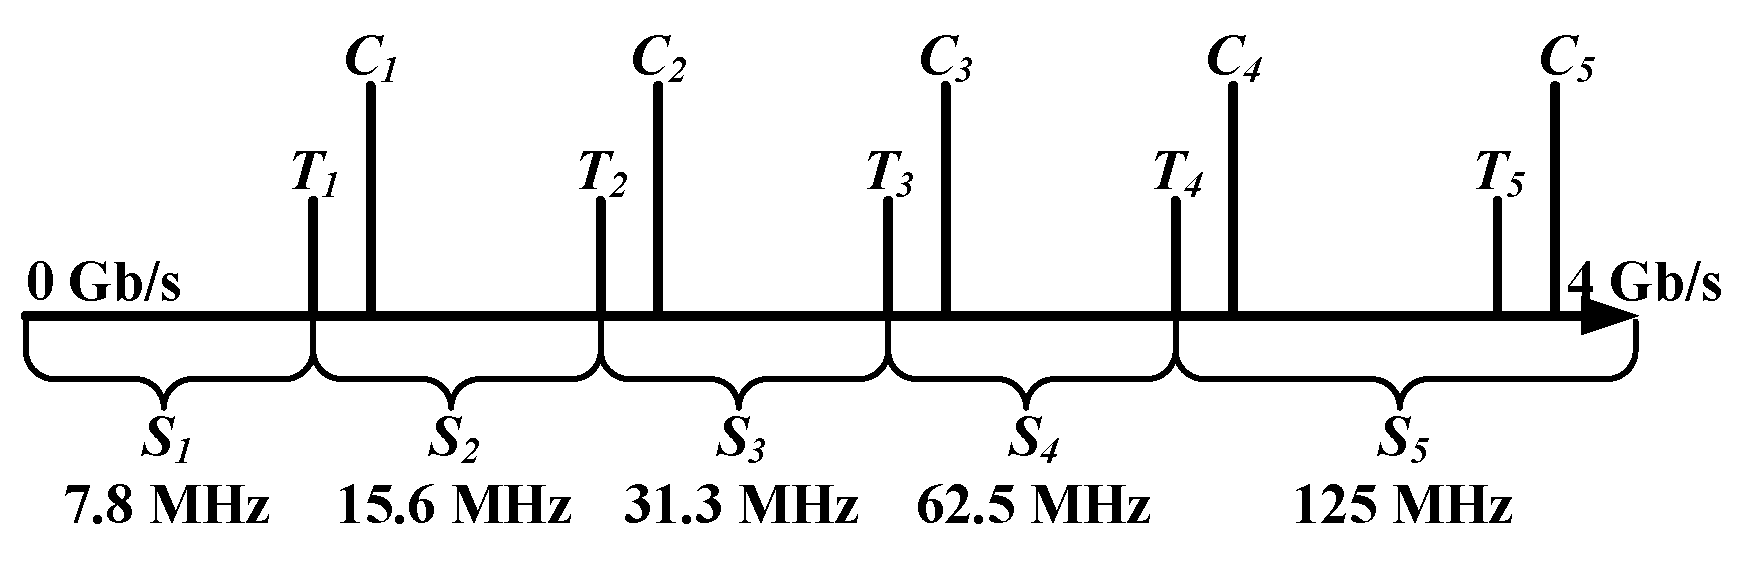
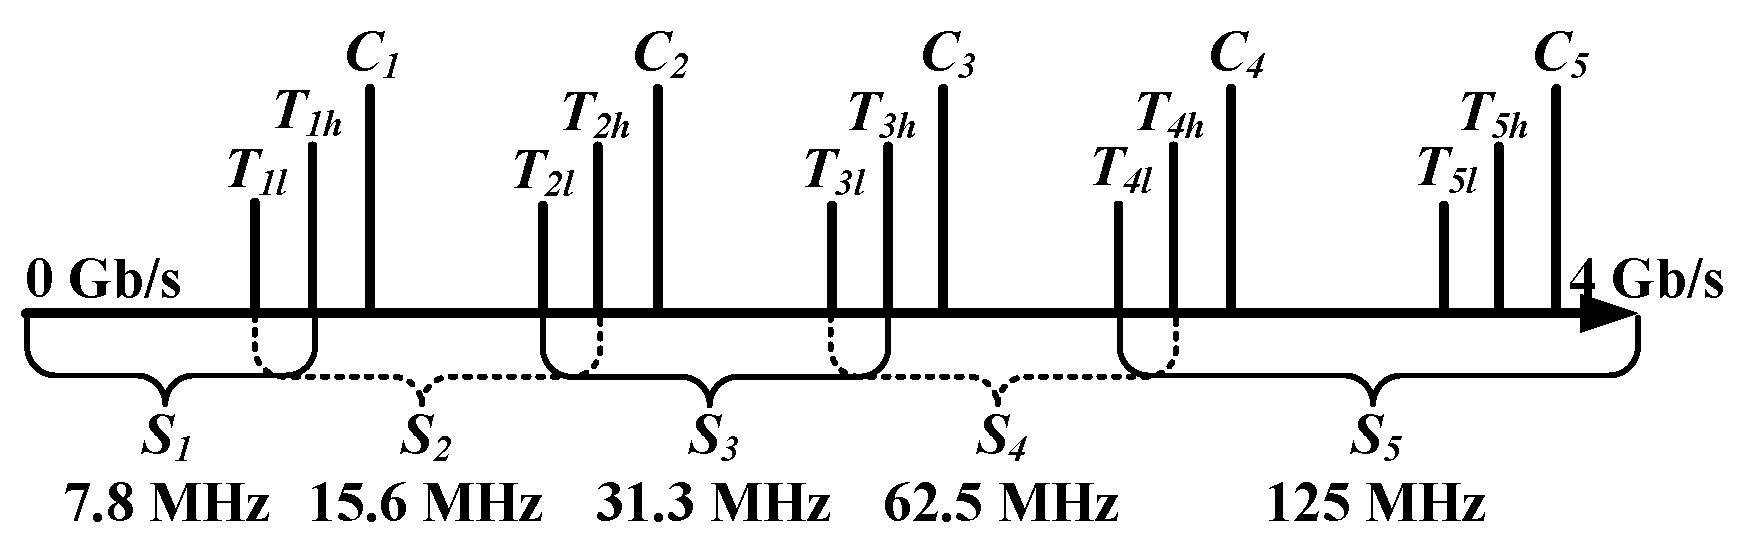
Due to the finite queue size, the STP is to assess an associated traffic throughput threshold beyond which the router will begin to loss packets for each operating frequency. Table 1 presents the mapping table of operating frequencies, capacity states, measured capacities and preset thresholds for STP. As shown in Figure 4, the capacity states S, S, S, S and S represent the routing capacities of the FSR working at core operating frequencies of 7.8 MHz, 15.6 MHz, 31.3 MHz, 62.5 MHz and 125 MHz, respectively. C represents the peak measured throughput for each capacity state S. At 125 MHz, the peak measured throughput C is below the theoretical full operation throughput 4 Gb/s, which is the maximum throughput for the NetFPGA router. For each capacity state S, the threshold T should not be preset too aggressively and too close to C. Because the statistics monitoring is implemented by counting bytes at a fixed sampling period and the statistics may vary slightly from time to time, thus T must be set lower than C, and experiments indicate that a reasonable value for T is 95% of C. A level of 95% was chosen for consistency with prior work on ALR [1], as was the 10-ms sampling period. The choice of these parameters involves a trade-off between energy savings and packet loss.
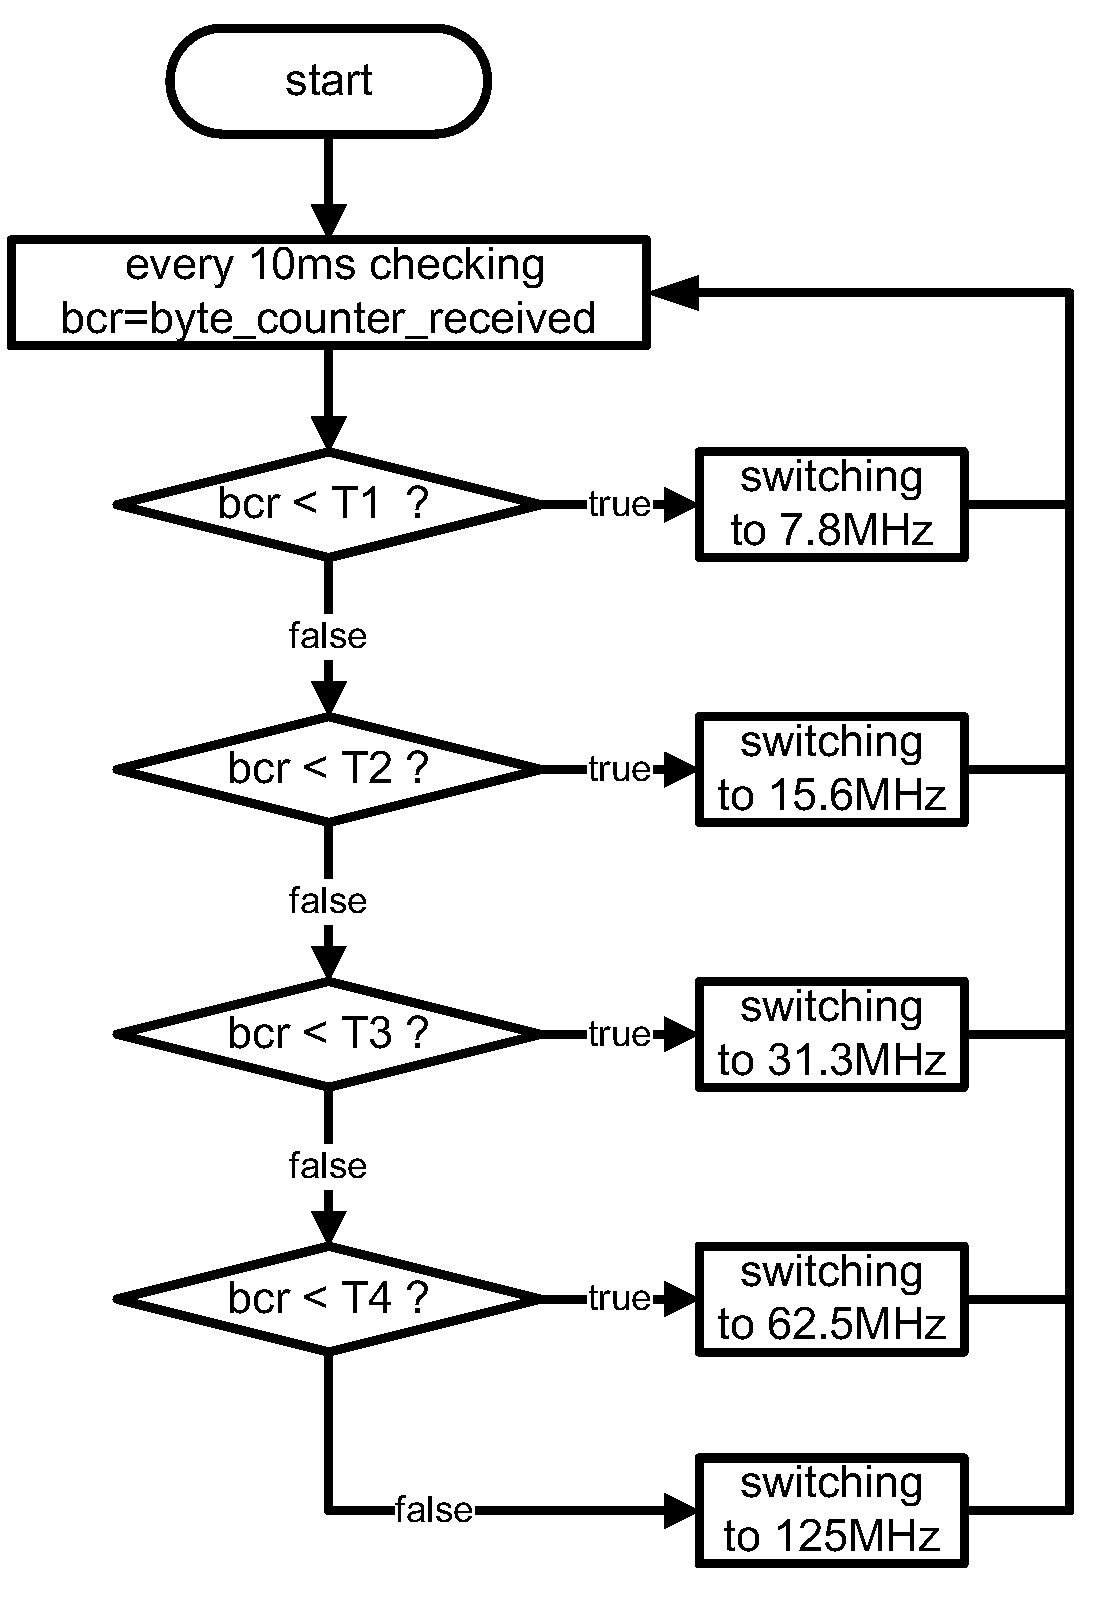
Suppose that the FSR is working in state S (j= 1 to 5); once the total number of bytes received from all receive queues (which is checked at 10-ms intervals) is below or equal to a threshold T (1 ⩽ i ⩽ j − 1), the router can switch to the lower capacity state T consuming less power while maintaining QoS. On the contrary, if the total number of bytes received from all receive queues is beyond the threshold T (k ⩾ j), the router must switch to the higher capacity state S (1 ⩽ k ⩽ 4) with more power consumption to avoid packet loss resulting from queue overflow. Otherwise, the router stays in the current capacity state S. Figure 5 presents the flowchart of the STP.
4.2. Double-Threshold Policy
The STP is an elegant scheme if the incoming traffic does not change frequently and abruptly so that the router could switch the capacity state in response to real-time traffic load without losing QoS. However, when the incoming traffic fluctuates drastically, especially in the case when input traffic is fluctuating near a preset threshold, frequently switching the capacity state could introduce extra power consumption and even extra packet loss. An effective policy should manage the router to operate at the lowest suitable frequency for as long as possible. Otherwise, extra switching energy and extra overheads during transition time may outweigh the power savings from the DFS scheme.
To eliminate the problem of the possible oscillation of capacity changes around a threshold associated with the STP, a double-threshold policy (DTP) is proposed as shown in Figure 6. DTP uses a high threshold T (1 ⩽ j ⩽ 5) and a low threshold T (1 ⩽ j ⩽ 5) for each capacity state S (1 ⩽ j ⩽ 5). In the DTP, the buffer between T and T could effectively reduce the possibility of the ping pong effect, so as to avoid energy waste and overheads on unnecessary capacity switching. Table 2 presents the mapping table of operating frequencies, capacity states, measured capacities and preset thresholds for DTP. For a certain capacity state S, if the total number of bytes received by all receive queues is more than T and less than T, the router will stay in the current capacity state S. The FSR will change to a lower routing capacity only when the aggregated total number of bytes in all receive queues is less than T or change to a higher routing capacity when the aggregated total number of bytes in all of the receive queue is more than T. Figure 7 presents the flowchart of the DTP.
4.3. Packet Loss-Aware Policy
For both the STP and the DTP, the trade-off between power consumption and performance is mainly affected by the fixed preset thresholds. Although the DTP can outperform the STP at the cost of potentially higher power consumption, it still cannot properly cope with extremely frequent and abrupt traffic fluctuation scenarios. The operating frequency of the FSR will frequently switch as a consequence of the instantaneous traffic fluctuating abruptly and frequently. Especially in the STP implementation, these frequent fluctuations can lead to extra power consumption and may cause huge packet loss during frequency switching.
To eliminate these deficiencies associated with threshold-based policies, a packet loss-aware policy is introduced. The only criterion of PLAP to switch to a higher frequency is when packet loss is detected. The PLAP cannot be used standalone; it can be used in conjunction with DTP to deal with frequency scaling up scenarios; the operating frequency can be switched to a higher level as soon as the processing engine detects any packet loss. This scaling up is following a level-by-level mechanism, which means that switching only appears between adjacent frequency levels regardless of the fixed preset thresholds to minimize the transition overheads for extremely fluctuating traffic scenarios. DTP controls frequency scaling down scenarios. Figure 8 presents the flowchart of the PLAP.
5. Experiments
Several tailor-made experiments are conducted to compare the performance and the power consumption of the FSR and that of the RR. Each experiment has a unique behaviour, purpose and suitability to investigate and explore the latent relationship among operating frequency, performance and power consumption. The interaction and interdependency among these three individual factors then can be interpreted and explained.
5.1. Lab Setup
The lab setup consists of two NetFPGA boards and two desktop computers as corresponding board hosts installed with CentOS 5.5. The two experimental NetFPGA boards are both in Version 2.1 Revision 3. The NetFPGA board is a research platform with open source hardware and software resources. The developers could start with publicly-available NetFPGA packages to design and implement their own mechanisms or algorithms with new custom modules.
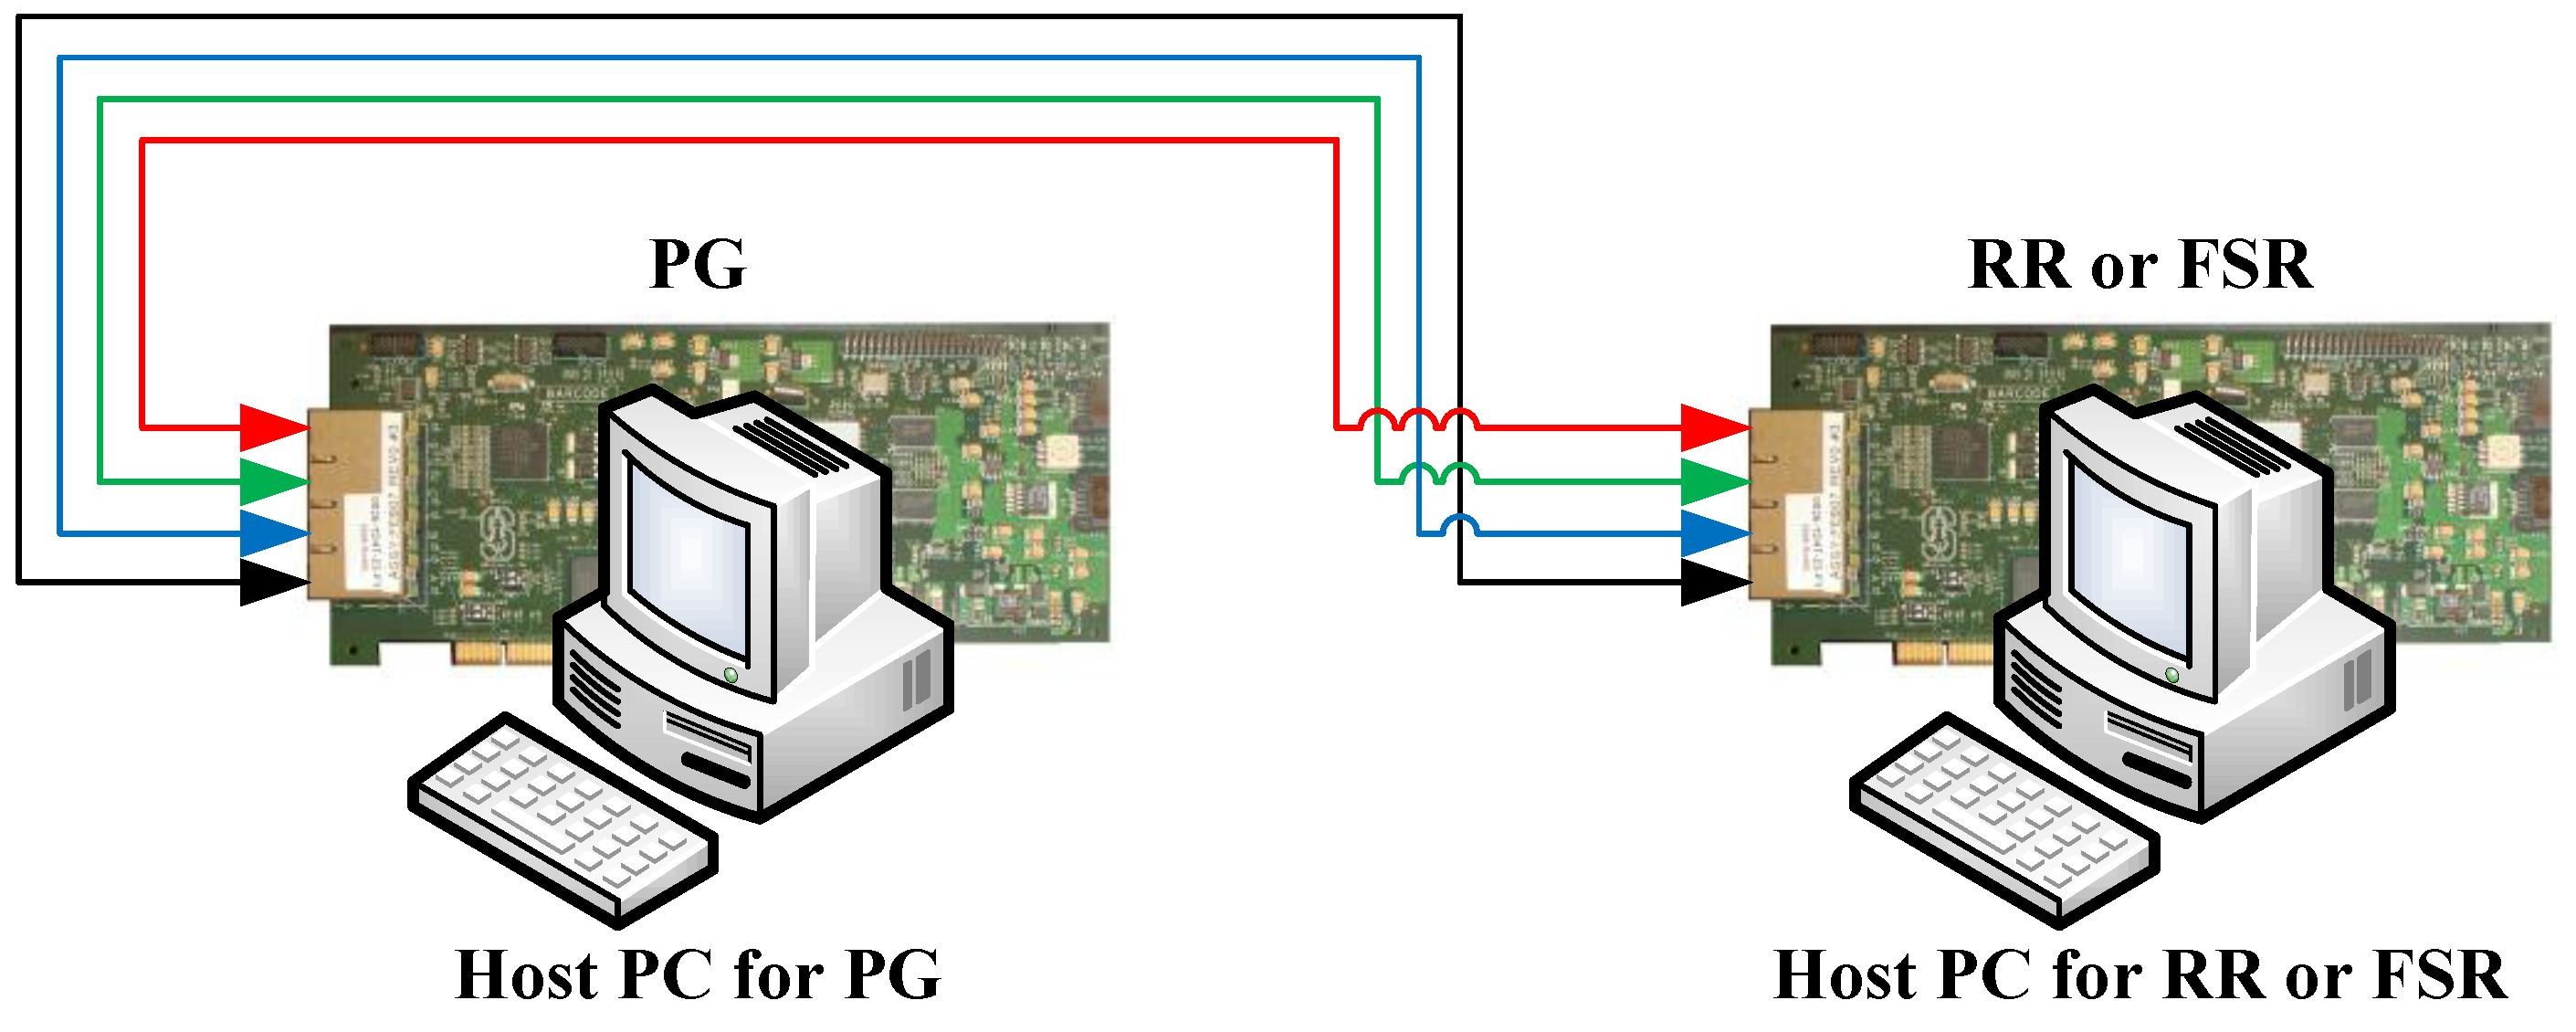
As shown in Figure 9, one NetFPGA board is configured as a packet generator (PG) [26], while the other one is configured as the RR or the FSR in turn for power consumption and performance measurements. Network traffic with different bit rates and packet sizes is generated by the PG and sent from its four Ethernet ports to the corresponding ports on the RR or the FSR. Then, the traffic is routed through the four Ethernet ports on the RR or the FSR with different operating frequencies and sent back to the corresponding ports on the PG.
Power consumption measurements were taken using a smart PCI bus extender, a data acquisition unit (DAQ) and associated software. As mentioned in [27,28], the PCI bus extender could precisely measure the real-time power consumption of a PCI-based board. The DAQ is optimized for superior accuracy at fast sampling rates. A software script on a computer was used to collect the power consumption data automatically read from the DAQ. For fixed traffic experiments, power consumption is calculated as the average of three million samples at 764,000 samples per second, and thus, each power consumption measurement takes about 3.926 (i.e., 3,000,000/764,000) s.
5.2. Evaluation Metrics
Power consumption: Power consumption in a network device is the sum of two components: quiescent power and dynamic power. Quiescent power is the static power drawn by the device when it is powered up, configured with user logic, but there is no traffic load. Dynamic power is the power consumed during processing traffic load in the core or I/O of the device, and it is, therefore, frequency dependent. The total power consumption of a network device can be modelled as a linear function of the traffic characteristics as given in Equation (1) [29]:
where P is the total power, P is the quiescent power, P is the dynamic power, A is the activity factor, such as the fraction of the circuit that is switching, C is the load capacitance, f is the core operating frequency and V is the supply voltage. For a given NetFPGA board, P, C and V are fixed values, and A is affected by the number of active ports, the instantaneous traffic bit rate and the forwarding packet size.
The power Equation (1) is the guideline for the theoretical analysis. In operation, the NetFPGA 1G board is a PCI-based board, and all of the power supplies are derived from the 3.3-V and the 5-V power rails on the PCI bus. The embedded FPGA chips draw power from the 3.3-V rail of the PCI bus, and the PHY components are supplied by the 5-V rail. The 3.3-V and 5-V pins of the PCI bus extender are used to measure the overall current drawn by the 3.3-V and 5-V powered components on the NetFPGA board mounted on the PCI bus extender. Hence, the total power consumption can be calculated with Equation (2):
where P is the total power, I is the total current of the board components’ drawn power from the 3.3-V rail of the PCI bus and I is the total current of 5-V powered components.
Performance: The peak measured throughput is the peak measured rate of successful data delivery over a real implemented system. In the performance evaluation, it is the most important metric to be measured because it directly determines the preset threshold in the frequency control policies. Each operating frequency has an associated traffic throughput threshold beyond which the router will begin to lose a significant number of packets. The peak measured throughput must be measured as accurately as possible. Otherwise, the difference between the input traffic load and inaccurate preset threshold could degrade the performance of the FSR.
The round trip time (RTT) is also an important network performance measure in the performance evaluation. It is the propagation time taken for a packet to travel from a specific source to a specific destination and return back to the source. Measuring the RTT assists network operators and end users in understanding the network performance and taking measures to improve the QoS if needed.
To ensure the required QoS, a router should speedily and accurately forward data packets with little or no packet loss. Packet loss is another important metric adopted in the performance evaluation in the experiments. In the NetFPGA user data path pipeline, packet loss occurs in four MAC receive queues and four MAC output queues, but not in any MAC transmit queues. This is because the transmit queues simply take packets from the corresponding output queues and send the packets out through the Ethernet ports. Thus, the total packet loss can be calculated with the following equation:
where L is the total packet loss, L is the total packet loss in the four receive queues and L is the total packet loss in the four output queues.
Transition time is closely associated with packet loss. It is the time required for the router to switch from one frequency to another. Experimental results show that, under constant heavy traffic load, a longer transition time could result in greater packet loss, especially during scaling from a lower frequency to a higher one. Thus, transition time is another important metric in the performance evaluation.
5.3. Fixed Traffic Experiments
As indicated in Equation (1), the total power consumption of a router is affected by the operating frequency, the number of active ports, the traffic bit rate and the packet size. To evaluate the impact of each of these factors on the performance and power consumption of the RR and the FSR, a series of carefully designed experiments is conducted.
We start with measuring the power consumption of the RR and the FSR in idle state when the board is configured as the RR or the FSR, but without routing any traffic. To evaluate the impact of the operating frequency and the number of active ports on the power consumption, the RR bit file and the FSR bit file are, in turn, downloaded into the core logic FPGA processor and configured as an RR and an FSR for comparison. The four Ethernet ports are activated one by one, and the power consumption of the RR and the FSR is measured at their allowed operating frequencies. The measurement results show that the power consumption of a router is proportional to the number of active ports, with approximately 1 W additional power consumption for each activated port.
As shown in Table 3 and Table 4, the results indicate that under the same operating frequencies of 125 MHz or 62.5 MHz, the FSR consumes more power than the RR. This is due to the fact that an additional AFIFO module and several frequency division modules are integrated into the FSR. Each additional module incurs additional power consumption. Moreover, for the RR, the two SRAMs work synchronously with the core logic FPGA processor for writing and reading data at 125 MHz or 62.5 MHz. For the FSR, the core logic can be scaled among five different frequencies of 125 MHz, 62.5 MHz, 31.3 MHz, 15.6 MHz and 7.8 MHz, but the two SRAMs are working asynchronously with the core logic and running at 125 MHz constantly. This means the power consumption difference between the RR and the FSR at 62.5 MHz is even more than that at 125 MHz, because at 62.5 MHz, the two SRAMs run at 62.5 MHz in the RR and run at 125 MHz in the FSR, although the core logic FPGA processor is running at the same 62.5 MHz.
The traffic characteristics (traffic bit rate and packet size) could also affect the power consumption. As indicated in [14], the packet sizes of 64 Bytes, 576 Bytes and 1500 Bytes are typical packet sizes in real network links, and the packet size profile peaks at 64 bytes and 1500 bytes. The minimum size of a standard Ethernet packet is 64 bytes. One thousand five hundred bytes is the maximum transmission unit (MTU) for Ethernet. MTU is an important factor for network throughput and should be as large as possible, because larger MTU introduces less overhead for payload transmission. In multi-network environments, if a maximum-sized packet travels from a network with a larger MTU to a smaller MTU network, the packet will have to be fragmented to smaller-sized packets. Five hundred seventy six bytes is the default IP maximum datagram size. It is also the default conservative packet size that all IP routers support.
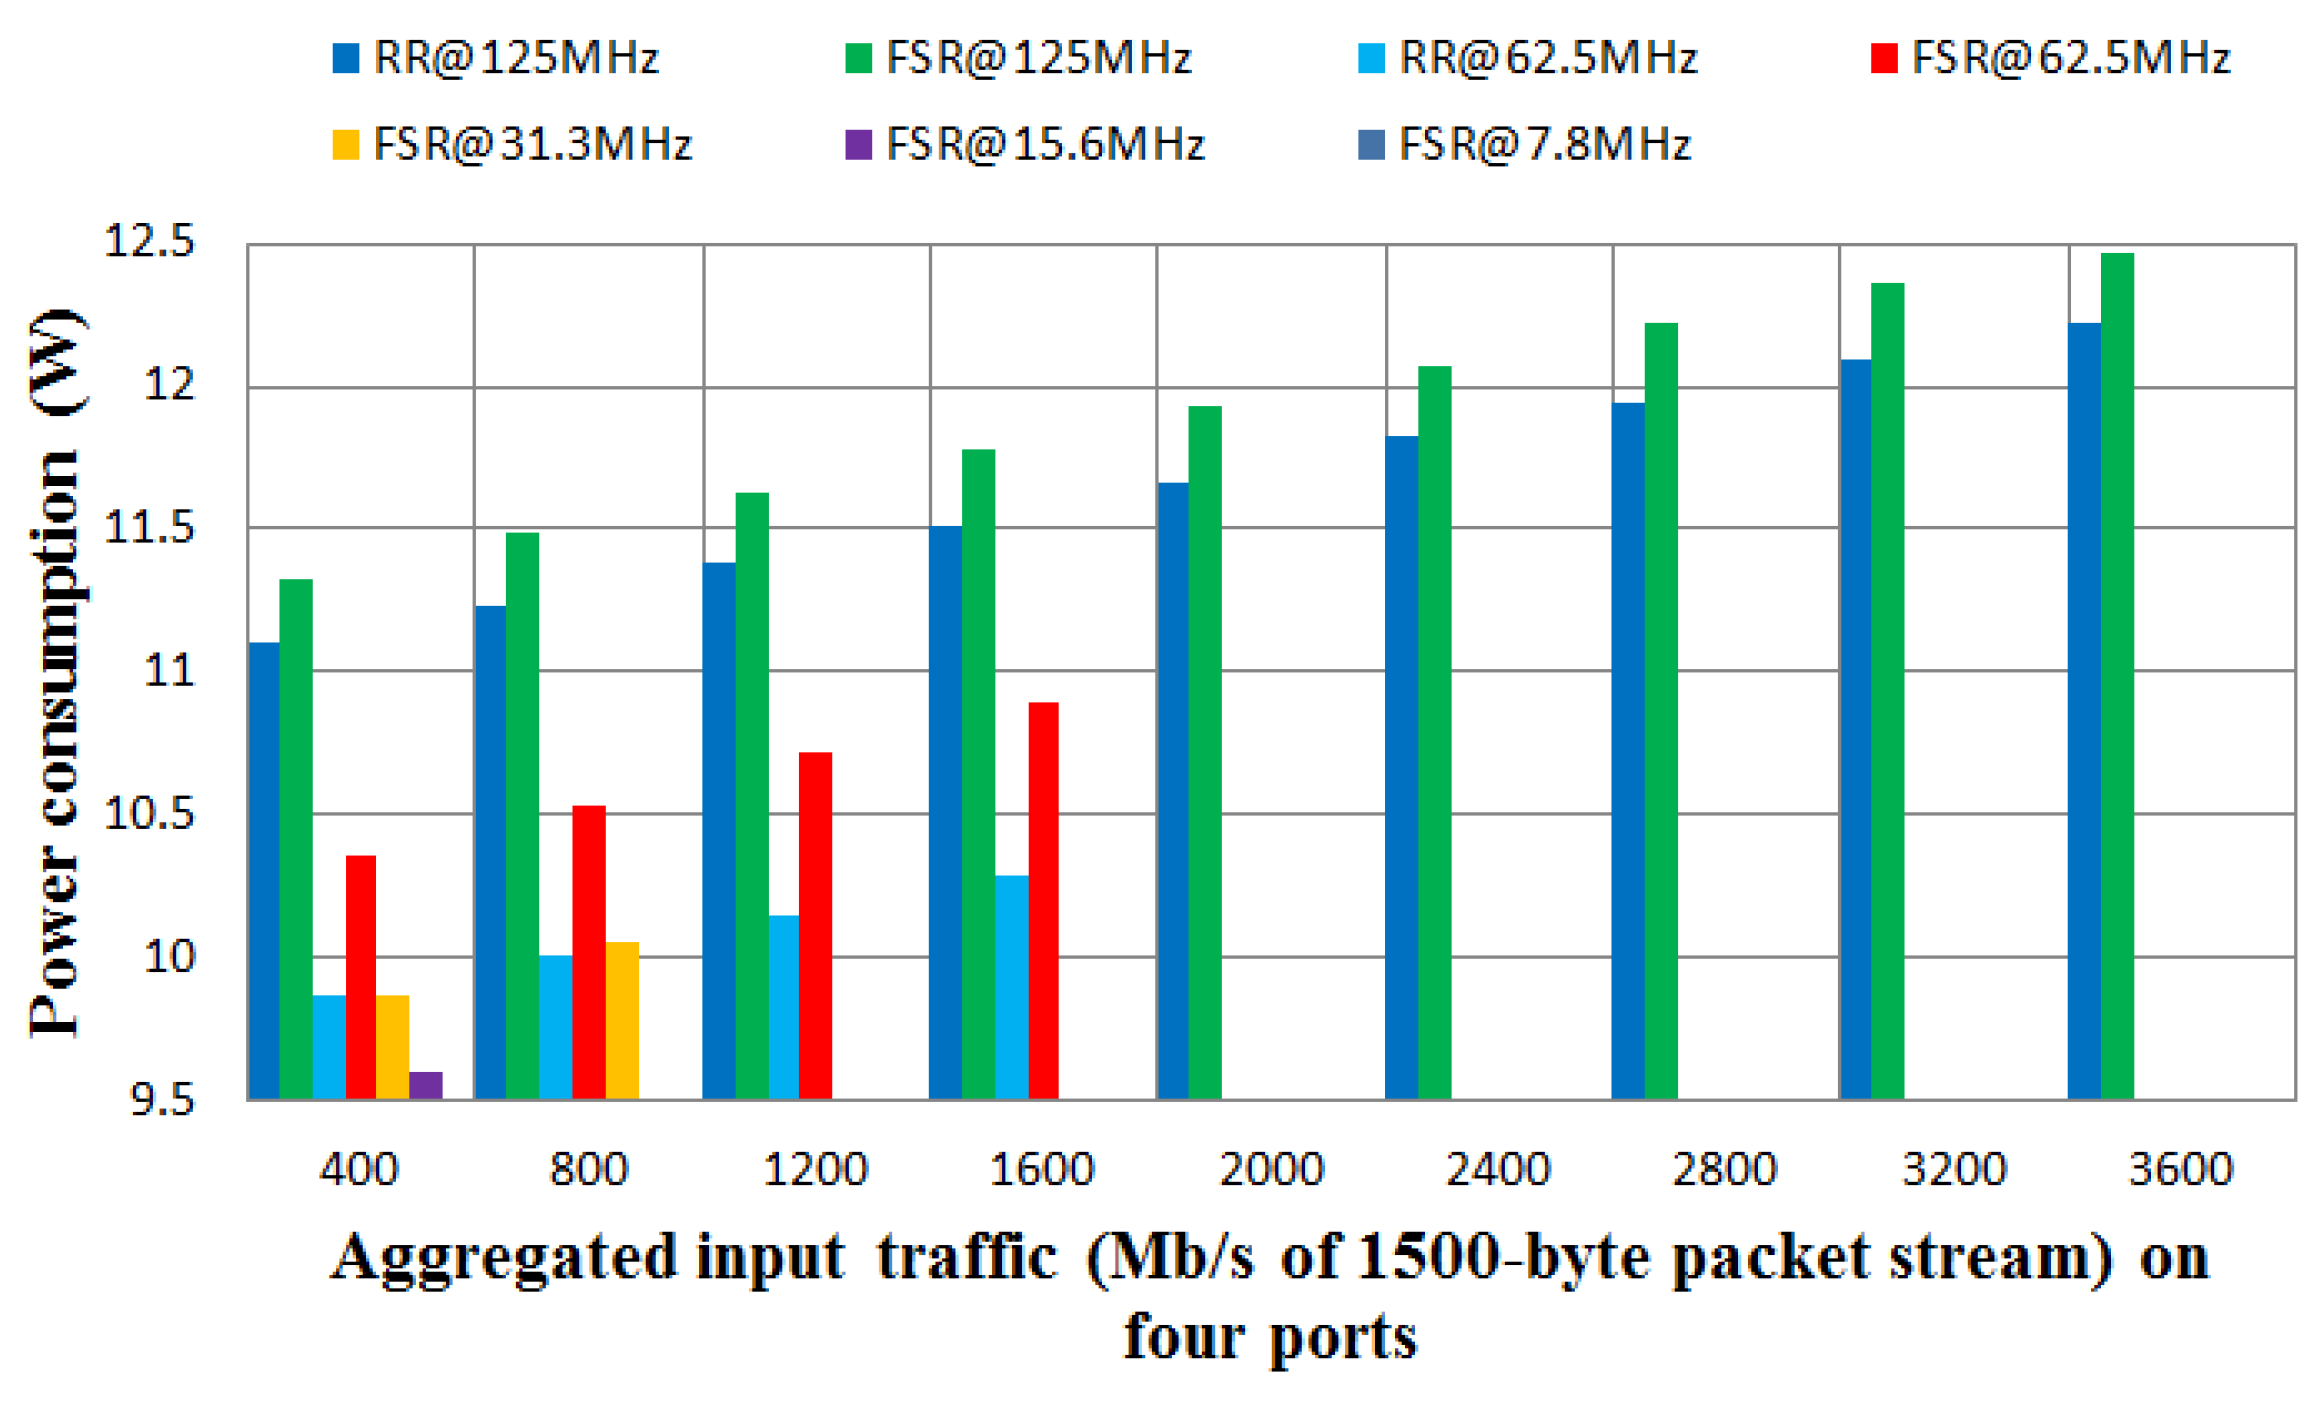
To evaluate the impact of the traffic characteristics on the power consumption, a series of experiments were performed using different operating frequencies (125 MHz, 62.5 MHz, 31.3 MHz, 15.6 MHz and 7.8 MHz), different traffic bit rates (from 100 Mb/s to 1 Gb/s for each link) and different packet sizes (64 bytes, 576 bytes and 1500 bytes). Packet streams are sent from the four ports on the packet generator, routed through the four ports on the router and back to the corresponding ports on the packet generator. Figure 10 shows an example of the total power consumption of the RR and the FSR under the same 1500-byte packet stream with different operating frequencies and different aggregated input traffic bit rates. Experimental results indicate that power consumption is proportional to the traffic bit rate and the operating frequency for both the RR and the FSR. Refer to Equation (1); a higher traffic bit rate means a higher activity factor A, which represents the average number of switching events of the transistors in the chip. Increasing the operating frequency of a router also increases its power consumption.
One key point to be noted is that the power differences between the RR running at 125 MHz and 62.5 MHz come from the power consumption difference in both the core logic FPGA processor and the two SRAMs, whereas the power consumption differences in the FSR only come from the core logic FPGA processor because the two SRAMs are always running at 125 MHz. Figure 10 also presents that at the same working frequencies of 125 MHz or 62.5 MHz, the FSR consumes more power than the RR, due to the additional AFIFO module and frequency division modules. Although at the same operating frequency, the FSR consumes around 6% more power than the RR, experiments with real traces in the next subsection indicate that the FSR can work at lower frequencies when the traffic is low, so that it will result in overall 46% power savings. For light load traffic, DFS-enabled routers can save a significant amount of power rather than leaving routers always on the maximum operating frequency all of the time.
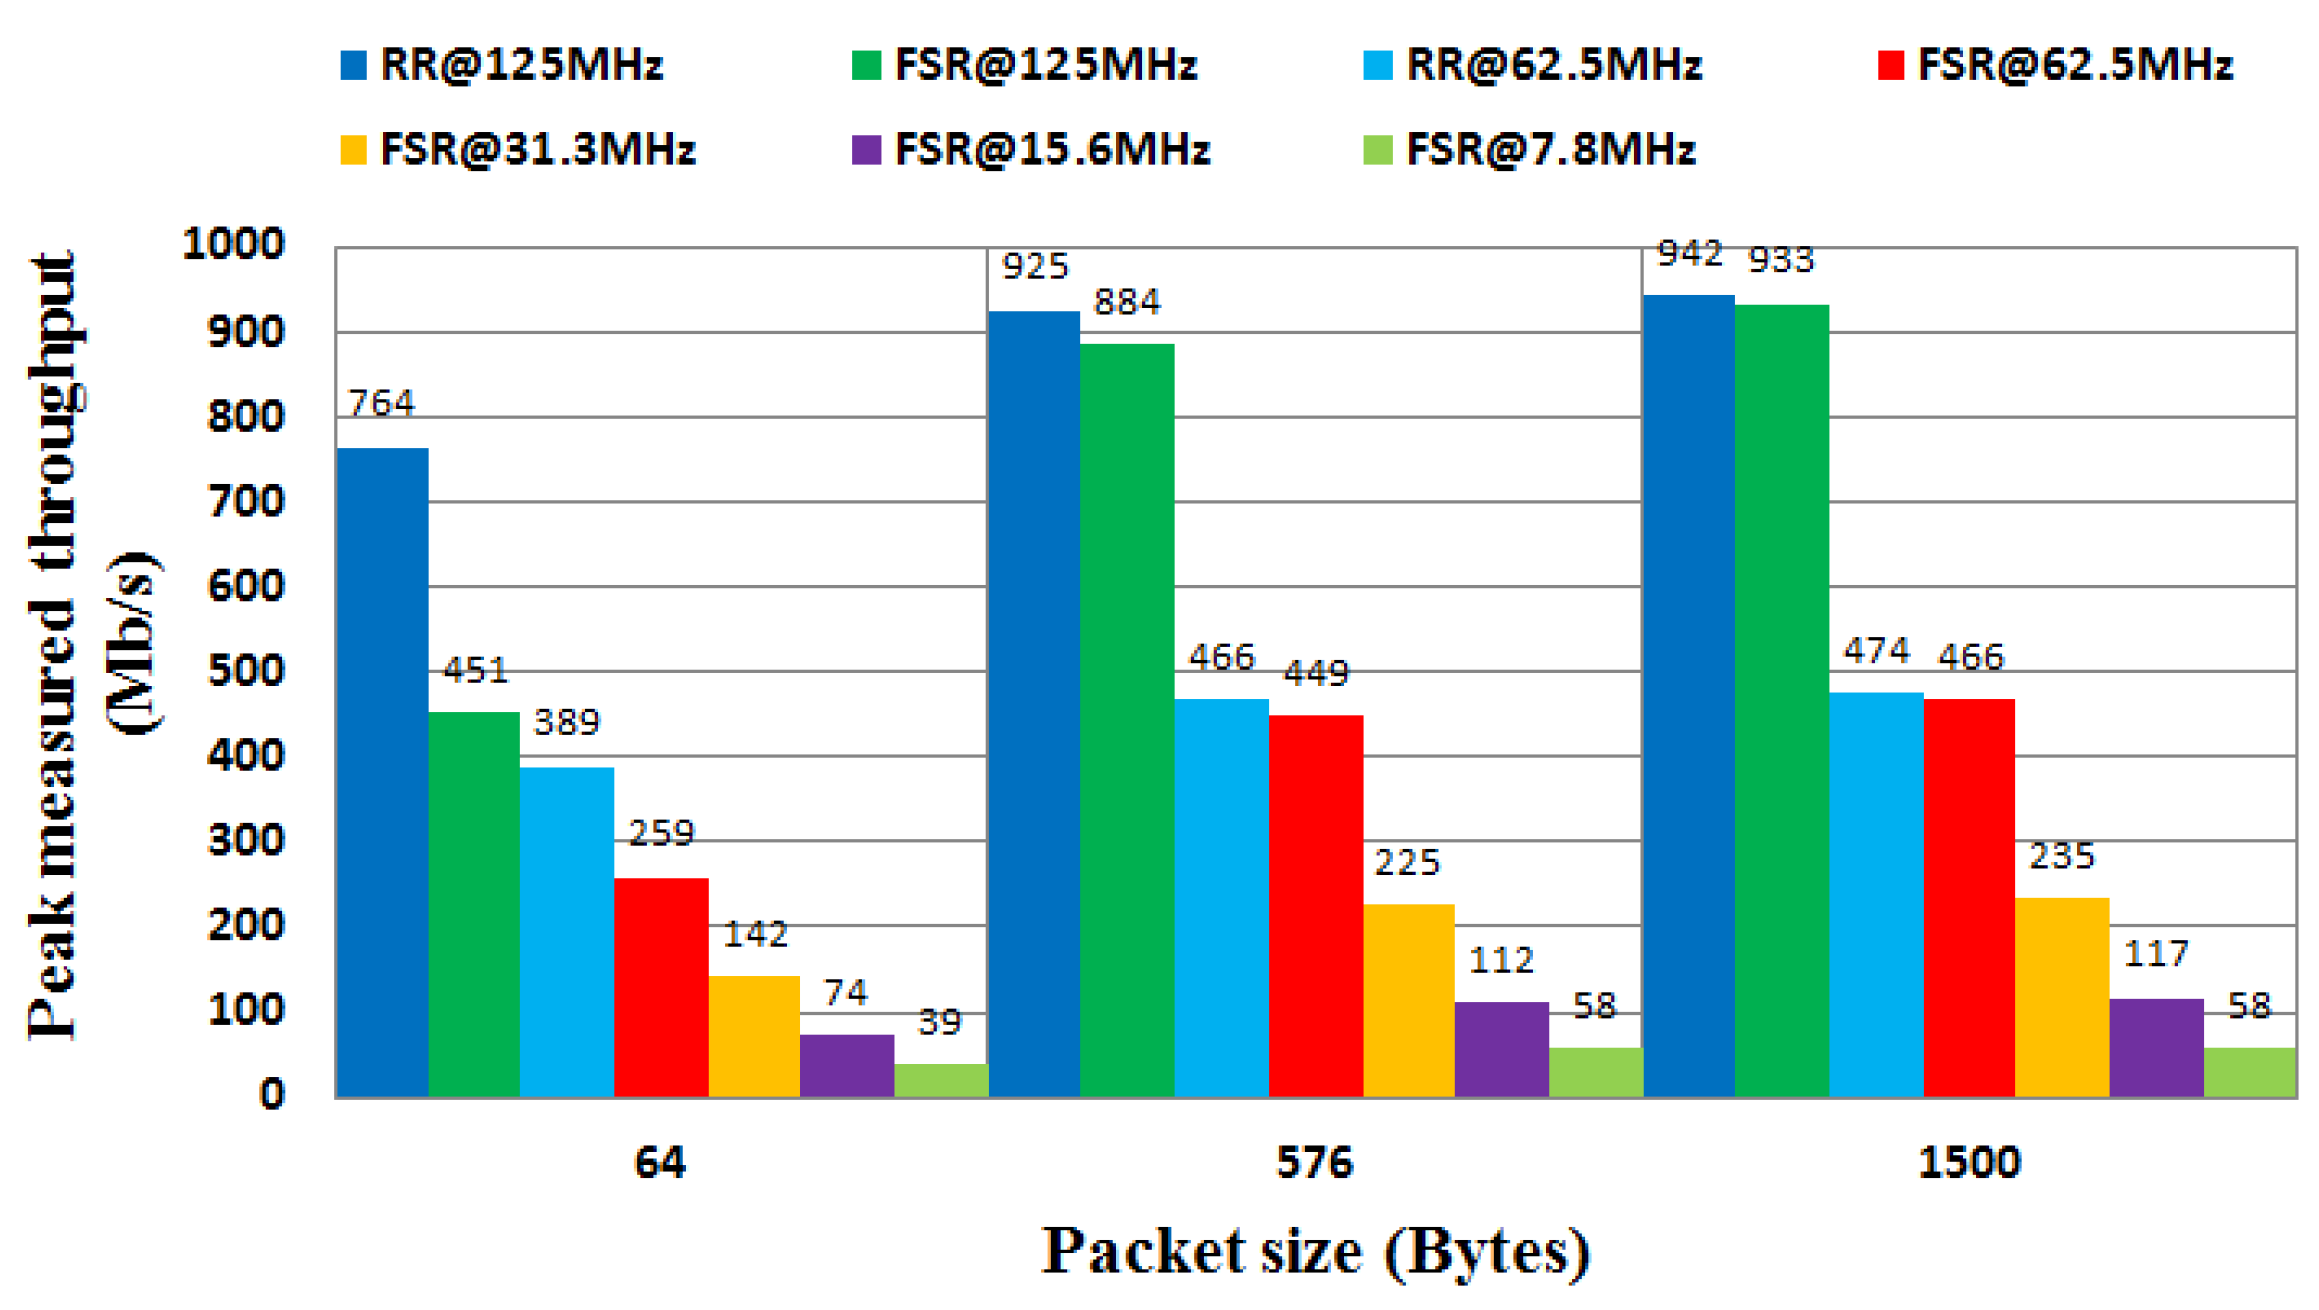
To evaluate the impact of the operating frequency and the traffic characteristics on the performance, the link capacity is one of the most important metrics to be firstly measured. Link capacity is also known as the peak measured throughput. Figure 11 presents the link capacity of the RR and the FSR under different operating frequencies and different typical packet sizes. Experimental results show that a higher operating frequency and a larger packet size could lead to higher link capacity. A higher frequency produces more cycles per second to fit more data in per second, and it thus provides higher routing capacity. Due to the less overhead incurred by packet head processing, a larger packet size typically means higher routing capacity for routers, or lower power consumption, or both. Therefore, it is advisable to use larger packet sizes whenever possible.
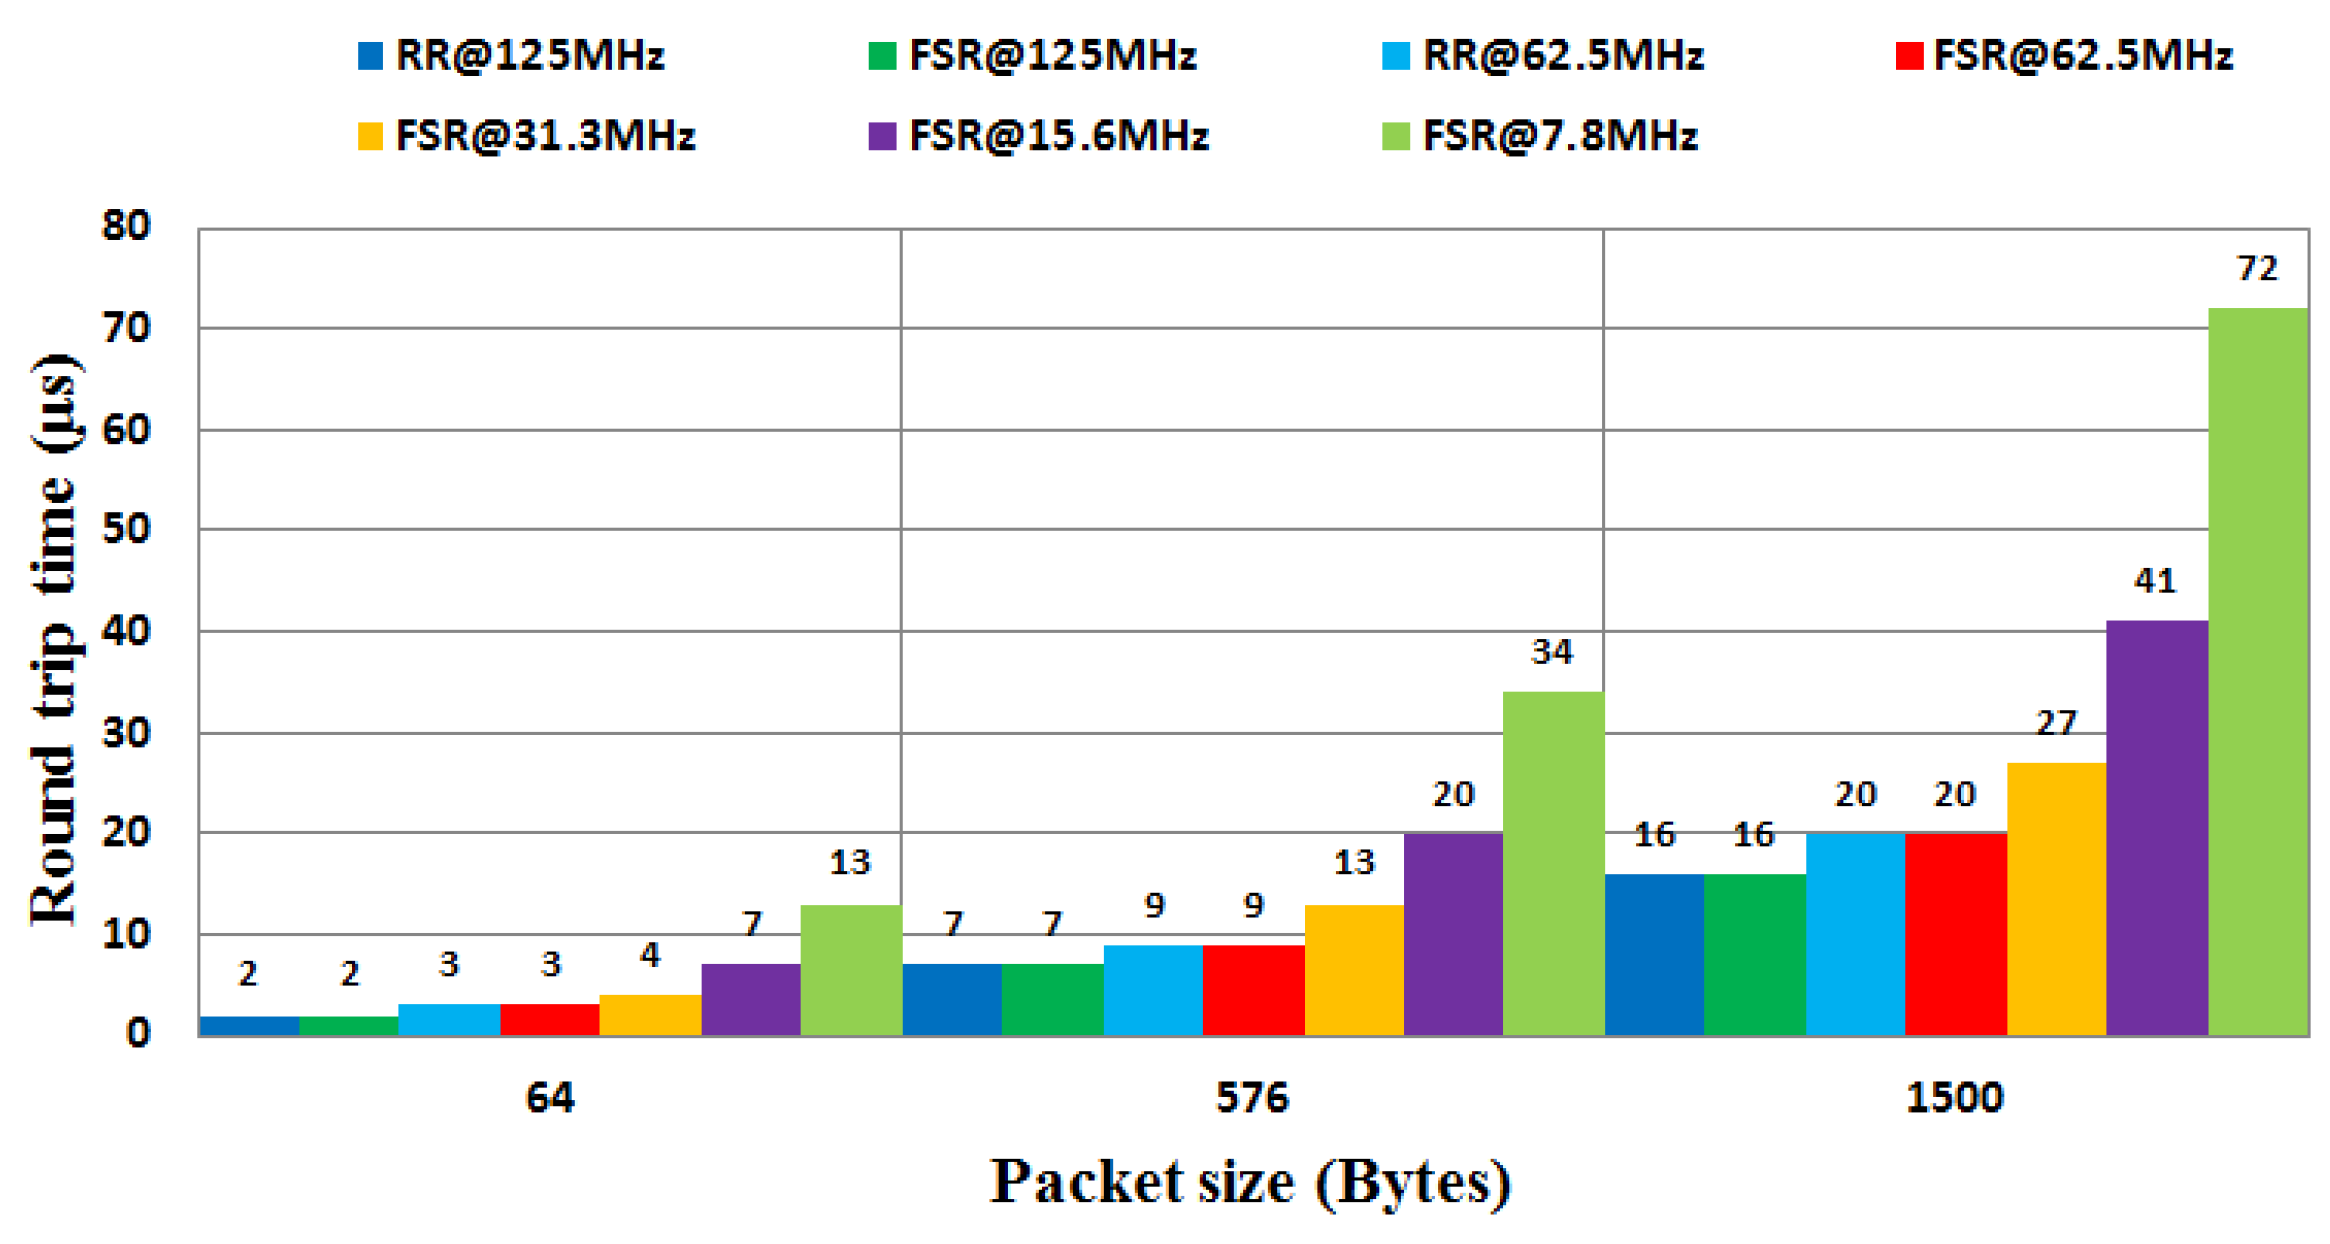
The operating frequency and the traffic characteristics could also affect the RTT. The RTT is measured using the NetFPGA packet generator [26] to achieve more accurate RTT results due to the fact that timestamping in PG is performed in hardware. Compared to using hardware, the software RTT measurements, such as ping, involve the process of notifying the kernel when a packet arrives. Transferring the packet into the kernel introduces a variable delay, thus limiting the accuracy of the results. In addition, the RTT measurements are performed by passively measuring the RTT using widely-deployed TCP timestamp options carried in TCP headers. Thus, the hardware RTT measurements do not need to launch out-of-band Internet Control Message Protocol (ICMP) echo requests (pings) nor embed timing information in application traffic.
In the RTT measurements, the experimental setup is somewhat different from the lab setup in Figure 9. All four ports are used to measure the RTT: two ports of the PG are connected directly to one another, and the RTT is measured to provide a baseline RTT reference as RTT0; the other two ports of the PG are connected to the RR or the FSR under test; and the RTT is measured as RTT1. The RTT is calculated as the difference between RTT1 and RTT0. Figure 12 reports the RTT of the RR and the FSR under different operating frequencies and different packet sizes. Experimental results indicate that a higher operating frequency and a smaller packet size could give rise to a shorter round trip time. Compared to the smaller-sized packet, the larger-sized packet has a longer RTT because it takes longer time to buffer and process. For example, a packet 64 bytes long has a 2 µs RTT, while a packet 1500 bytes long has a 16 µs RTT with the same operating frequency of 125 MHz for the RR.
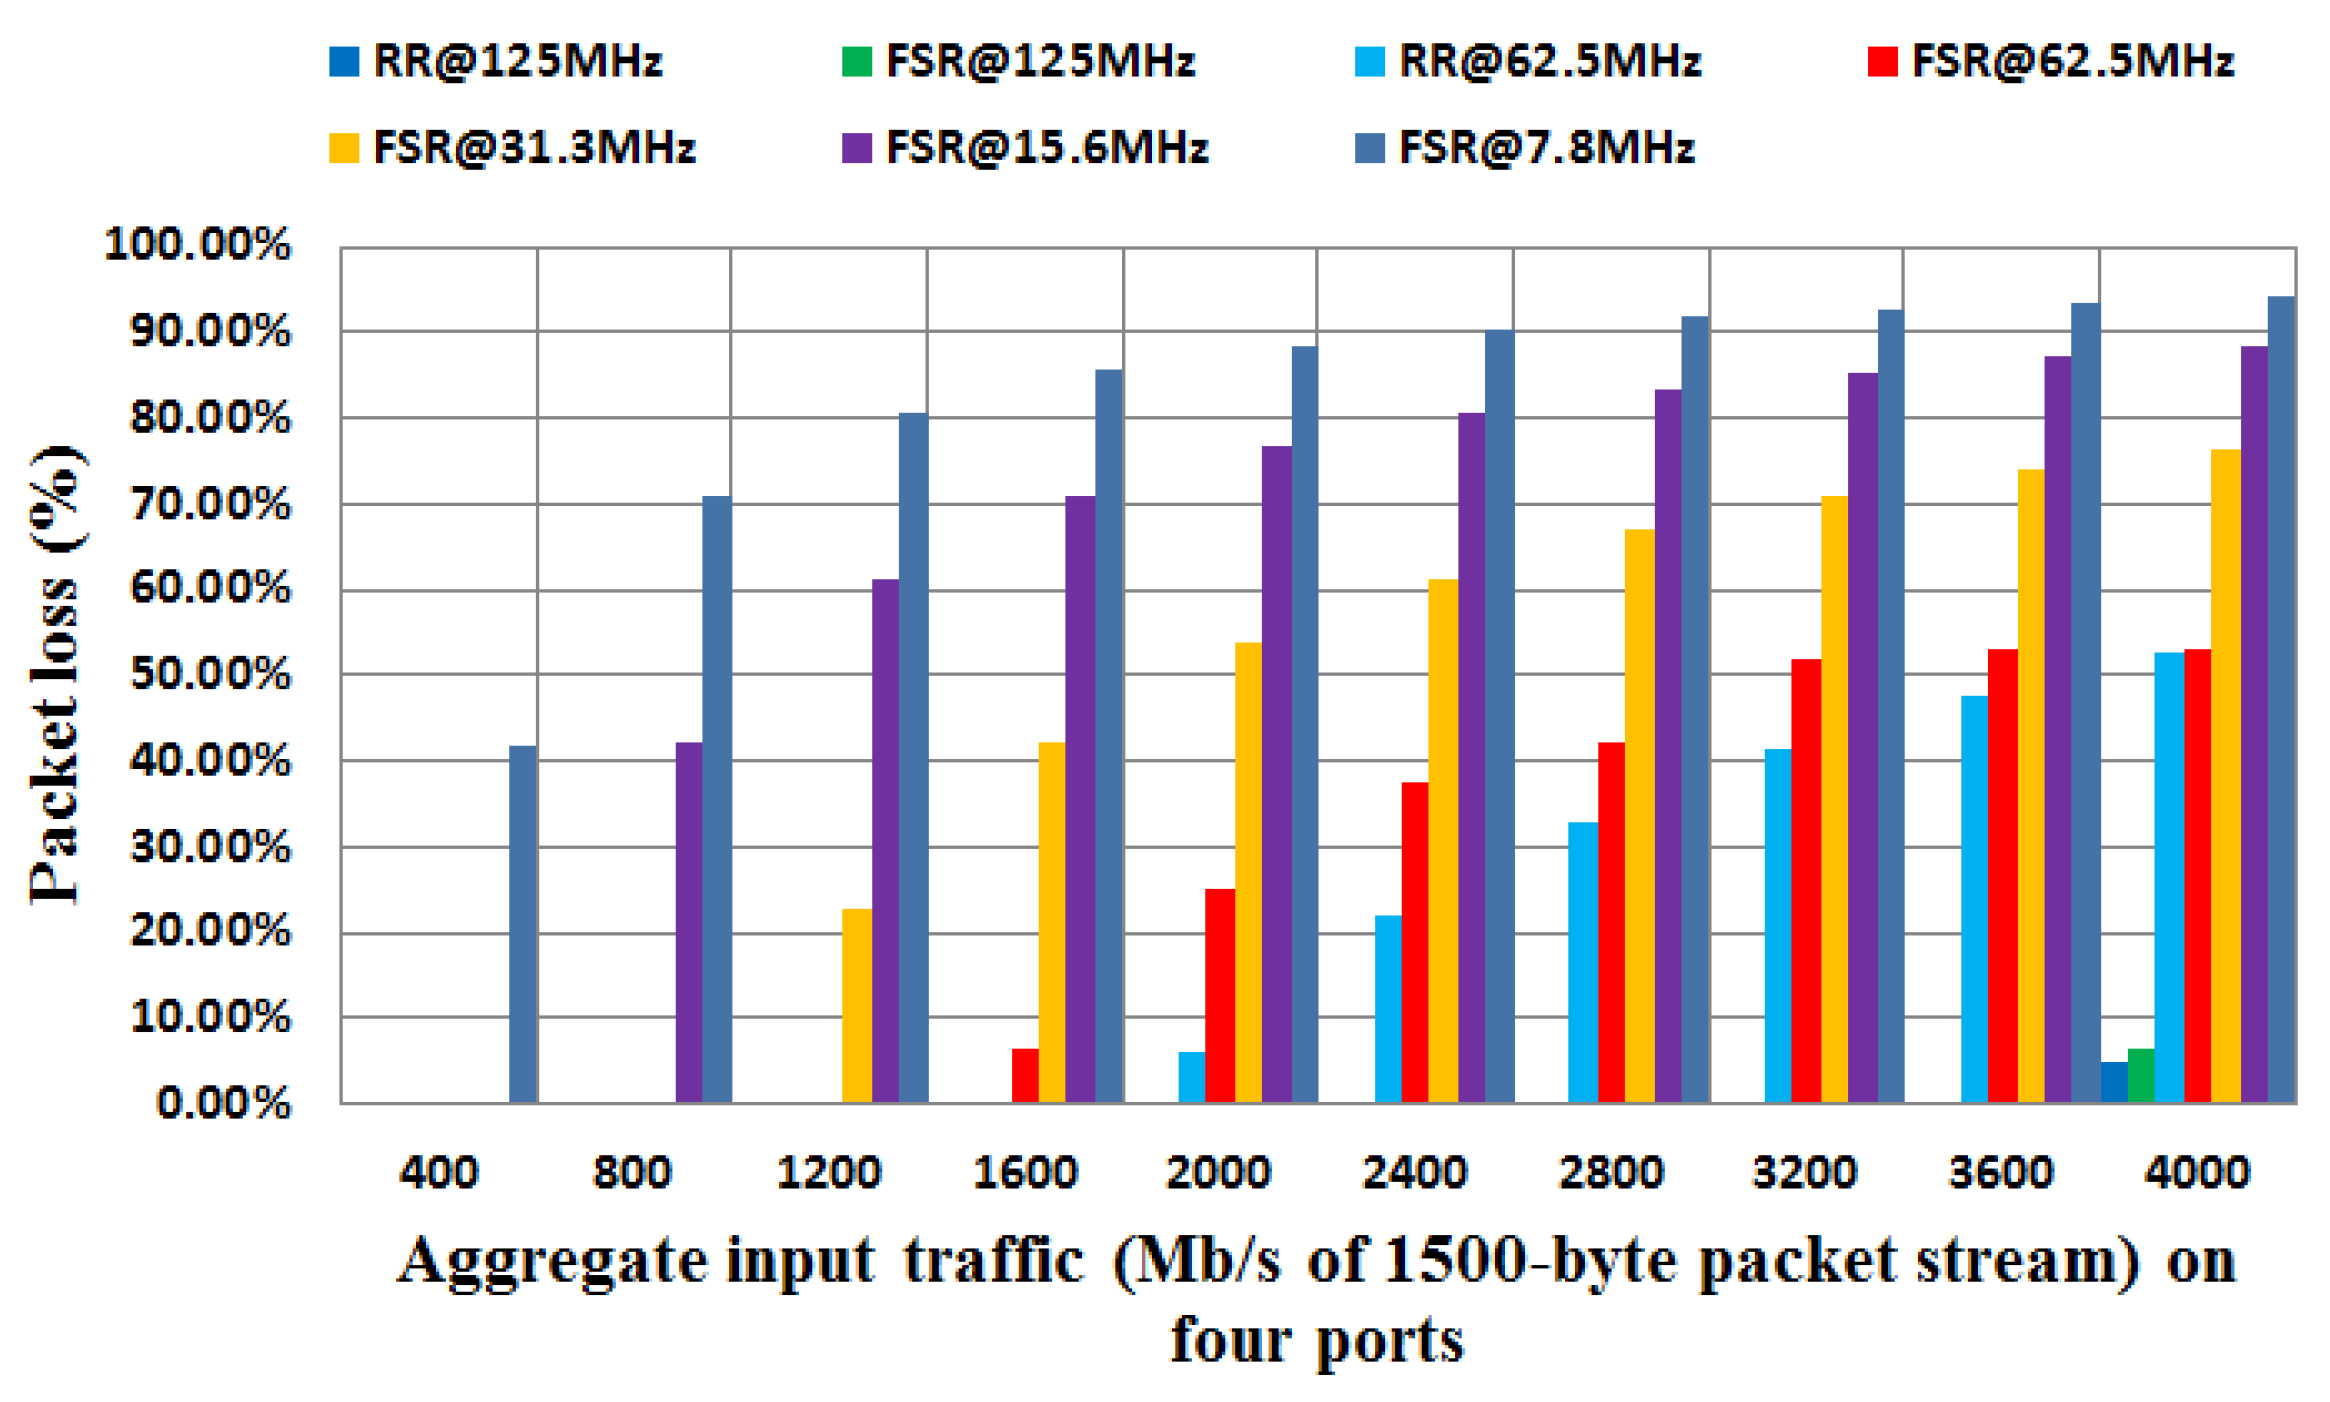
The traffic characteristics and the operating frequency also affect the packet loss. Figure 13 presents the packet loss of the RR and the FSR under the same 1500-byte packet stream with different operating frequencies and different aggregated input traffic bit rates. Experimental results indicate that, for both the RR and the FSR, the packet loss is proportional to the traffic bit rate. Besides, a higher operating frequency could result in lower packet loss.
5.4. Experiments with Real Traces
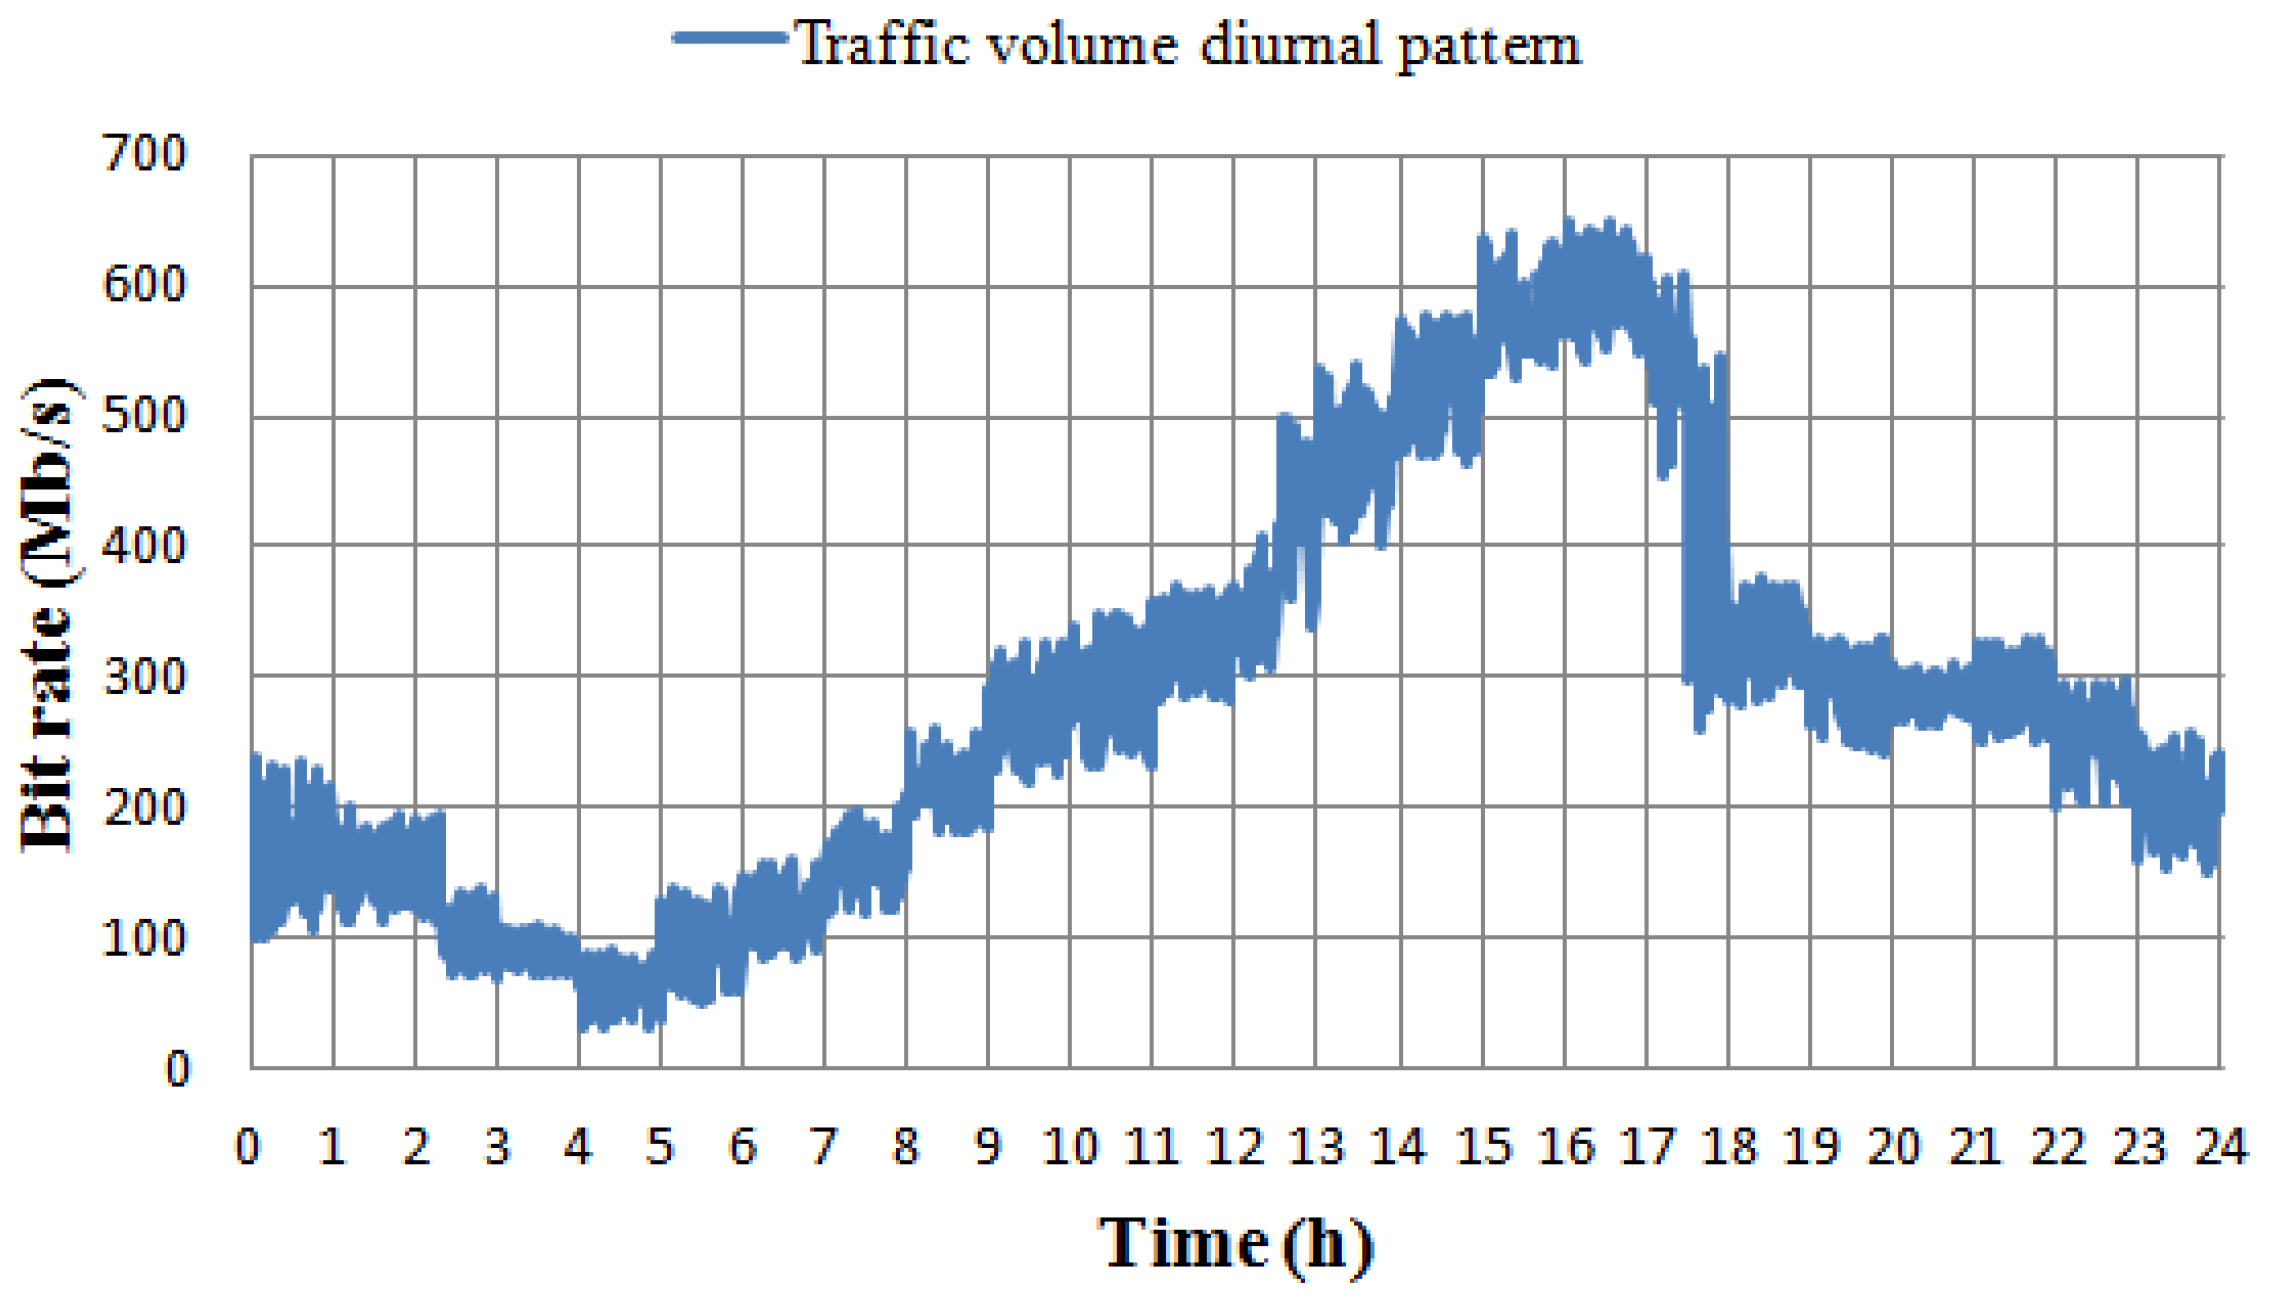
To evaluate the proposed FSR, real traces with an application mix of Transmission Control Protocol (TCP) and User Datagram Protocol (UDP) traffic (including the Internet’s most popular applications, Hypertext Transfer Protocol (HTTP), File Transfer Protocol (FTP), email, Domain Name System (DNS), Simple Network Management Protocol (SNMP), streaming media, etc.) were captured from a border router in the Dublin City University campus network. Figure 14 shows a clear link traffic volume diurnal pattern. In this diurnal pattern, the maximum traffic bit rate is approaching 649 Mb/s between 16:00 and 17:00, and the average traffic bit rate is about 280 Mb/s.
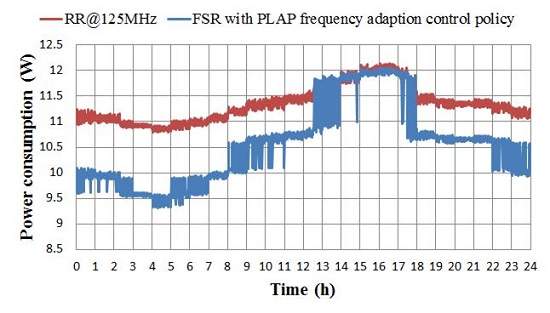
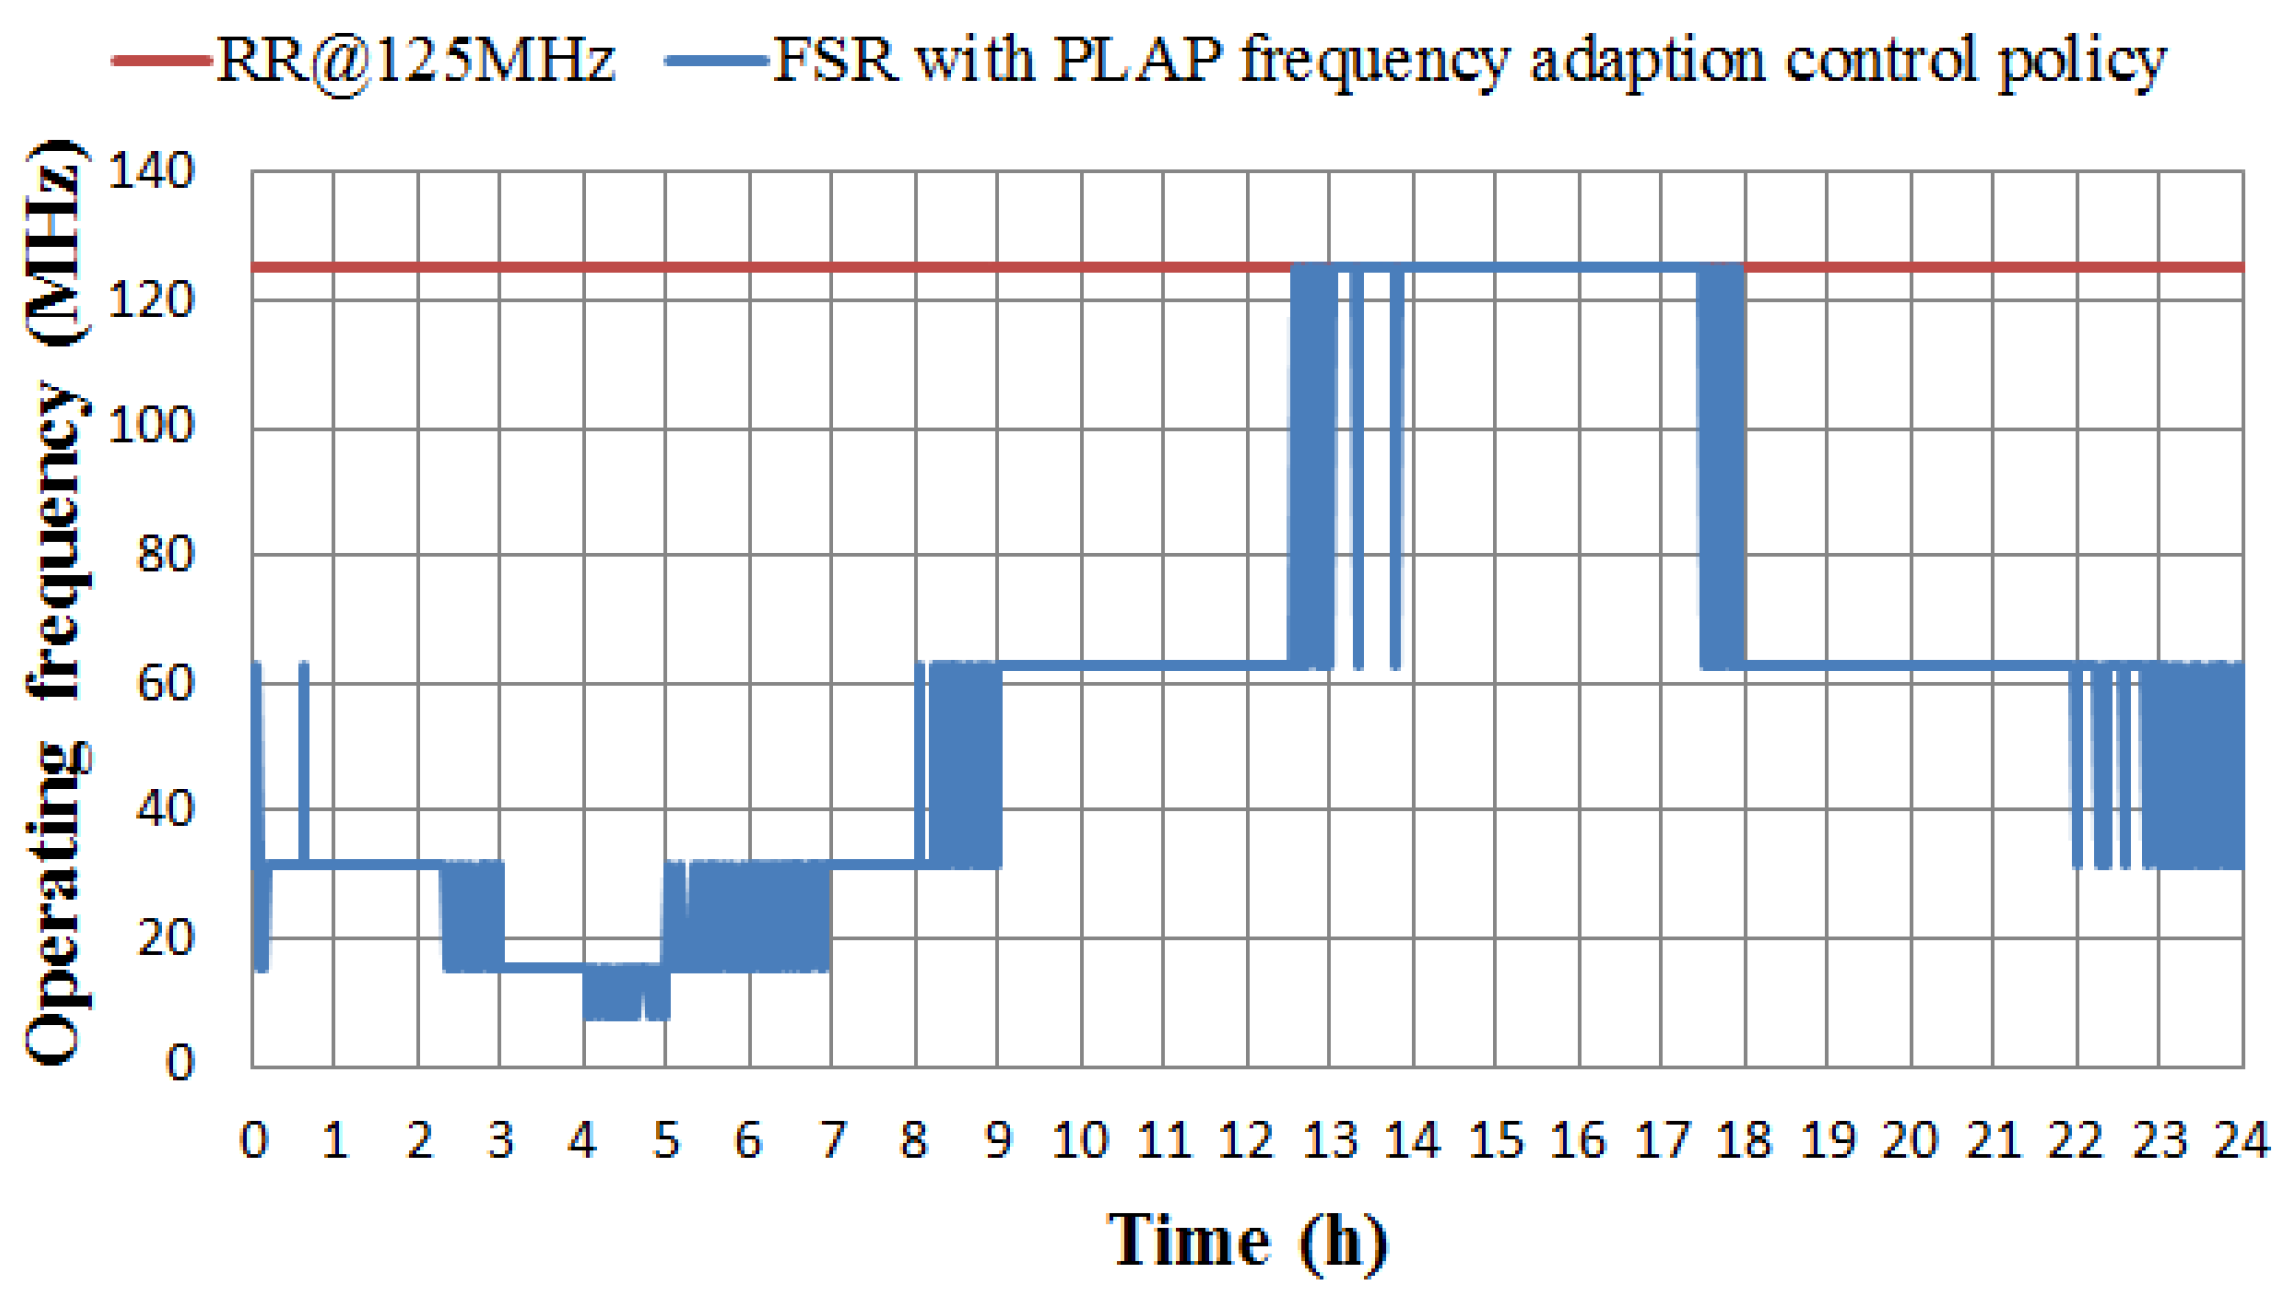
To quantify the benefits brought by the DFS technique, the captured traffic in Figure 14 was routed through the RR and the FSR in turn for power consumption and performance comparison. With the same traffic pattern, Figure 15 presents the corresponding operating frequencies of the RR and the FSR (packet loss-aware policy) for the day. As shown in Figure 15, the upper red line at 125 MHz represents that the RR is constantly working at 125 MHz. The lower blue curve demonstrates frequency switching from time to time in the FSR, indicating that the FSR is capable of working at appropriate frequencies in response to the instantaneous traffic load.
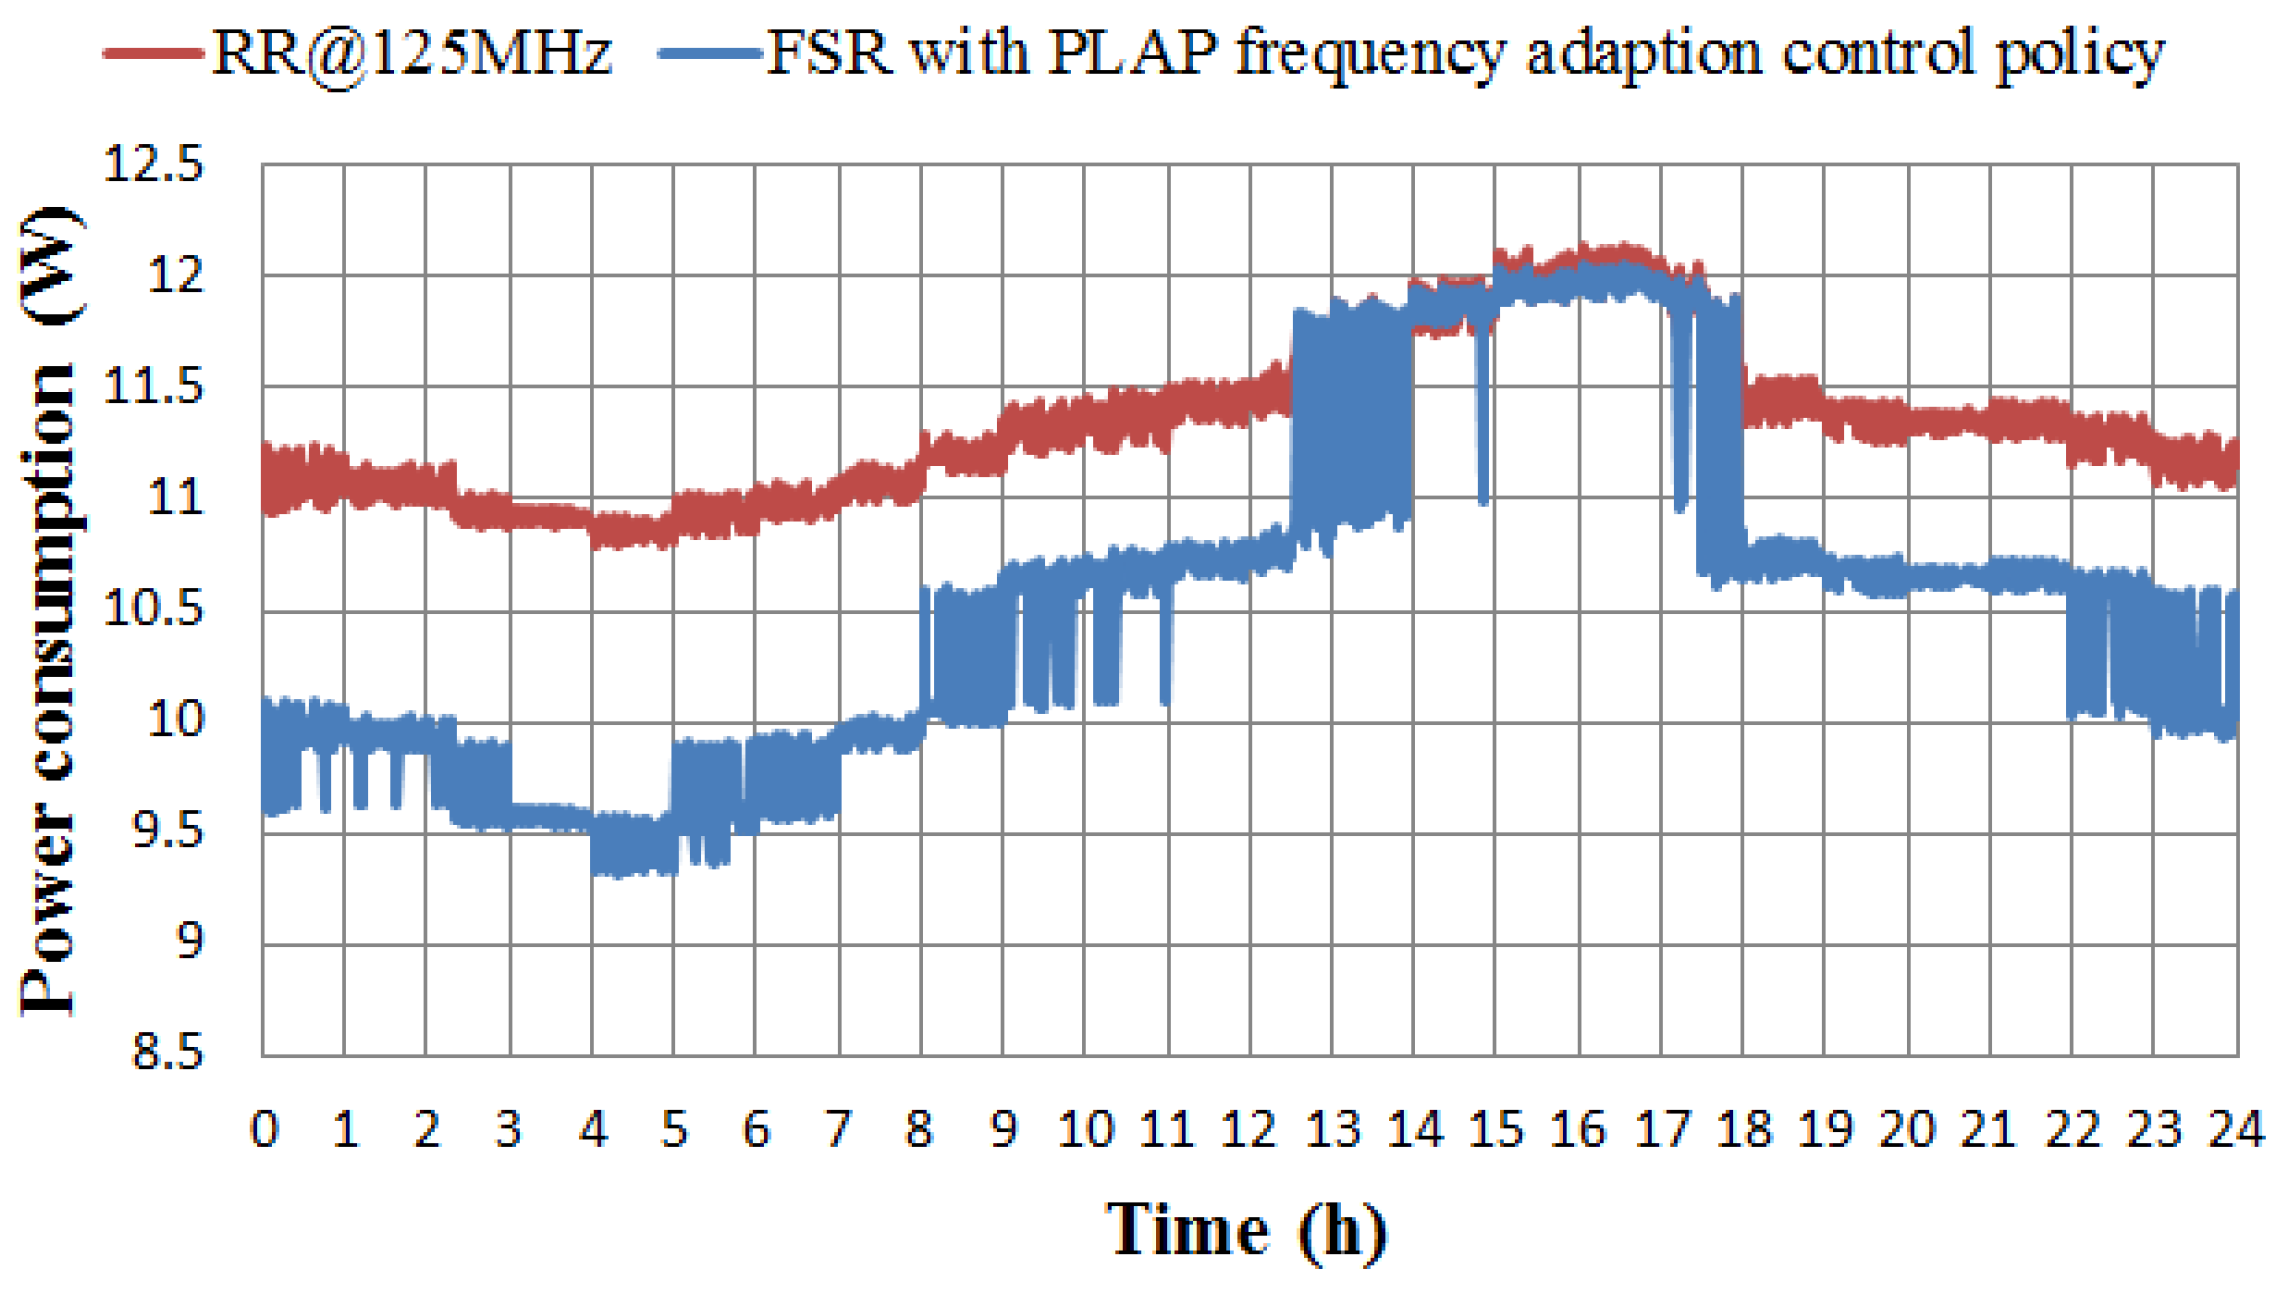
Figure 16 depicts the corresponding power consumption of the RR and the FSR for the day. Since the RR is running at the fixed frequency of 125 MHz, the power consumption of the RR (the upper red curve) fluctuates only in response to the traffic characteristics. However, the power consumption of the FSR (the lower blue curve) fluctuates sharply due to the fact that, in the FSR, both traffic characteristics and operating frequencies affect the power consumption. The difference between these two curves reveals the power savings from the DFS technique, which indicates that the FSR dynamically scales the operating frequency of the core FPGA processor among five different frequencies in response to the instantaneous traffic load, rather than leaving network routers running at the highest frequency all of the time.
If a fixed operating frequency is used throughout the day, a high frequency will ensure negligible packet loss, even during the peak period from 15:00 to 17:00 h in Figure 14, at the expense of high energy consumption. Adapting the frequency in accordance with one of the control policies described in Section 4 results in considerable energy savings. The resulting graph of operating frequency vs. time is shown in Figure 15 for the PLAP policy. Broadly similar results were obtained for the other two policies. The aggregate duration in each frequency mode for different control policies is shown in Table 5. The second highest available operating frequency (62.5 MHz) was selected for an aggregate of just less than ten hours during the day and the highest frequency (125 MHz) for about four and a half hours. Lower frequencies were needed for the remaining nine and a half hours of the day. This results in a significant power savings. The resulting power savings are shown in Table 6.
5.5. Combined with Other Green Techniques
Dynamic frequency scaling provides an active performance scaling feature to achieve energy proportional routing, which is the appropriate energy saving approach for network routers given that their connections have to be always on to keep a heartbeat to deal with routing protocols and unpredictable traffic (e.g., core routers). However, the energy efficiency improvements from dynamic frequency scaling are usually less than those from the Ethernet port shut-down. There are challenges to applying Ethernet port shut-down in core routers because, compared to active performance scaling, it takes more time and power to transition between the on and off state. Predicting the off period and adapting to the appropriate state is still difficult. The end routers, such as home routers, on the other hand, usually follow human behaviour, and Ethernet ports can be shut down when people sleep to achieve more power savings.
As indicated in our previous work [25,30], more power consumption can be saved by re-routing traffic to other ports when traffic on a port is low and turning off the port. Disabling each port can save around 1 W, and turning off the ports at both ends of the connection can result in an overall savings of around 2 W. For the NetFPGA router, turning off all four Ethernet ports can save around 4 W, while scaling down the frequency from 125 MHz to 7.8 MHz while keeping all four Ethernet ports active can save a maximum of only around 2.2 W. Thus, traffic re-routing through network-wide energy-aware traffic engineering coupled with disabling Ethernet ports is a more effective way to reduce power consumption.
An Ethernet port shut-down module is integrated into the FSR to disable an Ethernet port when there is no traffic going through the port for a period of time. With this module, the router can save significant power compared to leaving Ethernet ports fully on all of the time. In the Ethernet port shut-down module, several byte counter modules are introduced to count the number of bytes passing through each Ethernet FIFO queue. For a period of time, if there is no traffic to handle for an Ethernet port, the port is disabled until new packets come in. This module provides a way to locally control the Ethernet ports. The Ethernet ports can be also controlled by a network level power management technique. Energy-efficient traffic engineering is a promising network level technique to manage the routing path and to disable as many Ethernet ports as possible without significant packet delay and loss. If a network level technique is involved, network-wide coordination, such as the green abstract layer (GAL) [31], is compulsory. The GAL provides advanced power management capabilities to decouple distributed high level algorithms from heterogeneous hardware.
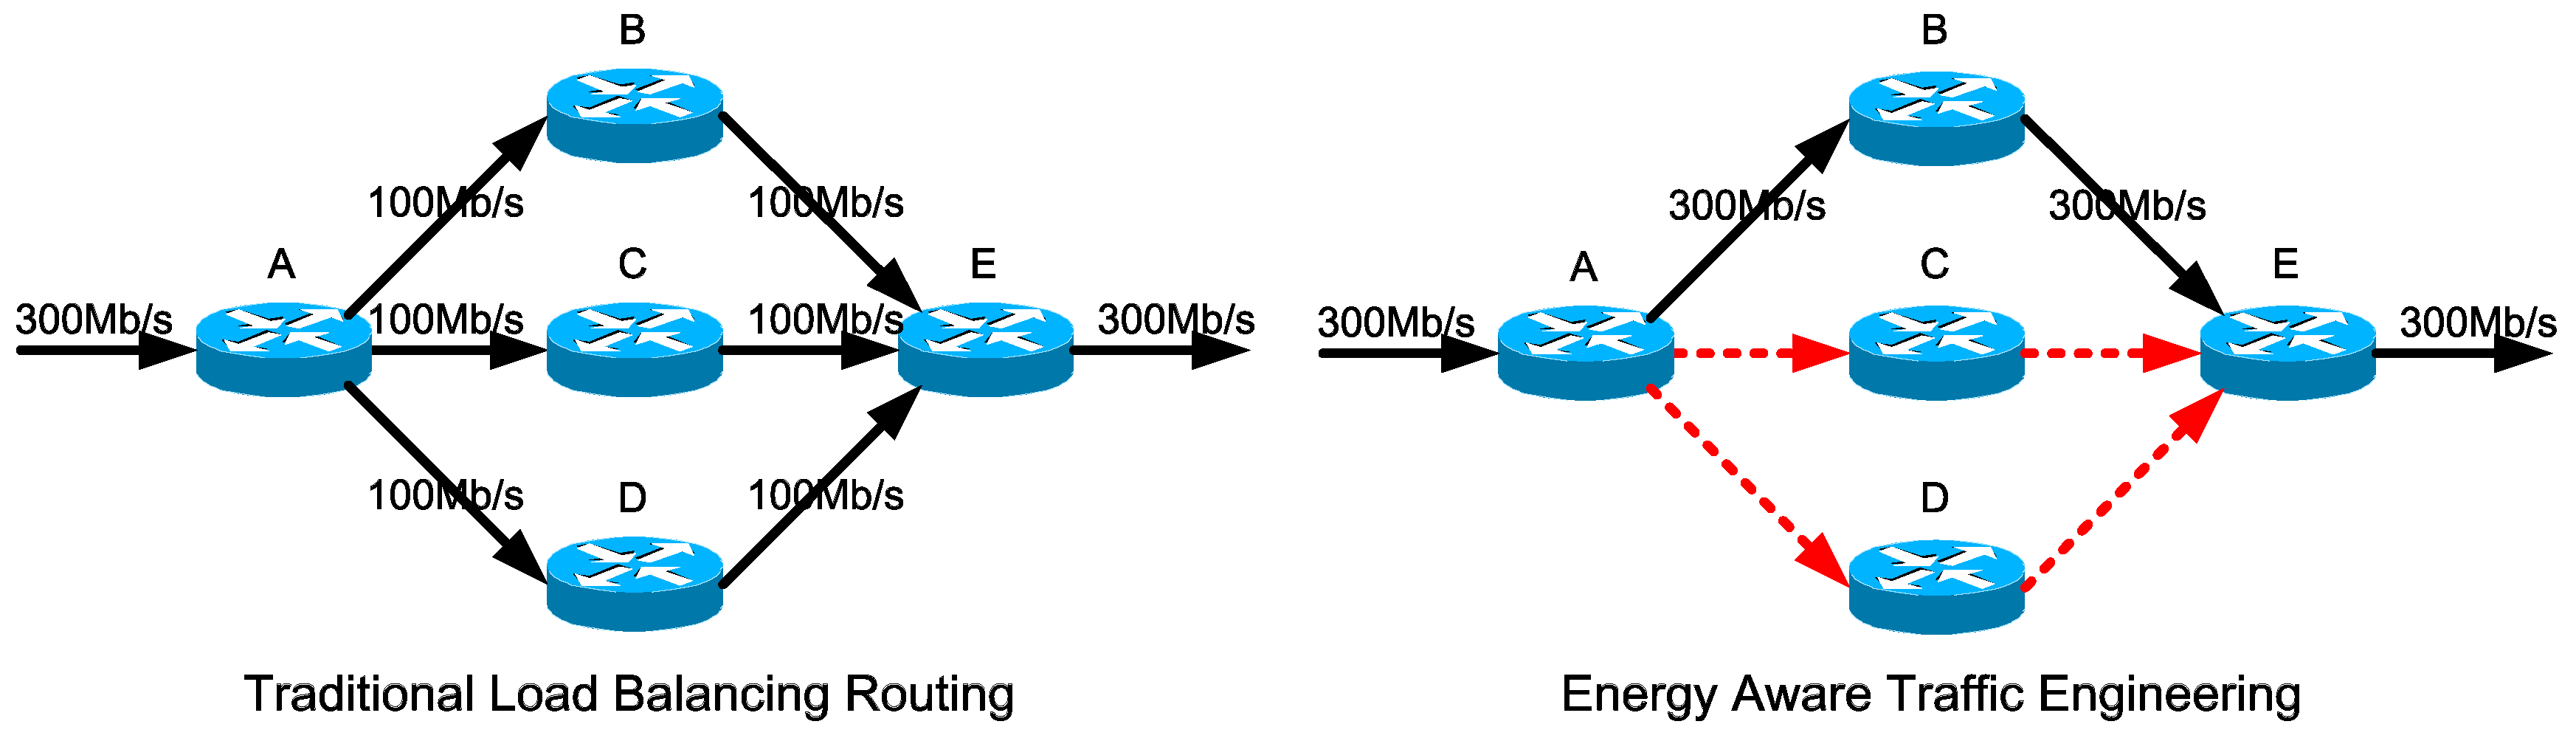
For Ethernet port shut-down, the control policy combines a network level power management technique with a local level approach. Ethernet port shut-down should be controlled at a higher level by a network-wide global power management policy with energy-aware traffic engineering capability, so that traffic destined for a port can be diverted to other active ports to enable the safe shut down of a port. Otherwise, a sudden surge of traffic to a disabled port can result in significant packet loss, as the disabled port will be unable to respond quickly enough when the new packets arrive. With energy-efficient traffic engineering, the disabled port is able to be woken up in advance, allowing traffic to traverse the port again. The energy-aware traffic engineering is performed at a scheduler to decide when to safely enable or disable every Ethernet port. Figure 17 presents a simple example of energy-aware traffic engineering. Router A sends 300 Mb/s of aggregate traffic to Router E. To prevent network congestion from traffic bursts, traditional routing with load balancing may split the 300-Mb/s traffic into 100 Mp/s for each of the three links. Whereas, energy efficient traffic engineering reroutes and aggregates the 300-Mb/s traffic from three separate links (each link 100 Mb/s) to one single link (300 Mb/s), so that the Ethernet ports on the links without traffic can be disabled for a period of time to achieve more power savings.
If the router is in the idle state and no traffic is being processed, the FSR can disable all four Ethernet ports and switch to the lowest frequency 7.8 MHz with a power consumption of 5.118 W, instead of the RR, keeping all four Ethernet ports at 125 MHz with a power consumption of 10.725 W. Thus, in the idle state, the FSR can save up to 52.28% of the power consumption compared to the RR. Table 6 summarizes the average power consumption for the experiments with real traces. The RR has the highest power consumption of 11.750 W. The FSR with STP consumes the least power of 10.565 W and saves 10.09% of power. The differences of power consumption among the three different control policies in the FSR are small because the differences only come from the different numbers of transitions. However, if dynamic frequency scaling (DFS), traffic re-routing through network-wide green traffic engineering (GTE) and Ethernet port shut-down (EPS) are all implemented, 46.04% of power can be saved in this specific experiment.
5.6. Transition Time
When toggling the operating frequency of the NetFPGA between 125 MHz and 62.5 MHz on the RR, the frequency switching causes a board reset, and all of the buffered packets are lost. However, in the FSR, three additional frequencies, 31.3 MHz, 15.6 MHz and 7.8 MHz, are introduced for more finely-tuned frequency scaling. The board reset problem is also eliminated without significant extra packet processing delay and loss. Since the RR does not provide DFS capability and all of the buffered packets are lost during the board reset, the FSR outperforms the RR from the transition time point of view.
As mentioned in the lab setup, the average power consumption is calculated from three million samples collected at 764 thousand samples per second. The NetFPGA board draws power from both the 3.3-V and 5-V power rails of the PCI bus on the host PC through a PCI bus extender. The real-time 3.3-V current and 5-V current can be read through the PCI bus extender. To calculate the transition time, the samples of the 3.3-V current are the focus. This is because scaling the operating frequency mainly affects the 3.3-V current, since the core FPGA draws power from the 3.3-V rail. The PHY components draw power from the 5-V rail, which is not affected by the frequency scaling.
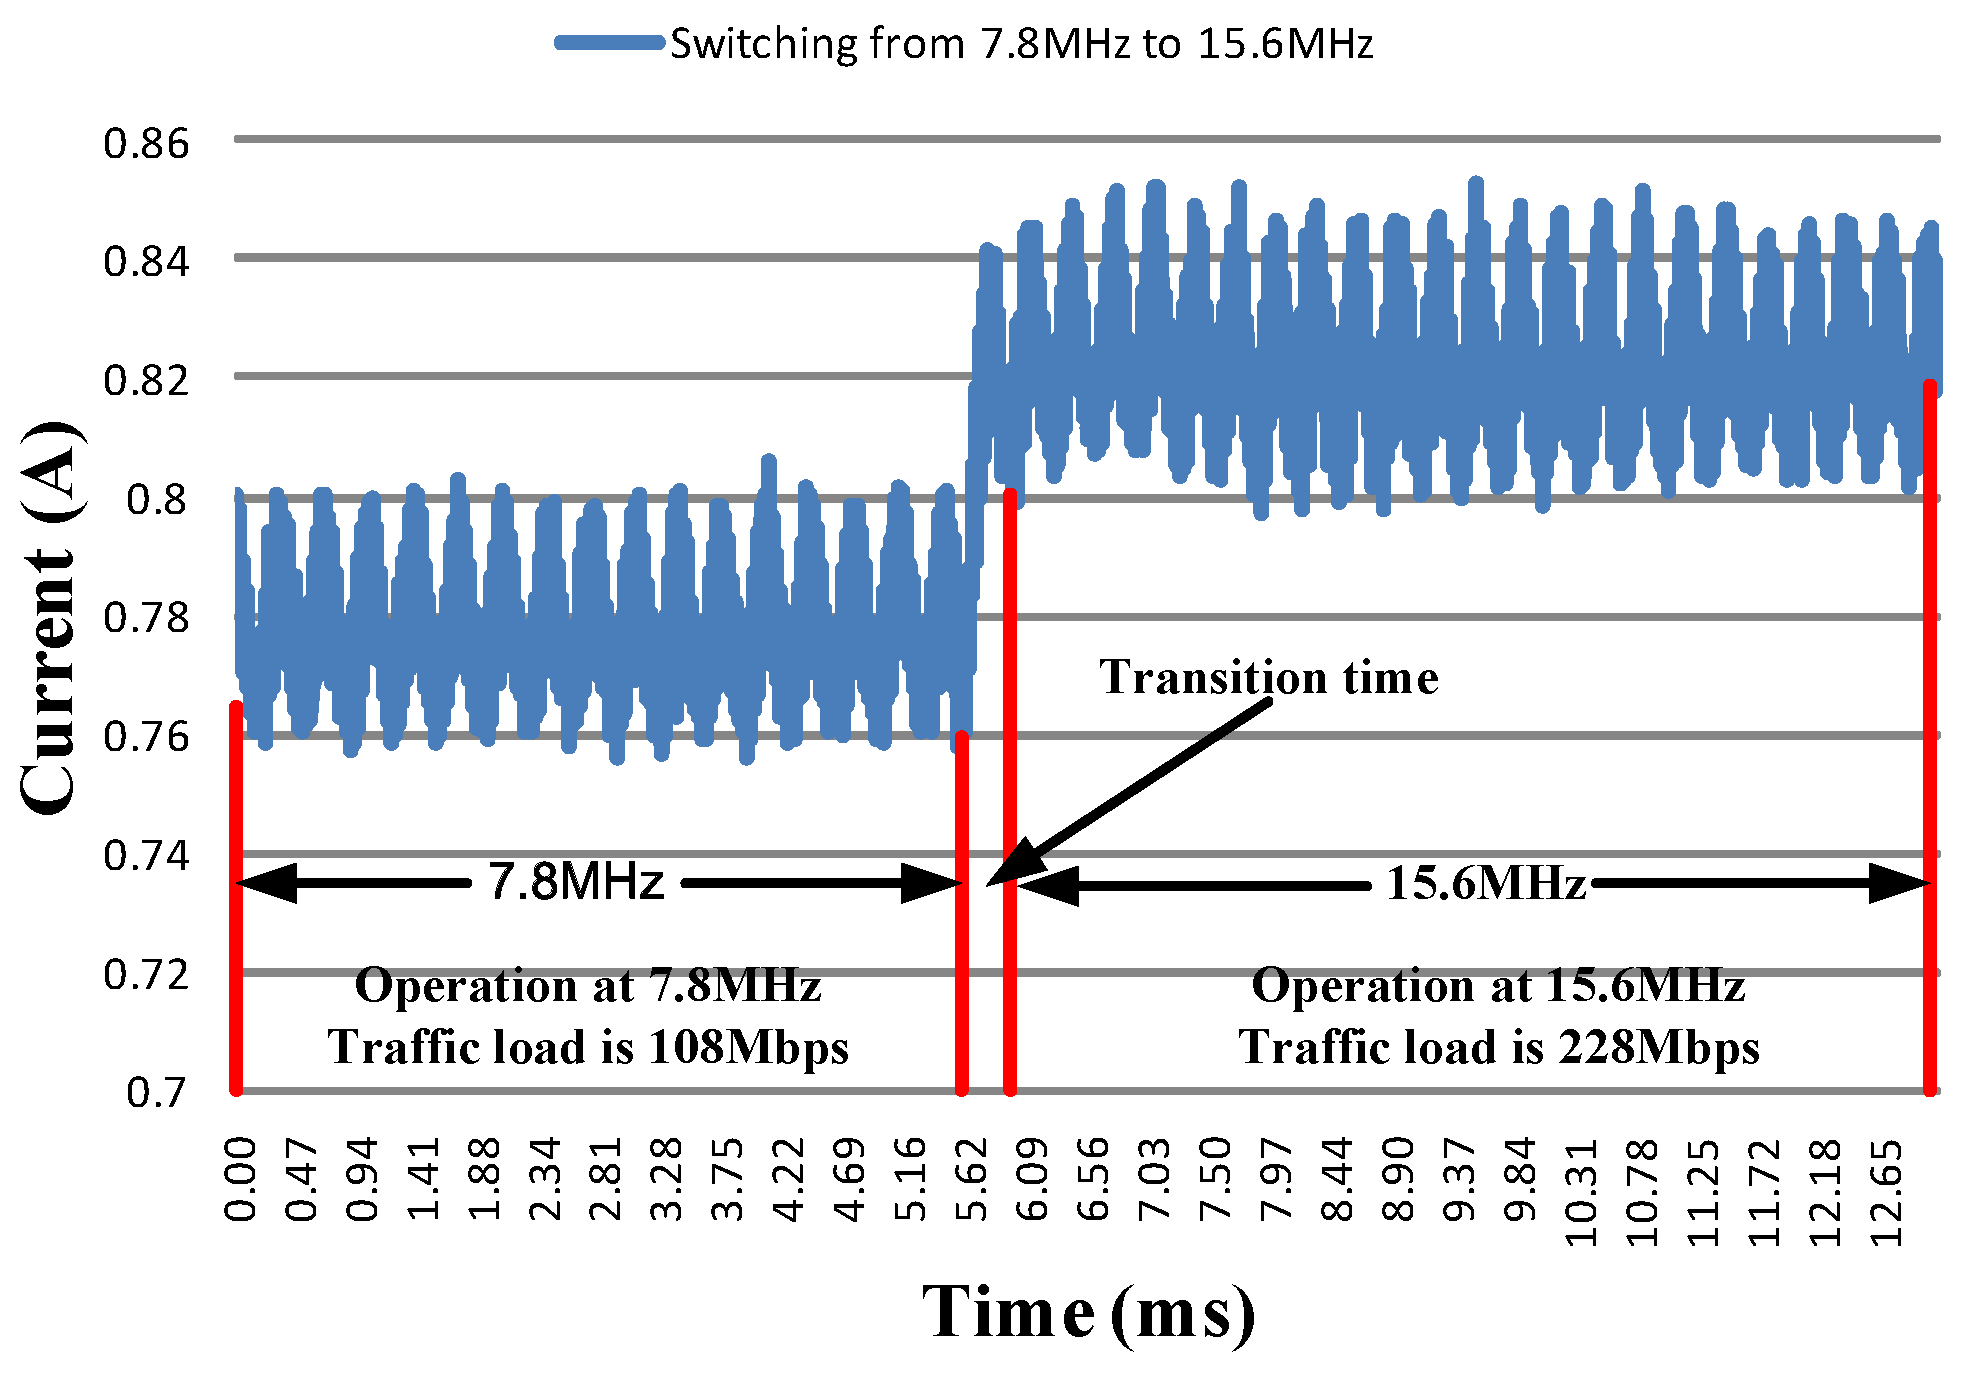
Figure 18 is an example of scaling the operating frequency from 7.8 MHz to 15.6 MHz. As shown in Figure 18, when the router is operating at 7.8 MHz with a very low aggregated traffic load of 108 Mb/s, the 3.3-V current read is around 0.78 A. Once the traffic load is increased from 108 Mbps to 228 Mbps at time 5.62 ms, the 3.3-V current is increased to around 0.82 A immediately. The maximum throughput that the router can handle when operating at 7.8 MHz is 117 Mb/s. Thus, the router switches to 15.6 MHz. The frequency transition time, calculated from captured current waveform of the 3.3-V pin of the PCI bus extender, is around 0.3–0.4 ms.
The time stamp is recorded for each sample of the 3.3-V current data collected. After scaling up and down the operating frequency between two different frequencies, the collected 3.3-V current data are exported to a file. Frequency switching will result in significant current change. Locating the starting and ending time stamp of significant current change can determine the duration of frequency switching. The transition time of frequency switching can be calculated with the following equation.
where T is the transition time, T is the starting time stamp for the significant increase or the decrease of current, while T is the ending time stamp, and 764,000 denotes the sampling rate. In this equation, T and T can be tracked and obtained from the captured 3.3-V current data. Thus, T can be calculated, and the results are shown in Table 7. The frequencies in the column of the table represent the operating frequencies the router switches from. The frequencies in the row represent the frequencies the router switches to. The transition times in the two directions are different due to the fact that the readings from the 3.3-V current samples may vary slightly resulting from the effect of noise. However, all of the transition time in the FSR is in the same magnitude, ranging from around 0.3 ms to around 0.4 ms, as expected. With control policies implemented in hardware, the FSR reduces the transition time by more than 80% compared to the transition time in the RR (2 ms).
Software is slow compared to dedicated hardware. The dedicated hardware makes an enormous difference in the speed of time-sensitive operations, providing a significant utilisation monitoring advantage over software. The frequency transition time on the software implementation of the control policy consists of the delay in software reading buffer usage, frequency selection according to the control protocol and setting the appropriate frequency register, which involves communications between hardware and software through reading and writing registers. For example, in theory, the transition time in the ALR is significantly reduced to 1 ms through a newly-defined handshake mechanism. However, the control policy in the ALR is implemented by software-based utilisation monitoring and buffer thresholds. The actual transition time ranges from 10 ms to 100 ms due to software restraints [1]. The transition time in the work [20] built on the NetFPGA reference router is reported a little bit longer (3.4 ms) than that in the reference router (2 ms) [20,32]. In the work [21], the transition time of adapting the link rates of Ethernet port is reported to be approximately 2 s. However, the transition time of frequency scaling is not measured in this work.
The power savings from most green approaches are mostly achieved at the cost of transition time overhead. The transition time is the time between the request for a new state and the actual state transition. Transition from one state to another can lead to potential performance degradation, especially in the case of transition from a lower performance state to higher ones. Longer transition times can result in higher network delay and even severe packet loss during the transition. The transition time in a hardware implementation eliminates the delay in communications between hardware and software. The control policy of the FSR is directly implemented in hardware. This involves building hardware modules and adding corresponding software instructions to incorporate with the hardware modules. Results reveal that the transition time in the FSR is only around 0.3–0.4 ms, which is the hardware frequency transition time without the delay caused by communications between hardware and software.
6. Conclusions
A green router with energy proportional routing capability is prototyped on the NetFPGA platform. Experimental results indicate that dynamic frequency scaling can effectively reduce the power consumption of the hardware components inside a network router. Policies governing frequency scaling are based on current traffic levels while avoiding performance degradation, such as increased network delay and packet loss. When traffic load is low, power consumption of the router can be reduced by switching to a lower operating frequency without performance degradation. In the case of no traffic to be handled, the router can be switched to an idle state and shut down the Ethernet ports, which can result in up to 52% of power savings. Experiments with real traffic traces indicate that up to 46% of power savings can be achieved by integrating dynamic frequency scaling with Ethernet port shut-down and traffic engineering. Although these numbers relate to a specific NetFPGA implementation, the design principles are of general application and can be deployed in commercial hardware to significantly lower its power consumption.
Acknowledgments
This work was supported in part by the China Scholarship Council (CSC) and the European FP7 ECONET project (No. 258454). The authors would like to acknowledge our collaborators Prof Tian Song and his team from Beijing Institute of Technology (BIT) and Prof. Lingling Sun and her team from Hangzhou Dianzi University (HDU) for their contributions on the FSR. The authors would like to thank the research interns from National Institute of Technology Karnataka (NITK), Vellore Institute of Technology (VIT) and Ecole Nationale Supérieure Electronique Electrotechnique Informatique Hydraulique Télécommunications (ENSEEIHT) for their assistance on power measurements. The authors would also like to thank the anonymous reviewers for their insightful comments on this paper, which led us to improve this work.
Author Contributions
Feng Guo and Xiaojun Wang prepared the manuscript. Song Mei and Yifei Wei revised the manuscript. Feng Guo also performed the experiments and analysed the results. Xiaojun Wang, Olga Ormond and Martin Collier contributed the main idea and led the work.
Conflicts of Interest
The authors declare no conflict of interest.
References
- Gunaratne, C.; Christensen, K.; Nordman, B.; Suen, S. Reducing the energy consumption of ethernet with adaptive link rate (ALR). IEEE Trans. Comput. 2008, 57, 448–461. [Google Scholar] [CrossRef]
- Bolla, R.; Bruschi, R.; Davoli, F.; Cucchietti, F. Energy efficiency in the future internet: A survey of existing approaches and trends in energy-aware fixed network infrastructures. IEEE Commun. Surv. Tutor. 2011, 13, 223–244. [Google Scholar] [CrossRef]
- Webb, M. Smart 2020: Enabling the Low Carbon Economy in the Information Age; The Climate Group: London, UK, 2008; Volume 1. [Google Scholar]
- Moyer, J.; Hughes, B. ICTs: Do they contribute to increased carbon emissions? Technol. Forecast. Soc. Chang. 2012, 79, 919–931. [Google Scholar] [CrossRef]
- Fettweis, G.; Zimmermann, E. ICT energy consumption-trends and challenges. In Proceedings of the 11th International Symposium on Wireless Personal Multimedia Communications, Lapland, Finland, 8–11 September 2008; Volume 2, p. 6.
- Chabarek, J.; Sommers, J.; Barford, P.; Estan, C.; Tsiang, D.; Wright, S. Power awareness in network design and routing. In Proceedings of the 27th IEEE Conference on Computer Communications (INFOCOM 2008), Phoenix, AZ, USA, 13–18 April 2008; pp. 457–465.
- Zhang, M.; Yi, C.; Liu, B.; Zhang, B. Greente: Power-aware traffic engineering. In Proceedings of the 2010 18th IEEE International Conference on Network Protocols (ICNP), Kyoto, Japan, 5–8 October 2010; pp. 21–30.
- Bolla, R.; Davoli, F.; Bruschi, R.; Christensen, K.; Cucchietti, F.; Singh, S. The potential impact of green technologies in next-generation wireline networks: Is there room for energy saving optimization? IEEE Commun. Mag. 2011, 49, 80–86. [Google Scholar] [CrossRef]
- Nedevschi, S.; Popa, L.; Iannaccone, G.; Ratnasamy, S.; Wetherall, D. Reducing network energy consumption via sleeping and rate-adaptation. NSDI 2008, 8, 323–336. [Google Scholar]
- Luo, Y.; Yu, J.; Yang, J.; Bhuyan, L. Conserving network processor power consumption by exploiting traffic variability. ACM Trans. Archit. Code Optim. (TACO) 2007, 4, 4. [Google Scholar] [CrossRef]
- Bolla, R.; Bruschi, R.; Lombardo, C. Dynamic voltage and frequency scaling in parallel network processors. In Proceedings of the 2012 IEEE 13th International Conference on High Performance Switching and Routing (HPSR), Belgrade, Serbia, 24–27 June 2012; pp. 242–249.
- Watson, G.; McKeown, N.; Casado, M. Netfpga: A tool for network research and education. In Proceedings of the 2nd workshop on Architectural Research Using FPGA Platforms (WARFP), Austin, TX, USA, 12 February 2006; Volume 3.
- Frequency-Scaled Router project. Available online: https://github.com/NetFPGA/netfpga/wiki/Frequency- Scaled-Router (accessed on 27 May 2016).
- Bolla, R.; Bruschi, R.; Davoli, F.; Gregorio, L.D.; Giacomello, L.; Lombardo, C.; Parladori, G.; Strugo, N.; Zafeiropoulos, A. The low energy consumption networks (ECONET) project. In Proceedings of the Sustainable Internet and ICT for Sustainability (SustainIT), Pisa, Italy, 4–5 October 2012; pp. 1–5.
- Correia, L.M.; Zeller, D.; Blume, O.; Ferling, D.; Jading, Y.; Gódor, I.; Auer, G.; van der Perre, L. Challenges and enabling technologies for energy aware mobile radio networks. IEEE Commun. Mag. 2010, 48, 66–72. [Google Scholar] [CrossRef]
- Auer, G.; Giannini, V.; Desset, C.; Godor, I.; Skillermark, P.; Olsson, M.; Imran, M.A.; Sabella, D.; Gonzalez, M.J.; Blume, O.; et al. How much energy is needed to run a wireless network? IEEE Wirel. Commun. 2011, 18, 40–49. [Google Scholar] [CrossRef]
- Idzikowski, F.; Bonetto, E.; Chiaraviglio, L.; Cianfrani, A.; Coiro, A.; Duque, R.; Jiménez, F.; le Rouzic, E.; Musumeci, F.; van Heddeghem, W.; et al. Trend in energy-aware adaptive routing solutions. IEEE Commun. Mag. 2013, 51, 94–104. [Google Scholar] [CrossRef]
- Chiaraviglio, L.; Mellia, M.; Neri, F. Minimizing ISP network energy cost: Formulation and solutions. IEEE/ACM Trans. Netw. (TON) 2012, 20, 463–476. [Google Scholar] [CrossRef]
- Mourshed, M.; Robert, S.; Ranalli, A.; Messervey, T.; Reforgiato, D.; Contreau, R.; Becue, A.; Quinn, K.; Rezgui, Y.; Lennard, Z. Smart grid futures: Perspectives on the integration of energy and ICT services. Energy Procedia 2015, 75, 1132–1137. [Google Scholar] [CrossRef]
- Meng, W.; Wang, Y.; Hu, C.; He, K.; Li, J.; Liu, B. Greening the internet using multi-frequency scaling scheme. In Proceedings of the 2012 IEEE 26th International Conference on Advanced Information Networking and Applications (AINA), Fukuoka, Japan, 26–29 March 2012; pp. 928–935.
- Ngoc, N.P.; Huu, T.N.; Quang, T.V.; Hoang, V.T.; Thu, H.T.; Tran-Gia, P.; Schwartz, C. A new power profiling method and power scaling mechanism for energy-aware NetFPGA gigabit router. Comput. Netw. 2015, 78, 4–25. [Google Scholar] [CrossRef]
- Naous, J.; Gibb, G.; Bolouki, S.; McKeown, N. NetFPGA: Reusable router architecture for experimental research. In Proceedings of the ACM Workshop on Programmable Routers for Extensible Services of Tomorrow, Seattle, WA, USA, 22 August 2008; pp. 1–7.
- Gibb, G.; Lockwood, J.; Naous, J.; Hartke, P.; McKeown, N. NetFPGA: An open platform for teaching how to build gigabit-rate network switches and routers. IEEE Trans. Educ. 2008, 51, 364–369. [Google Scholar] [CrossRef]
- Lockwood, J.W.; McKeown, N.; Watson, G.; Gibb, G.; Hartke, P.; Naous, J.; Raghuraman, R.; Luo, J. NetFPGA—An open platform for gigabit-rate network switching and routing. In Proceedings of the IEEE International Conference on Microelectronic Systems Education, MSE’07, San Diego, CA, USA, 3–4 June 2007; pp. 160–161.
- Guo, F.; Ormond, O.; Collier, M.; Wang, X. Power measurement of NetFPGA based router. In Proceedings of the IEEE Online Conference on Green Communications (GreenCom), Piscataway, NJ, USA, 25–28 September 2012; pp. 116–119.
- Covington, G.; Gibb, G.; Lockwood, J.; Mckeown, N. A packet generator on the NetFPGA platform. In Proceedings of the 17th IEEE Symposium on Field Programmable Custom Computing Machines, FCCM’09, Napa, CA, USA, 5–7 April 2009; pp. 235–238.
- Sivaraman, V.; Vishwanath, A.; Zhao, Z.; Russell, C. Profiling per-packet and per-byte energy consumption in the NetFPGA gigabit router. In Proceedings of the 2011 IEEE Conference on Computer Communications Workshops (INFOCOM WKSHPS), Shanghai, China, 10–15 April 2011; pp. 331–336.
- Vishwanath, A.; Zhao, Z.; Sivaraman, V.; Russell, C. An empirical model of power consumption in the NetFPGA gigabit router. In Proceedings of the 2010 IEEE 4th International Symposium on Advanced Networks and Telecommunication Systems (ANTS), Mumbai, India, 16–18 December 2010; pp. 16–18.
- Le Sueur, E.; Heiser, G. Dynamic voltage and frequency scaling: The laws of diminishing returns. In Proceedings of the 2010 International Conference on Power Aware Computing and Systems, USENIX Association, Vancouver, BC, Canada, 3 October 2010; pp. 1–8.
- Zheng, X.; Wang, X. Comparative study of power consumption of a NetFPGA-based forwarding node in publish-subscribe internet routing. Comput. Commun. 2014, 44, 36–43. [Google Scholar] [CrossRef]
- Bolla, R.; Szemethy, T.; Bruschi, R.; Davoli, F.; di Gregorio, L.; Donadio, P.; Fialho, L.; Collier, M.; Lombardo, A.; Recupero, D.R. The green abstraction layer: A standard power-management interface for next-generation network devices. IEEE Internet Computing 2013, 17, 82–86. [Google Scholar] [CrossRef]
- Lombardo, A.; Panarello, C.; Reforgiato, D.; Schembra, G. Power control and management in the NetFPGA gigabit router. In Proceedings of the Future Network & Mobile Summit (FutureNetw), Berlin, Germany, 4–6 July 2012; pp. 1–8.
Figure 1.
The architecture of the reference router.

Figure 2.
The architecture of the frequency-scaled router.

Figure 3.
Implementation of dynamic frequency scaling on the frequency-scaled router (FSR).

Figure 4.
Thresholds of the single threshold policy.

Figure 5.
Flowchart of the single-threshold policy.

Figure 6.
Thresholds of the double-threshold policy.

Figure 7.
Flowchart of the double-threshold policy.

Figure 8.
Flowchart of the packet loss-aware policy.

Figure 9.
Lab setup.

Figure 10.
Power consumption of the RR and the FSR under different frequencies and traffic bit rates.
Figure 10.
Power consumption of the RR and the FSR under different frequencies and traffic bit rates.

Figure 11.
Link capacity of the RR and the FSR under different frequencies and packet sizes.

Figure 12.
Round trip time of the RR and the FSR under different frequencies and packet sizes.

Figure 13.
Packet loss of the RR and the FSR under different frequencies and traffic bit rates.

Figure 14.
Link traffic bit rate diurnal pattern.

Figure 15.
Operating frequency corresponding to the traffic trace in Figure 14.
Figure 15.
Operating frequency corresponding to the traffic trace in Figure 14.

Figure 16.
Power consumption corresponding to the traffic trace in Figure 14.
Figure 16.
Power consumption corresponding to the traffic trace in Figure 14.

Figure 17.
Difference between traditional load balancing routing and energy-aware traffic engineering.
Figure 17.
Difference between traditional load balancing routing and energy-aware traffic engineering.

Figure 18.
An example of the transition time calculation.


| Frequency | State | Capacity | Threshold |
|---|---|---|---|
| f (MHz) | (Bytes) | (95% of ) (Bytes) | |
| 7.8 | S | C : 554 K | T : 526 K |
| 15.6 | S | C : 1098 K | T : 1043 K |
| 31.3 | S | C : 2143 K | T : 2036 K |
| 62.5 | S | C : 4321 K | T : 4105 K |
| 125 | S | C : 8620 K | T : 8190 K |
| Frequency | State | Capacity | Threshold | |
|---|---|---|---|---|
| f (MHz) | (Bytes) | (85% of ) (Bytes) | (95% of ) (Bytes) | |
| 7.8 | S | C : 554 K | T : 471 K | T : 526 K |
| 15.6 | S | C : 1098 K | T : 933 K | T : 1043 K |
| 31.3 | S | C : 2143 K | T : 1822 K | T : 2036 K |
| 62.5 | S | C : 4321 K | T : 3673 K | T : 4105 K |
| 125 | S | C : 8620 K | T : 7327 K | T : 8190 K |
Table 3.
Impact of operating frequency and the number of active ports on the power consumption of the reference router (RR).
| No. of Active Ports | Power Consumption (W) | |
|---|---|---|
| 125 MHz | 62.5MHz | |
| 0 | 6.994 | 5.333 |
| 1 | 7.841 | 6.325 |
| 2 | 8.767 | 7.302 |
| 3 | 9.760 | 8.373 |
| 4 | 10.725 | 9.441 |
Table 4.
Impact of operating frequency and the number of active ports on power consumption of the FSR.
| No. of Active Ports | Power Consumption (W) | ||||
|---|---|---|---|---|---|
| 125 MHz | 62.5 MHz | 31.3 MHz | 15.6 MHz | 7.8 MHz | |
| 0 | 7.394 | 6.245 | 5.592 | 5.253 | 5.118 |
| 1 | 8.313 | 7.092 | 6.531 | 6.246 | 6.109 |
| 2 | 9.149 | 8.055 | 7.508 | 7.250 | 7.124 |
| 3 | 10.145 | 9.067 | 8.564 | 8.330 | 8.188 |
| 4 | 11.121 | 10.117 | 9.638 | 9.373 | 9.237 |
| Frequency | STP | DTP | PLAP | |||
|---|---|---|---|---|---|---|
| Time | Ratio | Time | Ratio | Time | Ratio | |
| 125 MHz | 4 h 29 m | 18.7% | 4 h 43 m | 19.7% | 4 h 49 m | 20.1% |
| 62.5 MHz | 9 h 58 m | 41.5% | 9 h 56 m | 41.4% | 9 h 47 m | 40.8% |
| 31.3 MHz | 5 h 46 m | 24.0% | 5 h 47 m | 24.1% | 5 h 50 m | 24.3% |
| 15.6 MHz | 3 h 17 m | 13.7% | 3 h 09 m | 13.1% | 3 h 12 m | 13.3% |
| 7.8 MHz | 0 h 30 m | 2.1% | 0 h 25 m | 1.7% | 0 h 22 m | 1.5% |
| Type | Average Power (W) | Power Savings (%) |
|---|---|---|
| RR | 11.750 | 0% |
| FSR with STP | 10.565 | 10.09% |
| FSR with DTP | 10.568 | 10.05% |
| FSR with PLAP | 10.569 | 10.04% |
| FSR with DFS, GTEand EPS | 6.321 | 46.04% |
| Frequency | Transition Time (ms) | ||||
|---|---|---|---|---|---|
| 125 MHz | 62.5 MHz | 31.3 MHz | 15.6 MHz | 7.8 MHz | |
| 125 MHz | 0 | 0.348 | 0.329 | 0.297 | 0.352 |
| 62.5 MHz | 0.306 | 0 | 0.273 | 0.316 | 0.405 |
| 31.3 MHz | 0.302 | 0.344 | 0 | 0.332 | 0.362 |
| 15.6 MHz | 0.358 | 0.263 | 0.323 | 0 | 0.299 |
| 7.8 MHz | 0.291 | 0.337 | 0.488 | 0.293 | 0 |
© 2016 by the authors; licensee MDPI, Basel, Switzerland. This article is an open access article distributed under the terms and conditions of the Creative Commons Attribution (CC-BY) license (http://creativecommons.org/licenses/by/4.0/).
Share and Cite
MDPI and ACS Style
Guo, F.; Wang, X.; Song, M.; Wei, Y.; Ormond, O.; Collier, M. Greening the NetFPGA Reference Router. Energies 2016, 9, 500. https://doi.org/10.3390/en9070500
AMA Style
Guo F, Wang X, Song M, Wei Y, Ormond O, Collier M. Greening the NetFPGA Reference Router. Energies. 2016; 9(7):500. https://doi.org/10.3390/en9070500
Chicago/Turabian StyleGuo, Feng, Xiaojun Wang, Mei Song, Yifei Wei, Olga Ormond, and Martin Collier. 2016. "Greening the NetFPGA Reference Router" Energies 9, no. 7: 500. https://doi.org/10.3390/en9070500
Note that from the first issue of 2016, this journal uses article numbers instead of page numbers. See further details here.