
Study of Coal Burst Source Locations in the Velenje Colliery


1
Faculty of Natural Sciences and Engineering, University of Ljubljana, Aškerčeva Street 12, Ljubljana SI-1000, Slovenia
2
Hydrogeology, Geotechnology, Ecology, Monitoring d.o.o., Zaloška Street 143, Ljubljana SI-1000, Slovenia
*
Author to whom correspondence should be addressed.
†
These authors contributed equally to this work.
Energies 2016, 9(7), 507; https://doi.org/10.3390/en9070507
Submission received: 26 April 2016
/
Revised: 31 May 2016
/
Accepted: 24 June 2016
/
Published: 30 June 2016
(This article belongs to the Special Issue Selected Papers from the 5th International Symposium on Mining and Environmental Protection)
Abstract
:The Velenje coal mine (VCM) is situated on the largest Slovenian coal deposit and in one of the thickest layers of coal known in the world. The thickness of the coal layer causes problems for the efficiency of extraction, since the majority of mining operations is within the coal layer. The selected longwall coal mining method with specific geometry, increasing depth of excavations, changes in stress state and naturally given geomechanical properties of rocks induce seismic events. Induced seismic events can be caused by caving processes, blasting or bursts of coal or the surrounding rock. For 2.5D visualization, data of excavations, ash content and calorific value of coal samples, hanging wall and footwall occurrence, subsidence of the surface and coal burst source locations were collected. Data and interpolation methods available in software package Surfer®12 were statistically analyzed and a Kriging (KRG) interpolation method was chosen. As a result 2.5D visualizations of coal bursts source locations with geomechanical properties of coal samples taken at different depth in the coal seam in the VCM were made with data-visualization packages Surfer®12 and Voxler®3.
1. Introduction
The Velenje coal mine (VCM) is situated on the largest Slovenian coal deposit and in one of the thickest coal layers known in the world (Figure 1). From a lignite layer up to 168 meters thick, more than 220 million tons of lignite have been excavated so far [1]. The coal layer is located in the so-called Velenje depression, which is structurally a part of Periadriatic Fault System and belongs to the geotectonic unit of the Southern Alps [1,2].
The geological setting of the VCM after previous research by Brezigar [3] is presented on Figure 2. The coal is of Pliocene age. The layer has a synclinal shape in all directions. The southeastern part of the coal layer is tectonically damaged. The base of the coal layer consists of Triassic dolomite in the northern part and of Oligocene and Miocene layers in the central and southern part of the coal-bearing depression. The depression is filled with clastic sediments, which transform from clay and coal-clay layers to thick coal layer. The overburden of the coal layer is represented by lacustrian clastic sediments [1,2,3].
The most outstanding feature of mining in the VCM is the thickness of the lignite layer itself. Because of the large thickness of the layer, most mining operations are situated within the mined layer itself. Large thickness of the lignite layer and its relatively small lateral dimensions are preferred for the concentration of large reserves, but cause problems with the efficiency of the excavation. Therefore, the specific and highly productive so-called Velenje mining method (VMM) was developed [4,5]. There are many risks in underground excavation of lignite depending on the selected mining method, technologies and equipment, security measures and geotechnical parameters of rocks related to the stress field and its changes. Hazards connected to the VMM are sudden eruptions and explosions of coal gas, spontaneous combustion and underground fires, surface subsidence, the risk of water intrusions from different aquifer layers, danger of collapses of large lignite masses and ejections of coal-coal bursts and the surrounding rock-rock bursts into the mined-out area [2,4].
The scope and the intensity of coal extraction have an impact on stress and deformation of the coal seam and adjacent rocks in the broader excavation area. Despite analysis of the stress-strain distribution around the mining longwall face and monitoring system for seismic events, unpredictable bursts of coal and the surrounding rocks continue to be threats to safety. In underground coal mines a type of a rockburst is a violent failure of coal or a coal burst. A rockburst is a mining-induced seismic event that causes damage to excavations [6,7,8]. Rockbursts can cause sound effects, disruption of a support system, destruction of equipment, and the formation of dust and air waves, which cause work stoppages and also affect the quality of life in nearby villages on the surface. Because of the large thickness of the coal layer in the VCM and mining work situated within the coal layer, the most common mining-induced event is a mechanical failure of a coal layer itself—a coal burst. In spite of modern technology and preliminary security measures coal bursts cannot yet be foreseen. To determine the approximate locations of coal bursts and the type of a mechanical failure of coal, visualization of the geological and mining situation in the VCM was made with data-visualization packages Surfer®12 and Voxler®3 [9,10].
To understand the behavior of coal, knowing and understanding its physical properties is of paramount importance. In underground coal mining mechanical properties of coal have major implications for designing coal excavation processes and can be indirectly categorized by coal type. In VCM coals were sampled and analyzed for ash content and calorific value and correlated with other mechanical parameters (Young’s modulus, uniaxial compressive strength, etc.). Low ash content was correlated with high Young’s modulus and high calorific value and vice versa [11].
2.5D data-visualization of coal burst source location together with physical properties of coal will be used to determine areas of coal burst source formation in regard to variable mechanical properties of the coal seam. Critical areas for excavation will be outlined and will benefit coal burst prevention and safety procedures planning [12].
Data used in the analysis and for the 2.5D visualization of the VCM was provided by the technical services of the VCM; data of the excavations done in the coal seam, data of ash content and calorific value of lignite samples from surface and cave boreholes, subsided surfaces and bathymetry of formed lakes, data of hanging wall and footwall occurrence, and data of 106 coal bursts locations were provided [13]. These data sets were combined and used along with digital elevation model (DEM) for a construction of a 2.5D display of individual layers and coal burst locations.
Before the graphical visualization of layers was made, statistical analysis of interpolation methods available in the Surfer software package was obtained [14,15]. Among all available data sets only the few with a decisive influence on the formation of a coal burst were selected for statistical analysis. Selected data sets were the thickness of the coal seam, the excavations, and ash content and calorific value of coal sampled-data best describing the high geo-stress mining conditions and the mechanical properties of a mined coal layer. For each selected data set residual values for each available interpolation method were calculated. These residual values were statistically analysed and results were numerically evaluated according to US Geology Survey Map Accuracy Standards [16] and American Society for Photogrammetry and Remote Sensing Accuracy Standards for Large-scale Maps [17]. As a result of the numerical evaluation of statistical parameter the most appropriate interpolation method proved to be the Kriging (KRG) interpolation method. For 2.5D visualization of coal burst source locations, mining works and geological layers in the VCM, software data-visualization packages Surfer®12 and Voxler®3 were used.
2. Experimental Section
2.1. Seismicity in the Velenje Coal Mine
In the past many complaints from nearby villages were directed to VCM concerning an increase in the number of seismic events. However, residents of the Velenje Valley do not distinguish between natural seismic activity and seismic activity induced by underground coal mining [5]. The VCM has therefore established a digital microseismic monitoring system on excavations, in the nearby villages and on the surface of the VCM area. Furthermore, the complete seismic monitoring system enables accurate determination of the locations of rockburst sources and the intensity of seismic waves. With recorded data VCM can determine whether the seismic event had a natural origin in the wider area of the Velenje Valley or it was induced by mining in the area of excavations [18].
Monitoring of seismicity in mines is included in ISO Standards which were applied in the VCM in 2000, and specify operational monitoring of environmental impacts, including the increased seismic activity. Due the lack of Slovenian regulations for seismic activity, the registration and evaluation of seismicity in the VCM are covered by the German standard DIN 4150 [5].
In the VCM the induced seismicity is related to chosen mining method with a specific geometry of excavations, to the depth of excavations, to changes in stress field, and to geotechnical properties of rocks. Induced seismic events in the VCM can thus be caused by caving of a rock mass above the mined-out area, blasting or rockbursts [4]. In addition to problems with excavation, rockbursts with accompanying seismic and sound waves also cause misunderstanding and dissatisfaction of local residents.
After Mayer et al. [5] and Vižintin and Supovec [13] the locations of the source of rockbursts in the VCM are calculated only for the stronger seismic events, when the signal-to-noise ratio is high enough for analysis. Seismic events are located with the detection of first arrival times of P- and S-waves and the amplitude of waves on at least five sensors, which, together with the known coordinates of the sensors enable the calculation of the location of the source of seismic event. For each panel in excavation a seismic monitoring project is designed, which provides optimal distribution of sensors on the face and the desired accuracy of the system. With the proper allocation of sensors, precision of the system from ±1 m up to ±10 m can be achieved. Based on the established monitoring system on excavations, 264 seismic events in 2003 and in 2004, 289 seismic events were recorded, of which only 106 events coincided with the surface monitoring system at the VCM area [13].
The magnitudes of seismic events in the VCM are computed in local magnitude scale from the maximum vertical component of the ground velocity. Rockburst magnitudes calculated in 2003 and 2004 were 2°–3°, with maximum of 4° and 5° for the most powerful rockbursts [5]. Seismic events in the VCM therefore rarely exceeded the value of 1.5 of the Richter local magnitude. Calculated magnitudes have shown that most events have practically negligible magnitudes of up to 0.1 of the Richter magnitude. Other calculated magnitudes were between 0.5 and 0.9, and maximum magnitude calculated in 2003 was 2.4 and 1.6 in 2004 [13].
2.2. Coal Bursts in the Velenje Coal Mine
A seismic event can be considered as a sudden inelastic deformation within a given volume of rock that radiates detectable seismic waves [19]. Mechanically rockbursts can be defined as a sudden failure of rock associated with a release of potential or stored energy in the rock [20]. After Dervarič et al. [11], Li et al. [20], Wang and Pack [21], Holub [22] and Bukowska [23] the location of a burst is influenced by design, technological conditions and natural conditions of rock masses present. At VCM Dervarič et al. [11], researched connections between selected influential parameters. Under natural conditions model coal seam was categorized on the basis of coal seam classification as to calorific value and geomechnical properties of rocks. Based on their deposit classification of coal, geomechanical properties can be characterized in each point of the seam with regard to the position in the seam at which the sample was taken, dry ash content, natural moisture, uniaxial compressive strength, and calorific value can be determined. Factors with the greatest impact on the formation of a rockburst are the physical and mechanical properties of rocks with the ability to store elastic strain energy, the geometry and the depth of excavations, and stress field of the mined area [6,8,20,21,22,23]. Dervarič et al. [11] concluded that lower ash content relates to higher calorific value and better mechanical properties of rock mass to store elastic energy needed for rockburst formation. Therefore ash content and calorific value of coal for data-visualization of coal burst source locations were chosen for data analysis and presentation.
All authors define rockburst as a mining-induced seismic event with violent failure of rock that causes damage to equipment and/or personnel [7,8]. Based on given data on the locations of coal bursts in the VCM two main types of rockbursts were distinguished after Johnston [7]. Type I are coal bursts that can be directly associated with mining rates. Type I rockburst is a function of mining activity. Generally its location is within 100 m of a mining face or some preexisting zone of weakness or geological discontinuity near the mine. Intact rock can be broken in the rupture when mining induced stresses exceed the shear strength of the material and orientations of the rupture planes can vary. With Type I rockburst often high stress drops and low to medium magnitudes are observed. Coal bursts thought to be caused by the presence of the mine that may occur in the immediate area of excavation are called Type II rockbursts. There is not enough data to determine relationship of Type II rockburst with mining rates. Location of Type II rockburst is on some preexisting fault surface that may be up to 3 km from the mine. All Type II rockbursts occur in preexisting, possibly prestressed tectonic fault and mining may simply trigger these events on faults of preferred orientations. Observed stress drops are more similar to natural earthquakes. Type II rockburst has a potential for high magnitudes [7,8].
2.3. Data Analysis and Data Input
All research is led by VCM’s Hydrogeological Service. Previous research in the broader area of the coal mine included detailed geological mapping and exploration drilling. Veber [1] reported that with different drilling dynamics over different time periods and for different purposes, more than 600 surface boreholes with a total length of over 200 km and about 2000 cave boreholes with more than 100 km in length were drilled to date [2]. Also data about seismic events and their effects on the surrounding area of excavations were collected. Altogether the Hydrogeological Service of the VCM provided data about the coal layer, excavation works, surface subsidence and bathymetry of lakes, data of hanging wall and footwall occurrence, and data of coal burst source locations. These data sets were combined and used together with the DEM for a construction of a 2.5D visualization of layers and coal burst source locations in the VCM. For the data analysis and processing and for 2.5D visualization of data software packages Surfer®12 and Voxler®3 were used.
For the purpose of creating a 2.5D visualization of coal burst source locations in the VCM, seven basic data layers and their derivatives were used. The data is given in the Gauss-Krueger coordinate system and is limited with the limits of coal layer occurrence in the Velenje Valley. The data sets used are DEM; bathymetry of lakes in 31,159 points; hanging wall and foot wall, which were determined as hanging wall-coal layer and coal layer-footwall occurrence in 901 and 441 boreholes with core sampling; the thickness of the coal layer, which was calculated from the hanging wall and footwall data and was separated into five layers; excavation works till October 2013; locations of 106 seismic events recorded in 2003 and 2004; and ash content and calorific value data of coal layer, containing 6011 coal samples from 912 boreholes, made from 1968 to 2002—of these boreholes for coal sampling, 4309 of them were drilled on excavations and the remaining 1702 were drilled from the surface.
Defined thickness layers of the coal seam with given percentage of the layer limits are: A layer with 0.01%–20.00%, layer B with 20.01%–40.00%, layer C with 40.01%–60.00%, layer D with 60.01%–80.00% and E layer with 80.01%–100.00% of thickness of the Coal seam.
Samples of coal were tested in a mechanical laboratory where ash content and calorific value were determined. For each borehole the thickness of the coal layer in that point was calculated as the difference between hanging wall and footwall occurrence. Depending on the sampling depth of each sample taken in individual borehole, compared to the total thickness of the coal layer in that borehole, geotechnical characteristics of that sample were given to the appropriate thickness layer as follows: Thickness layer A if the sample was taken in the most upper 20% of the coal layer; layer B if the sample was collected from 20.01% to 40.00% of the thickness of the coal layer; layer C if the sample was taken in 40.01%–60.00% of the coal layer; layer D if the sample was taken in 60.01%–80.00% of the thickness of the coal layer and layer E if the sample was taken in the most lower 20% of the thickness of the coal layer in each borehole (Figure 3 and Figure 4).
For presentation of spatial data in geological practice, profiles and contour maps are used. In the 2.5D visualization of different geological layers and coal burst source locations in the VCM, in addition to statistical verification of interpolation methods for quality of maps, adequate visualization of geological structures was considered. Data for quality analysis was selected based on the influential factors on the coal burst formation. The layers selected for the quality control were hanging wall and footwall data which define the thickness of the coal layer, and ash content and calorific value of coal samples. Because of the extent of coal sample data, geotechnical parameter of ash content in layer C was randomly selected for quality analysis.
2.4. Quality Control of Data and Maps
Reliability of the data and 2.5D visualization of used layers has been tested after the recommendation of Supovec and Veber [14,15] according to American standards-US geology survey map accuracy standards (USGS) [16] and American society for photogrammetry and remote sensing accuracy standards (ASPRS) for Large-scale Maps [17]. The quality control of maps is carried out in at least 20 points, where the difference between the ground measurement and the value calculated by the chosen interpolation method is calculated and is called Residual. For 2.5D visualization of coal burst source locations in the VCM, analysis of interpolation methods was based on calculations of residuals for all measuring points and the use of some geodetic methods for assessing the quality of the topographic maps.
USGS requirement for vertical precision of designed maps are as follows:
- -
- At least 90% of all tested values must have an error of less than 1/2 of contour interval (%N > 1/2 interval). In the case of used data contour interval of 10 m was selected. Thus, the allowable error of 10% of all values is less or equal to 5 m.
ASPRS for vertical accuracy of maps requires:
where the sum of vertical errors is:
and N is the number of controlled points [14,15,16,17].
- -
- Maximum error must not be greater than the width of the contour interval (Max Res < 1 interval); and
- -
- Root mean square error (RMS) must be less than 1/3 of contour interval (RMS < 1/3 interval),
Following the recommendations of the Surfer software for selecting the appropriate interpolation method depending on the type of data, interpolation methods Minimum Curvature, Polynomial Regression, Nearest Neighbor, Moving Average and Data Metrics were excluded in the initial stages of the analysis. For remaining interpolation methods quality assessment of data was performed with statistical evaluation of residual values. The results were categorized and numerically evaluated accordingly (Table 1, Table 2, Table 3 and Table 4). Lower numerical evaluation means better statistical parameters of generated maps according to the quality standards.
Parameters and abbreviations used in data interpolation and analysis and in the following tables of results are: contour interval of 10 m, NP – Number of control points for calculation of residuals, Resmin – Minimum value of residuals, Resmax – Maximum value of residuals, RMS – Root mean square error, Max Res – Maximum residual Value, N > int. – Number of residual values over the contour interval, N > 1/2 int. – Number of residual values over 1/2 contour interval, % > 1/2 int. – Percent of residual values over 1/2 contour interval.
3. Results and Discussion
Statistical analysis of interpolation methods showed that all interpolation methods, except for Local Polynomial, meet the quality standards for generating contour maps of hanging wall and ash content in C layer. On the contrary, contour map of footwall data did not meet the standards for quality for tested interpolation method Inverse Distance to a Power, Natural Neighbor, Triangulation with Linear Interpolation and Local Polynomial. For the selected size area of the VCM too few samples of coal were sampled.
For the 2.5D visualization of coal burst source locations in the VCM, with hanging wall, footwall and ash content data statistically analysed, the best numerical evaluations were given to modified Shepard’s method (MSM), radial basis function (RBF), KRG, and inverse distance to a power (IDP). IDP was rejected for not meeting the standards for quality for gridding footwall data. MSM was discarded for the generation of so called “bull’s eye” patterns of high jumps between otherwise uniform data. Rapid and substantial differences in multi-dimensional display of geological layers are not desirable as mostly continuous and uniform surfaces form at the formation of geological layers.
RBF and KRG both produce acceptable contour maps with smooth appearance. RBF produces a result quite similar to KRG, which is most often recommended for gridding any type of data set. Furthermore, KRG is a geostatistical gridding method and provides visually appealing maps from irregularly spaced data and attempts to express trends suggested in our data, so that, for example high points might be connected rather than isolated by bull’s eye type contours.
Therefore, for 2.5D visualization of uniform geological structures and geotechnical parameters of the coal seam, KRG interpolation method with default settings was selected. However, values of geotechnical parameters of coal are reliable only in the central and north-eastern part of the studied area of the VCM, where sufficient number of coal samples was taken and residual values for selected KRG are minimal (Figure 5).
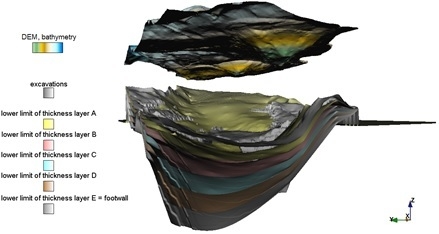
Graphical display of layers was performed in software packages Surfer®12 and Voxler®3. In the previous section analysis of the interpolation methods and data processing in Surfer has been described. As Surfer software does not provide display of discontinuous data in three-dimensional space, display of point data of coal burst source locations was made in Voxler®3 software package. For the final 2.5D visualization of layers and coal burst locations Voxler®3 was used. All layers are limited with Gauss-Krueger coordinates of the Velenje Valley between 504,600–508,700 and 136,000–138,200 with limits of coal seam occurrence in the Velenje depression (Figure 3). Depth of excavation works and coal burst source locations within the limited area are shown in Figure 6.
In the displays and 2.5D visualizations the coal seam is divided into five layers of thickness and the location and depth of excavation works are presented in Figure 7. Most of the excavations were carried out in the upper 40% of the coal seam thickness, and only the deepest excavations in the western part of the depression were made in the upper 60% of the coal seam thickness.
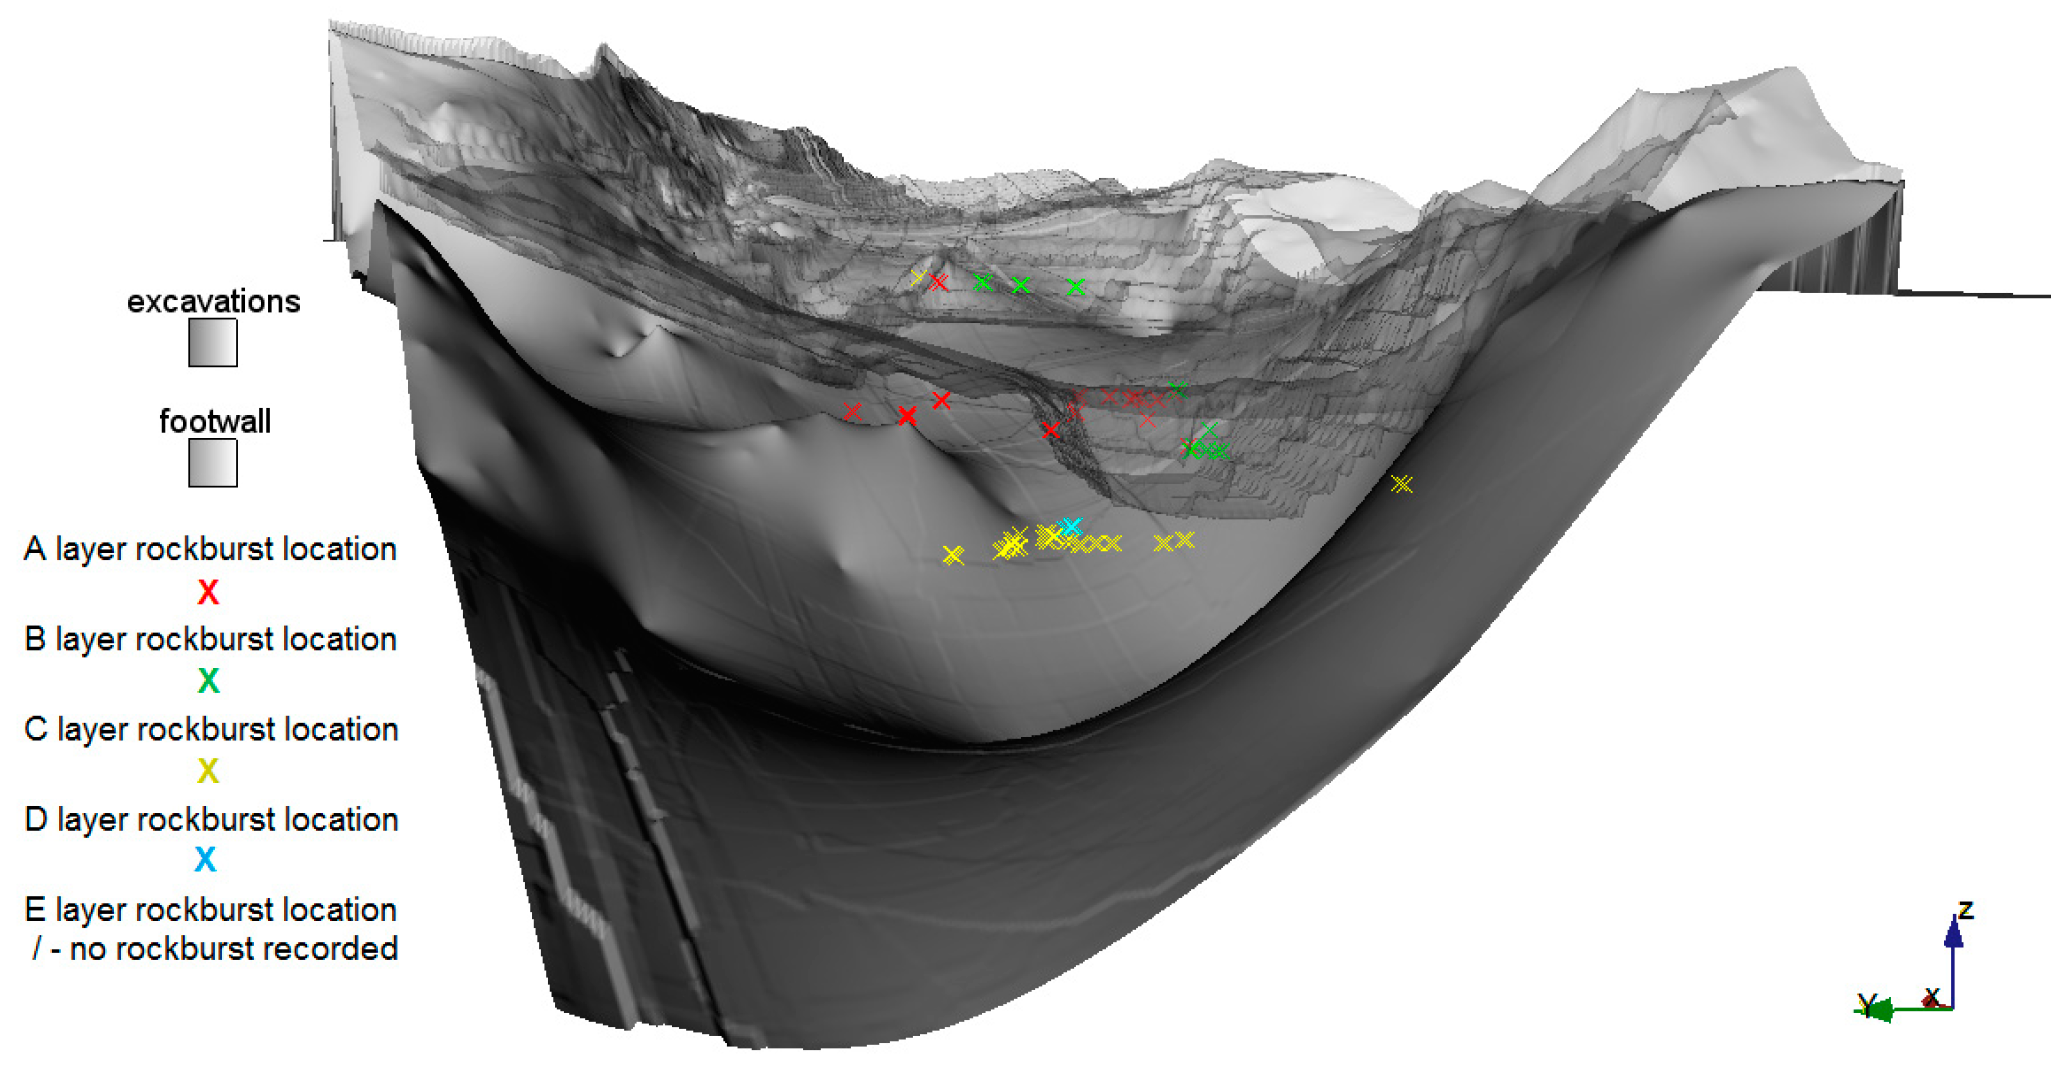
In the following visualizations of general situation of layers and coal burst source locations in the VCM the height component Z is emphasized by two-fold to improve transparency. Displays are oriented in the NW-SE direction, from the deepest parts to the shallower parts of the coal basin (Figure 8).
In Figure 9, Figure 10, Figure 11, Figure 12 and Figure 13 individual thickness layers with layer’s coal burst source locations are shown. In addition to the display of the layers with location of coal bursts sources, contour maps of ash content and calorific value of coal samples taken on depths of the individual coal thickness layer are presented.
Thickness layer A:
Thickness layer B:
Thickness layer C:
Thickness layer D:
Thickness layer E:
No coal burst source was recorded in the lower part of the coal seam in thickness layer E.
In layer A 170 samples of coal were taken and 32 coal bursts sources recorded (Figure 9). Coal burst source locations are concentrated around the excavation area. In layer A ash content is up to 12%, which corresponds to coal with low ash content and good elastic properties for coal burst formation. Low ash content coal corresponds to coal with high calorific values [11].
Layer B was represented by 541 samples of coal. In 20%–40% of the coal seam thickness 17 seismic events happened (Figure 10). Here also, coal bursts formed around the excavation area. The ash content is low and calorific value is high, which satisfies the condition for the coal burst formation with appropriate elastic properties of rock [11].
Layer C was sampled in 1472 points and 41 coal burst source locations were recorded in the depth of 40%–60% of the coal seam thickness (Figure 11). Only the deepest excavations in the eastern part of the coal bearing depression reach these layer depths. Some seismic events occurred at the excavation area and were conditioned by the geometry and the depth of excavations, but most of the events were formed at greater depths and were probably formed on the pre-existing zone of weakness or geological discontinuity near the excavations, as discontinuities with reduced mechanical properties may occur in previous intact rock, due to increase in stress-field and depth progress of excavations or discontinuities existing before and were activated by excavations. Excavations in layer C are situated in the area of coal with ash content of 20%–45% which is higher ash content and suits lower calorific value of the coal regarding upper layers A and B.
In layer D 2356 samples were taken and 12 coal bursts sources were recorded (Figure 12). Excavation works do not reach this layer of 60%–80% of the coal thickness. Coal bursts were formed on locations with 30%–40% ash content and medium calorific value of coal.
Layer E includes the lowest 20% of the coal seam thickness. 1470 samples of coal were taken from these depths, and none coal burst source was recorded (Figure 13).
In layers from A to C coal burst source locations corresponded to rockbursts caused by stress and strain changes in the rock due to the interaction of in-situ and mining-induced stresses. These layers sampled coal with low to medium ash content and higher calorific values) [11]. In layers D and E ash content and calorific value of samples gives evidence of low-level coal with higher ash content and lower calorific values, which indicates coal in transition into footwall rock, where high content of clay component is present.
4. Conclusions
2.5D data-visualization was generated as 2D visualization technology lack depth perception and possible spatial relations of the data are obscured. As the VCM excavation design is determined by coal seam thickness and lateral heterogeneous sediment layers, spatial variability of rock properties is imperative in understanding behaviour of rock masses present. 2.5D visualization enable us to present depression shaped coal layer with samples taken at different coal layer depths in regard to its thickness and depression-seam-shaped distribution of physical properties of coal could be visualized. As physical properties of coal were related to its mechanical parameters we concluded that there is evidence of relation between low ash content-high calorific value coal and good mechanical conditions for coal burst source formation. Furthermore when an area with high risk of coal burst formation will be determined sufficient burst prevention design can be introduced with progression of excavation works to reduced elastic conditions in rock mass e.g. destress blasting and large diameter borehole drilling, time-consistency of excavation works and deformation-over-take of the appropriate support system.
In the 2.5D visualization, the excavations, the Velenje coal seam with coal samples properties and recorded coal burst locations were presented. As coal burst occurrence and formation depend on geomechanical properties of rock and on the depth of excavations, coal sample ash content and calorific value were assigned to a corresponding coal seam thickness layer. In thickness layer A 32, in B 17, in layer C 41, in layer D 12, and in layer E no coal bursts were recorded.
When reviewing the 2.5D visualization and the conditions of coal burst emergence, the influence of increasing depth of excavations becomes evident. In the upper parts of the coal seam, where coal is high-level coal with good elastic properties, the latter is decisive factor on the coal burst formation. Corresponding to the increase in depth of excavations, increase in stress occurs. Excavations progress into coal with lower elastic properties, and the depth impact on coal burst formation increases. Furthermore, with the advancement of excavations deeper into the Velenje depression, the increase in ash content and the reduction of calorific values of coal occur. Here E layer already describes low-level coal with clay component present.
After reviewing locations of coal bursts occurred in the VCM Type I rockbursts were determined. Coal burst source locations were generally within 100 m of a mining face or on some pre-existing zone of weakness in the mine area. After previous research only low to medium magnitudes were recorded. There is insufficient data for larger Type II rockbursts to be proven and accurately located.
Acknowledgments
This study was financially supported by the research project L1-5451 funded by Slovenian Research Agency (ARRS) and the Velenje coalmine D. D. Roger Pain for linguistic corrections.
Author Contributions
Goran Vižintin contributed data and analysis tools; Milivoj Vulić contributed analysis tools and analyzed data; Maja Kocjančič analyzed data and wrote the paper.
Conflicts of Interest
The authors declare no conflict of interest. The founding sponsors had no role in the design of the study; in the collection, analyses, or interpretation of data; in the writing of the manuscript, and in the decision to publish the results.
References
- Veber, I. Geologija Premogovnika Velenje. Mineralne surovine v letu 2006 2007, 3, 139–148. (In Slovenian) [Google Scholar]
- Markič, M.; Sachsenhofer, R.F. The Velenje Lignite—Its Petrology and Genesis, 1st ed.; Geological Survey of Slovenia: Ljubljana, Slovenia, 2010; pp. 1–23. [Google Scholar]
- Brezigar, A. Premogovna plast Rudnika lignita Velenje. Geologija 1987, 28, 319–336. [Google Scholar]
- Blažič, A.; Dervarič, E.; Mayer, J.; Lenart, M.; Lah, R.; Jeromel, G.; Likar, J.; Čadež, J. Analize Sprememb Napetosti in Deformacij v Prostoru v Vplivnem Območju Napredovanja širokočelnega Odkopavanja Premoga. 2007. Available online: http://www.srdit.si/40skok/clanki/07ABlazicSkok07clanek.pdf (accessed on 19 October 2015). (In Slovenian)
- Mayer, J.; Mavec, M.; Zadnik, I.; Lah, R. Spremljanje rudarsko induciranih seizmičnih pojavov v Premogovniku Velenje. RMZ Mater. Geoenviron. 2002, 49, 51–60. (In Slovenian) [Google Scholar]
- Brady, B.H.G.; Brown, E.T. Rock Mechanics for Underground Mining, 1st ed.; Allen & Unwin: London, UK, 1985; pp. 271–311. [Google Scholar]
- A Survey of Mining Induced Rockbursts. Available online: http://www.infomine.com/library/publications/ (accessed on 13 May 2015).
- Seismicity in Mines—A Review. Available online: http://epubl.ltu.se/1402-1536/2004/22/LTU-TR-0422-SE.pdf (accessed on 13 May 2015).
- Cai, M.; Kaiser, P. Visualization of rock mass classification systems. Geotech. Geol. Eng. 2006, 24, 1089–1102. [Google Scholar] [CrossRef]
- Tibbett, J.D.; Suorineni, F.T.; Hebblewhite, B.K. Preliminary investigation of rockmass response to undercut blasting in a block cave mining system using VRSV. CIM J. 2016, 7, 121–131. [Google Scholar] [CrossRef]
- Dervarič, E.; Zavšek, S.; Kočar, F.; Ribičič, M. Categorization of rock masses for the design of tunnel support in Velenje Coal Mine. In Proceedings of the Prvo Mednarodno Posvetovanje o Gradnji Predorov in Podzemnih Prostorov, Ljubljana, Slovenia, 16–18 September 1992; Organizacijski Odbor: Ljubljana, Slovenia, 1992; pp. 14–23. [Google Scholar]
- Suorineni, F.T. Editorial. J. Rock Mech. Geotech. Eng. 2015, 7, 481–482. [Google Scholar] [CrossRef]
- Vižintin, G.; Supovec, I. Ocena Vplivov Geofizikalnih Lastnosti Ležišča Premogovnika Velenje na Nastanek Hribinskih Udarov: Končno Poročilo; HGEM d.o.o.: Ljubljana, Slovenia, 2013; p. 13. (In Slovenian) [Google Scholar]
- Supovec, I.; Veber, I. Analiza Vplivov Dejavnikov Grafičnega Prikaza Geoloških Struktur in Izbira Optimalne Metode Izdelave Digitalnega Modela: Raziskovalna Naloga, Končno Poročilo za Leto 1999; HGEM d.o.o.: Ljubljana, Slovenia, 2000; p. 20. (In Slovenian) [Google Scholar]
- Supovec, I.; Veber, I. Izdelava Metodologije Načrtovanja Razporeditve Raziskovalnih del z Uporabo Optimiziranih Digitalnih Modelov: Raziskovalna Naloga, Končno Poročilo za Leto 2002; HGEM d.o.o.: Ljubljana, Slovenia, 2002; p. 11. (In Slovenian) [Google Scholar]
- USGS—Map Accuracy Standards. Available online: http://pubs.er.usgs.gov/publications/ (accessed on 4 November 2014).
- ASPRS—Accuracy Standards for Large-Scale Maps. Available online: http://www.asprs.org/a/society/committees/standards/1990_jul_1068-1070.pdf (accessed on 4 November 2014).
- Medved, M.; Dervarič, E.; Vižintin, G.; Likar, J.; Mayer, J. Analysis of seismic events at the Velenje Coal Mine. RMZ Mater. Geoenviron. 2008, 55, 464–475. [Google Scholar]
- Mendecki, A.J. Quantitative Seismology and Rockmass Stability. In Seismic Monitoring in Mines, 2nd ed.; Chapman & Hall: London, UK, 1997; pp. 178–219. [Google Scholar]
- Li, T.; Cai, M.F.; Cai, M. A review of mining-induced seismicity in China. Int. J. Rock Mech. Min. Sci. 2007, 44, 1149–1171. [Google Scholar] [CrossRef]
- Wang, J.A.; Park, H.D. Comprehensive prediction of rockburst based on analysis of strain energy in rocks. Tunn. Undergr. Space Technol. 2001, 16, 49–57. [Google Scholar] [CrossRef]
- Holub, K. A study of mining-induced seismicity in Czech Mines with longwall coal exploitation. J. Min. Sci. 2007, 43, 32–39. [Google Scholar] [CrossRef]
- Bukowska, M. The Rockbursts in the Upper Silesian Coal Basin in Poland. J. Min. Sci. 2012, 48, 445–456. [Google Scholar] [CrossRef]
Figure 1.
Location of the Velenje coal mine (VCM).

Figure 2.
Geological profile SW-NE of the VCM coal-bearing depression [3].
Figure 2.
Geological profile SW-NE of the VCM coal-bearing depression [3].

Figure 3.
Studied area with coal layer occurrence limits and location of Profile 1.

Figure 4.
Profile 1 of coal seam defined with hanging wall-coal layer-footwall limits and divided into five thickness layers.
Figure 4.
Profile 1 of coal seam defined with hanging wall-coal layer-footwall limits and divided into five thickness layers.

Figure 5.
Residual values of KRG interpolation method for gridding ash content in layer C. Residual values are gridded with triangulation with linear interpolation method and are projected over surface contour map.
Figure 5.
Residual values of KRG interpolation method for gridding ash content in layer C. Residual values are gridded with triangulation with linear interpolation method and are projected over surface contour map.

Figure 6.
Excavation work and coal burst source locations at the VCM.

Figure 7.
Coal thickness layers and depth of excavations at the VCM.

Figure 8.
Visualizations of general situation of coal burst source locations in individual thickness layers A–E.
Figure 8.
Visualizations of general situation of coal burst source locations in individual thickness layers A–E.

Figure 9.
(a) Ash content and locations of coal bursts source in thickness layer A; and (b) Calorific value of coal and locations of coal bursts source in thickness layer A.
Figure 9.
(a) Ash content and locations of coal bursts source in thickness layer A; and (b) Calorific value of coal and locations of coal bursts source in thickness layer A.

Figure 10.
(a) Ash content of coal and locations of coal bursts source in thickness layer B; and (b) Calorific value of coal and coal burst source locations in thickness layer B.
Figure 10.
(a) Ash content of coal and locations of coal bursts source in thickness layer B; and (b) Calorific value of coal and coal burst source locations in thickness layer B.

Figure 11.
(a) Ash content of coal and locations of coal bursts source in thickness layer C; and (b) calorific value of coal and locations of coal bursts sources in thickness layer C.
Figure 11.
(a) Ash content of coal and locations of coal bursts source in thickness layer C; and (b) calorific value of coal and locations of coal bursts sources in thickness layer C.

Figure 12.
(a) Ash content of coal and locations of coal bursts source in thickness layer D; and (b) calorific value of coal and coal burst source locations in thickness layer D.
Figure 12.
(a) Ash content of coal and locations of coal bursts source in thickness layer D; and (b) calorific value of coal and coal burst source locations in thickness layer D.

Figure 13.
(a) Ash content of coal in thickness layer E; and (b) calorific value of coal in thickness layer E.
Figure 13.
(a) Ash content of coal in thickness layer E; and (b) calorific value of coal in thickness layer E.


Table 1.
Statistical analysis of interpolation residuals methods for gridding hanging-wall data. IDP: inverse distance to a power; KRG: Kriging; MSM: modified Shepard’s method; and RBF: radial basis function.
| Method | IDP | KRG | MSM | Natural Neighbor | RBF | Triangulation with Linear Interpolation | Local Polynomial |
|---|---|---|---|---|---|---|---|
| NP | 775 | 775 | 775 | 768 | 775 | 768 | 775 |
| Resmin | −2.1228 | −2.2324 | −3.0230 | −3.8058 | −1.2828 | −2.8866 | −57.2513 |
| Resmax | 1.6358 | 2.0927 | 1.7095 | 2.3639 | 1.7611 | 1.5989 | 72.8033 |
| RMS | 0.2598 | 0.3425 | 0.1733 | 0.4293 | 0.1139 | 0.3346 | 13.1213 |
| Max Res | −2.1228 | −2.2324 | −3.0230 | −3.8058 | 1.7611 | −2.8866 | 72.8033 |
| N > int. | 0 | 0 | 0 | 0 | 0 | 0 | 69 |
| N > 1/2 int. | 0 | 0 | 0 | 0 | 0 | 0 | 116 |
| % > 1/2 int. | 0.00 | 0.00 | 0.00 | 0.00 | 0.00 | 0.00 | 14.97 |
| Score | 3 | 5 | 2 | 6 | 1 | 4 | 7 |
| Method | IDP | KRG | MSM | Natural Neighbor | RBF | Triangulation with Linear Interpolation | Local Polynomial |
|---|---|---|---|---|---|---|---|
| NP | 339 | 339 | 339 | 339 | 339 | 339 | - |
| Resmin | −10.0709 | −9.0206 | −4.9478 | −13.2360 | −9.1041 | −12.3598 | −353.4363 |
| Resmax | 7.4011 | 6.9097 | 1.9023 | 5.9525 | 6.7120 | 4.5739 | 136.9537 |
| RMS | 1.3397 | 1.4695 | 0.4680 | 1.7902 | 1.0163 | 1.5214 | 59.5334 |
| Max Res | −10.0709 | −9.0206 | −4.9478 | 13.2360 | 9.1041 | 12.3598 | 353.4363 |
| N > int. | 1 | 0 | 0 | 2 | 0 | 2 | 246 |
| N > 1/2 int. | 4 | 6 | 0 | 8 | 4 | 4 | 289 |
| % > 1/2 int. | 1.18 | 1.77 | 0.00 | 2.36 | 1.18 | 1.18 | 85.25 |
| Score | 4 | 3 | 1 | 6 | 2 | 5 | 7 |
Table 3.
Statistical analysis of interpolation methods residuals for gridding ash content in coal samples of thickness layer C.
| Method | IDP | KRG | MSM | Natural Neighbor | RBF | Triangulation with Linear Interpolation | Local Polynomial |
|---|---|---|---|---|---|---|---|
| NP | 420 | 420 | 420 | 406 | 420 | 406 | 420 |
| Resmin | −3.6555 | −3.7181 | −0.4717 | −4.3922 | −0.1127 | −4.4430 | −18.3217 |
| Resmax | 5.8212 | 4.5290 | 0.2145 | 3.9643 | 0.1754 | 3.4117 | 26.9481 |
| RMS | 0.4173 | 0.4969 | 0.0456 | 0.5815 | 0.0302 | 0.4692 | 7.0702 |
| Max Res | 5.8212 | 4.5290 | −0.4717 | −4.3922 | 0.1754 | −4.4430 | 26.9481 |
| N > int. | 0 | 0 | 0 | 0 | 0 | 0 | 55 |
| N > 1/2 int. | 1 | 0 | 0 | 0 | 0 | 0 | 190 |
| % > 1/2 int. | 0.24 | 0.00 | 0.00 | 0.00 | 0.00 | 0.00 | 45.24 |
| Score | 4 | 3 | 2 | 5 | 1 | 6 | 7 |
Table 4.
Numerical evaluations of the interpolation methods available and chosen in software package Surfer®12.
| Interpolation Method | Hanging Wall; Evaluation 1 | Footwall; Evaluation 2 | Ash content and Calorific Value of Coal in Layer C; Evaluation 3 | Final Score |
|---|---|---|---|---|
| Inverse distance to a Power | 3 | 4 | 4 | 11 |
| KRG | 5 | 3 | 3 | 11 |
| Modified Shepard’s Method | 2 | 1 | 2 | 5 |
| Natural Neighbor | 6 | 6 | 5 | 17 |
| RBF | 1 | 2 | 1 | 4 |
| Triangulation with Linear Interpolation | 4 | 5 | 6 | 15 |
| Local Polynomial | 7 | 7 | 7 | 21 |
© 2016 by the authors; licensee MDPI, Basel, Switzerland. This article is an open access article distributed under the terms and conditions of the Creative Commons Attribution (CC-BY) license (http://creativecommons.org/licenses/by/4.0/).
Share and Cite
MDPI and ACS Style
Vižintin, G.; Kocjančič, M.; Vulić, M. Study of Coal Burst Source Locations in the Velenje Colliery. Energies 2016, 9, 507. https://doi.org/10.3390/en9070507
AMA Style
Vižintin G, Kocjančič M, Vulić M. Study of Coal Burst Source Locations in the Velenje Colliery. Energies. 2016; 9(7):507. https://doi.org/10.3390/en9070507
Chicago/Turabian StyleVižintin, Goran, Maja Kocjančič, and Milivoj Vulić. 2016. "Study of Coal Burst Source Locations in the Velenje Colliery" Energies 9, no. 7: 507. https://doi.org/10.3390/en9070507
Note that from the first issue of 2016, this journal uses article numbers instead of page numbers. See further details here.