1. Introduction
The emission of greenhouse gases (GHG) is a significant, long-term threat to the global environment, due to its role in global warming. Global warming will increase the temperature on Earth by approximately 3 °C to 5 °C by the year 2100, and the global mean sea level (GMSL) will continue to rise [
1]. The components of greenhouse gases are carbon dioxide (CO
2, 76%), methane (CH
4, 16%), nitrous oxide (N
2O, 6%), hydrofluorocarbons (HFCs, 2%) [
2]. The reduction of greenhouse gases was discussed internationally during the United Nations Framework Convention on Climate Change. (FCCC). At this conference, each country suggested their GHG reduction target and reduction strategy based on the Intended Nationally Determined Contribution (INDC). The U.S. plans to reduce GHG emissions by 26%–28% compared to its 2005 level by 2025 [
3], and the EU has set a target of at least a 40% domestic reduction in GHG emissions by 2030 in comparison to those of 1990 [
4]. According to the INDC submitted by Korea, the plan is to reduce its greenhouse gas emissions by 37% from business-as-usual (BAU) levels by 2030 [
5], and to set a detailed reduction target for each field of industry.
Within the economic sector, the transportation section makes up a 14% share of global GHG emissions. It is reported that 95% of transportation emissions caused by road transport [
2]. The CO
2 emissions from road transportation in Korea are 83.1 million tons/year, which comprises 13.5% of the total CO
2 emissions of Korea [
6]. To reduce the total CO
2 emissions generated by the transportation sector in Korea, mandatory CO
2 emission regulations for passenger vehicles and light-duty trucks are being enforced until 2020. The average CO
2 emission standard was 140 g/km in 2015, and will be 97 g/km in 2020 [
7]. Many policy researchers have focused on light-duty vehicles (LDVs) to find ways to mitigate CO
2 emissions [
8,
9].
However, there are no such regulations and standards for CO
2 emissions of medium- and heavy-duty vehicles (MHDV), and there have only been a few studies on MHDVs in comparison to those on LDVs. CO
2 regulation for MHDVs is still in its nascent stages. The estimated implementation timeline for MHDV efficiency standards of each country [
10] is shown in
Table 1. In Korea, permissible levels of exhaust emissions only exist for oxides of nitrogen and hydrocarbons, but not for CO
2. However, in order to achieve the target reductions proposed by the INDC, it is necessary to regulate CO
2 emissions emitted by MHDVs.
Table 2 shows the percentage of MDHV number and the percentage of CO
2 emissions which is generated by MHDVs in the transportation sector [
11]. The percentage of MHDVs relative to the total vehicle registration numbers was only 5%–20%. However, the percentage of CO
2 emissions emitted by MHDVs increased to 30%–70% of the total CO
2 emissions generated in the road transportation sector.
A chassis dynamometer is widely used to measure CO2 emissions. The regulation standards for LDVs are based on chassis dynamometer test results. A chassis dynamometer test is an effective way to measure emissions by simulating road driving in a laboratory. However, since MHDVs vary in weight (5–40 tons), length (5–15 m), and driveline (4 × 2, 4 × 4, 6 × 2, 6 × 4, 6 × 6 axle), it is expensive and time consuming to test each vehicle on a case-by-case basis. From this point of view, the simulation method is useful to compensate for the limitations of the test method. Some countries, such as the U.S., E.U., and Japan, have suggested computer simulation programs to measure CO2 emission which is generated by MHDVs. The U.S. developed a simulation program called Greenhouse Emission Model (GEM), and E.U. has also developed a vehicle-dynamic-based simulation program called the Vehicle Energy Calculation Tool (VECTO).
In the process of conducting vehicle simulations, acquiring accurate input data is essential to reproduce the real world performance of a vehicle. The most significant factors affecting the calculation result are the fuel consumption map, maximum torque curve, driving resistance coefficient, and the test driving cycle. In addition, some studies that have considered other parameters, such as temperature, driving style, and road surface conditions [
12]. It is desirable to provide accurate input data, however, but generic data are allocated according to a vehicle class if specific data are not available.
A large amount of CO
2 emission rate data from MHDVs is predicted and used to develop a detailed CO
2 emission inventory for the MHDV sector of Korea. There are two types of approaches to develop a CO
2 emission inventory: top-down and the bottom-up approaches [
13,
14,
15,
16]. The top-down approach focuses on fuel market interactions in order to estimate the energy consumption of each economic sector. This type of methodology is effective to analyze the energy consumption ratio of each economic sector in a short time; however, this methodology has a weakness in implementing detailed analysis in inventory data since it does not contain an engineering perspective. The bottom-up approach, on the other hand, focuses on technological details by using emission models of each vehicle, VMT and vehicle registration statistics. This methodology has an advantage in reflecting detailed technological data and technological development scenarios and models [
17].
The previous method used to assess CO
2 emissions in Korea was a fuel-based, top-down model, which used domestic fuel consumption [
6]. However, the fuel-based method, which is based on sales volumes, cannot reflect the CO
2 emissions of each vehicle class, and it is difficult to use when conducting a detailed analysis. To overcome these limitations, the bottom-up approach was used in this study to develop the emission inventory of MHDVs in Korea.
The aim of this study was to develop a CO2 emission inventory of MHDVs in Korea by using bottom-up approach and simulation method. To validate the prediction accuracy, the simulated results were compared with fuel-based results, which predicted CO2 emissions based on fuel consumption. Finally, the developed inventory provided useful suggestions to meet the GHG reduction target and to establish CO2 emission regulations for MHDVs.
2. Methodology
To calculate the MHDV CO
2 emissions (kg/year), simulation results of emission factors, VMT of each vehicle type, and vehicle registration statistics were used. The calculation of CO
2 emissions (kg/year) is as follows:
where
is the total CO
2 emissions of MHDVs,
is the emission factor of the vehicle model
, which is calculated using a simulation (kg/km),
is the registration quantity of a vehicle model
in Korea (-), and
is the VMT of vehicle model
(km/year).
2.1. Simulations
The vehicle-dynamic-based simulation model was composed of the engine, transmission, chassis, and driving cycle component modules. The proposed model calculated the fuel consumption and CO
2 emissions based on a backward type calculation, as shown in
Figure 1.
In the chassis subsystem module, all of the forces that act on a vehicle, including the resistance forces and the acceleration force, were taken into consideration. The relationship of the forces is as follows:
where
is the net force acting on the vehicle (N),
is the rolling resistance force (N),
is the air resistance force (N),
is the acceleration force (N), and
is the resistance force due to inclination (N). The resistance forces
and
are given as follows:
where
is the air resistance coefficient (N/m
2/(km/h)
2),
is the effective frontal area,
V is the vehicle speed (km/h),
is the rolling resistance coefficient (-), and
W is the vehicle weight (N).
Since it is difficult to derive the drag and rolling resistance coefficients for all types of MHDVs, the approximated resistance force equations are used in this study. Equations (5) and (6) have been integrated in the Japanese HDV simulation model. The air resistance coefficient is determined as a function of vehicle’s height and width. The rolling resistance coefficient is determined based on the vehicle weight [
18,
19]. In this study, the air resistance coefficient and rolling resistance coefficients of each MHDV were calculated as follows:
where
A is the front projection area (m
2),
B is the full width (m),
H is the full height (m), and
W is the vehicle weight (N). For the air resistance coefficient of a bus, the approximation noted above was multiplied by a correction factor of 0.68.
In the transmission subsystem, engine speed and torque were calculated, which were used as input data of the engine subsystem. Considering that the vehicle followed the target velocity profile exactly, the engine speed can be calculated as follows:
where
is the engine speed (RPM),
Vn is the vehicle velocity (km/h),
is the gear ratio (-),
is the final gear ratio (-), and
is the circumference of the tire (m). If a vehicle uses an automatic transmission, then the speed loss coefficient is applied to reflect rotational speed loss. The engine torque can be calculated as follows:
where
is the engine torque (N∙m),
is the net force acting on the vehicle (N),
is the vehicle velocity (km/h), and
is the torque transmission efficiency (-).
In addition to calculating engine speed and engine torque, the transmission subsystem includes gear shifting, which is determined by considering gear ratios, the transmission efficiency of each gear, and the gear shifting mechanism. Gear shifting is determined by considering the residual driving power and the engine speed of each gear. If residual driving power is sufficient to drive the vehicle, then the gear is shifted to the next one; if not, the gear is downshifted.
In an engine subsystem, the CO
2 emissions are calculated using a fuel consumption map. A fuel consumption map is three-dimensional and is comprised of engine speed (
x axis, RPM), engine Brake Mean Effective Pressure (BMEP,
y axis, bar), and fuel consumption rate (
z axis, kg/h). Based on the calculated engine speed and torque, the fuel consumption rate was calculated for each time step. After adding all of the fuel consumption for each time step, the calculation of the CO
2 emission was conducted as follows:
where
is the CO
2 emissions (g/km),
is the CO
2 emission factor of fuel (g/L), and
is the vehicle’s fuel consumption rate (L/km).
The main input variables were vehicle weight, rolling and air resistance coefficient, frontal area, maximum torque curve, fuel consumption map, gear ratio, idle condition, tire radius, transmission efficiency, and driving cycle. Since the average loading ratio in Korea was reported to be 50% [
20], the vehicle weight for testing was half the loaded condition, as follows:
where
is the test weight of the truck (kg),
is the curb weight of the truck (kg),
is the maximum loading capacity of the truck (kg),
is the test weight of the bus (kg),
is the curb weight of the bus (kg) and
is the passenger capacity of the bus (-). The passenger capacity of a truck is one, which is the driver, and the bus takes half of its maximum passenger capacity. The average passenger weight of a Korean person is set to 65 kg.
2.2. Driving Cycle Weighting Factor
In a previous report, it was revealed that the World Harmonized Vehicle Cycle (WHVC) is appropriate for representing real driving patterns of MHDVs in Korea [
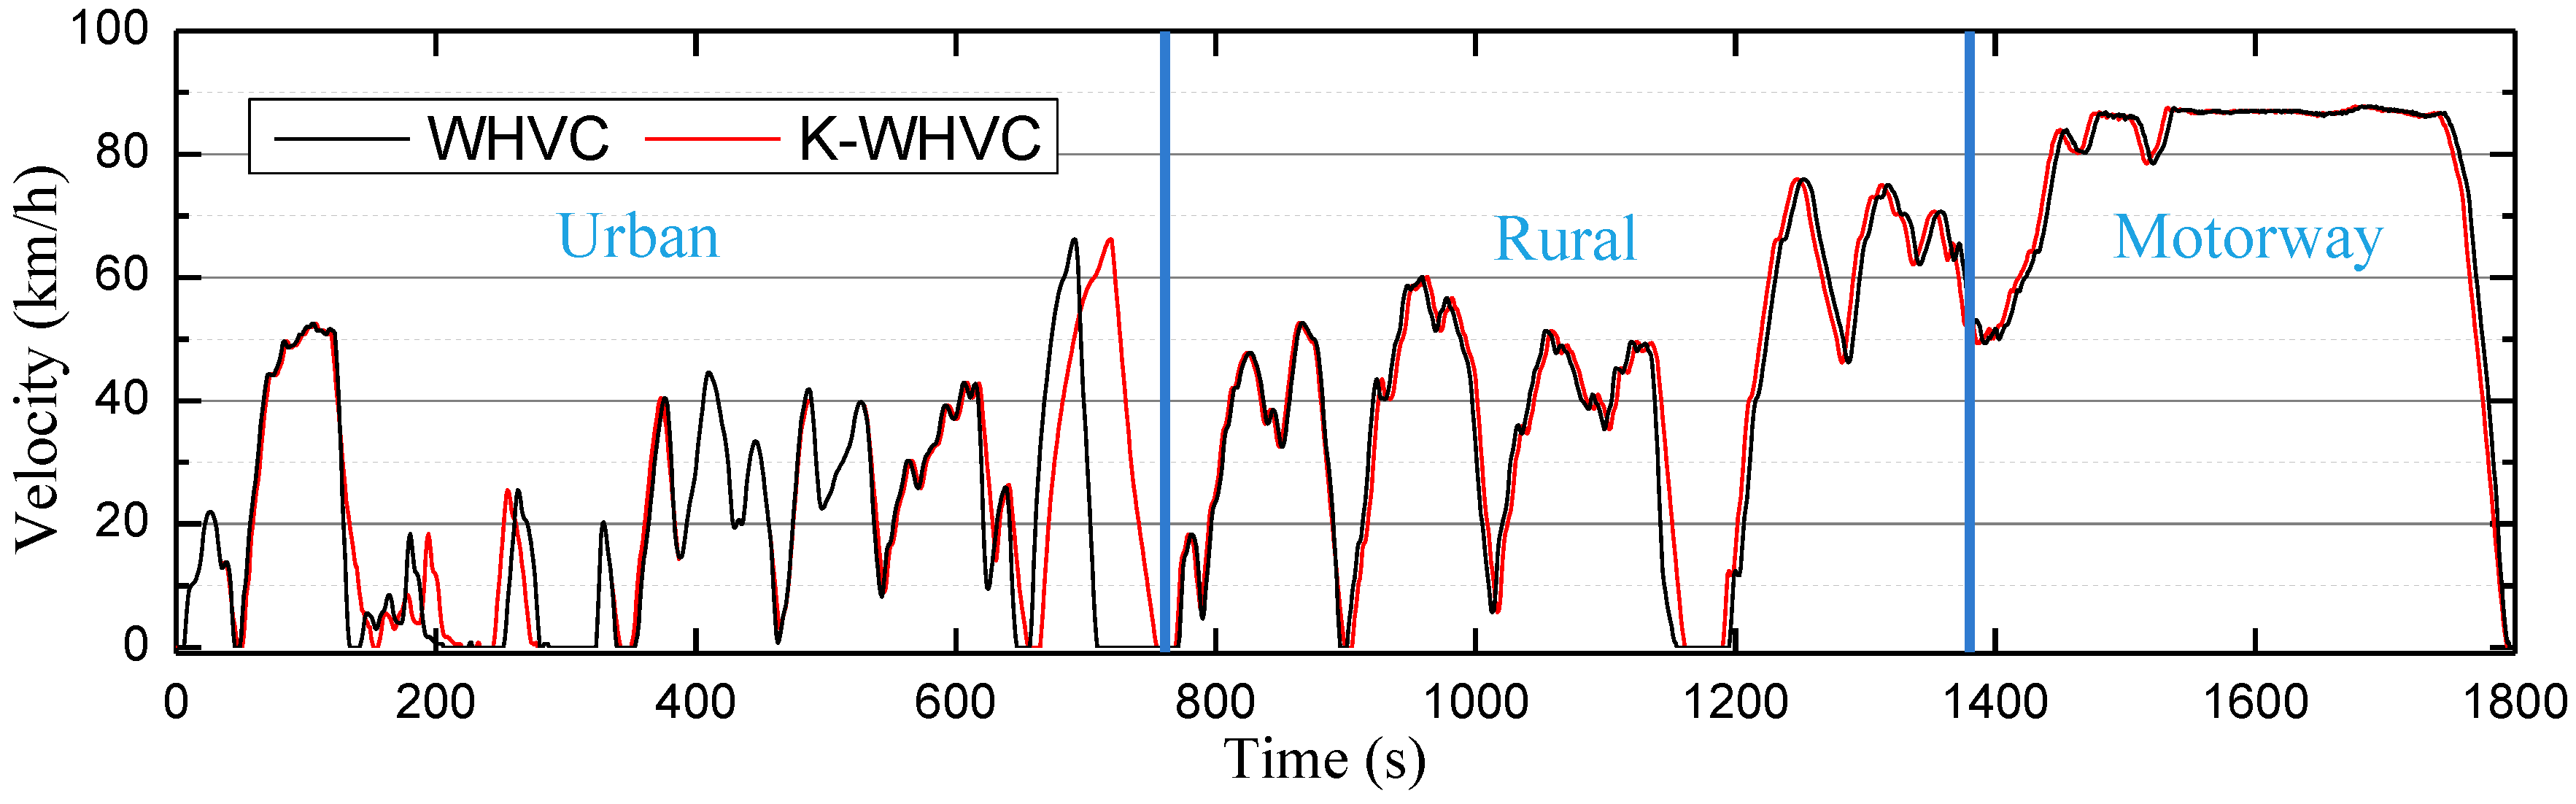
21]. However, some of the MHDVs with gross vehicle weight (GVW) is greater than 40 tons cannot fully follow the original WHVC because the too much power is required in rapid acceleration regions. For these reasons, the Korean-World Harmonized Vehicle Cycle (K-WHVC), which is a slightly modified version of the WHVC, was used in this study.
The K-WHVC is composed of three phases (urban, rural, and motorway) and the differences in the velocity profiles between WHVC and K-WHVC are presented in
Figure 2. Since the driving pattern of the vehicles varied depending on the class of vehicle operation, a weighting factor for each phase was applied. The weighting factors of all of the phases are shown in
Table 3. Fuel efficiency was highest in the motorway phase and lowest in the urban phase. The idle time, acceleration, and deceleration losses were the reasons for the fuel efficiency differences in each phase. Certified CO
2 emission rates of MHDVs are calculated as follows:
where
ECO2, MHDV is the weighting applied CO
2 emissions (g/km),
WFurban is the weighting factor of the urban phase (-),
ECO2, urban is the CO
2 emissions of the urban phase (g/km),
WFrural is the weighting factor of the rural phase (-),
ECO2, rural is the CO
2 emissions of the rural phase (g/km),
WFmotorway is the weighting factor of the motorway phase (-) and
ECO2, motorway is the CO
2 emissions of the motorway phase (g/km).
2.3. Vehicle Miles Traveled and Vehicle Statistics
In this study, the object model was a truck with a GVW greater than 3.5 tons, and a bus with a passenger capacity greater than 16. Due to the wide range of MHDV sizes, the trucks were divided into two groups: Medium-sized with a GVW smaller than 10 tons, and heavy-sized with a GVW of more than 10 tons. The buses were also classified into two groups: city buses and ordinary buses. This classification standard was in agreement with the national database. Due to the tremendous range of vehicle types and applications, MHDV models are complex, especially when compared to LDV, and 2349 vehicle models were used for the simulations. For example, the same engine could have different gear boxes and axles; 4 × 2, 4 × 4, 6 × 2, 6 × 4, and 6 × 6 axle types; different tires for each axle; and single or twin tires. Even if these 2349 vehicle models cannot represent all of the models in Korea, the share of these models is more than 90% of all of the registered MHDVs in Korea. Therefore, it is reasonable that these models are sufficient to represent MHDV specifications in Korea.
The statistical data estimated by the Korean Automobile Manufacturer’s Association [
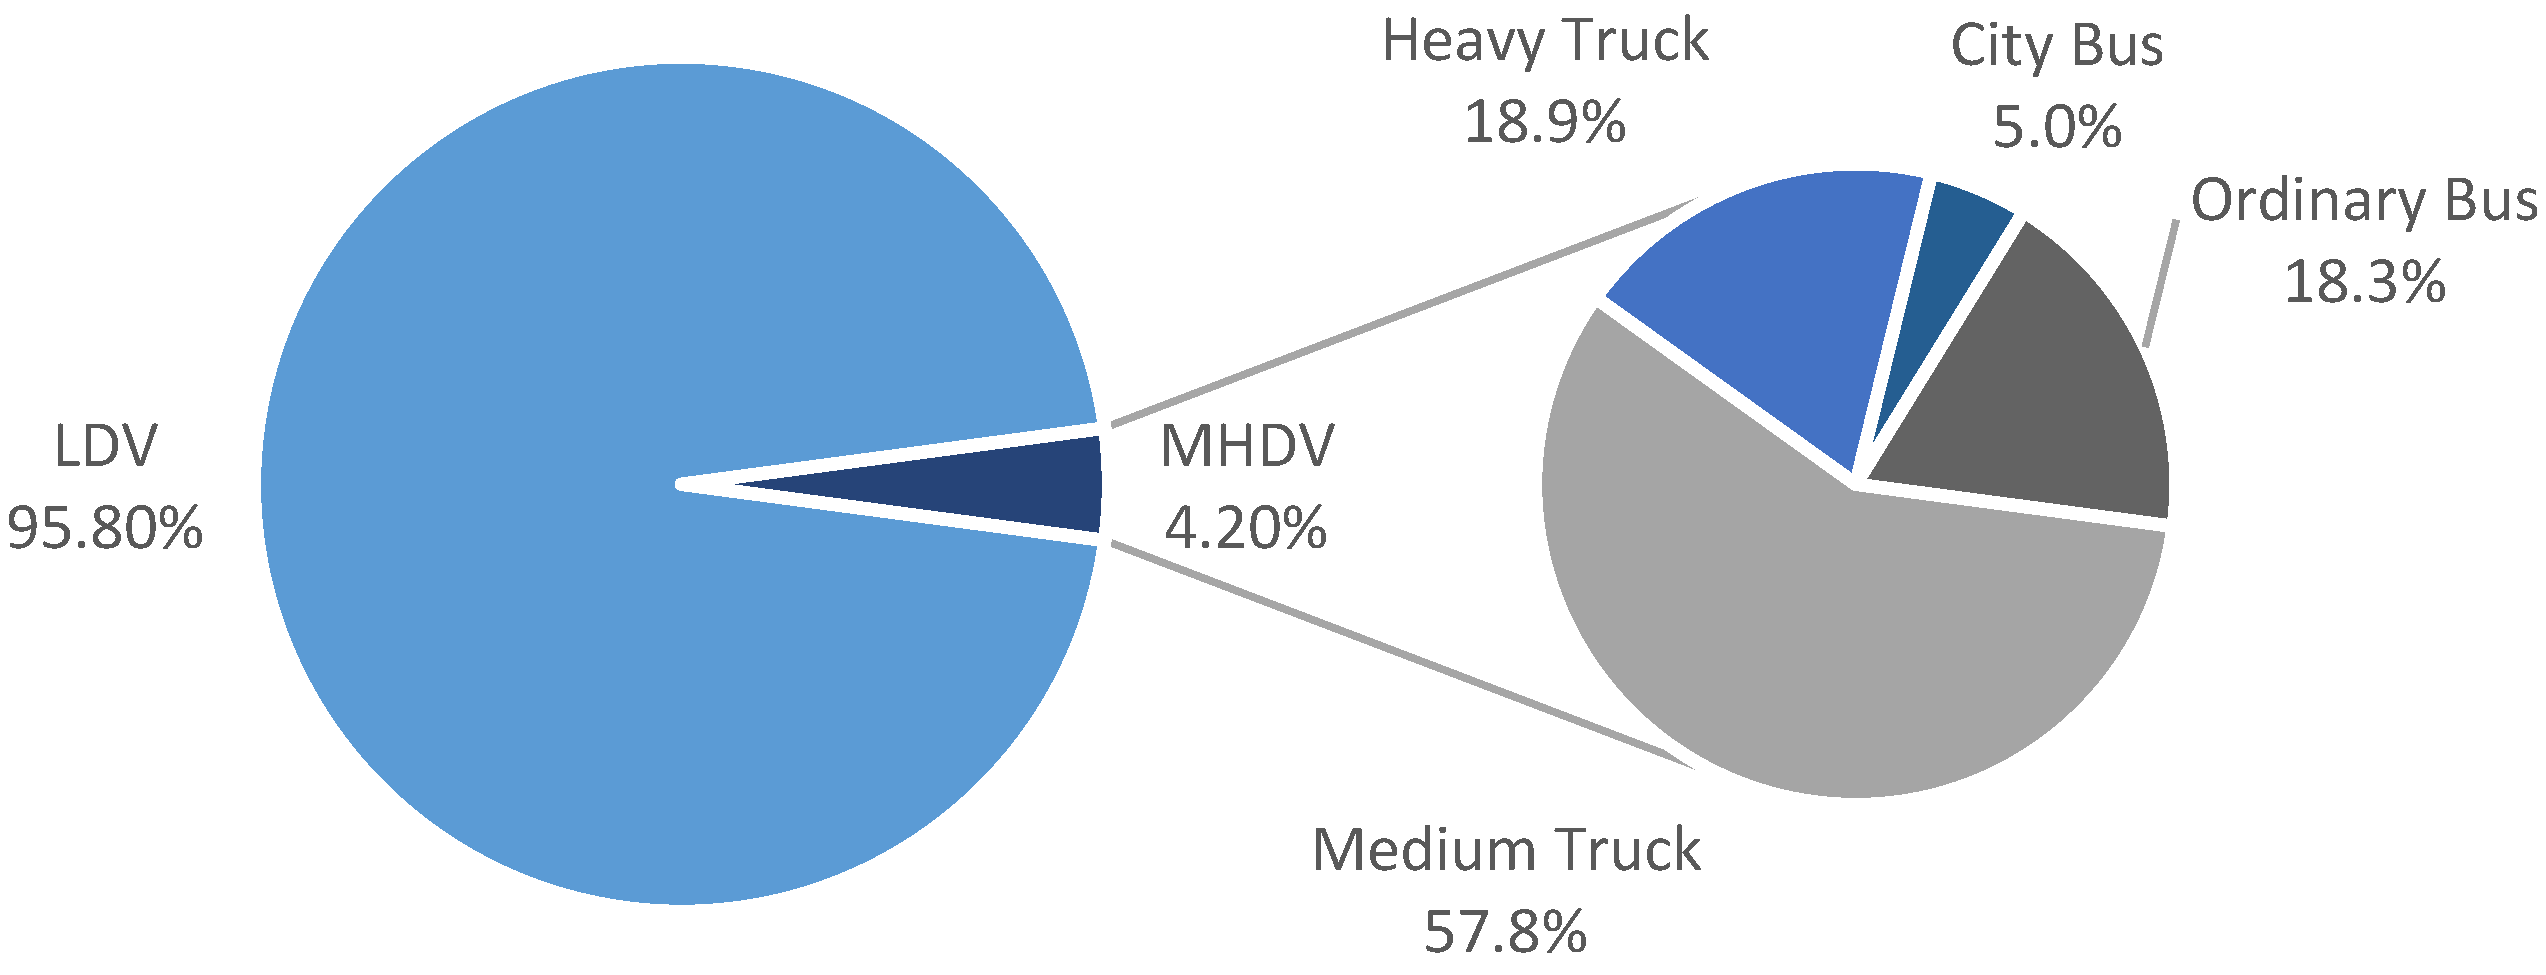
22] for each vehicle were used, such as the vehicle registration statistics. The proportions of each type of vehicle in Korea are shown in
Figure 3. The truck and bus share was 19.7%, which are including light-duty truck and bus, with a total number of 4,364,000 such vehicles. After excluding LDV, the MHDV share was 4.2%, and the total vehicle number was 858,000.
The VMTs for each vehicle class were important data for predicting the total CO
2 emissions generated in the MHDV sector of Korea. In Korea, the vehicle VMT was estimated by Korean Transportation Safety Authority (TS). The VMT of each vehicle (total 7,272,000 entries) were retrieved annually during inspections at vehicle inspection stations, and these data were classified into several categories. In this study, VMT data classified by vehicle class (bus or truck) and GVW were used [
23].
2.4. Modification Factor for Real World Emissions
In general, certified fuel efficiency and CO
2 emissions of LDVs are determined based on certification testing. However, it was revealed that the certified CO
2 emission data, acquired by the chassis dynamometer test and real-world tests show discrepancies [
24]. In real-world driving conditions, vehicle performance can be affected by a variety of external factors (air density, wind speed, road gradient, etc.). On the other hand, these variables are controlled in the chassis dynamometer test. For this reason, the average discrepancy between the certified and real world CO
2 emissions has increased to 25 percent in recent years [
24]. The frequency of additional accessories used in cars is one of the main reasons for the increased discrepancies of CO
2 emissions. Given these circumstances, it is obvious that K-WHVC based simulation results have to be revised in order to reduce the relative error between the type approval test and real-world conditions. For this reason, all of the CO
2 emissions derived in this study are increased by 30 percent when compared to the original simulation data.
2.5. Scenario Setting
In order to predict the level of CO2 emissions, a BAU-scenario-based prediction was conducted. The total CO2 emissions generated by the MHDV sector is calculated by trend lines, which are generated using 2012–2015 data. BAU-scenario-based prediction assumes that there are no advanced-technology appliances of use in future vehicles.
3. Results
Using the methodology described above, the CO
2 emission rates of 2349 case vehicle models were calculated, considering all of their specifications. In order to analyze the prediction accuracy of the simulation results, comparative analyses between chassis dynamometer test data (six types of trucks and two types of buses) and simulation data were conducted. Eight types of MHDVs were tested under the same simulation conditions, half-loaded conditions, and using the K-WHVC driving mode. The predicted CO
2 emission rates of the MHDVs are illustrated in
Figure 4.
As can be seen in
Figure 4, the CO
2 emissions were proportional to the GVW. The range of GVW was approximately five tons to 40 tons, and the range of CO
2 emissions was approximately 200 g/km to 900 g/km. Since it is too complicated to show all of the simulation results for the 2349 vehicles, we omitted some of the data points. By comparing the test and the simulation data, there were no significant differences between chassis dynamometer test results and the simulation results.
Figure 5 and
Figure 6 indicate the stepped levels of the emission factors. The straight line is categorized by vehicle class, which is based on weight. The emission factors of the trucks showed a constant tendency to be proportional to GVW, with the exception of MHDVs of which the gross vehicle weight is lower than 10 tons. On the other hand, the emissions of the buses had wide differences between city bus and ordinary bus. City buses generally drive in inner cities and have long idle times and low average speeds, which result in low fuel economy and large amounts of CO
2 emissions. On the other hand, ordinary buses have lower CO
2 emissions than city buses. For this reason, city buses usually emit more CO
2 than ordinary buses, which is reflected in our results.
Figure 6 shows the influence of loading conditions on trucks. Three loading conditions were tested: empty, half-loaded, and fully loaded. In contrast to passenger vehicles, the loading conditions of the MHDVs had considerable influence. For example, maximum payload of a 40-ton truck (heaviest truck) was 25 tons which takes 62% of its total weight. The average CO
2 emissions of a fully-loaded HDV were 12% more than those of the half-loaded conditions, and 25% more than those of the empty conditions. However, the influence of the loading capacity of a bus was not significant compared to that of a truck. For example, the maximum payload of the heaviest bus takes 15% of its total weight. For this reason, the CO
2 emission rates of the bus did not show a distinct gap, regardless of the loading conditions.
Figure 7 shows the predicted CO
2 emission results of MHDVs divided by loading capacity. These results are useful to analyze how many grams of CO
2 emission are generated to move one ton of payload (g/km·ton). The Environmental Protection Agency (EPA, U.S.) uses gallons per ton·mile for MHDV emission units. It is desirable to express CO
2 emission data as a unit of g/km·ton than g/km to evaluate freight efficiency. Due to the tremendous range of vehicle weights, trucks were divided into four groups and buses into two groups, according to weight. The CO
2 emission values in
Figure 7, which are marked on the center horizontal line, are the average emissions of each class. Since fixed fuel consumption is needed to operate a vehicle, a more heavily-loaded vehicle has less relative CO
2 emissions, which means it is more cost effective. The averaged CO
2 emissions of the lightest truck group (5 tons < GVW < 10 tons) emitted 119 g/km·ton, but the averaged CO
2 emissions of heaviest truck group (30 tons < GVW < 40 tons) is only 29 g/km·ton. From an economical freight perspective, the heavier truck is more cost effective with respect to freight efficiency, and this tendency can also be seen in buses.
Figure 8 shows the percentage of the Korea MHDV sector CO
2 emissions by source. This result was derived by using a simulation model, VMT, and vehicle registration statistics data. Trucks contributed a large portion to the total CO
2 emissions, 69.6% of the total MHDV emissions, 14.76 million tons/year. In
Figure 3, the number of medium trucks is three times more than heavy trucks; however, more CO
2 emissions are generated by heavy trucks than medium trucks. This is because heavy trucks have longer VMT than medium trucks. Bus emissions accounted for the rest of the emissions at 30.4% or 6.45 million tons/year. The total CO
2 emissions of the MHDVs were 21.21 million tons/year, and this accounted for 25.5% of road transportation CO
2 emissions in Korea.
Using the VMT and vehicle registration statistics from the national database between 2012 and 2015, the BAU level of CO
2 emissions, from 2016 to 2020, were calculated and are shown in
Figure 9. It is estimated that CO
2 emissions will increase from 24.47 million tons in 2015 to 25.37 million tons in 2020, and that the amount of CO
2 emissions will increase 0.8% annually.
4. Conclusions
In order to meet the GHG emission reduction target in the transportation sector, mandatory regulation of MHDV CO2 emissions is necessary. In contrast to LDVs, which use the chassis dynamometer test to measure CO2 emissions, the simulation method is being adopted in many countries in the MHDV sector. Therefore, the simulation method using a vehicle driveline model, based on vehicle dynamics, was used in this study to predict the CO2 emissions of 2349 MHDVs in Korea. In the proposed model, a weighting factor was applied to the driving cycle in order to reflect real driving patterns for each type of vehicle. After calculating the emission factors of each type of vehicle using the bottom-up method, which uses the vehicle VMT and registration statistics, the emission inventory of MHDVs in Korea was developed and used to predict the BAU CO2 emissions.
The result shows that MDHVs make up 4.2% of total vehicles, but they emit 25.5% of road transportation CO2 emissions. The CO2 emissions generated in the MHDV sector were concentrated in specific vehicle types. Heavy duty trucks are only 0.8% of total vehicles, but account for 11.2% of road transportation CO2 emissions. This is because each MHDV emits more CO2 than an LDV, and the average VMT of MHDVs is longer than that of LDVs. However, heavier vehicles were more efficient than lighter vehicles, emitting less CO2 to move one ton of payload (g/km·ton). In addition, when the CO2 emissions were classified according to loading, fully loaded trucks emitted 25% more CO2 (g/km) than empty trucks.
There are some other issues that should be considered in future studies. The use of additional equipment, such as air conditioning, and idle stops, are important factors that affect CO2 emissions. Alternative fuels, such as compressed natural gas (CNG), also have to be considered in future works.


