
Electrical-Based Diagnostic Techniques for Assessing Insulation Condition in Aged Transformers


Abstract
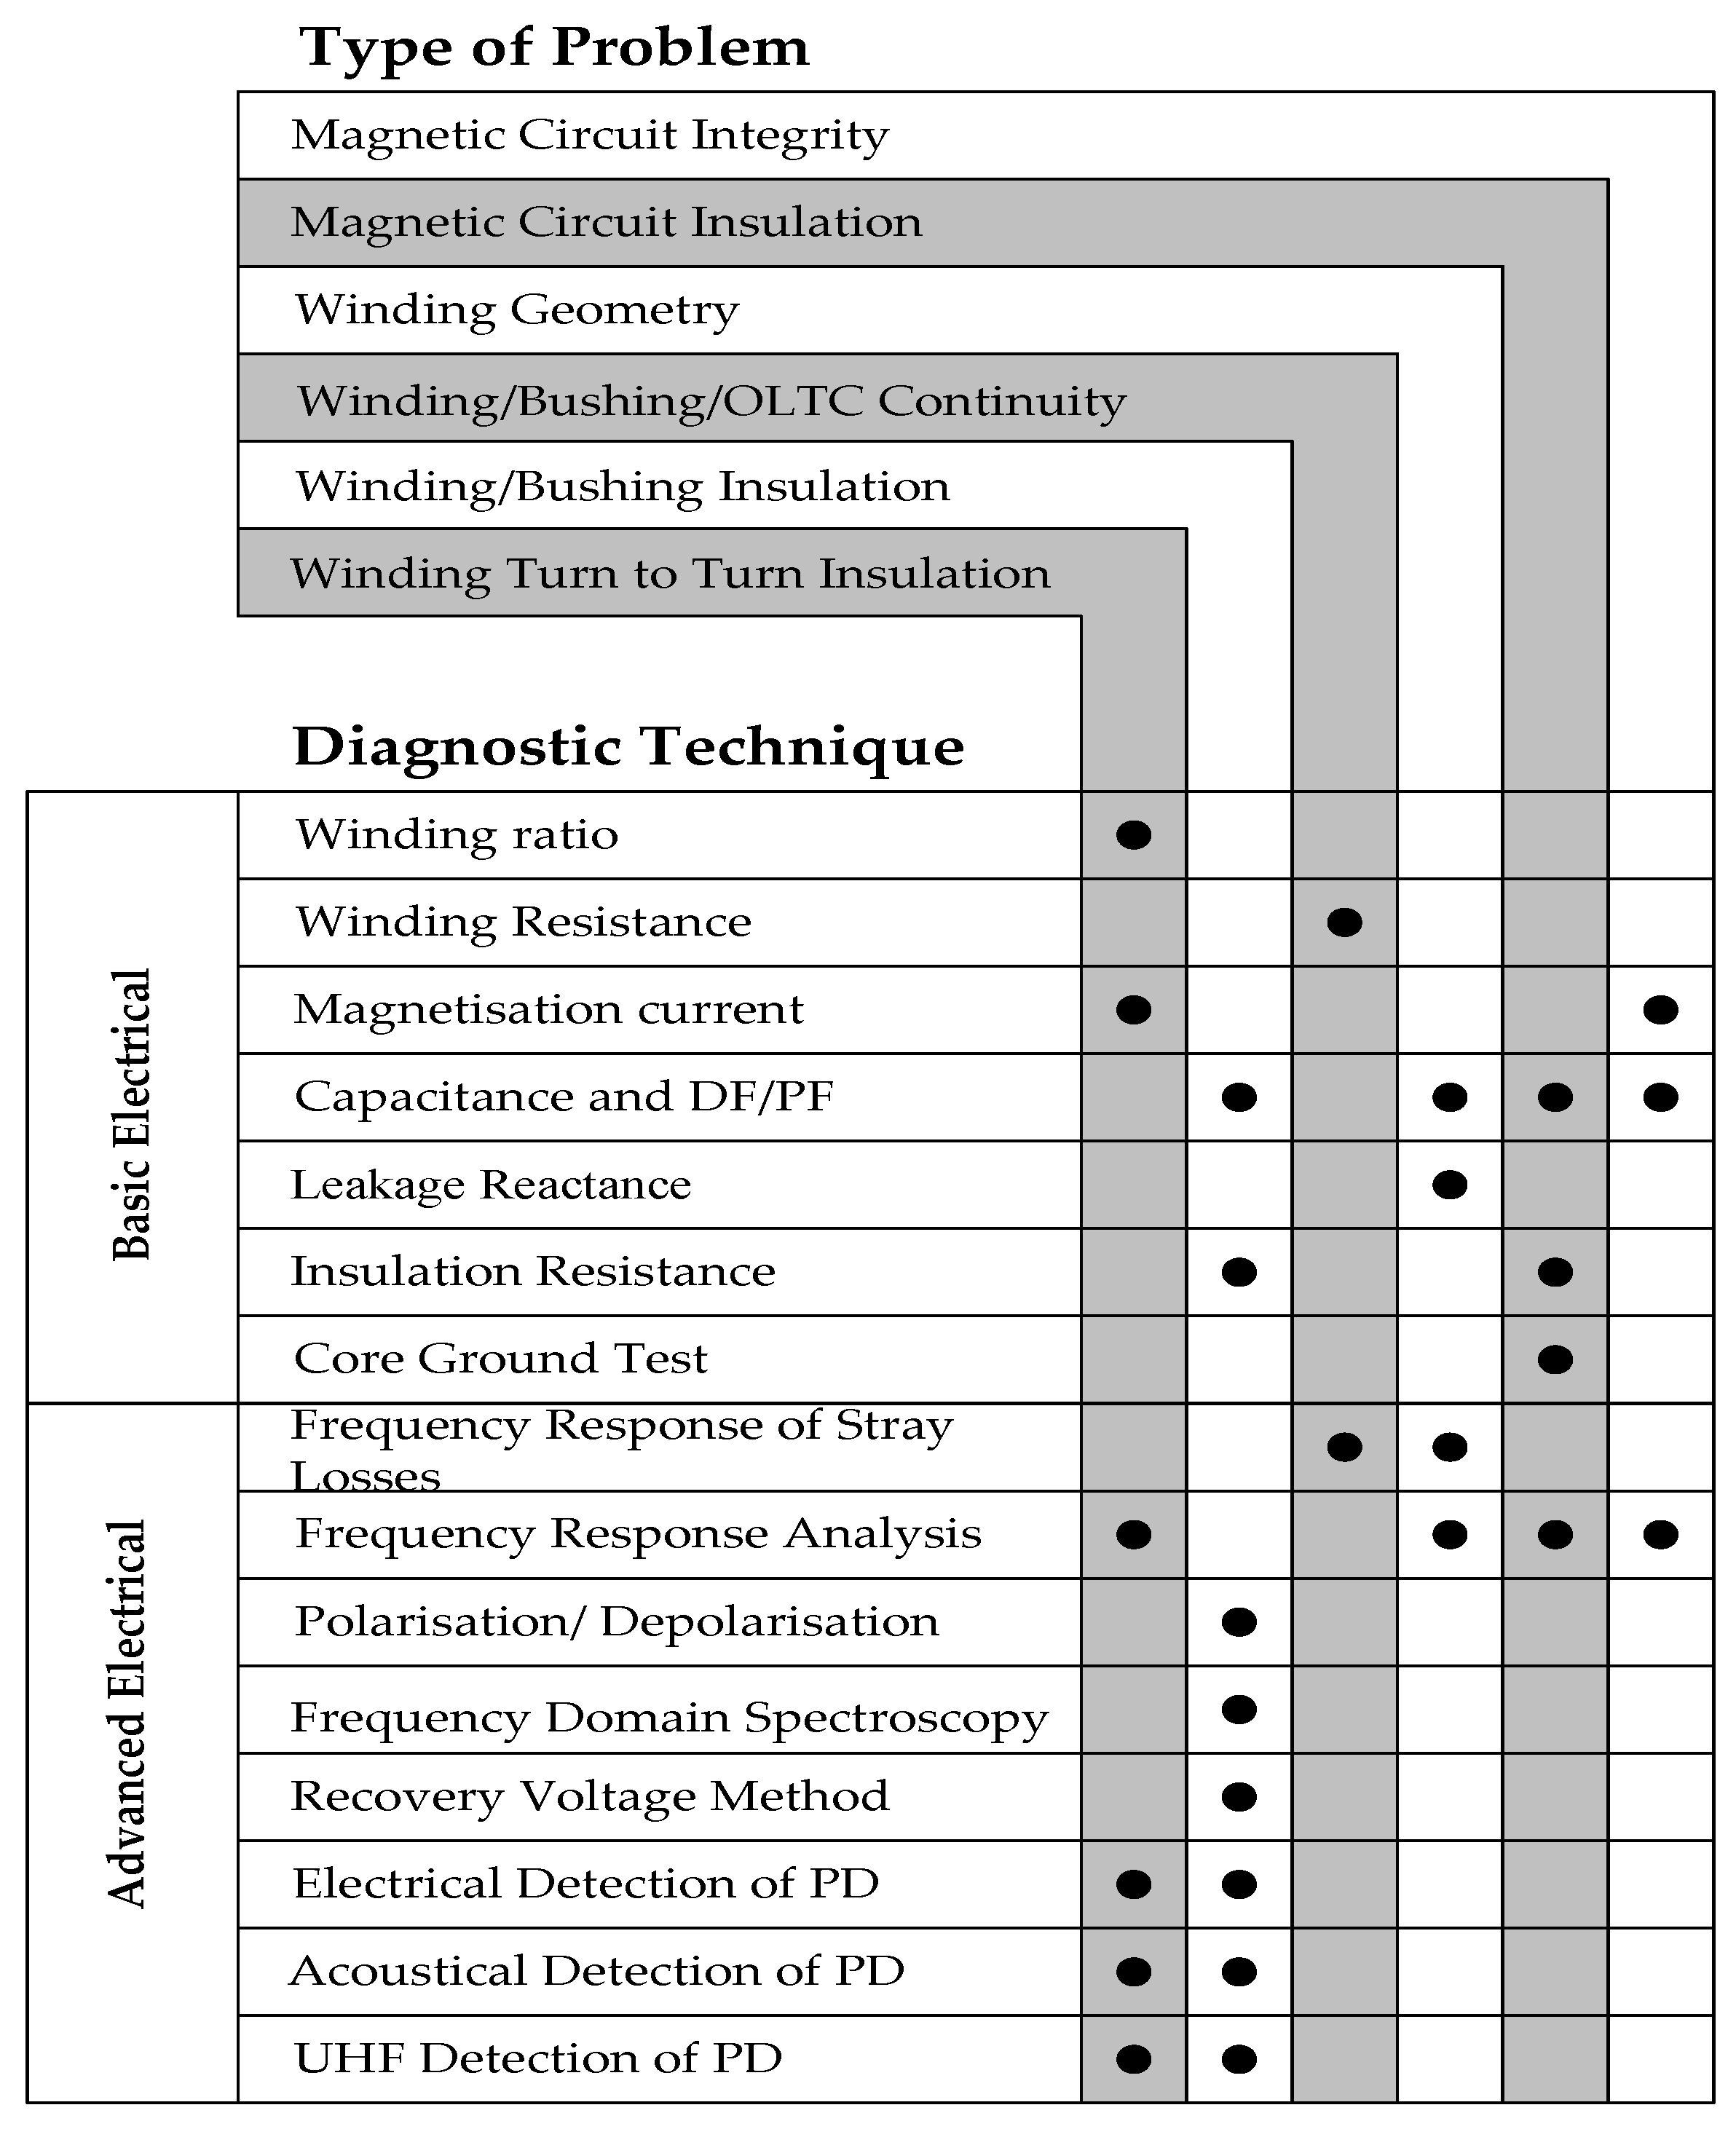
:1. Introduction
2. Traditional Electrical Diagnostic Techniques
2.1. Breakdown Strength
- Chemical makeup of the fluid;
- Temperature;
- Amount of contamination (impurities, moisture, etc.);
- Sampling and preparation conditions;
2.2. Static Electrification and Flow Electrification
2.3. Capacitance and Dielectric Dissipation Factor (or Power Factor)
- -
- contamination products such as moisture, carbon or other conducting matter, metal soaps caused by acids attacking transformer metals and oxidation byproducts; or
- -
- deterioration of the insulation system.
2.4. Ratio and Winding Resistance Measurements
2.5. Insulation Resistance, Polarisation Index and Core Ground Tests
2.6. Leakage Reactance and Magnetising Current
3. Advanced Electrical Diagnostic Techniques
3.1. Partial Discharge Detection Techniques
3.1.1. Electrical Detection of PDs
3.1.2. Acoustical and Optical Detection of PDs
3.1.3. Chemical Detection of PDs
3.2. Frequency Response Analysis
- (1)
- SFRA consisting in connecting a sinusoidal AC voltage with variable frequency (several Hz to several MHz) to each phase of the HV and the LV windings with all other windings unloaded. The input voltage (Uin) and the output voltage (Uout) are measured at different frequencies.
- (2)
- Impulse frequency response analysis (IFRA) consisting in injecting an impulse to each phase of the HV and the LV windings with all other windings unloaded. The input and output impulse curves of the windings are recorded. The time domain results are transformed into the frequency domain by using fast Fourier transform (FFT) algorithms. The Uin and the Uout are calculated for different frequencies.
3.3. Dielectric Response Analysis
- (1)
- Recovery voltage measurement (RVM), sometimes also called return voltage (RV) measurement;
- (2)
- Polarization and depolarisation current (PDC);
- (3)
- Frequency domain spectroscopy (FDS).
3.3.1. Polarization and Depolarization Current
3.3.2. Recovery Voltage Method
3.3.3. Frequency Domain Spectroscopy
3.3.4. PDC, RVM or FDS?
- -
- moisture determinations, as derived by the evaluation method used, were often much higher than values obtained by other methods such as Karl Fisher titration;
- -
- the recommended interpretation scheme is too simplistic;
- -
- the technique does not take into account dependencies on geometry and oil properties.
- -
- the dominant effect of moisture on most electrical properties;
- -
- the electrical properties of the oil impregnated paper and pressboard are probably more a complex function of oil and cellulose.
4. Online Condition Monitoring and Diagnosis for Power Transformers
5. Testing Suggestions/Recommendations
6. Conclusions
Author Contributions
Conflicts of Interest
Abbreviations
| CIGRE | International Council of Large Electric Systems |
| EDL | Electrical double layer |
| ECT | Electrostatic charging tendency |
| MST | Mini static tester |
| BTA | Benzotriazole |
| DLA | Dielectric loss angle |
| DDF | Dielectric dissipation factor |
| RVM | Recovery voltage measurement |
| RV | Recovery voltage |
| PDC | Polarization and depolarisation current |
| FDS | Frequency domain spectroscopy |
| DF | Dissipation factor |
| DFT | Digital Fourier transformation |
| PF | Power factor |
| IEEE | Institute of Electrical and Electronic Engineers |
| HV | High voltage |
| LV | Low voltage |
| IR | Insulation resistance |
| PI | Polarization index |
| FB | Frequency band |
| FRA | Frequency response analysis |
| FFA | Furfuraldehyde |
| SFRA | Sweep frequency response analysis |
| IFRA | Impulse frequency response analysis |
| TF | Transfer function |
| VF | Vector fitting |
| OLTC | On load tap changer |
| PD | Partial discharge |
| PRPD | Phase resolved partial discharge pattern |
| UHF | Ultra-high frequency |
| IEC | International Electrotechnical Commission |
| FFT | Fast Fourier transform |
| HFCT | High frequency current transformer |
| TTR | Transformer turn ratio |
References
- Fofana, I.; Sabau, J. Application of Petroleum-Based Oil in Power Transformer. In Natural Gas Research Progress; David, N., Michel, T., Eds.; Nova Science Publishers, Inc.: Hauppauge, NY, USA, 2008; pp. 229–251. [Google Scholar]
- Guide for Transformer Maintenance; CIGRE WG A2.34; CIGRE: Paris, France, 2011; Volume 445, pp. 51–61.
- N’Cho, J.S.; Fofana, I.; Hadjadj, Y.; Beroual, A. Review of the Physicochemical-Based Diagnostic Techniques for Assessing Insulation Condition in Aged Transformers. Energies 2016, 9, 367. [Google Scholar] [CrossRef]
- Sierota, A.; Rungis, J. Electrical Insulating Oils, Part 1 Characterization and Pre-Treatment of New Transformer Oils. IEEE Electr. Insul. Mag. 1995, 11, 8–20. [Google Scholar] [CrossRef]
- Standard for Insulating Liquids—Determination of the Breakdown Voltage at Power Frequency—Test Method; IEC 60156; International Electrotechnical Commission: Geneva, Switzerland, 1995.
- Standard Test Method for Dielectric Breakdown Voltage of Insulating Liquids Using VDE Electrodes; ASTM D1816-12; ASTM International: West Conshohocken, PA, USA, 2012; Volume 10.3.
- CIGRE Working Group A2-35. Experiences in Service with New Insulating Liquids; Cigré Report 436; CIGRE: Paris, France, 2010. [Google Scholar]
- Standard Test Method for Dielectric Breakdown Voltage of Insulating Liquids Using Disk Electrodes; ASTM D877/D877M-13; ASTM International: West Conshohocken, PA, USA, 2013.
- Crofts, D.W. The electrification phenomena in power transformers. IEEE Trans. Electr. Insul. 1988, 23, 137–146. [Google Scholar] [CrossRef]
- Johnson, D.L. Insulating Oil Qualification and Acceptance Tests from a User’s Perspective. In Electrical Insulating Oils; STP998; ASTM International: West Conshohocken, PA, USA, 1988. [Google Scholar]
- Zhang, J.; Cao, L.J. The study on flow electrification of oil-cellulose insulating system in large power transformer. In Proceedings of the 1995 International Conference on Energy Management and Power Delivery, Singapore, 21–23 November 1995; Volume 1, pp. 416–427.
- Mitchinson, P.M.; Lewin, P.L.; Strawbridge, B.D.; Jarman, P. Tracking and surface discharge at the oil—Pressboard interface. IEEE Electr. Insul. Mag. 2010, 26, 35–41. [Google Scholar] [CrossRef]
- Metwally, I.A. Influence of solid insulating phase on streaming electrification of transformer oil. IEEE Trans. Dielectr. Electr. Insul. 1997, 4, 327–340. [Google Scholar] [CrossRef]
- Mas, P.; Paillat, T.; Moreau, O.; Touchard, G. Flow electrification in power transformers: Temperature influence on space charge distribution and charge accumulation in pressboard. J. Electrost. 2001, 51–52, 488–493. [Google Scholar] [CrossRef]
- Poovamma, P.K.; Jagadish, R.; Dwarakanath, K. Investigation on static electrification characteristics of transformer oil. J. Electrost. 1994, 33, 1–14. [Google Scholar] [CrossRef]
- Lyon, D.J.; Melcher, J.R.; Zahn, M. Couette charger for measurement of equilibrium and energization flow electrification parameters: Application to transformer insulation. IEEE Trans. Electr. Insul. 1988, 23, 159–176. [Google Scholar] [CrossRef]
- Radwan, R.M.; El-Dewieny, R.M.; Aish, T.D.; Metwally, I.A.H. Factors affecting transformer oil flow electrification in electric power apparatus. In Proceedings of the Annual Report Conference on Electrical Insulation and Dielectric Phenomena, Pocono Manor, PA, USA, 28–31 October 1990; pp. 642–647.
- Bouslimi, Y.; Fofana, I.; Hemmatjou, H.; Volat, C. Static electrification assessment of transformer oils in the spinning disc system. In Proceedings of the 2010 International Conference on High Voltage Engineering and Application (ICHVE), New Orleans, LA, USA, 11–14 October 2010; pp. 337–340.
- Shimizu, S.; Murata, H.; Honda, M. Electrostatics in Power Transformers. IEEE Trans. Power Appar. Syst. 1979, PAS-98, 1244–1250. [Google Scholar] [CrossRef]
- Oommen, T.V.; Petrie, E.M. Eelectrostatic Charging Tendency of Transformer Oils. IEEE Trans. Power Appar. Syst. 1984, PAS-103, 1923–1931. [Google Scholar] [CrossRef]
- Tanaka, T.; Yamada, N.; Yasojima, Y. Characteristics of streaming electrification in pressboard pipe and the influence of an external electric field. J. Electrost. 1985, 17, 215–234. [Google Scholar] [CrossRef]
- Higaki, M.; Kako, Y.; Moriyama, M.; Hirano, M.; Hiraishi, K.; Kurita, K. Static Electrification and Partial Discharges Caused by Oil Flow in Forced Oil Cooled Core Type Transformers. IEEE Trans. Power Appar. Syst. 1979, PAS-98, 1259–1267. [Google Scholar] [CrossRef]
- Okabe, S.; Kohtoh, M.; Amimoto, T. Investigation of electrostatic charging mechanism in aged oil-immersed transformers. IEEE Trans. Dielectr. Electr. Insul. 2010, 17, 287–293. [Google Scholar] [CrossRef]
- Okabe, S.; Kohtoh, M.; Amimoto, T. Diagnosis on increase in electrostatic charging tendency of mineral insulating oil for power transformers due to aging. IEEE Trans. Dielectr. Electr. Insul. 2010, 17, 953–963. [Google Scholar] [CrossRef]
- Kanno, M.; Oota, N.; Suzuki, T.; Ishii, T. Changes in ECT and dielectric dissipation factor of insulating oils due to aging in oxygen. IEEE Trans. Dielectr. Electr. Insul. 2001, 8, 1048–1053. [Google Scholar] [CrossRef]
- Fofana, I.; Bouslimi, Y.; Hemmatjou, H.; Volat, C.; Tahiri, K. Relationship between static electrification of transformer oils with turbidity and spectrophotometry measurements. Int. J. Electr. Power Energy Syst. 2014, 54, 38–44. [Google Scholar] [CrossRef]
- Talhi, M.; Fofana, I.; Flazi, S. Impact of various stresses on the streaming electrification of transformer oil. J. Electrost. 2016, 79, 25–32. [Google Scholar] [CrossRef]
- Oommen, T.V. Static electrification properties of transformer oil. IEEE Trans. Electr. Insul. 1988, 23, 123–128. [Google Scholar] [CrossRef]
- Bourgeois, A. Study of Flow Electrification Phenomena on High Power Transformers Pressboards. Ph.D. Thesis, Institut National Polytechnique de Grenoble—INPG, Grenoble, France, 2007. [Google Scholar]
- Isaka, S.; Miyao, H.; Tsuchie, M.; Kobayashi, S.; Kobayashi, T.; Ono, T.; Ikeda, M.; Okubo, H. Investigation for standardization of electrostatic charging tendency measurement of transformer oil in Japan. In Proceedings of the 1999 IEEE 13th International Conference on Dielectric Liquids (ICDL '99), Nara, Japan, 20–25 July 1999; pp. 495–498.
- Washabaugh, A.P.; Zahn, M. Flow electrification measurements of transformer insulation using a Couette flow facility. IEEE Trans. Dielectr. Electr. Insul. 1996, 3, 161–181. [Google Scholar] [CrossRef]
- Kedzia, J. Investigation of transformer oil electrification in a spinning disk system. IEEE Trans. Dielectr. Electr. Insul. 1989, 24, 59–65. [Google Scholar] [CrossRef]
- Static Electrification in Power Transformers; Gernaral Session, paper CE/SC 15/12-03; CIGRE: Paris, France, 1992.
- Zelu, Y.; Paillat, T.; Morin, G.; Perrier, C.; Saravolac, M. Study on flow electrification hazards with ester oils. In Proceedings of the 2011 IEEE International Conference on Dielectric Liquids (ICDL), Trondheim, Norway, 26–30 June 2011; pp. 1–4.
- Kobayashi, T.; Yajima, K.; Yamada, S.; Amimoto, T.; Hosokawa, N. Increase of static electrification in an aged oil-immersed transformer. Electr. Eng. Jpn. 2009, 167, 10–19. [Google Scholar] [CrossRef]
- Ieda, M.; Okugo, H.; Tsukioka, H.; Goto, K.; Miyamoto, T.; Kohno, Y. Suppression of static electrification of insulating oil for large power transformers. IEEE Trans. Dielectr. Electr. Insul. 1988, 23, 153–157. [Google Scholar] [CrossRef]
- Okabe, S.; Kohtoh, M.; Amimoto, T. Suppression of increase in electrostatic charging tendency of insulating oil by aging used for power transformer insulation. IEEE Trans. Dielectr. Electr. Insul. 2010, 17, 294–301. [Google Scholar] [CrossRef]
- Kawamura, T.K.T.; Amimoto, T.; Murakami, H.; Shirasaka, Y.; Ebisawa, Y. Failure Modes of Oil-Immersed Transformers Due to Static Electrification and Copper Sulphide Generation, and Suppressive Effect of BTA; CIGRE A2-206; CIGRE: Paris, France, 2008. [Google Scholar]
- Paillat, T.; Touchard, G.; Bertrand, Y. “Capacitive Sensor” to Measure Flow Electrification and Prevent Electrostatic Hazards. Sensors 2012, 12, 14315–14326. [Google Scholar] [CrossRef] [PubMed]
- Setayeshmehr, A.; Akbari, A.; Borsi, H.; Gockenbach, E. On-line monitoring and diagnoses of power transformer bushings. IEEE Trans. Dielectr. Electr. Insul. 2006, 13, 608–615. [Google Scholar] [CrossRef]
- Riendeau, S.; Picher, P.; Léonard, F.; Gauvin, M.; Bertrand, H. On-line monitoring of transformer bushings using a new decentralized measurement system. In Proceedings of the Conference Record of the 2010 IEEE International Symposium on Electrical Insulation (ISEI), San Diego, CA, USA, 6–9 June 2010; pp. 1–5.
- Reference Book on Insulating Liquids and Gases (RBILG) 391; Doble Engineering Company: Boston, MA, USA, 1993.
- IEEE Guide for the Reclamation of Insulating Oil and Criteria for Its Use; IEEE Std C57.637-2015 (Revision of IEEE Std 637-1985); IEEE Standards Association: Piscataway, NJ, USA, 1985.
- Transformer Diagnostics. In Facilities Instructions, Standards, and Techniques (FIST); Volume 3-31; United States Department of the Interior, Bureau of Reclamation: Washington, DC, USA, 2003; pp. 1–63.
- IEEE Standard Test Code for Liquid-Immersed Distribution, Power, and Regulating Transformers; IEEE Std C57.12.90-2010 (Revision of IEEE Std C57.12.90-2006); IEEE Standards Association: Piscataway, NJ, USA, 2010; pp. 1–100.
- Winders, J. Power Transformers: Principles and Applications; CRC press: Boca Raton, FL, USA, 2002. [Google Scholar]
- Wang, M.; Vandermaar, A.J.; Srivastava, K.D. Review of condition assessment of power transformers in service. IEEE Electr. Insul. Mag. 2002, 18, 12–25. [Google Scholar] [CrossRef]
- IEEE Standard Test Code for Liquid-Immersed Distribution, Power, and Regulating Transformers and IEEE Guide for Short-Circuit Testing of Distribution and Power Transformers; ANSI/IEEE Std C57.12.90-1987; IEEE Standards Association: Piscataway, NJ, USA, 1988; p. 0_1.
- Harlow, J.H. Electric Power Transformer Engineering, 3rd ed.; CRC Press: Boca Raton, FL, USA, 2012. [Google Scholar]
- Supatra, A.B. The latest on-site non-destructive technique for insulation analysis of electrical power apparatus. In Proceedings of the the 2004 Weidmann-ACTI Annual Technical Conference, Sacramento, CA, USA, 8–10 November 2004.
- Fofana, I.; Hemmatjou, H.; Farzaneh, M. Low Temperature and Moisture Effects on Polarization and Depolarization Currents of Oil-Paper Insulation. Electr. Power Syst. Res. 2010, 80, 91–97. [Google Scholar] [CrossRef]
- Recommended Practice for Insulation Testing (2300 V and Above) with High Direct Voltage; IEEE Std 95-2002; IEEE Standards Association: Piscataway, NJ, USA, 2002.
- Methods of Test for Volume Resistivity and Surface Resistivity of Solid Electrical Insulating Materials; IEC 60093; International Electrotechnical Commission: Geneva, Switzerland, 1980.
- White, J. Transformers core—A different path to maintaining insulation systems. Electr. Today 2013, 26, 42–44. [Google Scholar]
- IEC 60270. High-Voltage Test Techniques—Partial Discharge Measurements, 3rd ed.; International Electrotechnical Commission: Geneva, Switzerland, 2000. [Google Scholar]
- Wu, M.; Cao, H.; Cao, J.; Nguyen, H.-L.; Gomes, J.B.; Krishnaswamy, S.P. An overview of state-of-the-art partial discharge analysis techniques for condition monitoring. Electr. Insul. Mag. IEEE 2015, 31, 22–35. [Google Scholar] [CrossRef]
- Fuhr, J. Procedure for identification and localization of dangerous PD sources in power transformers. IEEE Trans. Dielectr. Electr. Insul. 2005, 12, 1005–1014. [Google Scholar] [CrossRef]
- Raymond, W.J.K.; Illias, H.A.; Bakar, A.H.A.; Mokhlis, H. Partial discharge classifications: Review of recent progress. Measurement 2015, 68, 164–181. [Google Scholar] [CrossRef]
- Sokolov, V.; Mayakov, V.; Kuchinsky, G.; Golubev, A. On-Site Partial Discharge Measurement of Transformers. Available online: http://es.eaton.com/InsulGardSalesTool/Documentation/PD%20Transformer.pdf (accessed on 23 August 2016).
- Feilat, E.A.; Metwally, I.A.; Al-Matri, S.; Al-Abri, A.S. Analysis of the Root Causes of Transformer Bushing Failures. Int. J. Comput. Electr. Autom. Control Inf. Eng. 2013, 7, 791–796. [Google Scholar]
- Yaacob, M.; Alsaedi, M.; Rashed, J.; Dakhil, A.; Atyah, S. Review on partial discharge detection techniques related to high voltage power equipment using different sensors. Photonic Sens. 2014, 4, 325–337. [Google Scholar] [CrossRef]
- Morshuis, P.H.F. Degradation of solid dielectrics due to internal partial discharge: Some thoughts on progress made and where to go now. IEEE Trans. Dielectr. Electr. Insul. 2005, 12, 905–913. [Google Scholar] [CrossRef]
- Stone, G.C. Partial discharge diagnostics and electrical equipment insulation condition assessment. IEEE Trans. Dielectr. Electr. Insul. 2005, 12, 891–904. [Google Scholar] [CrossRef]
- Niasar, M.G. Partial Discharge Signatures of Defects in Insulation Systems Consisting of Oil and Oil-impregnated Paper. Licentiate Thesis, KTH School of Electrical Engineering, Stockholm, Sweden, 2012. [Google Scholar]
- Álvarez, F.; Garnacho, F.; Ortego, J.; Sánchez-Urán, M. Application of HFCT and UHF Sensors in On-Line Partial Discharge Measurements for Insulation Diagnosis of High Voltage Equipment. Sensors 2015, 15, 7360–7387. [Google Scholar] [CrossRef] [PubMed]
- Schwarz, R.; Judendorfer, T.; Muhr, M. Review of Partial Discharge Monitoring techniques used in High Voltage Equipment. In Proceedings of the 2008 Annual Report Conference on Electrical Insulation and Dielectric Phenomena (CEIDP 2008), Quebec, QC, Canada, 26–29 October 2008; pp. 400–403.
- Gautschi, D.; Weiers, T.; Buchs, G.; Wyss, S. Ultra High Frequency (UHF) Partial Discharge Detection for Power Transformers: Sensitivity Check on 800 MVA Power Transformers and First Field Experience; CIGRE A2-115; CIGRE: Paris, France, 2012. [Google Scholar]
- Partial Discharge Detection System for GIS: Sensitivity Verification for the UHF Method and the Acoustic Method; CIGRE Task Force 15/33.03.05; ÉLECTRA No. 183; CIGRE: Paris, France; pp. 74–87.
- Stone, G.C. Partial discharge. VII. Practical techniques for measuring PD in operating equipment. IEEE Electr. Insul. Mag. 1991, 7, 9–19. [Google Scholar] [CrossRef]
- Judd, M.D.; Li, Y.; Hunter, I.B.B. Partial discharge monitoring for power transformer using UHF sensors. Part 2: Field experience. IEEE Electr. Insul. Mag. 2005, 21, 5–13. [Google Scholar] [CrossRef]
- Judd, M.D.; Li, Y.; Hunter, I.B.B. Partial discharge monitoring of power transformers using UHF sensors. Part I: Sensors and signal interpretation. IEEE Electr. Insul. Mag. 2005, 21, 5–14. [Google Scholar] [CrossRef]
- Tenbohlen, S.; Denissov, D.; Hoek, S.M.; Markalous, S.M. Partial discharge measurement in the ultra high frequency (UHF) range. IEEE Trans. Dielectr. Electr. Insul. 2008, 15, 1544–1552. [Google Scholar] [CrossRef]
- Coenen, S.; Tenbohlen, S.; Markalous, S.M.; Strehl, T. Sensitivity of UHF PD measurements in power transformers. IEEE Trans. Dielectr. Electr. Insul. 2008, 15, 1553–1558. [Google Scholar] [CrossRef]
- Coenen, S.; Tenbohlen, S.; Markalous, S.M.; Strehl, T. Attenuation of UHF signals regarding the sensitivity verification for UHF PD measurements on power transformers. In Proceedings of the International Conference on Condition Monitoring and Diagnosis (CMD 2008), Beijing, China, 21–24 April 2008; pp. 1036–1039.
- Su, C.Q. Electromagnetic Transients in Transformer and Rotating Machine Windings; IGI Global: Hershey, PA, USA, 2012. [Google Scholar]
- Coenen, S.; Tenbohlen, S. Location of PD sources in power transformers by UHF and acoustic measurements. IEEE Trans. Dielectr. Electr. Insul. 2012, 19, 1934–1940. [Google Scholar] [CrossRef]
- Judd, M.D. Experience with UHF partial discharge detection and location in power transformers. In Proceedings of the Electrical Insulation Conference (EIC), Annapolis, MD, USA, 5–8 June 2011; pp. 201–205.
- Lazarevich, A.K. Partial Discharge Detection and Localization in High Voltage Transformers Using an Optical Acoustic Sensor. Master’s Thesis, Faculty of the Virginia Polytechnic Institute and State University Blacksburg, VA, USA, 2003. [Google Scholar]
- Lundgaard, L.E. Partial Discharge. XIII. Acoustic Partial Discharge Detection-Fundamental Considerations. IEEE Electr. Insul. Mag. 1992, 8, 25–31. [Google Scholar] [CrossRef]
- Harrold, R.T. Acoustical Technology Applications in Electrical Insulation and Dielectrics. IEEE Trans. Electr. Insul. 1985, EI-20, 3–19. [Google Scholar] [CrossRef]
- Harrold, R.T. Acoustic Waveguides for Sensing and Locating Electrical Discharges in High Voltage Power Transformers and Other Apparatus. IEEE Trans. Power Appar. Syst. 1979, PAS-98, 449–457. [Google Scholar] [CrossRef]
- Liu, H.-L. Acoustic partial discharge localization methodology in power transformers employing the quantum genetic algorithm. Appl. Acoust. 2016, 102, 71–78. [Google Scholar] [CrossRef]
- Markalous, S.; Tenbohlen, S.; Feser, K. Detection and location of partial discharges in power transformers using acoustic and electromagnetic signals. IEEE Trans. Dielectr. Electr. Insul. 2008, 15, 1576–1583. [Google Scholar] [CrossRef]
- Veloso, G.F.C.; da Silva, L.E.B.; Lambert-Torres, G.; Pinto, J.O.P. Localization of Partial Discharges in Transformers by the Analysis of the Acoustic Emission. In Proceedings of the 2006 IEEE International Symposium on Industrial Electronics, Montreal, QC, Canada, 9–13 June 2006; pp. 537–541.
- Muhr, M.; Strehl, T.; Gulski, E.; Feser, K.; Gockenbach, E.; Hauschild, W.; Lemke, E. Sensors and Sensing Used for Non-Conventional PD Detection; CIGRE Working Group: Paris, France, 2006; Volume D1-102. [Google Scholar]
- Hekmati, A. A novel acoustic method of partial discharge allocation considering structure-borne waves. Int. J. Electr. Power Energy Syst. 2016, 77, 250–255. [Google Scholar] [CrossRef]
- Hekmati, A. Proposed method of partial discharge allocation with acoustic emission sensors within power transformers. Appl. Acoust. 2015, 100, 26–33. [Google Scholar] [CrossRef]
- Danouj, B.; Tahan, A.A.; David, E. Using a new generation of piezoelectric sensors for partial discharge detection. Measurement 2013, 46, 660–666. [Google Scholar] [CrossRef]
- Posada-Roman, J.; Garcia-Souto, J.A.; Rubio-Serrano, J. Fiber Optic Sensor for Acoustic Detection of Partial Discharges in Oil-Paper Insulated Electrical Systems. Sensors 2012, 12, 4793–4802. [Google Scholar] [CrossRef] [PubMed]
- Wang, X.; Li, B.; Roman, H.T.; Russo, O.L.; Chin, K.; Farmer, K.R. Acousto-optical PD detection for transformers. IEEE Trans. Power Deliv. 2006, 21, 1068–1073. [Google Scholar] [CrossRef]
- MacAlpine, M.; Zhao, Z.; Demokan, M.S. Development of a fibre-optic sensor for partial discharges in oil-filled power transformers. Electr. Power Syst. Res. 2002, 63, 27–36. [Google Scholar] [CrossRef]
- Deng, J.; Xiao, H.; Huo, W.; Luo, M.; May, R.; Wang, A.; Liu, Y. Optical fiber sensor-based detection of partial discharges in power transformers. Optics Laser Technol. 2001, 33, 305–311. [Google Scholar] [CrossRef]
- Yin, S.; Ruffin, P.B.; Yu, F.T.S. Fiber Optic Sensors, 2nd ed.; CRC Press: Boca Raton, FL, USA, 2008. [Google Scholar]
- Chakravorti, S.; Dey, D.; Chatterjee, B. Recent Trends in the Condition Monitoring of Transformers: Theory, Implementation and Analysis; Springer: London, UK, 2013. [Google Scholar]
- Bakar, N.A.; Abu-Siada, A.; Islam, S. A review of dissolved gas analysis measurement and interpretation techniques. IEEE Electr. Insul. Mag. 2014, 30, 39–49. [Google Scholar] [CrossRef]
- Duval, M.; de Pabla, A. Interpretation of gas-in-oil analysis using new IEC publication 60599 and IEC TC 10 databases. IEEE Electr. Insul. Mag. 2001, 17, 31–41. [Google Scholar] [CrossRef]
- Frequency Response Analysis on Winding Deformation of Power Transformers; DL/T 911-2004; National Development and Reform Commission of the People’s Republic of China: Beijing, China, 2005.
- Cigré WG A2/26. Mechanical condition assessment of transformer windings using Frequency Response Analysis (FRA); CIGRE: Paris, France, 2008. [Google Scholar]
- Power Transformers -Part 18: Measurement of Frequency Response; IEC 60076-18; International Electrotechnical Commission: Geneva, Switzerland, 2012.
- IEEE Guide for the Application and Interpretation of Frequency Response Analysis for Oil-Immersed Transformers; IEEE Std C57.149; IEEE Standards Association: Piscataway, NJ, USA, 2012.
- The Short-Circuit Performance of Power Transformers; CIGRE WG 12.19; CIGRE Technical Brochure 209; CIGRE: Paris, France, 2002.
- Sweetser, C.; McGrail, T. Sweep Frequency Response Analysis Transformer Applications; Doble Engineering Company: Watertown, MA, USA, 2003. [Google Scholar]
- Mechanical-Condition Assessment of Transformer Windings Using Frequency Response Analysis (ERA); CIGRE WG A2.26.; CIGRE Report 342; CIGRE: Paris, France, 2008.
- Bagheri, M.; Phung, B.T.; Blackburn, T. Influence of temperature and moisture content on frequency response analysis of transformer winding. IEEE Trans. Dielectr. Electr. Insul. 2014, 21, 1393–1404. [Google Scholar] [CrossRef]
- Karimifard, P.; Gharehpetian, G.B.; Tenhohlen, S. Localization of winding radial deformation and determination of deformation extend using vector fitting-based estimated transfer function. Eur. Trans. Electr. Power 2009, 19, 749–762. [Google Scholar] [CrossRef]
- Mohamed, Y.R.; Meghnefi, F.; Fofana, I. Frequency Response Analyses via Rational Function Fitting. In Proceedings of the 2012 IEEE Annual Conference on Electrical Insulation and Dielectric Phenomena (CEIDP), Montreal, QC, Canada, 14–17 October 2012.
- Bigdeli, M.; Vakilian, M.; Rahimpour, E. A New Method for Detection and Evaluation of Winding Mechanical Faults in Transformer through Transfer Function Measurements. Adv. Electr. Comput. Eng. 2011, 11, 23–30. [Google Scholar] [CrossRef]
- Behjat, V.; Vahedi, A.; Setayeshmehr, A.; Borsi, H.; Gockenbach, E. Diagnosing Shorted Turns on the Windings of Power Transformers Based Upon Online FRA Using Capacitive and Inductive Couplings. IEEE Trans. Power Deliv. 2011, 26, 2123–2133. [Google Scholar] [CrossRef]
- Jonscher, K. Dielectric Polarisation/Depolarisation in Solids; Chelsea Dielectric Press: London, UK, 1984. [Google Scholar]
- Zaengl, W.S. Application of Dielectric Spectroscopy in Time and Frequency Domain for HV Power Equipment. IEEE Electr. Insul. Mag. 2003, 19, 9–22. [Google Scholar] [CrossRef]
- CIGRE Task Force 15.01.09. Dielectric Response Methods for Diagnostics of Power Transformers; Cigre brochure 254, Electra 202; CIGRE: Paris, France, 2003; pp. 25–36. [Google Scholar]
- Saha, T.K. Review of Modern Diagnostic Techniques for Assessing Insulation Condition in Aged Transformers. IEEE Trans. Dielectr. Electr. Insul. 2003, 10, 903–917. [Google Scholar] [CrossRef]
- Zaengl, W.S. Dielectric Spectroscopy in Time and Frequency Domain for HV Power Equipment, Part I: Theoretical Considerations. IEEE Electr. Insul. Mag. 2003, 19, 5–19. [Google Scholar] [CrossRef]
- Seytashmehr, A.; Fofana, I.; Eichler, C.; Akbari, A.; Borsi, H.; Gockenbach, E. Dielectric Spectroscopic Measurements on Transformer Oil-Paper Insulation under Controlled Laboratory Conditions. IEEE Trans. Dielectr. Electr. Insul. 2008, 15, 1100–1111. [Google Scholar] [CrossRef]
- Fofana, I.; Hemmatjou, H.; Meghnefi, F. Effect of Thermal Transient on the Polarization and Depolarization Current Measurements of Oil-Paper Insulation. IEEE Trans. Dielectr. Electr. Insul. 2011, 18, 513–520. [Google Scholar] [CrossRef]
- Liao, R.; Hao, J.; Chen, G.; Yang, L. Quantitative analysis of ageing condition of oil-paper insulation by frequency domain spectroscopy. IEEE Trans. Dielectr. Electr. Insul. 2012, 19, 821–830. [Google Scholar] [CrossRef]
- Suriyah-Jaya, M.; Leibfried, T. Accelerating Dielectric Response Measurements on Power Transformers—Part II: A Regression Approach. IEEE Trans. Power Deliv. 2014, 29, 2095–2100. [Google Scholar] [CrossRef]
- Yousof, M.F.M.; Ekanayake, C.; Saha, T.K. Examining the ageing of transformer insulation using FRA and FDS techniques. IEEE Trans. Dielectr. Electr. Insul. 2015, 22, 1258–1265. [Google Scholar] [CrossRef]
- Blennow, J.; Ekanayake, C.; Walczak, K.; Garcia, B.; Gubanski, S.M. Field experiences with measurements of dielectric response in frequency domain for power transformer diagnostics. IEEE Trans. Power Deliv. 2006, 21, 681–688. [Google Scholar] [CrossRef]
- Pradhan, M.K.; Yew, K.J.H. Experimental investigation of insulation parameters affecting power transformer condition assessment using frequency domain spectroscopy. IEEE Trans. Dielectr. Electr. Insul. 2012, 19, 1851–1859. [Google Scholar] [CrossRef]
- Van Bolhuis, P. Applicability of Recovery Voltage and on-line Partial Discharge Measurements for Condition Assessment of High Voltage Power Transformers; Optima Grafische Communicatie: Rotterdam, The Netherlands, 2002; pp. 105–153. [Google Scholar]
- Kachler, A.J.; Baehr, R.; Zaengl, W.S.; Breitenbauch, B.; Sundermann, U. Kritische Anmerkungen zur Feuchtigkeitsbestimmung von Transformatoren mit der “Recovery-Voltage-Methode”. Elektrizitätswirtschaft 1996, 95, 1238–1245. (In German) [Google Scholar]
- Kachler, A.J. Ageing and Moisture Determination in Power Transformer Insulation Systems. Contradiction of RVM Methodology, Effects of Geometry and Ion Conductivity. In Proceedings of the 2nd International Workshop on Transformers, Lodz, Poland, 24–27 November 1999.
- Saha, T.K.; Purkait, P. Investigations of temperature effects on the dielectric response measurements of transformer oil-paper insulation system. IEEE Trans. Power Deliv. 2008, 23, 252–260. [Google Scholar] [CrossRef]
- Jaya, M.; Geißler, D.; Leibfried, T. Accelerating dielectric response measurements on power transformers—Part I: A frequency domain approach. IEEE Trans. Power Deliv. 2013, 28, 1469–1473. [Google Scholar] [CrossRef]
- Jaya, M.; Leibfried, T. Accelerating Dielectric Response Measurements on Power Transformers—Part II: A Regression Approach. IEEE Trans. Power Deliv. 2014, 29, 2095–2100. [Google Scholar] [CrossRef]
- Shayegani, A.A.; Gockenbach, E.; Borsi, H.; Mohseni, H. Investigation on the transformation of time domain spectroscopy data to frequency domain data for impregnated pressboard to reduce measurement time. Electr. Eng. 2006, 89, 11–20. [Google Scholar] [CrossRef]
- Farahani, M.; Borsi, H.; Gockenbach, E. Dielectric Response Studies on Insulating System of High Voltage Rotating Machines. IEEE Trans. Dielectr. Electr. Insul. 2006, 13, 383–393. [Google Scholar] [CrossRef]
- Birlasekaran, S.; Yu, X. Relaxation Studies on Power Equipment. IEEE Trans. Dielectr. Electr. Insul. 2003, 10, 1061–1077. [Google Scholar] [CrossRef]
- Dong, M.; Ren, M.; Wen, F.; Zhang, C.; Liu, J.; Sumereder, C.; Muhr, M. Explanation and analysis of oil-paper insulation based on frequency-domain dielectric spectroscopy. IEEE Trans. Dielectr. Electr. Insul. 2015, 22, 2684–2693. [Google Scholar]
- Hadjadj, Y.; Meghnefi, F.; Fofana, I.; Ezzaidi, H. On the Feasibility of Using Poles Computed from Frequency Domain Spectroscopy to Assess Oil Impregnated Paper Insulation Conditions. Energies 2013, 6, 2204–2220. [Google Scholar] [CrossRef]
- Saha, T.K.; Purkait, P. Understanding the impacts of moisture and thermal aging on transformer’s insulation by dielectric response and molecular weight measurements. IEEE Trans. Dielectr. Electr. Insul. 2008, 15, 568–582. [Google Scholar] [CrossRef]
- Yao, Z.T.; Saha, T.K. Separation of Ageing and Moisture Impacts on Transformer Insulation Degradation by Polarisation Measurements; CIGRE: Paris, France, 2002; pp. 15–304. [Google Scholar]
- Betie, A.; Meghnefi, F.; Fofana, I.; Yeo, Z.; Ezzaidi, H. Neural network approach to separate aging and moisture from the dielectric response of oil impregnated paper insulation. IEEE Trans. Dielectr. Electr. Insul. 2015, 22, 2176–2184. [Google Scholar] [CrossRef]
- Tang, W.H.; Wu, Q.H. Condition Monitoring and Assessment of Power Transformers Using Computational Intelligence; Springer: London, UK, 2011. [Google Scholar]
- Tenbohlen, S.; Stirl, T.; Bastos, G.; Baldauf, J.; Mayer, P.; Stach, M.; Breitenbauch, B.; Huber, R. Experience-Based Evaluation of Economic Benefits of On-line Monitoring Systems for Power Transformers; CIGRE Session 2002; Paris, France, 2002; pp. 12–110. [Google Scholar]
- CIGRE WG 12.18 Life Management of Transformers. Guidelines for Life Management Techniques for Power Transformers. Draft Final Report Rev. 2, 22 June 2002. Available online: http://www.buenomak.com.br/publicacoes/pdf/TRANSFdePOTEN-2002_life_management_techniques.pdf (accessed on 9 May 2016).


| Components | Nature of the Defect or Fault | |||
|---|---|---|---|---|
| Thermal (T) | Dielectric (D) | Mechanical (M) | Contamination or aging (C) | |
| Bushing (B) |
|
|
|
|
| Core (C) |
| - |
| - |
| Driver, Tap changer (D) |
| - |
|
|
| Oil (O) |
|
| - |
|
| Selector (S) |
| - |
|
|
| Tank and accessories (T) |
| - |
|
|
| Winding, major insulation and leads (W) |
|
|
|
|
© 2016 by the authors; licensee MDPI, Basel, Switzerland. This article is an open access article distributed under the terms and conditions of the Creative Commons Attribution (CC-BY) license (http://creativecommons.org/licenses/by/4.0/).
Share and Cite
Fofana, I.; Hadjadj, Y. Electrical-Based Diagnostic Techniques for Assessing Insulation Condition in Aged Transformers. Energies 2016, 9, 679. https://doi.org/10.3390/en9090679
Fofana I, Hadjadj Y. Electrical-Based Diagnostic Techniques for Assessing Insulation Condition in Aged Transformers. Energies. 2016; 9(9):679. https://doi.org/10.3390/en9090679
Chicago/Turabian StyleFofana, Issouf, and Yazid Hadjadj. 2016. "Electrical-Based Diagnostic Techniques for Assessing Insulation Condition in Aged Transformers" Energies 9, no. 9: 679. https://doi.org/10.3390/en9090679