Article

Optimal Isolation Control of Three-Port Active Converters as a Combined Charger for Electric Vehicles

School of Electrical Engineering, Shandong University, 17923 Jingshi Road, Jinan 250061, Shandong, China
*
Author to whom correspondence should be addressed.
Energies 2016, 9(9), 715; https://doi.org/10.3390/en9090715
Submission received: 31 May 2016 / Revised: 16 August 2016 / Accepted: 30 August 2016 / Published: 6 September 2016

Abstract

:
The three-port converter has three H-bridge ports that can interface with three different energy sources and offers the advantages of flexible power transmission, galvanic isolation ability and high power density. The three-port full-bridge converter can be used in electric vehicles as a combined charger that consists of a battery charger and a DC-DC converter. Power transfer occurs between two ports while the third port is isolated, i.e., the average power is zero. The purpose of this paper is to apply an optimal phase shift strategy in isolation control and provide a detailed comparison between traditional phase shift control and optimal phase shift control under the proposed isolation control scheme, including comparison of the zero-voltage-switching range and the root mean square current for the two methods. Based on this analysis, the optimal parameters are selected. The results of simulations and experiments are given to verify the advantages of dual-phase-shift control in isolation control.

1. Introduction

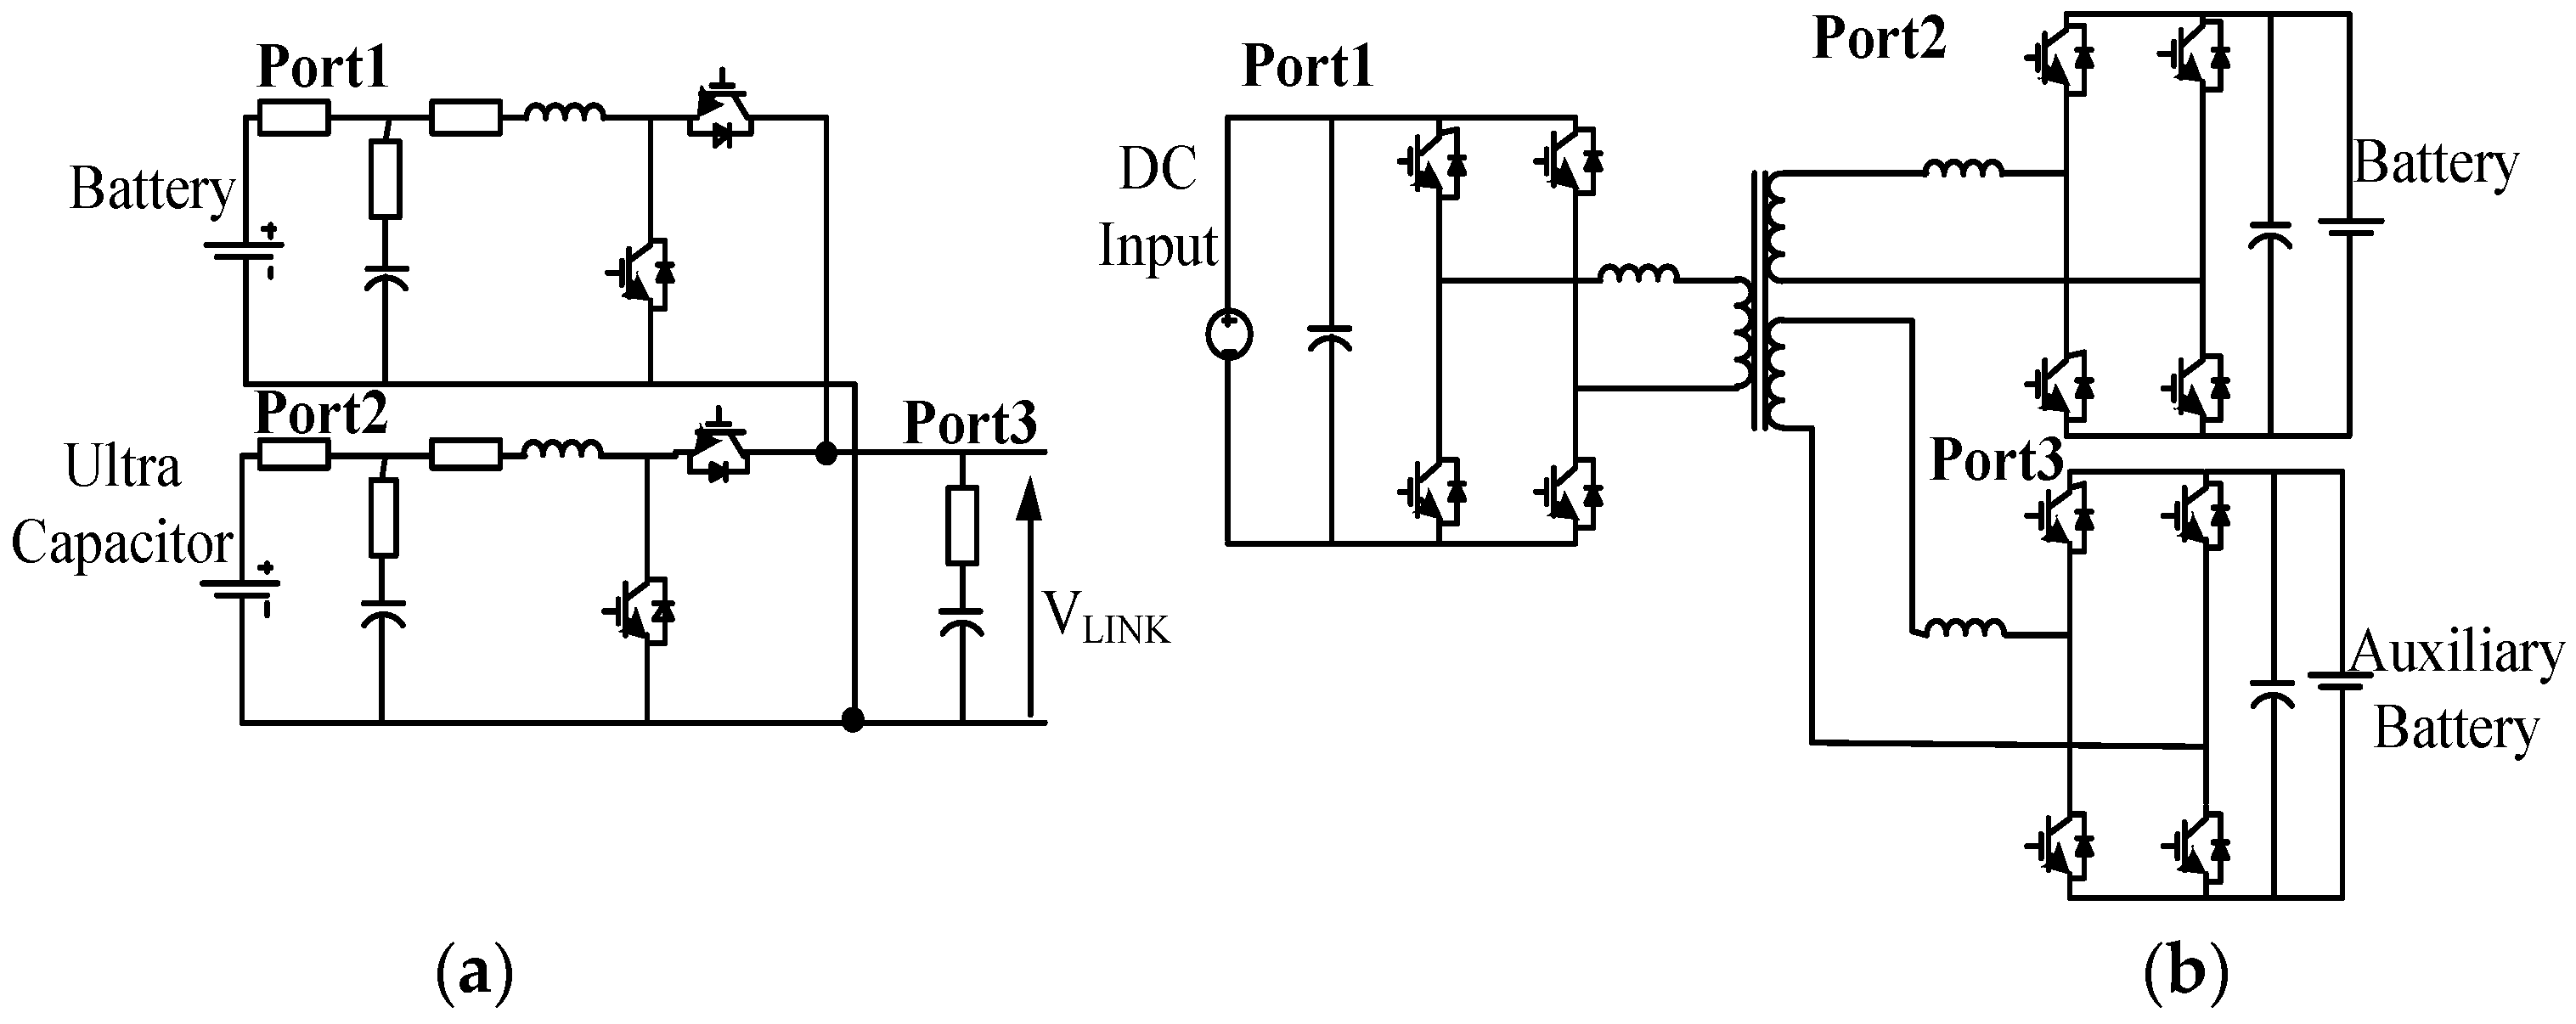
As concerns grow over environmental pollution, fossil fuel consumption and the energy crisis, electric vehicles (EVs) have been attracting wide interest. A diverse range of energy storage elements is available for use in EVs, and three-port active bridge (TAB) converters offer an optimal option to control the power flows of the different elements. TABs can be classified as DC link interfacing (DI) and magnetic coupler interfacing (MI) devices. A DI TAB is shown in Figure 1a when connecting a battery unit, an ultracapacitor and a DC link [1,2]. The device has a simple topology and no electrical isolation, but it cannot cope with a wide operating voltage ratio; energy storage devices connected to different ports must have a similar operating voltage, so the DI cannot be applied directly. A typical MI TAB is shown in Figure 1b when connecting a battery unit and an auxiliary battery, and it can convert DC voltages into high frequency AC voltages and achieve galvanic isolation [3]. Using a high-frequency transformer, different types of energy storage device can be connected to the MI, and different voltages and currents can be matched [4].
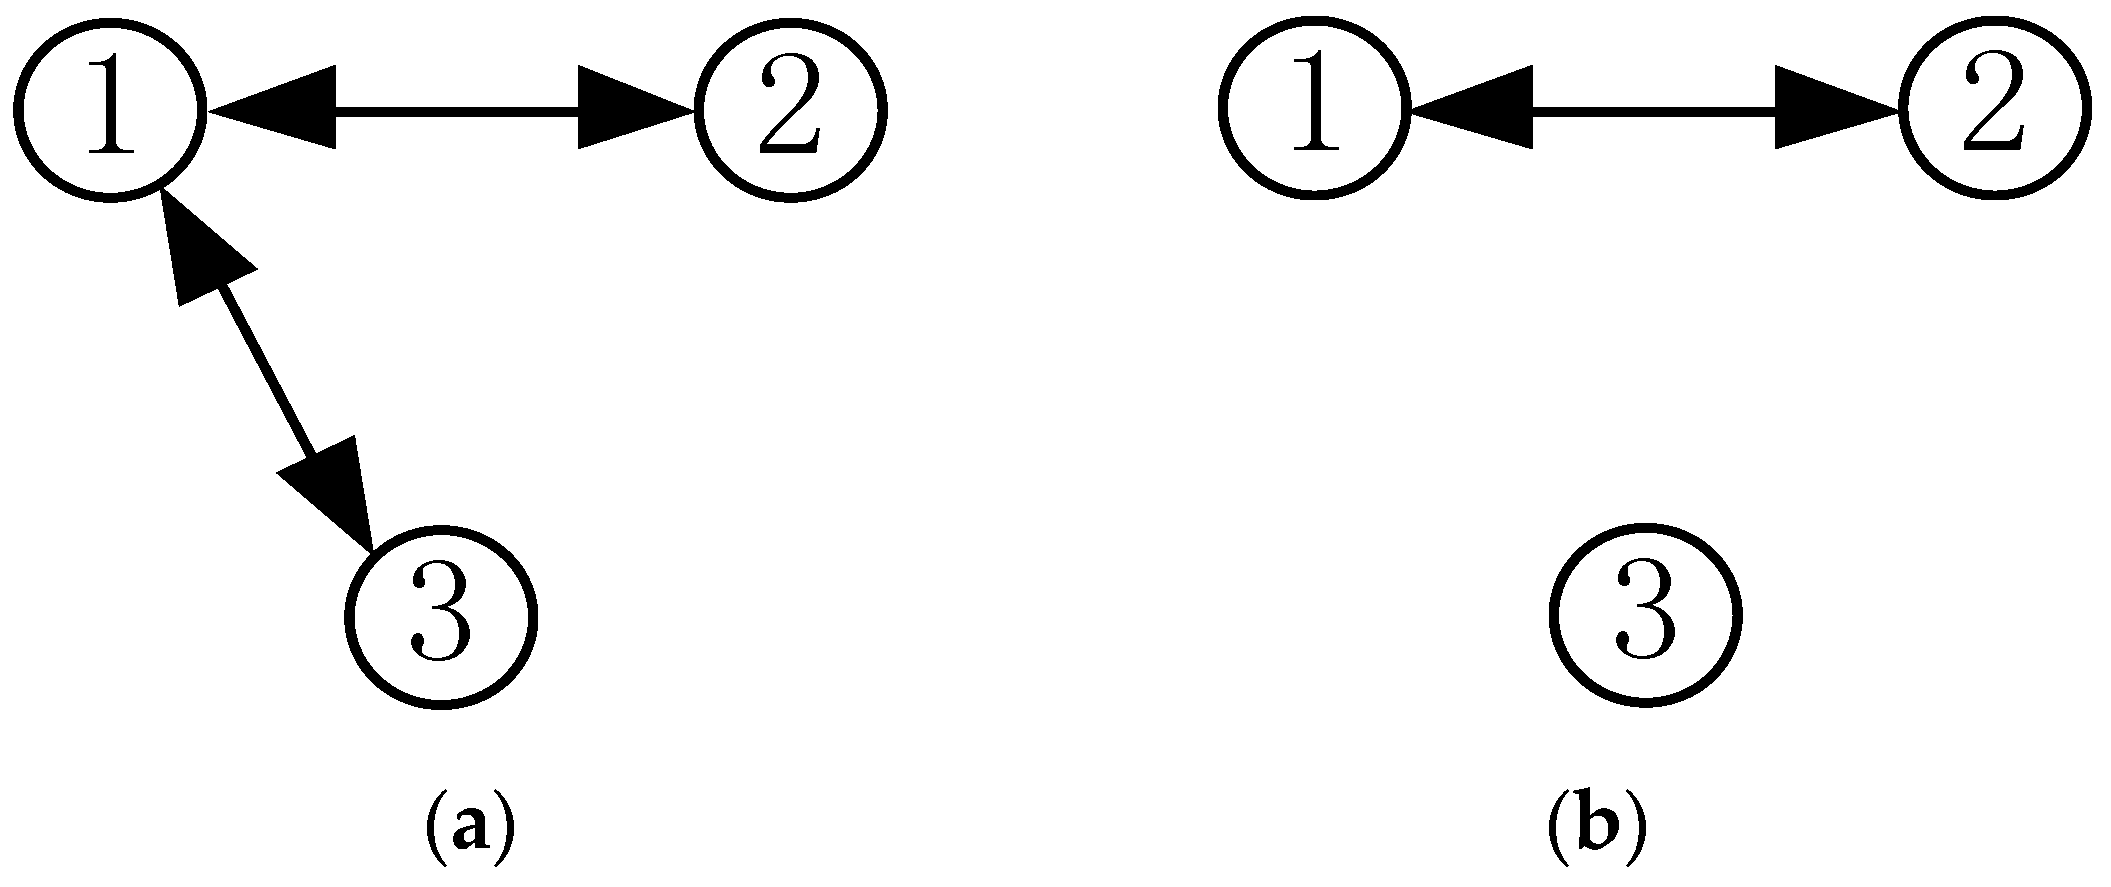
There are two types of power transmission in TABs. Figure 2a shows power transfer from one port to the other two ports or from two ports to the third port simultaneously; Figure 2b shows power transfer between two ports while the third port is isolated, i.e., the isolated port is in isolation control. This paper focuses on idling port isolation control of the MI TAB.
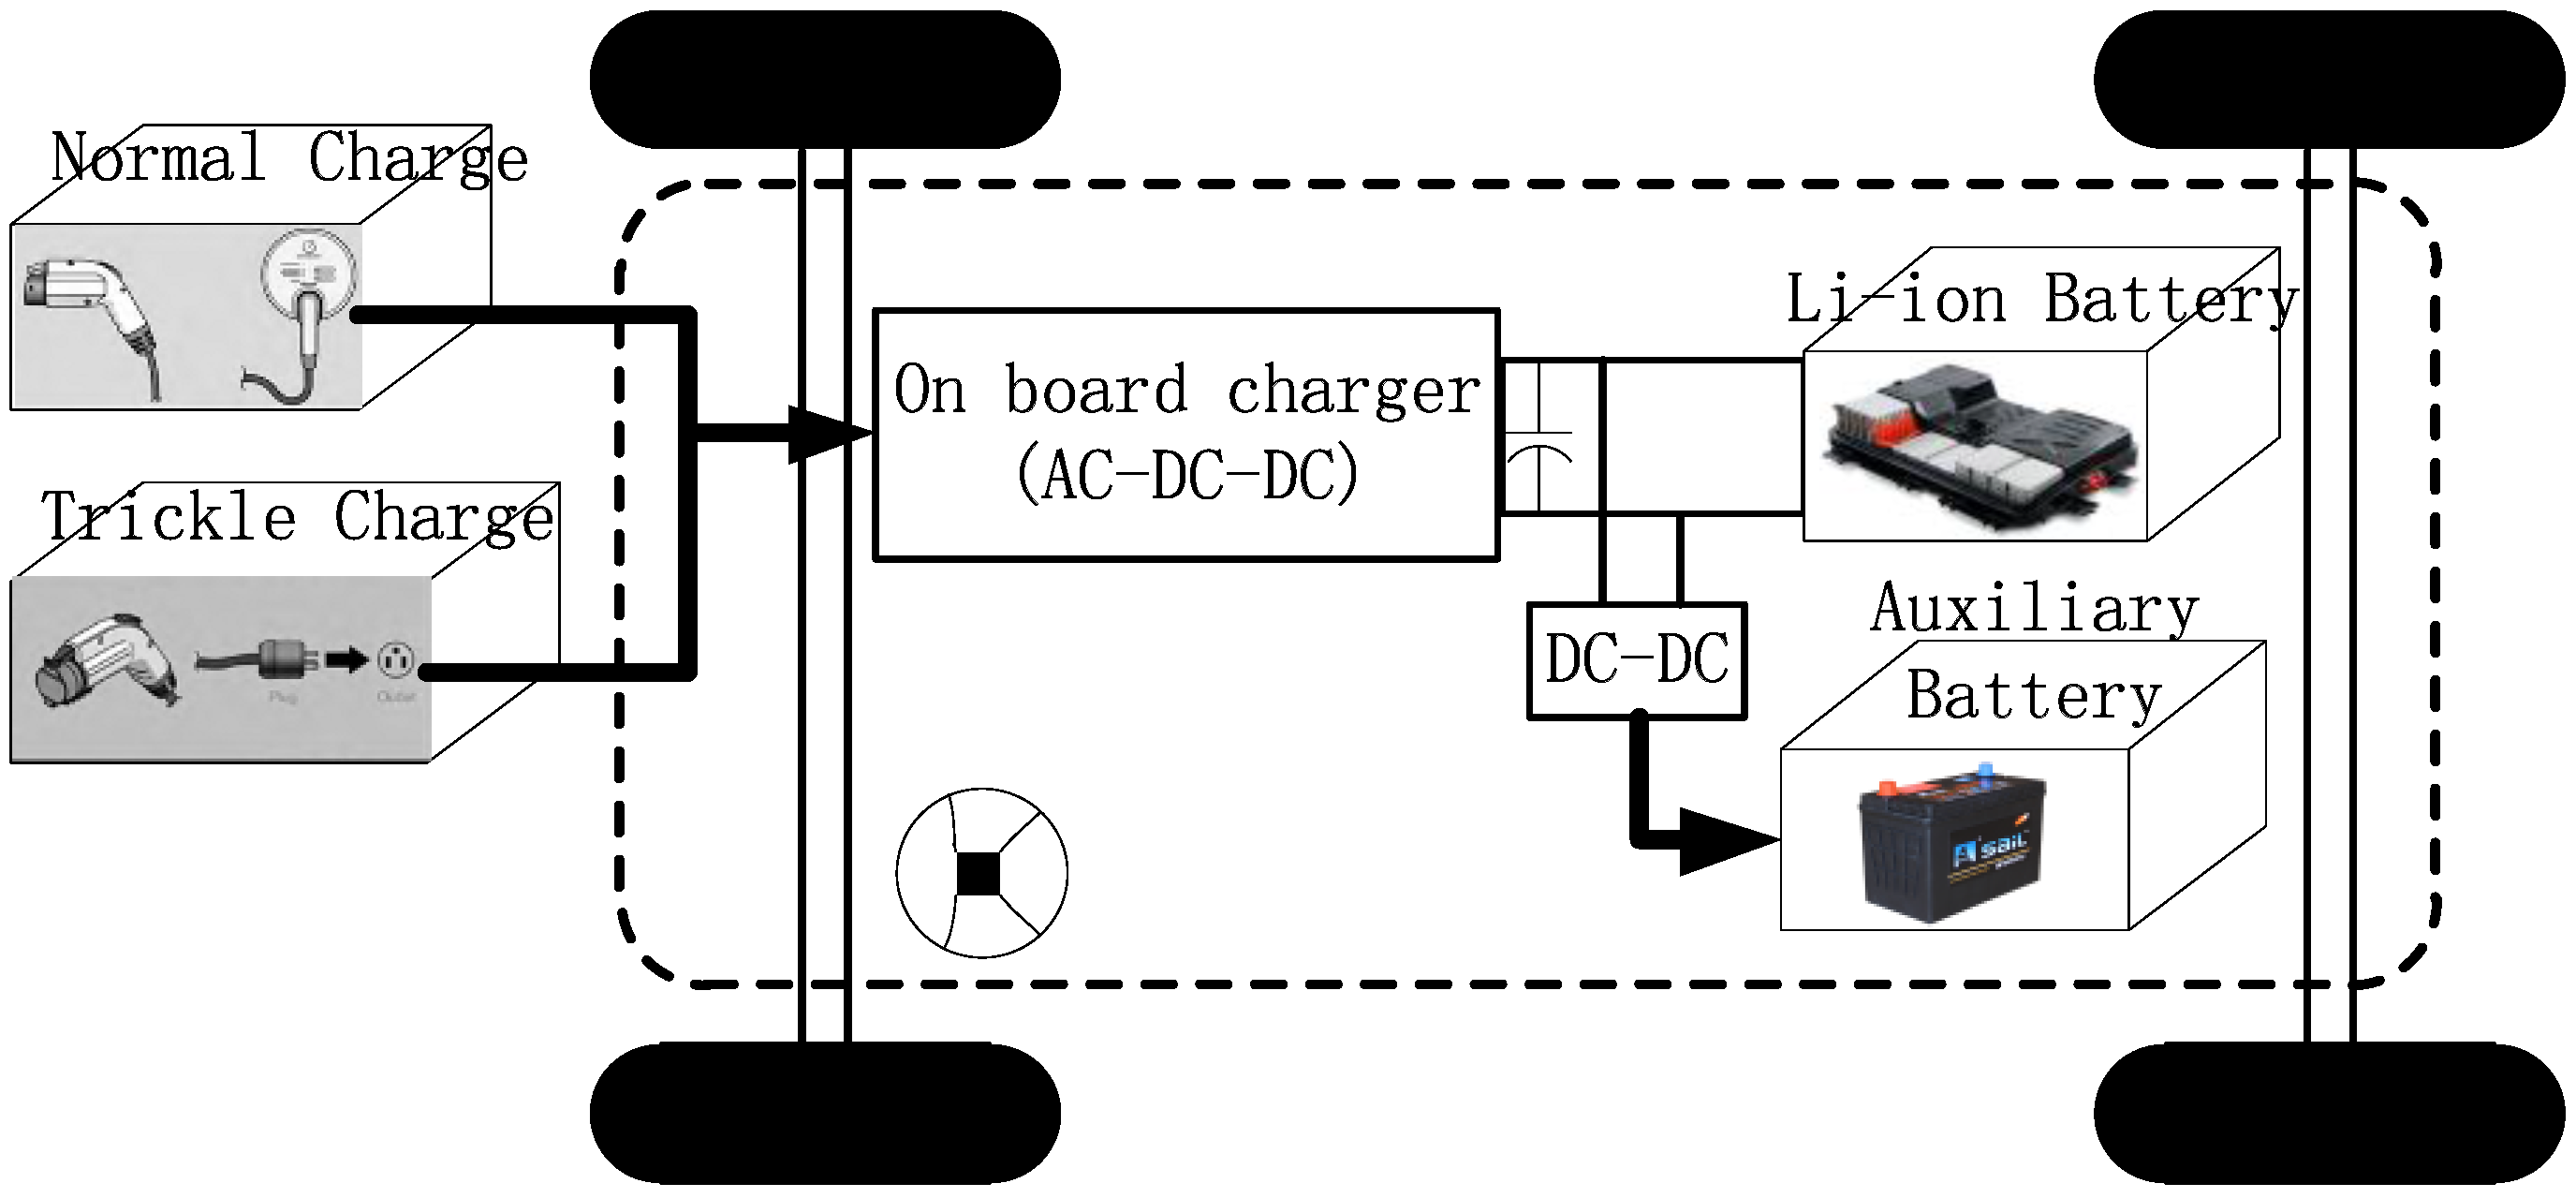
Two DC-DC converters are used in the EV charging system, as shown in Figure 3. One of these converters is used in the on-board charger to charge the battery, which can then provide power to the entire EV system. The other converter is between the Li-ion battery and the auxiliary battery and is used to charge the auxiliary battery, which can then provide power to electrical installations such as wipers, air-conditioning, and lighting [5,6,7,8,9]. The two converters in EVs work independently. The TAB is considered to be a combined charger composed of an on-board charger and a DC-DC converter for EVs, and was first proposed in [9]. Power transfer isolation means the isolated port has zero average power [9]. Because of idling port comes with power transfer isolation, it should points out that isolation refers to power transfer isolation in this article. The work focused on idling port isolation between the DC-DC converter and the on-board charger, i.e., where the DC-DC converter is isolated during the charging state and the on-board charger is isolated during the DC-DC operation state. The TAB structure, a mathematical model of the TAB, its zero-voltage-switching (ZVS) range and its root mean square (RMS) current performance were widely analyzed [10,11,12,13,14,15,16,17,18,19,20]. However, these analyses did not take the idling port isolation control characteristics into consideration. A specific control strategy should be used to achieve isolation control. Single phase shift (SPS) control, where each active bridge operates in a fixed duty cycle at 0.5, is used to achieve idling port isolation. The SPS control strategy will generate high peak currents and RMS currents in the idling port, which results in high switching and conduction losses. However, it is not desirable for the active components in EVs to have high peak currents and RMS currents because they will increase the current stress and conduction losses. This poses challenges for the design of a combined charger. Dual phase shift (DPS) control, where each port operates with a flexible duty cycle, was proposed to improve on the characteristics of SPS control [21,22]. Each port operates in DPS on the basis that SPS has been used in the three-port DC-DC converter to achieve isolation control. Minimum overall system losses and a lower RMS current can then be achieved. However, adoption of DPS control for every port may result in large numbers of process variables and a complex control strategy.
In this paper, an improved dual-phase-shift (IDPS) control strategy, in which only one port operates on a DPS basis while the other two ports operate with a fixed 0.5 duty ratio, was first applied to isolation control. There are six phase shift angles of DPS control in TAB [23,24] and four phase shift angles of IDPS control in TAB [11,13]. DPS control has two more switching actions than IDPS control. So IDPS control is easy and convenient to implement. In IDPS control, two bridges of TAB operate under a fixed 0.5 duty cycle, while the last bridge operates under a flexible duty cycle which is determined by the phase shift angles.
By taking the isolation control characteristics into consideration, this paper builds fundamental mathematical models of SPS control and IDPS control, including the current expression for the leakage inductance, the power transmission between each pair of ports, and the RMS current of the idling port. Based on this model, a detailed analysis and comparison of these two strategies is performed when under isolation control. The analyses include a ZVS area comparison and an RMS current comparison between SPS control and IDPS control. Additionally, the relationship between the RMS current and the transmission power has been revealed for the first time. Finally, based on the aforementioned analyses, the optimal turns ratio and phase shift angle of a three-port full bridge converter were deduced under isolation control to reduce the RMS current and the peak current in the idling port. Based on the above analysis, IDPS control is first applied in isolation control. It is possible to expand the ZVS area and decrease the RMS current than SPS control. Simulated and experimental results for SPS control and DPS control were also provided to verify the effectiveness of DPS control in reducing both the RMS current and the peak current on the idling port.

2. Three-Port Active Bridge (TAB) Working as a Combined Charger

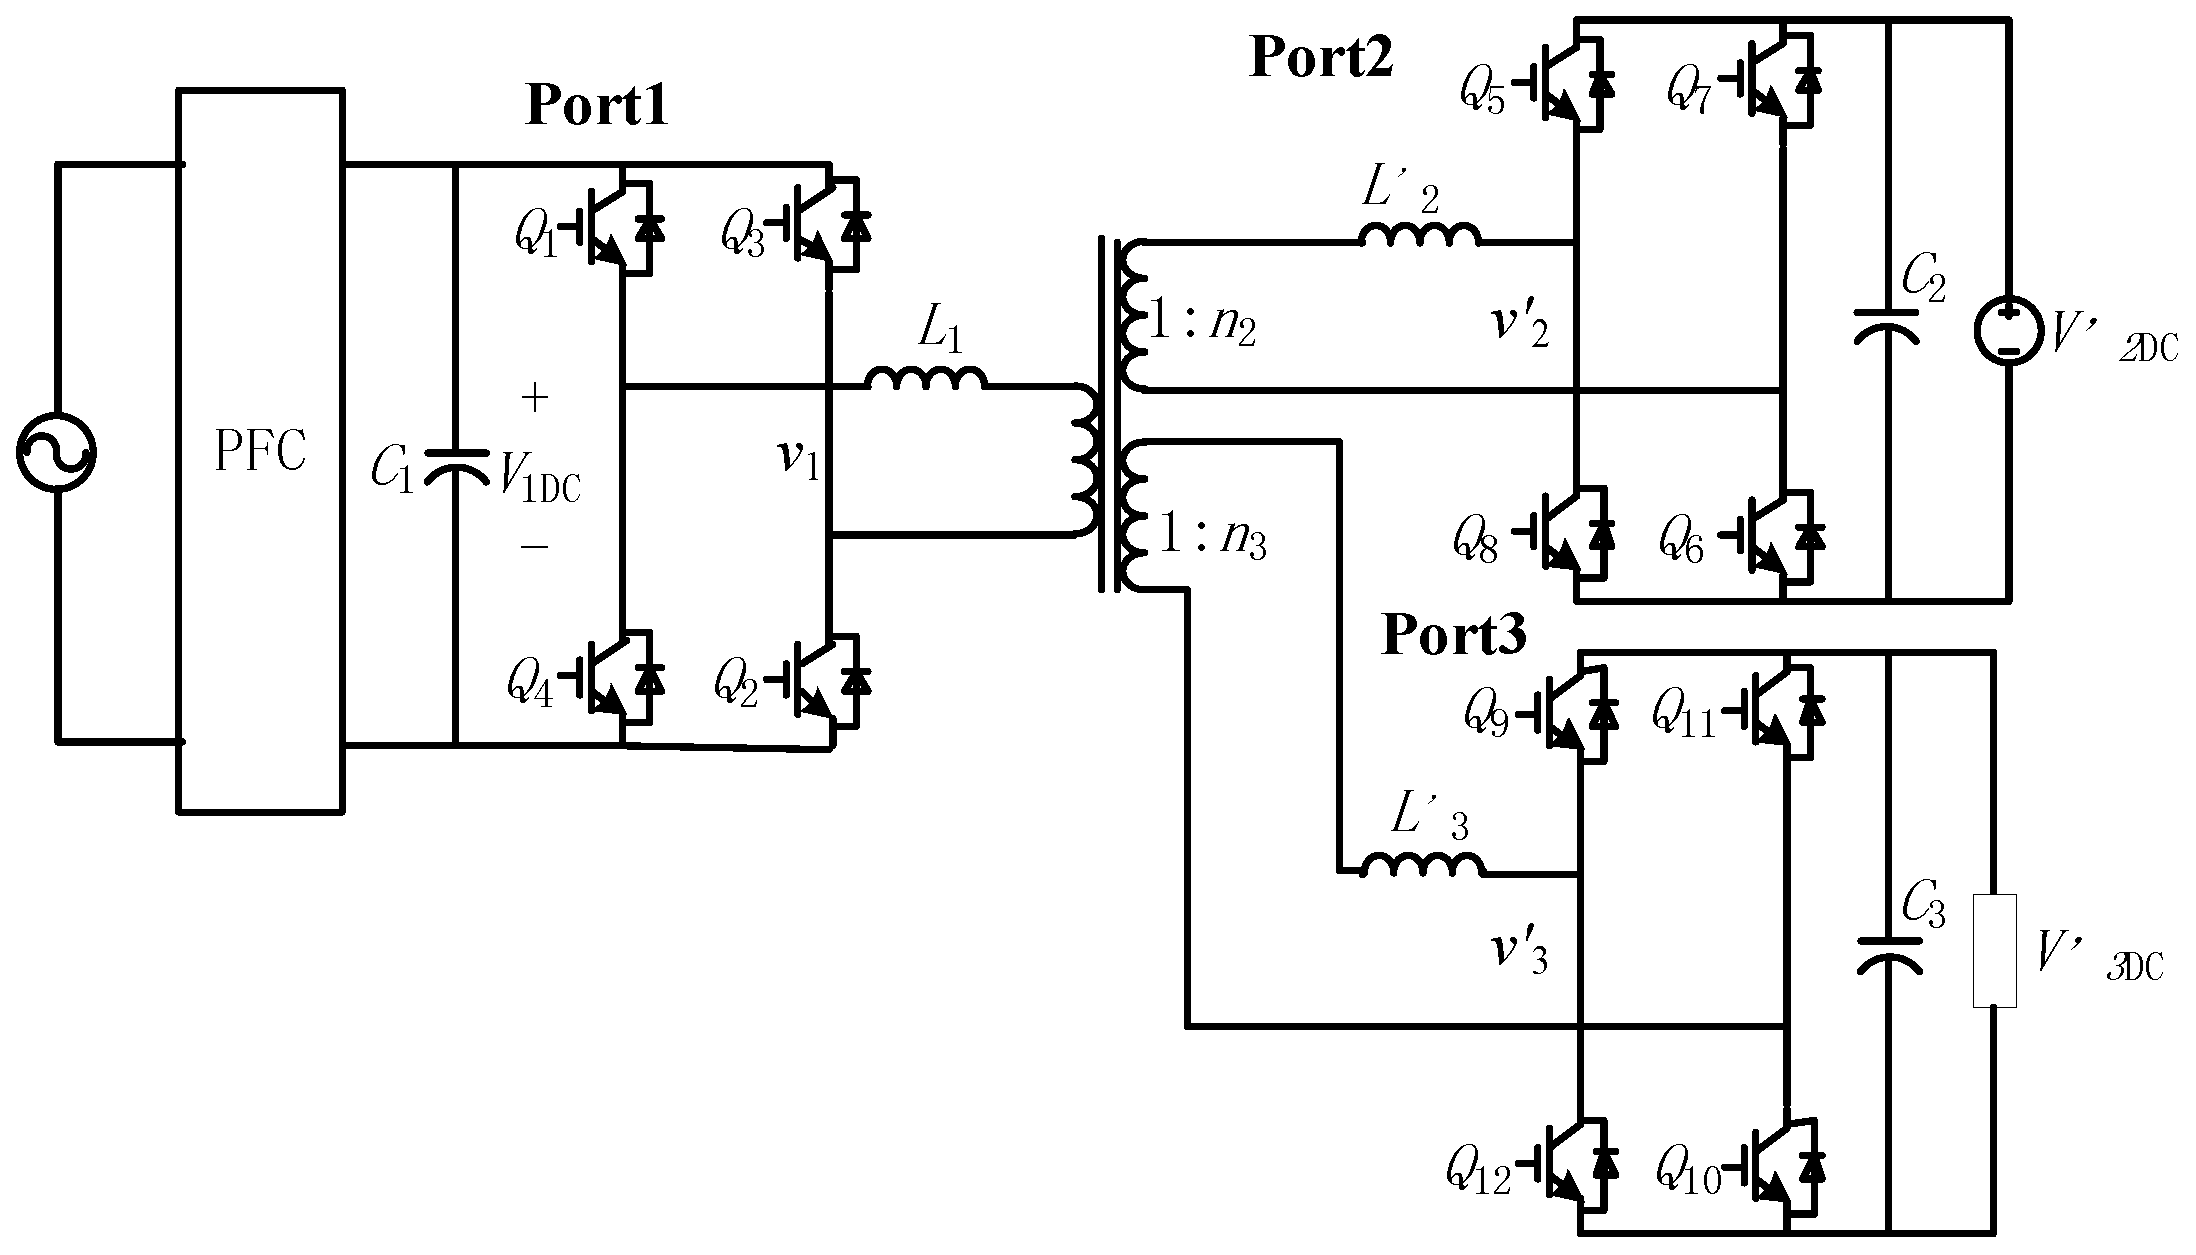
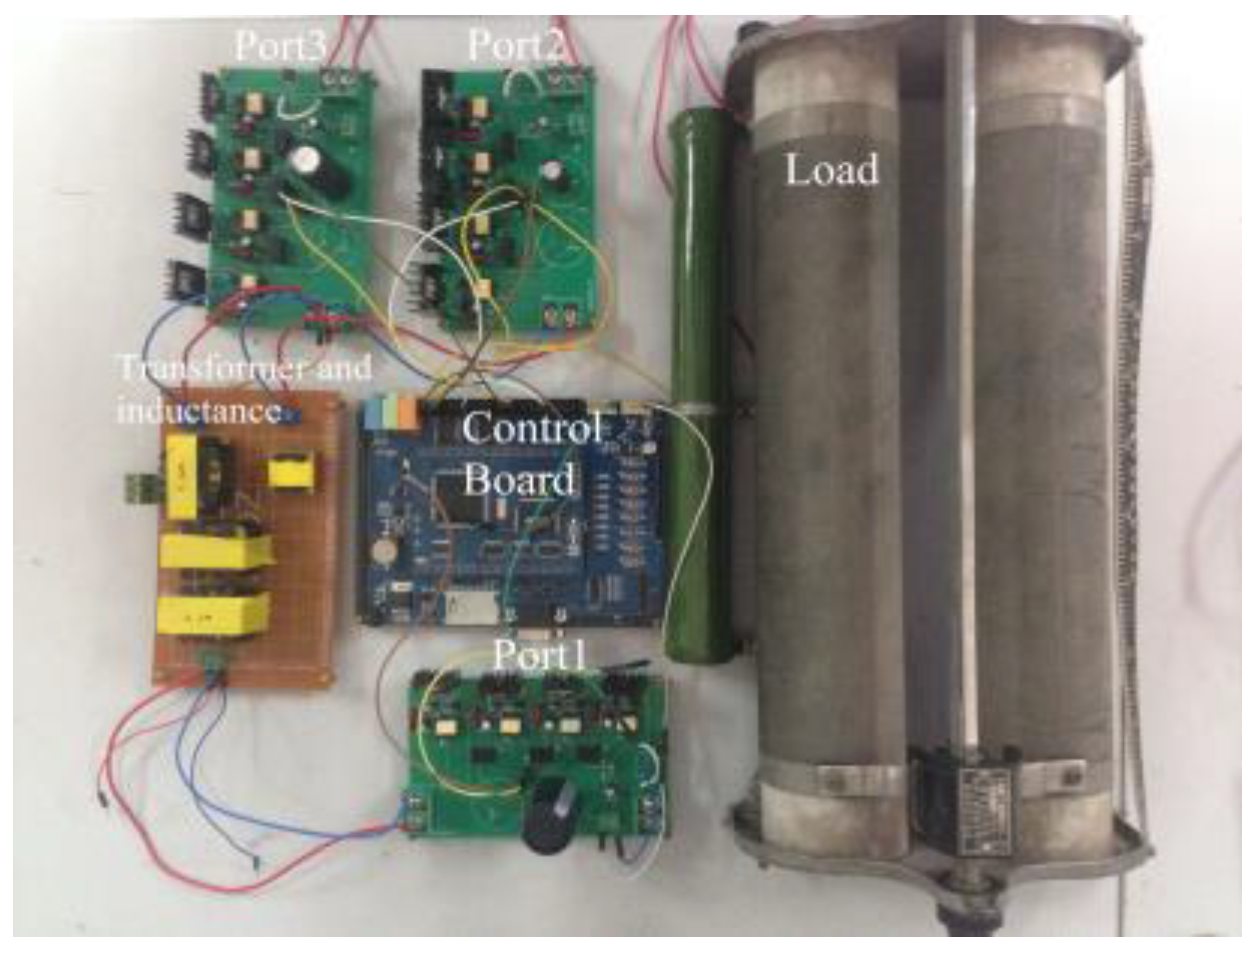
The TAB topology when used as a combined charger is shown in Figure 4. Port1 is connected to V1DC, which is rectified by the power grid through power factor correction (PFC) or using a diode rectifier. Port2 is connected to the auxiliary battery. Port3 is connected to the power battery. During certain operating states, one of the three ports in the TAB must stop. For example, during the charging state, the auxiliary battery does not need to work, and the power is transmitted from Port1 to Port3 while Port2 is idling. Similarly, during the DC-DC state, the battery charger is isolated, and thus power is transmitted from Port3 to Port2 while Port1 is idling. The peak current is obvious in the charging mode, and thus it is representative for analyzing the optimal isolation control in this mode; the DC-DC mode offers a similar analysis. V1DC, V’2DC, and V’3DC represent the voltages of Port1, Port2, and Port3, respectively. L1, L’2, and L’3 are the leakage inductances of the high-frequency transformer, where the turns ratio between the ports is 1:n1:n2. v1, v2, and v3 represent the AC currents of each port. The TAB offers the advantages of size reduction and cost savings, and can provide galvanic isolation between the ports.
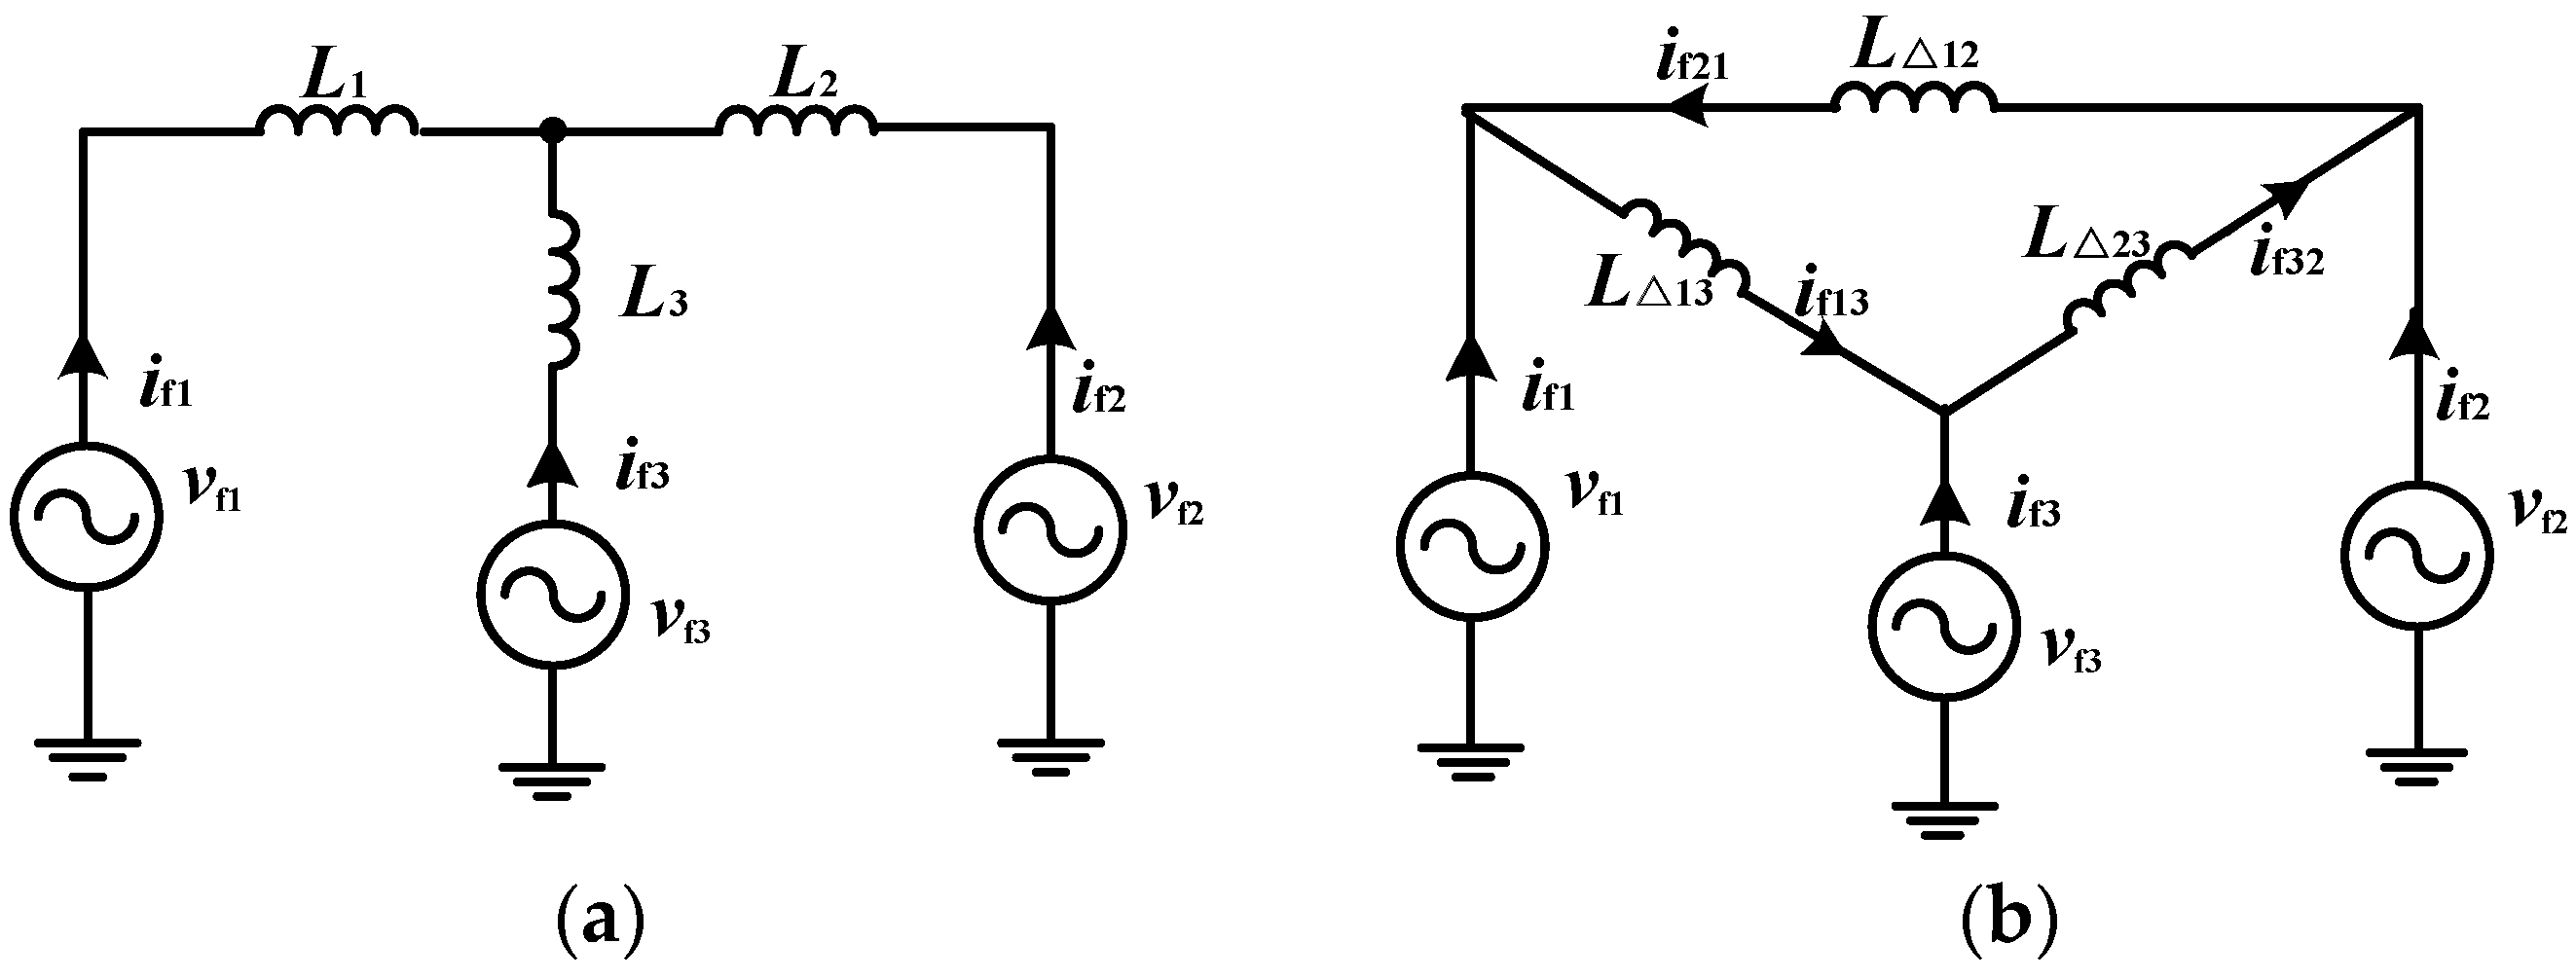
The simplified fundamental primary reference equivalent circuit is shown in Figure 5; the Y-type is convenient for modelling, and the Δ-type is convenient for system analysis [24], where L2 = L’2/n22, L3 = L’3/n32, L△12 = L1+L2+L1L2/L3, L△23 = L2+L3+L2L3/L1, and L△13 = L1+L3+L1L3/L2. vf1vf3 are the primary reference fundamental voltages of V1DC, V’2DC/n2, and V’3DC/
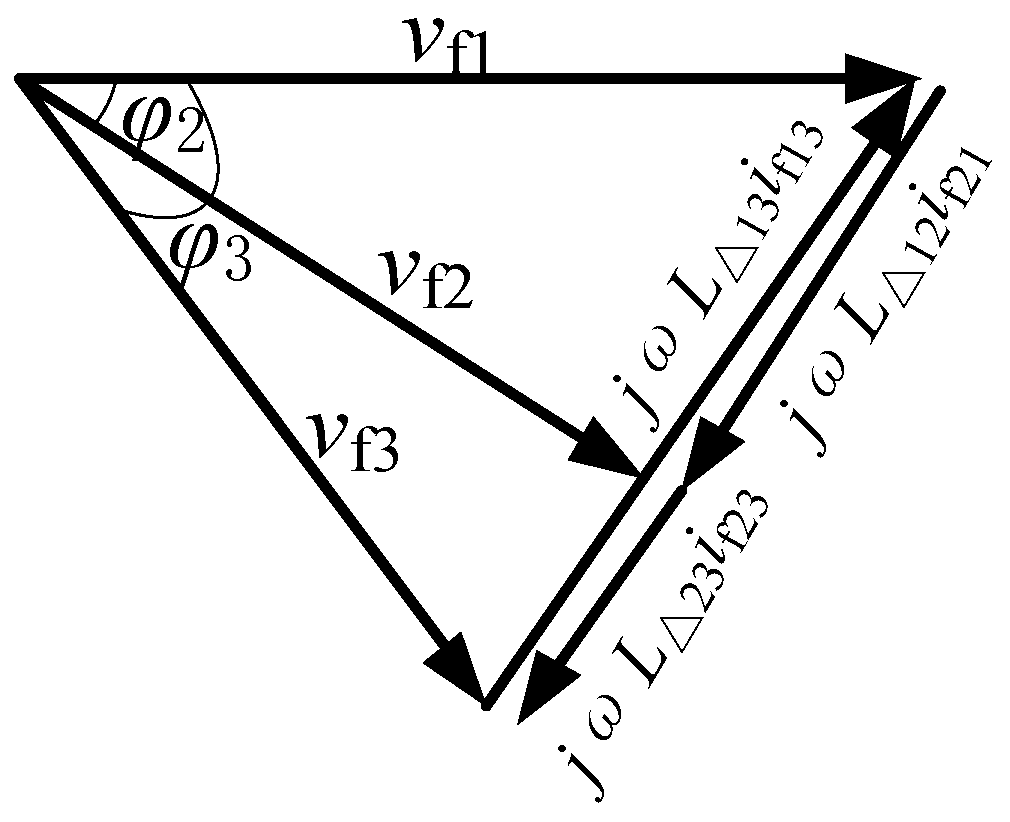
n3, respectively. The current vector is given in Equation (1), based on Figure 5b. The fundamental parameters are given by the angles, where v f 1 = | V f 1 | φ 1 ,   v f 2 = | V f 2 | φ 2 ,   v f 3 = | V f 3 | φ 3 . For ease of analysis and design, we can set φ1 = 0. The vector diagram of isolation control is shown in Figure 6, and is based on Equation (1).
{ i f 2 = i f 21 i f 32 v f 2 v f 1 = j ω L Δ 12 i f 21 v f 3 v f 2 = j ω L Δ 23 i f 21
SPS control has been used to achieve isolation control. When φ1 is equal to zero, φ2 and φ3 denote the phase shift angles between vf2 and vf1 and between vf3 and vf1, respectively. The fundamental power is assumed to be equal to the active power. From studies of the Fourier transforms of the high-frequency voltage waveforms, | V f 1 | = | 2 2 V 1 D C π | ,   | V f 2 | = | 2 2 V 2 D C π n 2 | ,   | V f 3 | = | 2 2 V 3 D C π n 3 | is deduced [9]. The power transmission characteristics of each port are shown in Equation (2). Isolation control in Port2 can only be achieved when P21 = P32.
{ P 32 = | V f 3 | | V f 2 | sin ( φ 3 φ 2 ) ω L Δ 32 = 4 V 2 D C V 3 D C sin ( φ 2 φ 3 ) π 3 f L Δ 32 n 2 n 3 P 21 = | V f 2 | | V f 1 | sin ( φ 2 φ 1 ) ω L Δ 21 = 4 V 1 D C V 2 D C sin ( φ 2 ) π 3 f L Δ 21 n 2 P 13 = | V f 1 | | V f 3 | sin ( φ 1 φ 3 ) ω L Δ 13 = 4 V 1 D C V 3 D C sin ( φ 3 ) π 3 f L Δ 13 n 3

3. Mathematical Model for Isolation Control

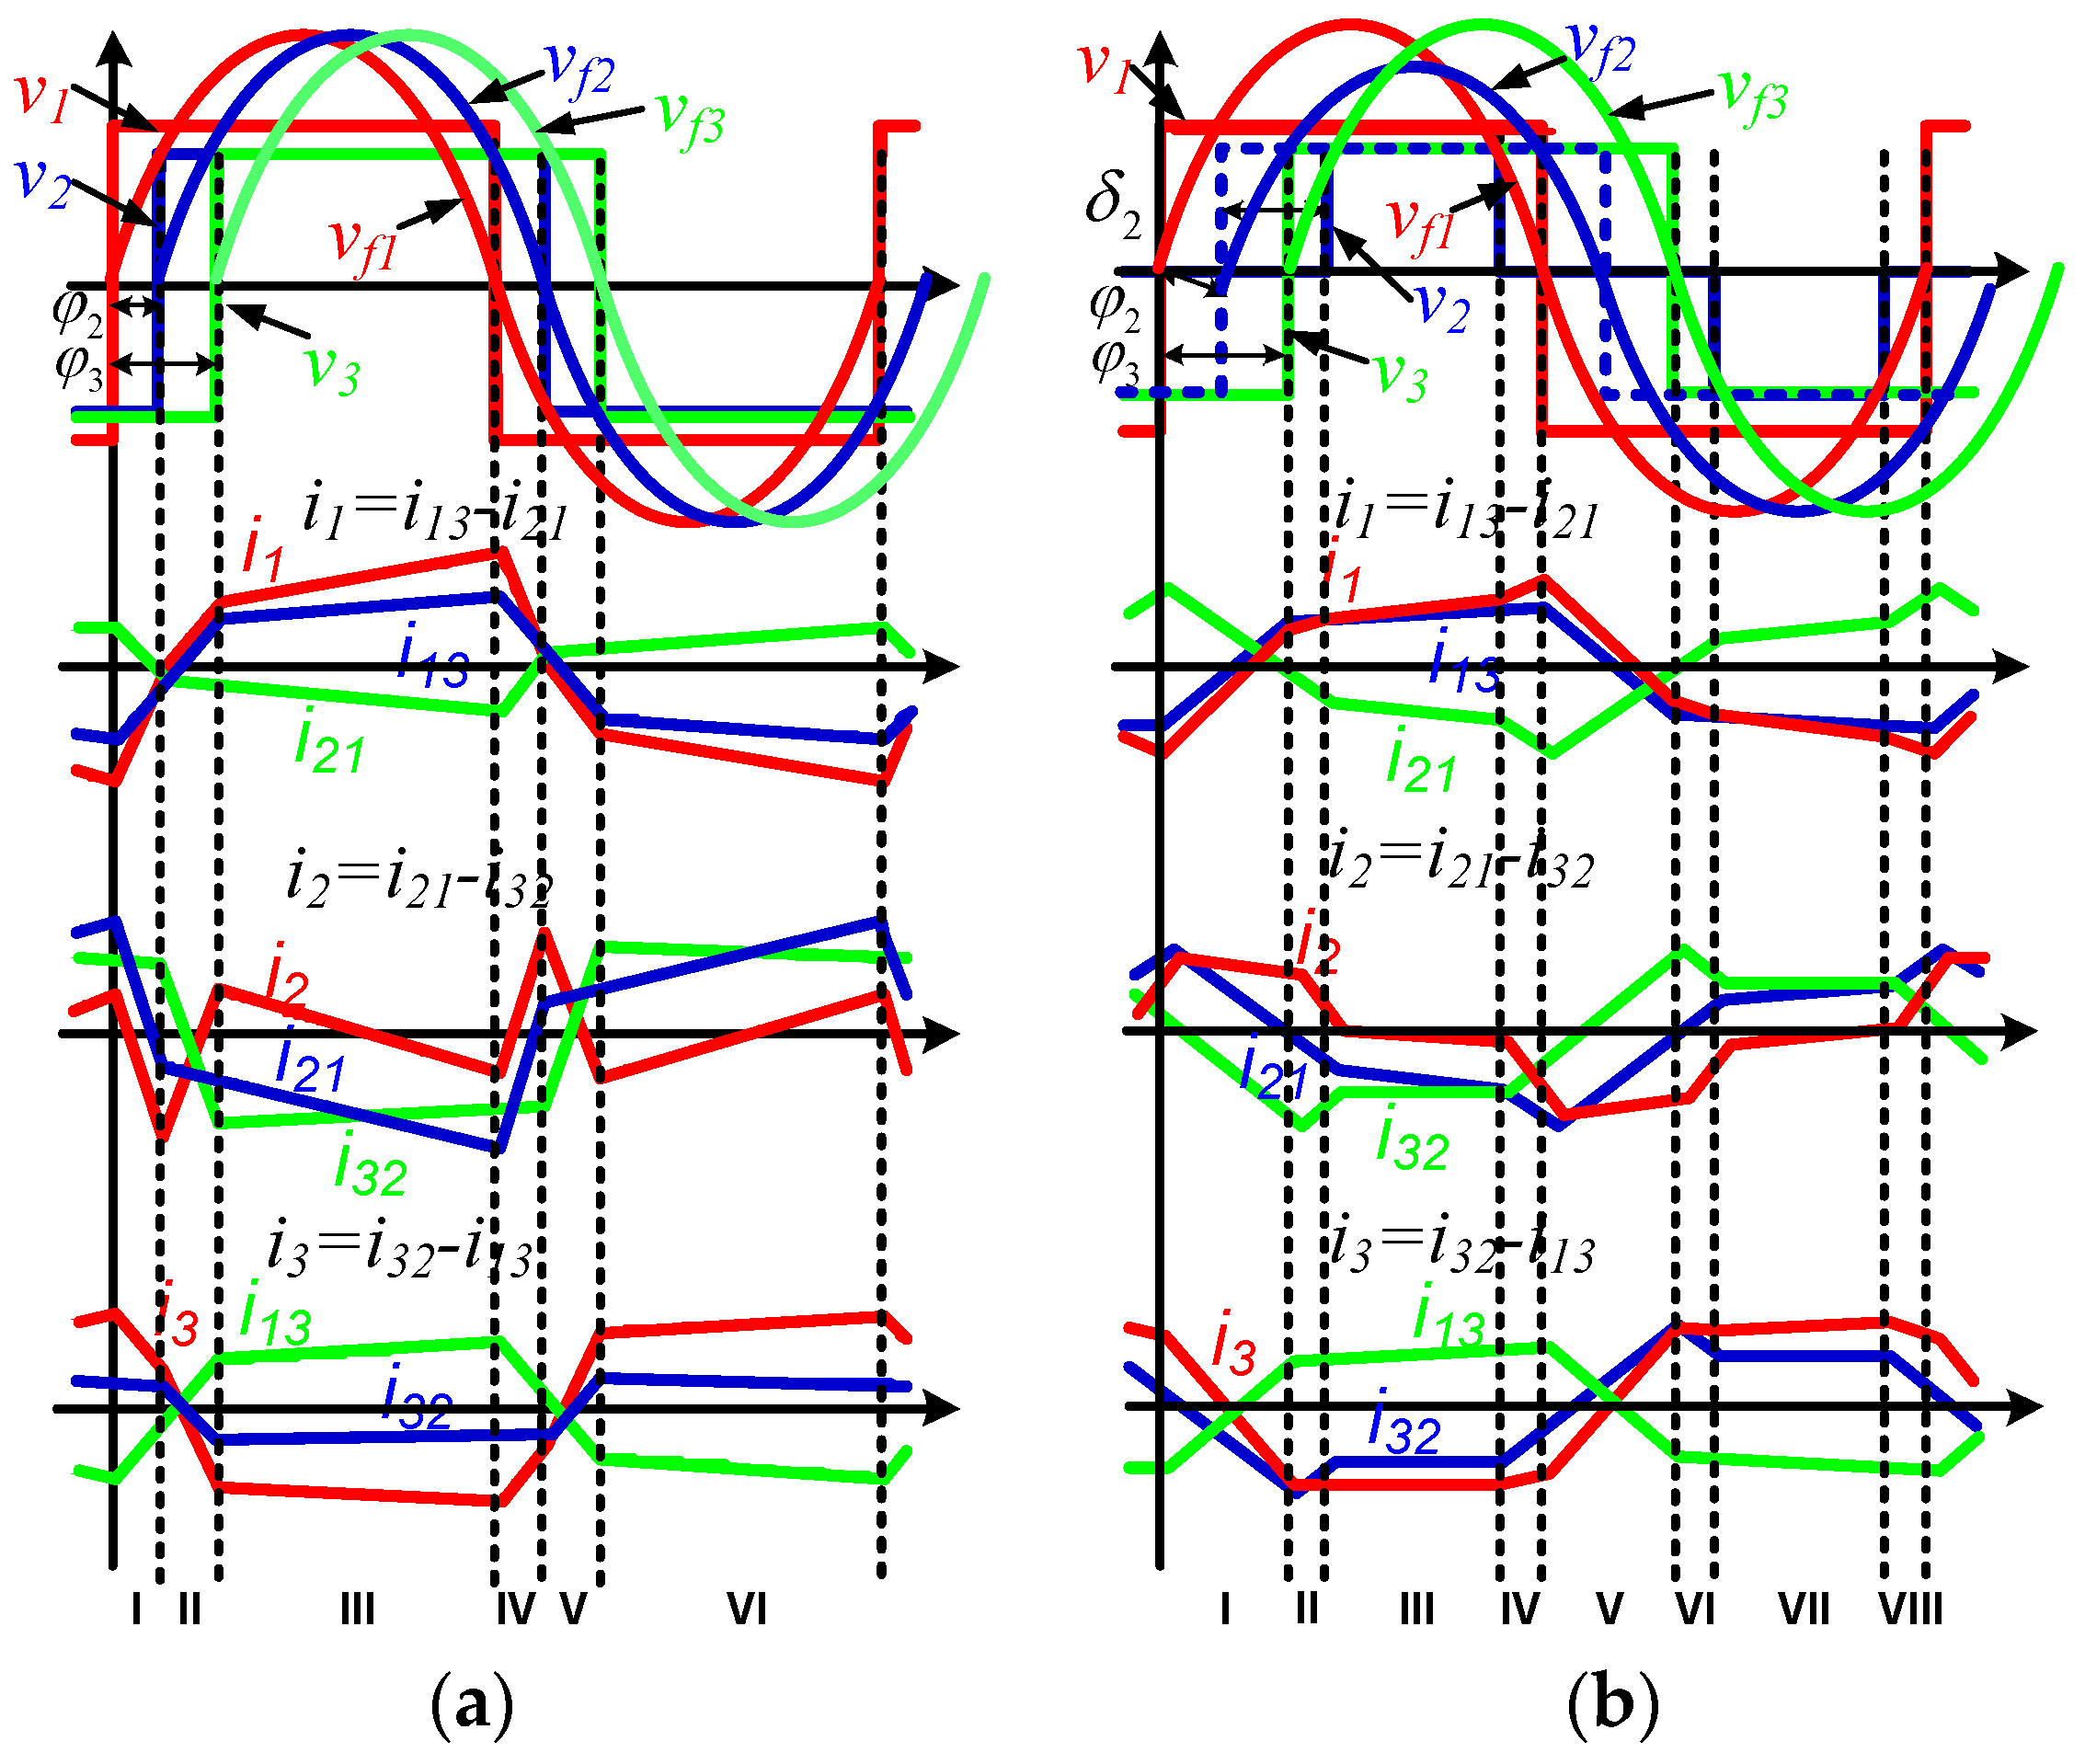
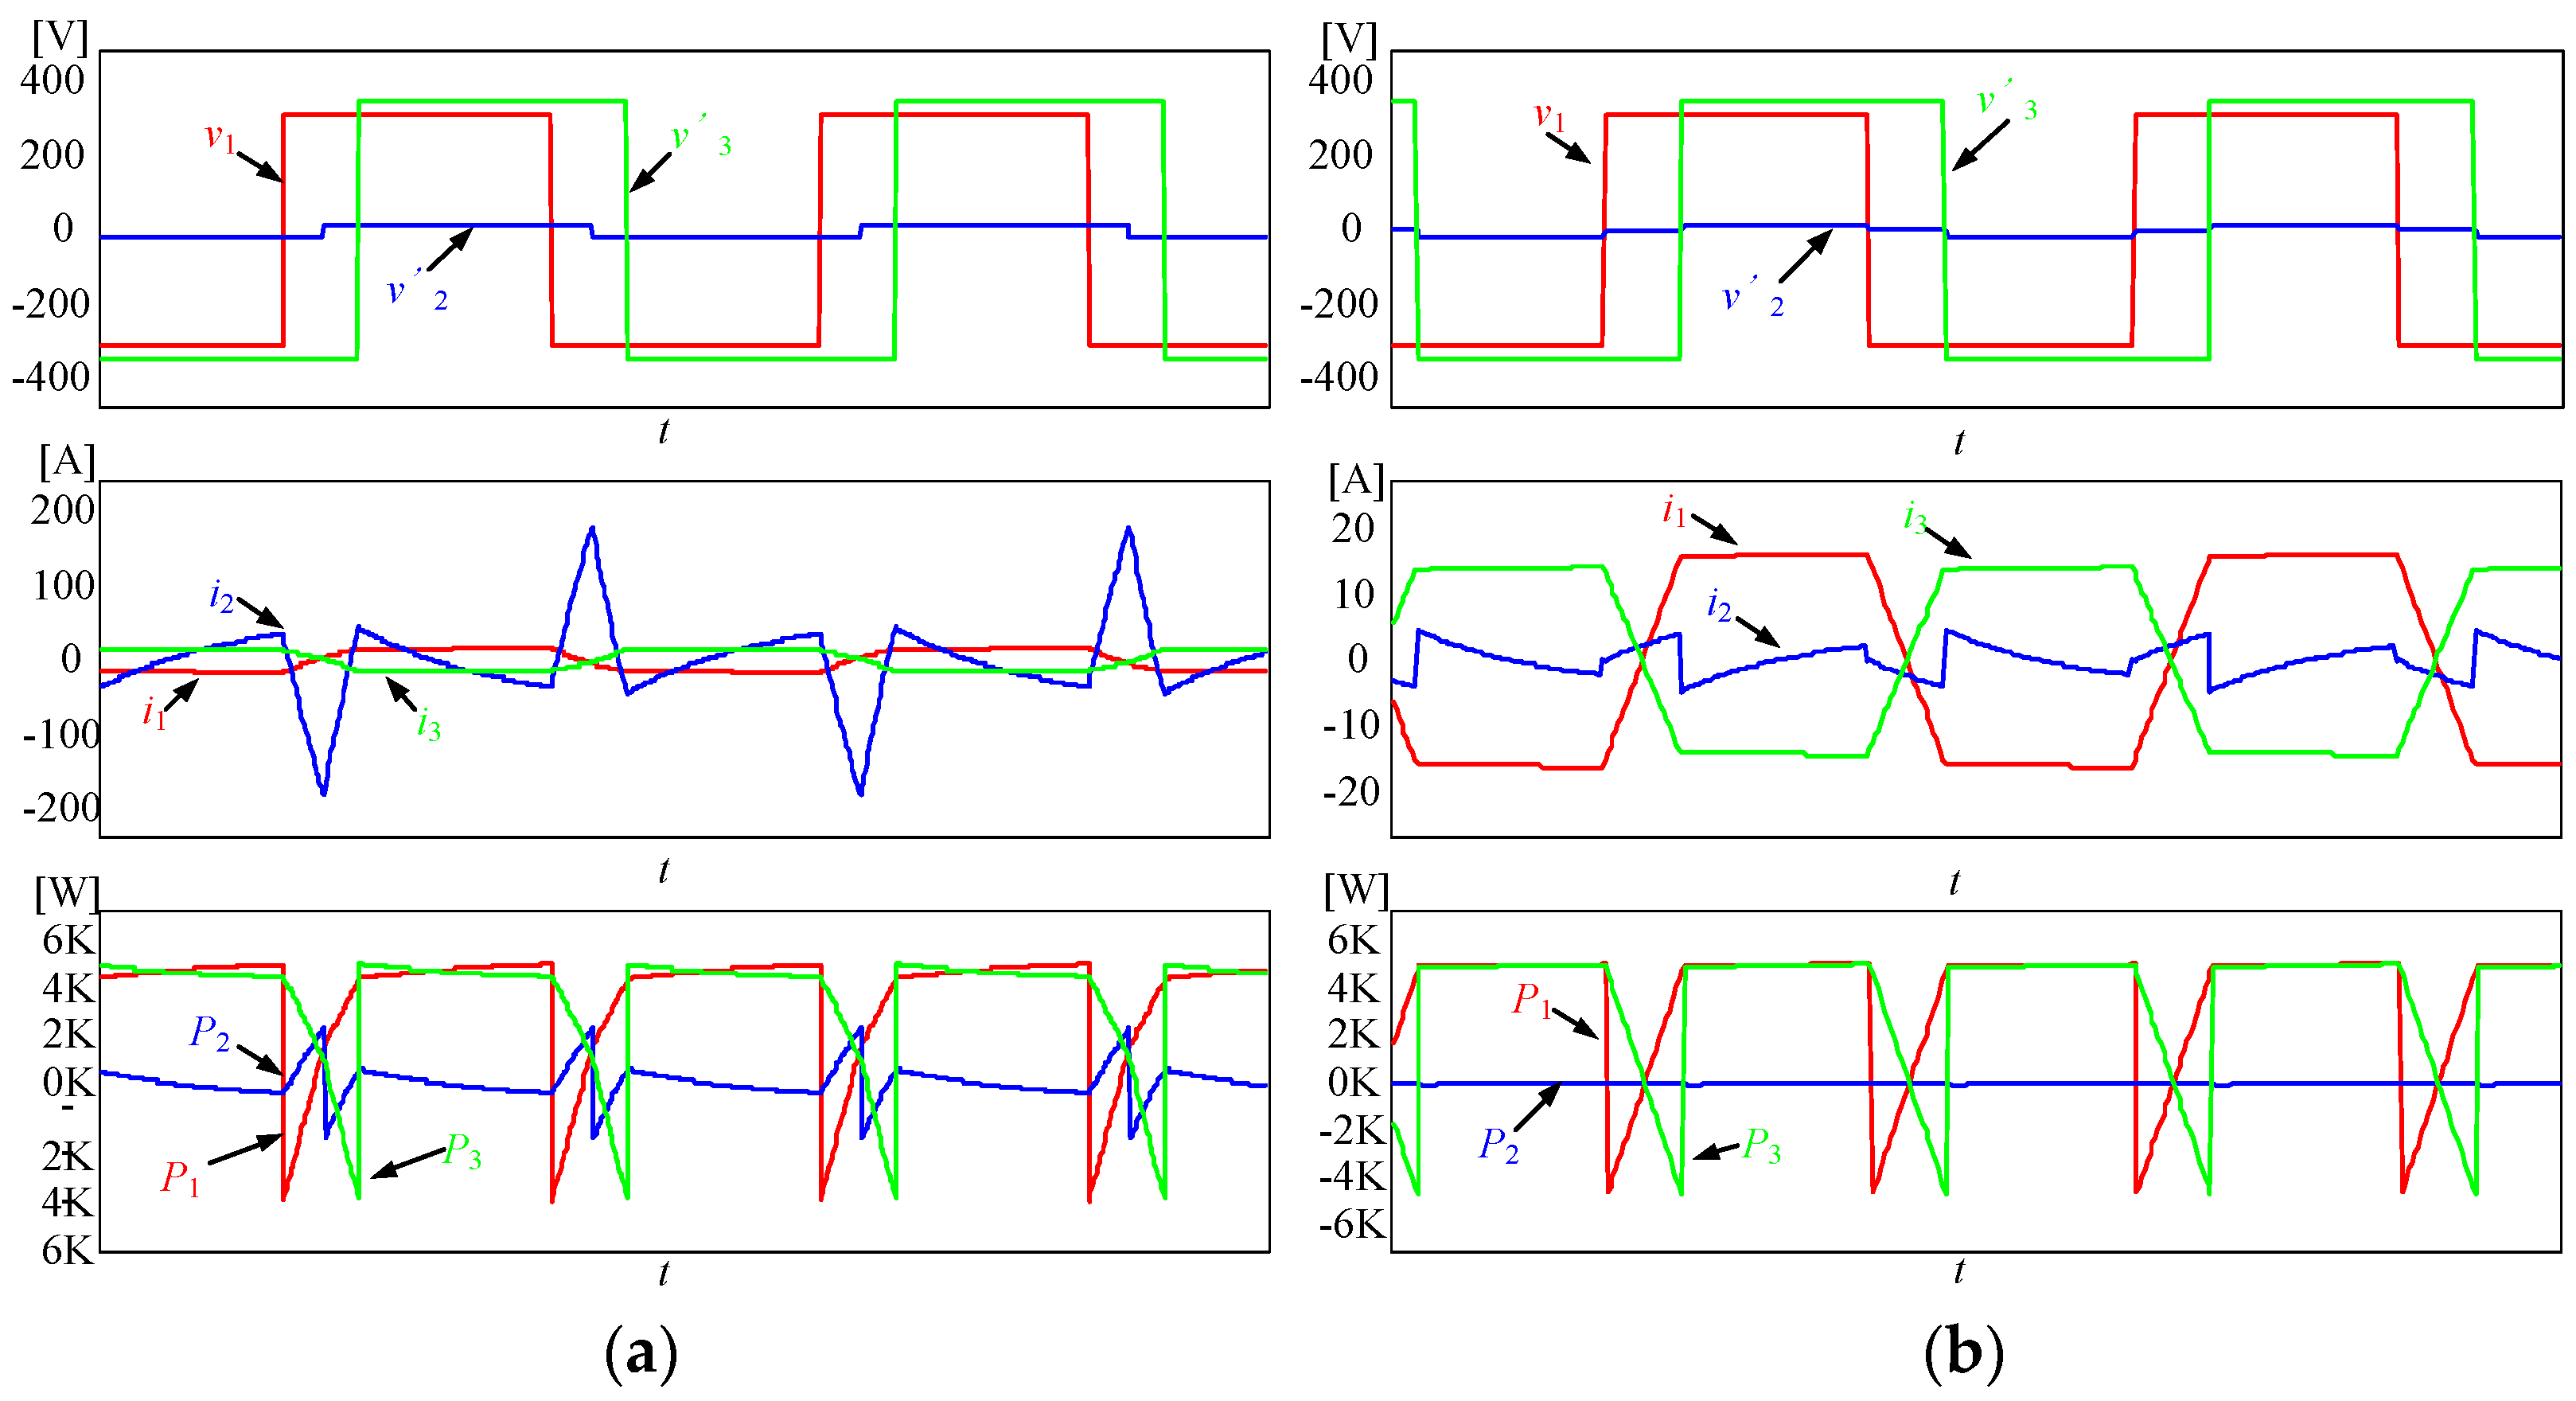
In the charging mode, Port2 is idling. The SPS control and IDPS control waveforms are shown in Figure 7. It should be noted here that we only use DPS on Port2 because it has the lowest voltage that will cause serious peak currents.
The fundamental power is assumed to be equal to the active power. The Fourier transform is therefore used for analysis of the SPS control waveforms of Figure 7a. To provide a comparison between SPS and IDPS, we set the appropriate variables such that φ2 denotes the phase shift angle between vf1 and vf2, φ3 denotes the phase shift angle between v1 and v3, and δ2 denotes the phase shift angle between vf2 and v2. δ2 and φ2 must meet the constraints of DPS control, as given by φ2<δ2 [18].
Based on Figure 7b, the IDPS operation over a single switching cycle can be classified into eight stages, numbered I through VIII. Because of the symmetry and voltage-second balance characteristics, a half cycle (I–IV) is analyzed here rather than a full cycle. The leakage currents iL21, iL32, and iL13 through L△12, L△32, and L△13 can be deduced as follows, where ω = 2π f and the start time is zero.
In mode I,
{ i L 21 ( φ ) = i L 21 ( 0 ) V 1 L Δ 12 φ ω i L 32 ( φ ) = i L 21 ( 0 ) V 3 D C L Δ 12 n 3 φ ω i L 13 ( φ ) = i L 13 ( 0 ) + V 1 n 3 + V 3 D C L Δ 31 n 3 φ ω
Mode I ends at φ = φ3. In mode II,
{ i L 21 ( φ ) = i L 21 ( φ 3 ) V 1 L Δ 12 ( φ φ 3 ) ω i L 32 ( φ ) = i L 32 ( φ 3 ) + V 3 D C L Δ 23 n 3 ( φ φ 3 ) ω i L 13 ( φ ) = i L 13 ( φ 3 ) + n 3 V 1 V 3 D C n 3 L Δ 31 ( φ φ 3 ) ω
Mode II ends at φ = φ2+δ2. In mode III,
{ i L 21 ( φ ) = i L 21 ( φ 2 + δ 2 ) + V 2 D C n 2 V 1 L Δ 12 n 2 ( φ φ 2 δ 2 ) ω i L 32 ( φ ) = i L 32 ( φ 2 + δ 2 ) + V 3 D C n 3 V 2 D C n 2 L Δ 23 ( φ φ 2 δ 2 ) ω i L 13 ( φ ) = i L 13 ( φ 2 + δ 2 ) + n 3 V 1 V 3 D C n 3 L Δ 31 ( φ φ 2 δ 2 ) ω
Mode III ends at φ = π+ φ2δ2. In mode IV,
{ i L 21 ( φ ) = i L 21 ( π + φ 2 δ 2 ) V 1 L Δ 12 ( φ π φ 2 + δ 2 ) ω i L 32 ( φ ) = i L 32 ( π + φ 2 δ 2 ) + V 3 D C L Δ 23 n 3 ( φ π φ 2 + δ 2 ) ω i L 13 ( φ ) = i L 13 ( π + φ 2 δ 2 ) + n 3 V 1 V 3 D C n 3 L Δ 31 ( φ π φ 2 + δ 2 ) ω
Under isolation control, IDPS control and SPS control have the same vector diagrams, as shown in Figure 6. From study of the Fourier transforms of the high-frequency voltage waveforms, | V f 1 | = | 2 2 V 1 D C π | ,   | V f 2 | = | 2 2 V 2 D C cos δ 2 π n 2 | ,   | V f 3 | = | 2 2 V 3 D C π n 3 | can be deduced. The IDPS power transmission at each port is shown in Equation (7) under the hypothesis that the start time of the switching cycle is zero.
{ P 32 = | V f 3 | | V f 2 | sin ( φ 3 φ 2 ) ω L Δ 32 = 4 V 2 D C V 3 D C cos δ 2 sin ( φ 2 φ 3 ) n 3 π 3 f L Δ 32 P 21 = | V f 2 | | V f 1 | sin ( φ 2 φ 1 ) ω L Δ 21 = 4 V 1 D C V 2 D C cos δ 2 sin ( φ 2 ) n 2 π 3 f L Δ 21 P 13 = | V f 1 | | V f 3 | sin ( φ 1 φ 3 ) ω L Δ 13 = 4 V 1 D C V 3 D C sin ( φ 3 ) n 3 π 3 f L Δ 13
Equations (3)–(6) are controlled by five variables, i.e., n2, n3, δ2, φ2, and φ3, which gain one more variable than Equation (2), i.e., n2, n3, φ2 and φ3. We assume that L△12 = L△23 = L△13 = L in the following analysis. A detailed analysis and comparison between SPS control and IDPS control in terms of the ZVS range and the RMS current are given below to optimize the isolation control process.

4. Zero-Voltage-Switching (ZVS) Region and Root Mean Square (RMS) Current Analysis

IDPS control has already been used in TABs to enlarge the ZVS region, reduce the RMS current and improve the characteristics under abnormal operating conditions. However, isolation control under IDPS control conditions and the required optimal parameters have not yet been analyzed. This section takes the isolation control characteristics into consideration to perform a comparison between SPS and IDPS control. Using this analysis, we can obtain the optimal parameters for the TAB and IDPS control.

4.1. Zero-Voltage-Switching (ZVS) Analysis and Comparison

Switching losses and conduction losses are the two main loss factors in converter efficiency. To reduce the switching losses and achieve ZVS, IDPS control can be used on Port2 on the basis of SPS control. Based on the ZVS analysis, we can determine the required turns ratio.
M21 and M31 are defined as:
{ M 21 = V 2 D C n 2 V 1 D C M 31 = V 3 D C n 3 V 1 D C
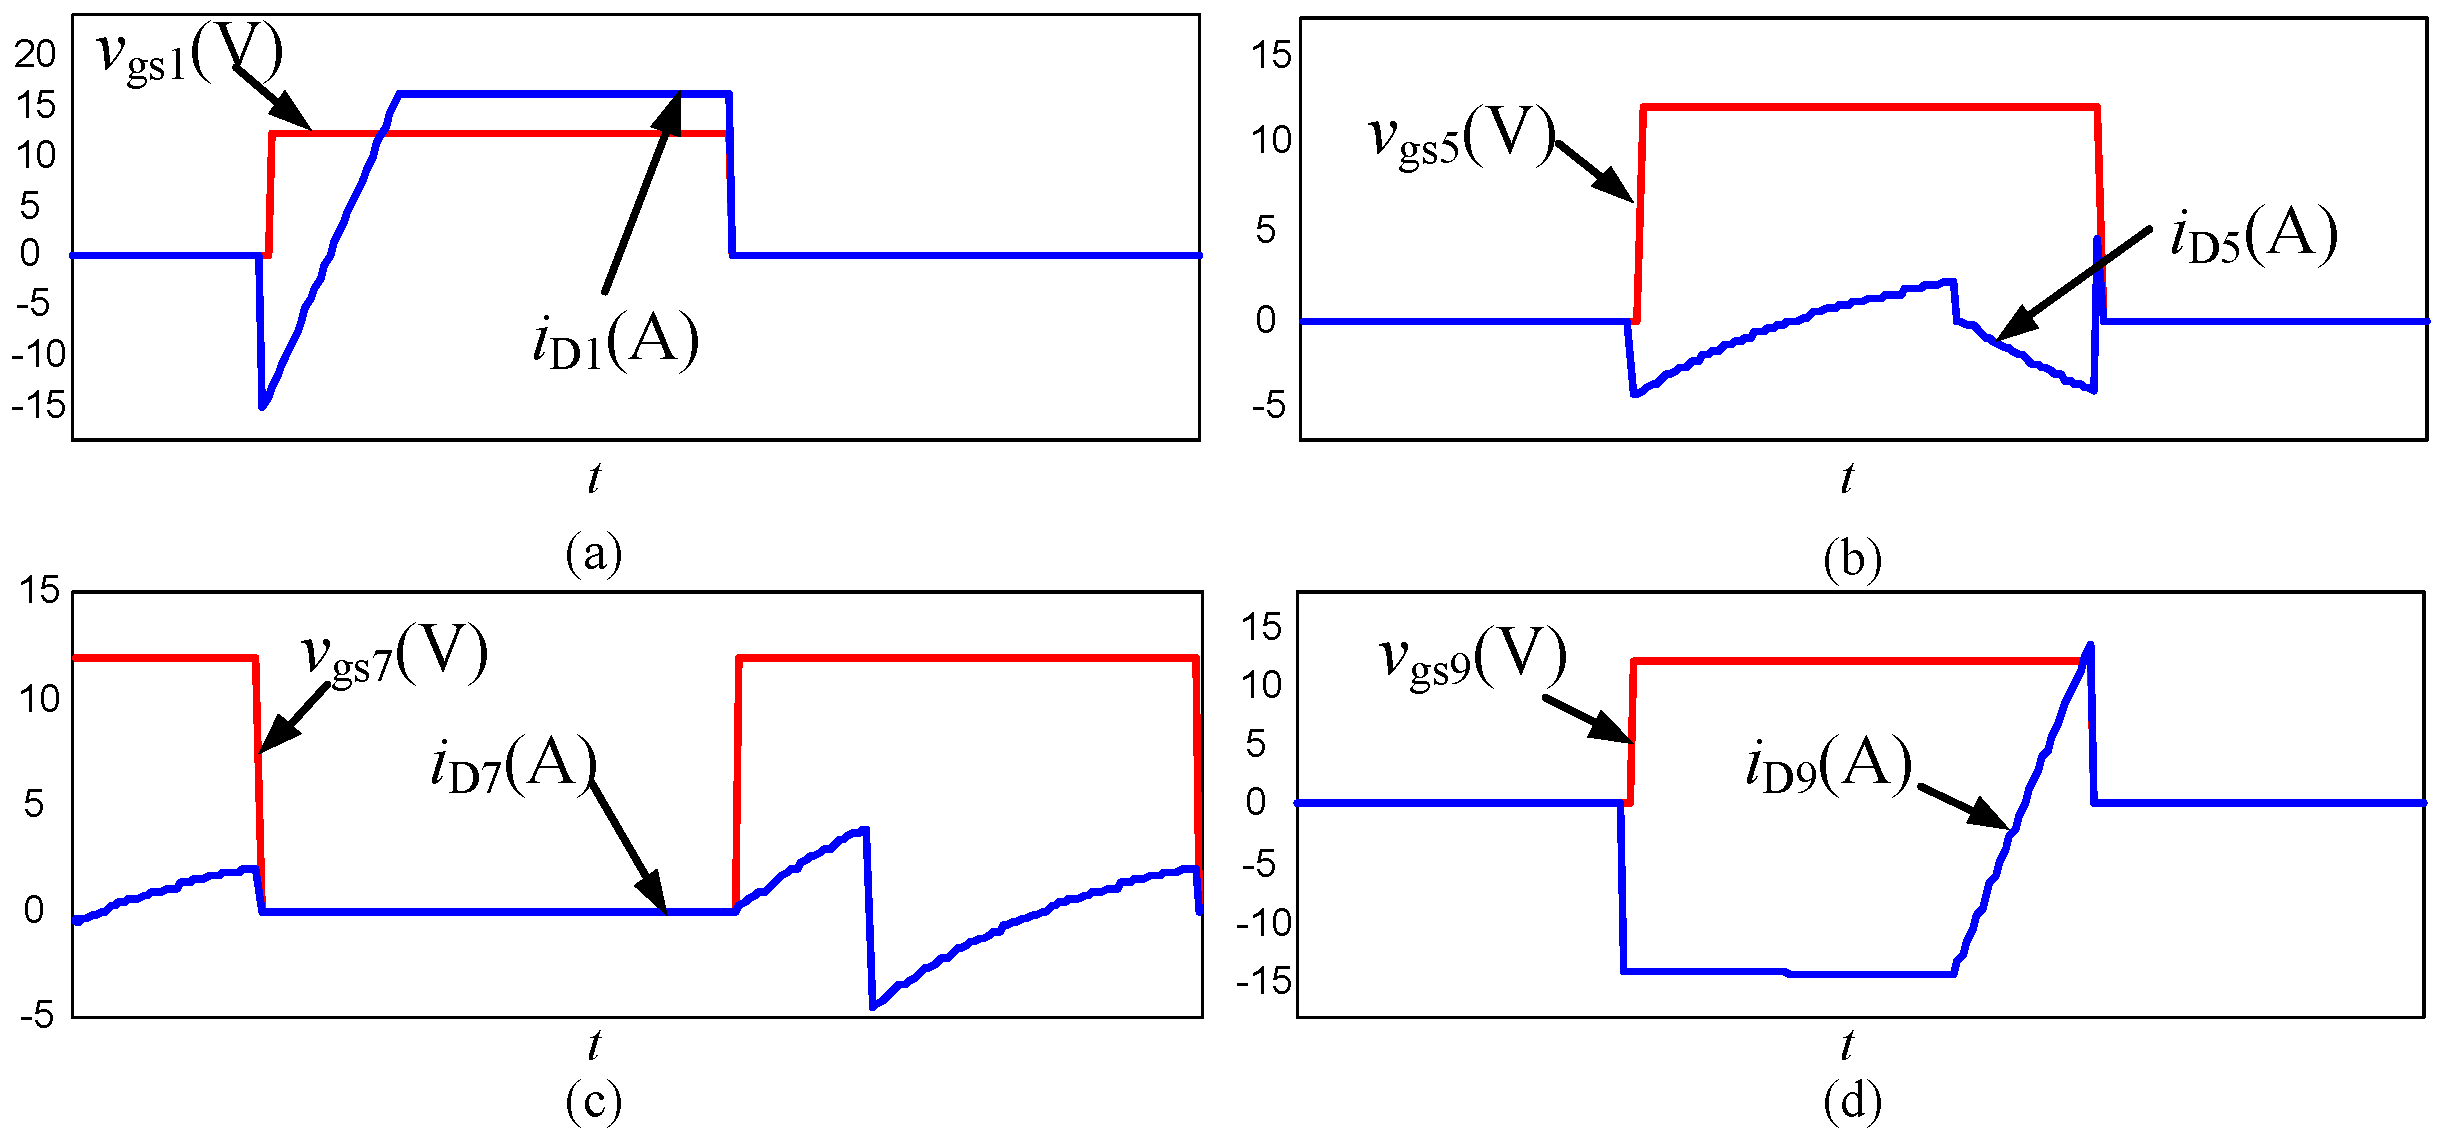
The idealized steady-state waveforms are shown in Figure 7. The ZVS conditions for each active component can be summarized as follows: when v1, v2, and v3 are at the rising edges, the corresponding currents i1, i2, and i3 are negative or zero, and when v1, v2, and v3 are at the falling edges, the corresponding currents are positive. Based on the current direction shown in Figure 7, the currents in the three ports are defined as: i1 = i13i21, i2 = i21i32, and i3 = i32i13.
The conditions for ZVS under SPS control are shown in Equation (9). Based on Equations (8) and (9), the simplified conditions are given in Equation (10).
{ i 1 ( 0 ) < 0 a n d i 1 ( π ) > 0 i 2 ( φ 2 ) < 0 a n d i 1 ( π + φ 2 ) > 0 i 3 ( φ 3 ) < 0 a n d i 3 ( π + φ 3 ) > 0
{ M 21 2 π + 2 M 31 φ 3 π M 31 π 2 φ 2 M 21 > π 2 φ 2 + π M 31 + 2 M 31 φ 2 2 M 31 φ 3 2 π M 21 2 φ 3 π + 2 π M 31 π + 2 φ 2 2 φ 3
Analogously, the conditions for ZVS under IDPS control are given in Equation (11). Based on Equations (8) and (11), the simplified conditions are then shown in Equation (12).
{ i 1 ( t 0 ) < 0 , i 1 ( t 4 ) > 0 i 2 ( t 2 ) < 0 , i 2 ( t 3 ) > 0 i 3 ( t 1 ) < 0 , i 3 ( t 5 ) > 0
{ M 21 2 π π M 31 + 2 M 31 φ 3 π 2 δ 2 M 21 π 2 ( φ 2 + δ 2 ) + π M 31 2 M 31 ( φ 2 + δ 2 ) + 2 M 31 φ 3 2 ( π 2 δ 2 ) M 21 π 2 δ 2 + 2 φ 2 + M 31 ( π + 2 φ 2 2 δ 2 2 φ 3 ) 2 ( π 2 δ 2 ) M 21 2 M 31 π + 2 M 31 φ 3 π π 2 δ 2
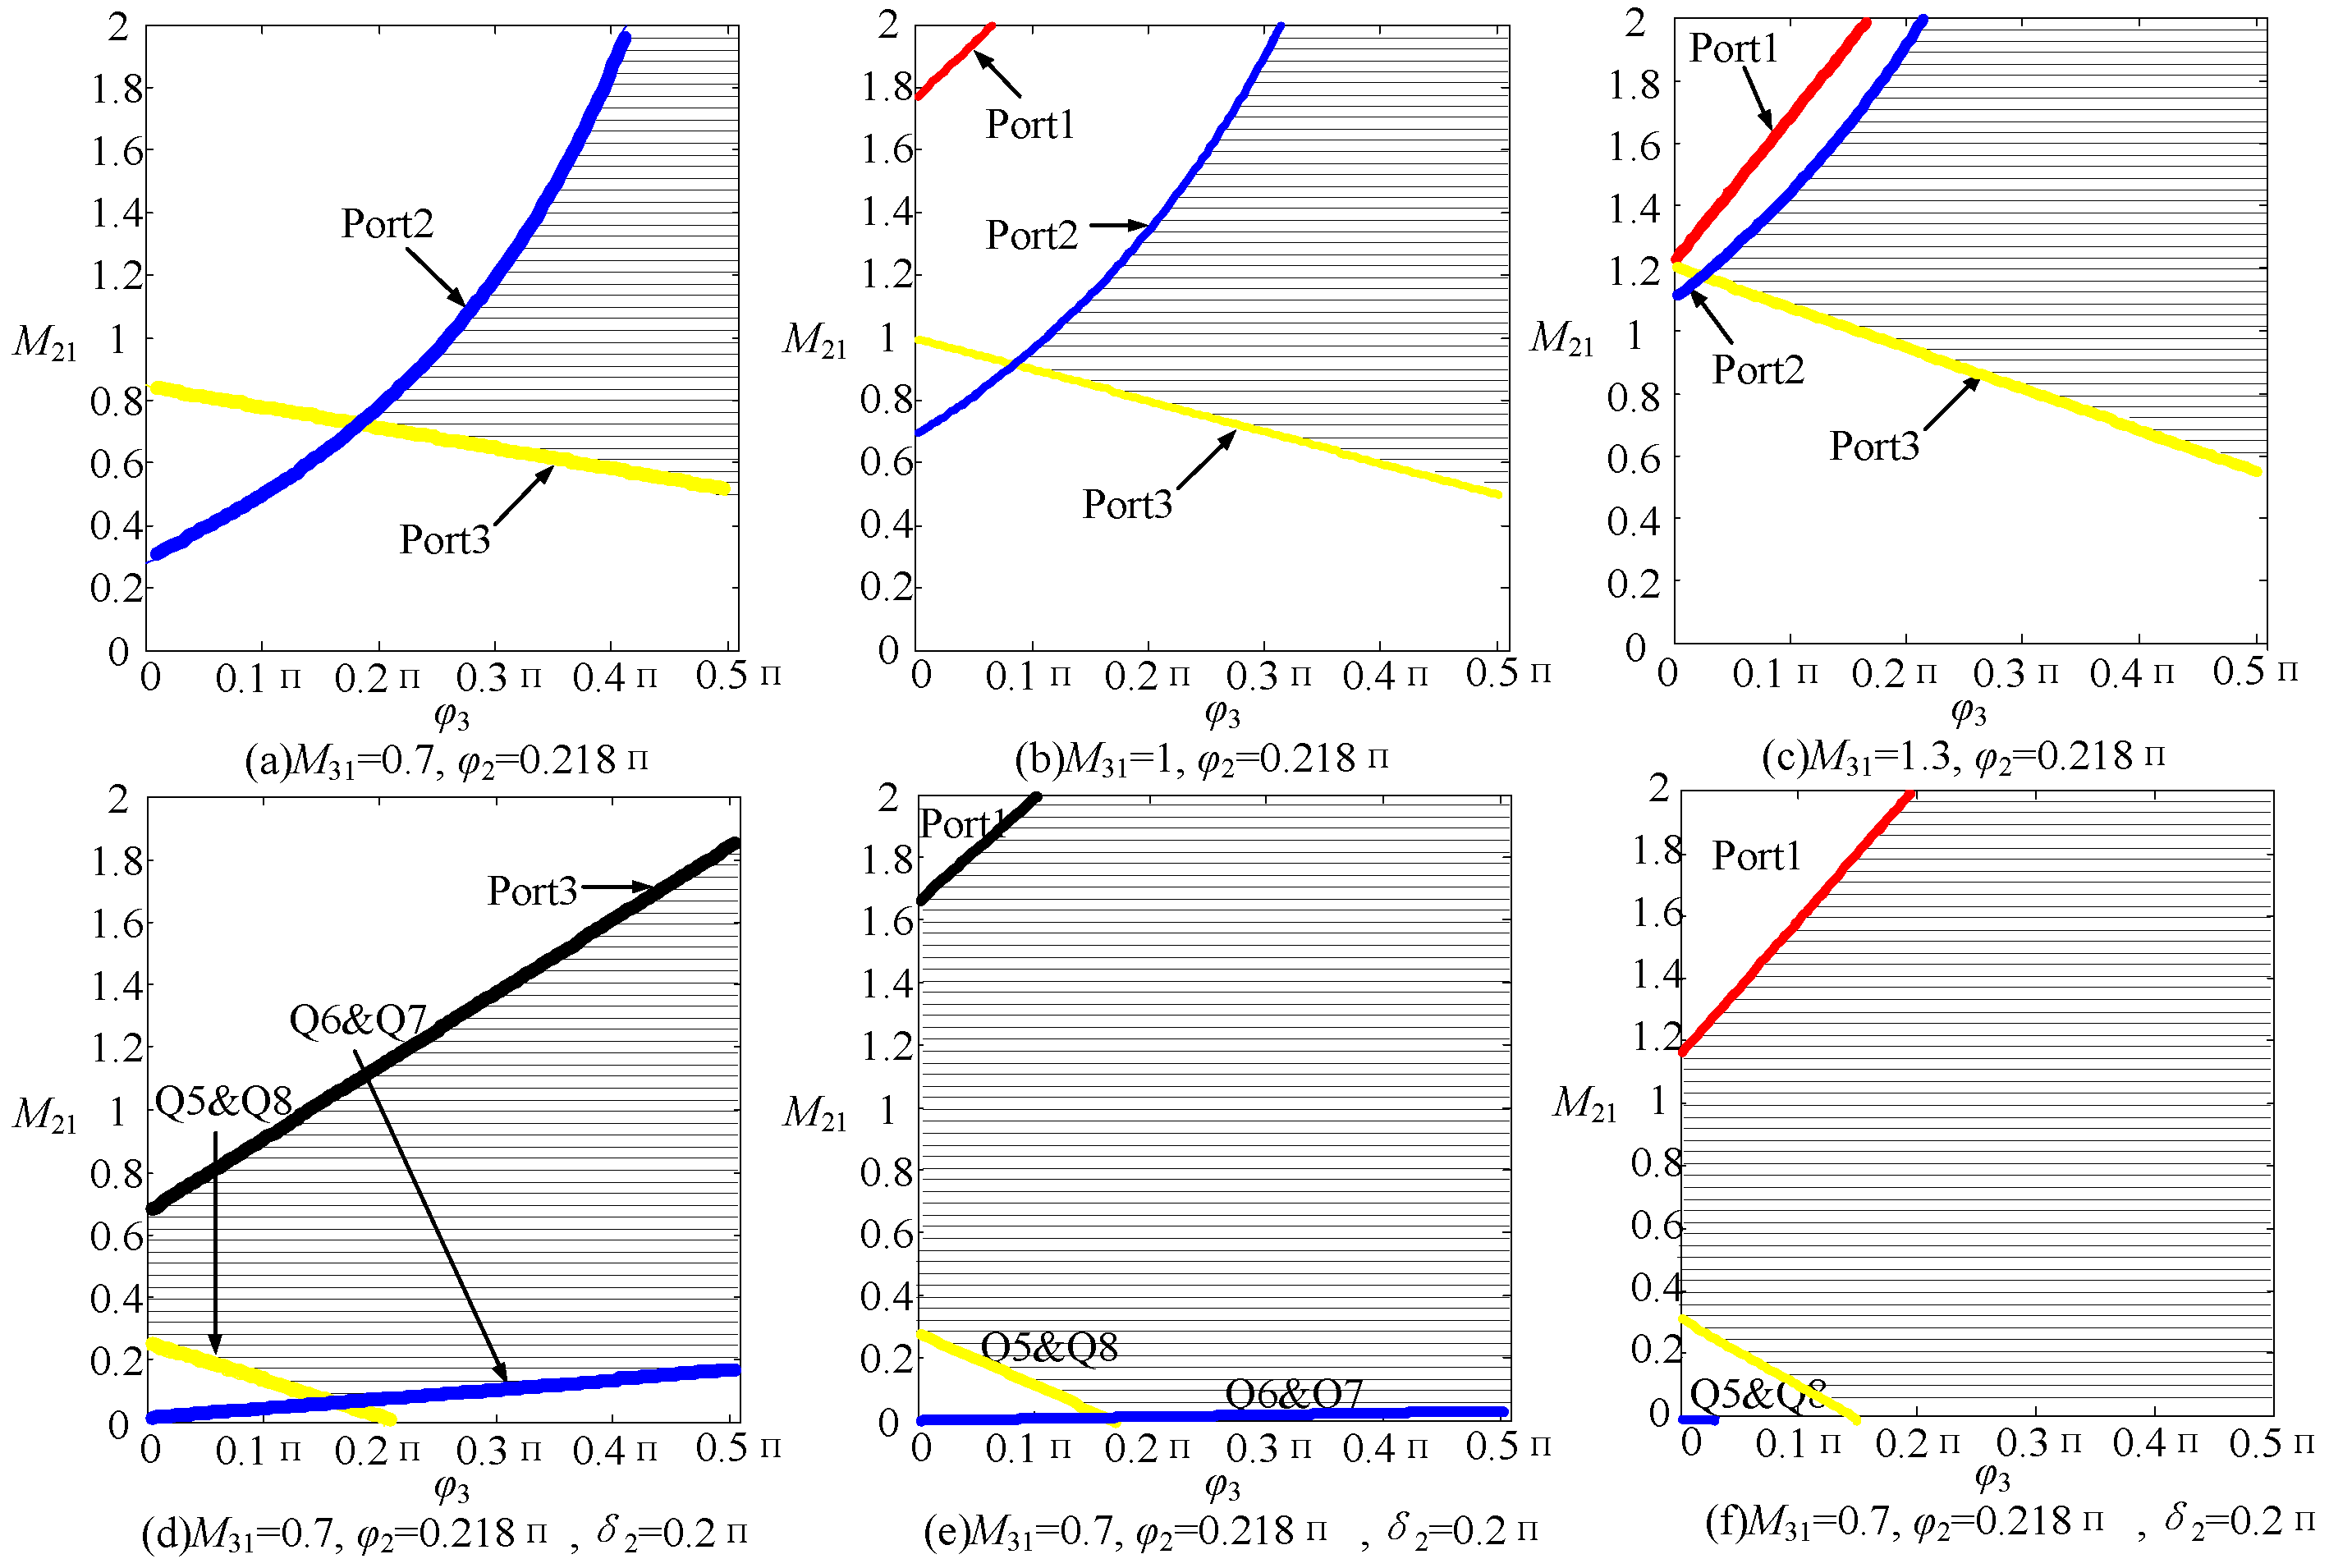
Under SPS control, the ZVS condition has a relationship with M21, M31, φ2 and φ3 that is based on Equation (10). This relationship is difficult to analyze, and thus we set M31 and φ2 at constant values to enable analysis of the relationship between M21 and φ3. The resulting relationship is shown in Figure 8a–c, based on Equation (10). Similarly, the ZVS condition has a relationship with M21, M31, φ2, φ3 and δ2 under IDPS control, and in this case, we set M31, δ2 and φ2 at constant values. The relationship between M21 and φ3 is shown in Figure 8d–f based on Equation (12). The scope of the shaded part indicates the ZVS region. The conditions for Port1–Port3 are also given.
According to Figure 8a–c, when φ2 is a constant, as the difference in absolute value between 1 and M31 becomes larger, then the ZVS range of the converter becomes smaller. To increase the efficiency of this converter, we set M31 to be equal to 1 under SPS control in this paper.
Similarly, we can obtain the same conclusion based on Figure 8d–f. The TAB can achieve its maximum ZVS range under IDPS control when M31 is equal to 1. When M31 is equal to 1, then according to Equations (2) and (7) and the condition that P21P32 = 0, we can obtain the same isolation conditions under both SPS control and IDPS control: 2φ2 = φ3. The ZVS region for SPS shown in Equation (10) and the ZVS region for IDPS shown in Equation (12) can be further simplified, as shown in Table 1.
Based on Table 1 and the IDPS limiting condition of φ2 < δ2, we can deduce the conclusion that the ZVS regions for Port1 and Port3 are expanded, while the region corresponding to Port2 is reduced. We therefore set M31 = 1. We still must select the appropriate values of M21, φ3 and δ2 to ensure not only that we meet the ZVS condition but also that we can achieve the minimum RMS current under a specific transmission power.

4.2. RMS Current Analysis and Comparison

To reduce the conduction losses, we need to minimize the RMS current. IDPS control can be adopted on Port2 on the basis of SPS control. By performing the RMS analysis, we can determine the appropriate phase shift angles and M21.
From an analysis of the ZVS region, we can determine that M21 = 1 and simplify, such that φ2 = 0.5φ3. The original analysis of five variables (M21, M31, φ2, φ3, δ2) is now reduced to an analysis of three (M21, φ3, δ2). The square of the RMS current of i2 under IDPS in isolation control is deduced based on Equations (3)–(7), as follows:
I 2 . rm s 2 = 1 π 0 π i 2 2 ( φ ) d φ = V 1 π L 2 ω 2 ( 1 3 M 21 2 π 3 4 M 21 2 δ 2 2 π + 16 3 M 21 2 δ 2 3 2 3 M 21 π 3 + M 21 φ 3 2 π + 4 M 21 δ 2 2 π 2 M 21 φ 3 2 δ 2 8 3 M 21 δ 2 3 + 1 3 π 3 φ 3 2 π + 2 3 φ 3 3 )
The transmission powers of Port1 and Port3 under IDPS in isolation control are deduced from Equation (7) as follows:
P 1 = P 3 = 4 V 1 2 π 3 f L [ sin ( φ 3 ) + M 21 cos δ 2 sin ( φ 3 / 2 ) ]
Analogously, the square of the RMS current of i2 under SPS in isolation control is deduced as follows:
I * 2 . rm s 2 = 1 π 0 π i 2 2 ( φ ) d φ = V 1 2 π L 2 ω 2 ( 1 3 M 21 2 π 3 2 3 M 21 π 3 + M 21 φ 3 2 π 1 3 M 21 φ 3 3 + 1 3 π 3 π φ 3 2 + 2 3 φ 3 3 )
The transmission powers of Port1 and Port3 under SPS in isolation control are deduced from Equation (2) as follows:
P * 1 = P * 3 = 4 V 1 2 π 3 f L [ sin ( φ 3 ) + M 21 sin ( φ 3 / 2 ) ]
P(p.u) and Irms(p.u) are the per unit values for SPS and IDPS, and are defined as shown in Equation (17), where Irms represents I2rms or I*2rms, P represents P1 or P*1, and K c 1 = V 1 π L ω ,   K c 2 = 4 V 1 π 3 f L .
I rms ( p . u ) = I rms K c 1 ;   P ( p . u ) = P K c 2
When the transmission power is constant, a smaller Irms means reduced conduction losses. The optimal values of M21, φ3, and δ2 under isolation control conditions can be determined using MATLAB based on the Lagrange equation shown in Equation (18), where P(p.u) represents the normalized transmission power and λ is the Lagrange multiplier. The objective function is I r m s 2 ( M 21 , δ 2 , φ 3 ) , and the constraint conditions are as follows: M21 ≥ 1; P(p.u)(M21, φ3, δ2) = P(p.u); and φ2 < δ2.
L ( λ , M 21 , δ 2 , φ 3 ) = I rms 2 ( M 21 , δ 2 , φ 3 ) + λ ( P ( p . u ) ( M 21 , δ 2 , φ 3 ) P ( p . u ) )
The minimum objective function can then be solved using the following conditions:
{ L ( λ , M 21 , δ 2 , φ 3 ) M 21 = 0 L ( λ , M 21 , δ 2 , φ 3 ) δ 2 = 0 L ( λ , M 21 , δ 2 , φ 3 ) φ 3 = 0 L ( λ , M 21 , δ 2 , φ 3 ) λ = 0
A group of equations for DPS that was derived from Equations (13), (14), (17)–(19) can then be given as follows:
{ 2 3 M 21 π 3 8 M 21 δ 2 2 π + 32 3 M 21 δ 2 3 2 3 π 3 + φ 3 2 π + 4 δ 2 2 π 2 φ 3 2 δ 2 8 3 δ 2 3 + λ cos δ 2 sin ( φ 3 / 2 ) = 0 8 M 21 2 δ 2 π + 16 M 21 2 δ 2 2 + 8 M 21 δ 2 π 2 M 21 φ 3 2 8 M 21 δ 2 2 λ M 21 sin δ 2 sin ( φ 3 / 2 ) = 0 2 M 21 φ 3 π 4 M 21 φ 3 δ 2 2 φ 3 π + 2 φ 3 2 + λ [ cos φ 3 + M 21 cos δ 2 cos ( φ 3 / 2 ) 2 ] = 0 sin ( φ 3 ) + M 21 cos δ 2 sin ( φ 3 / 2 ) P ( p . u ) = 0
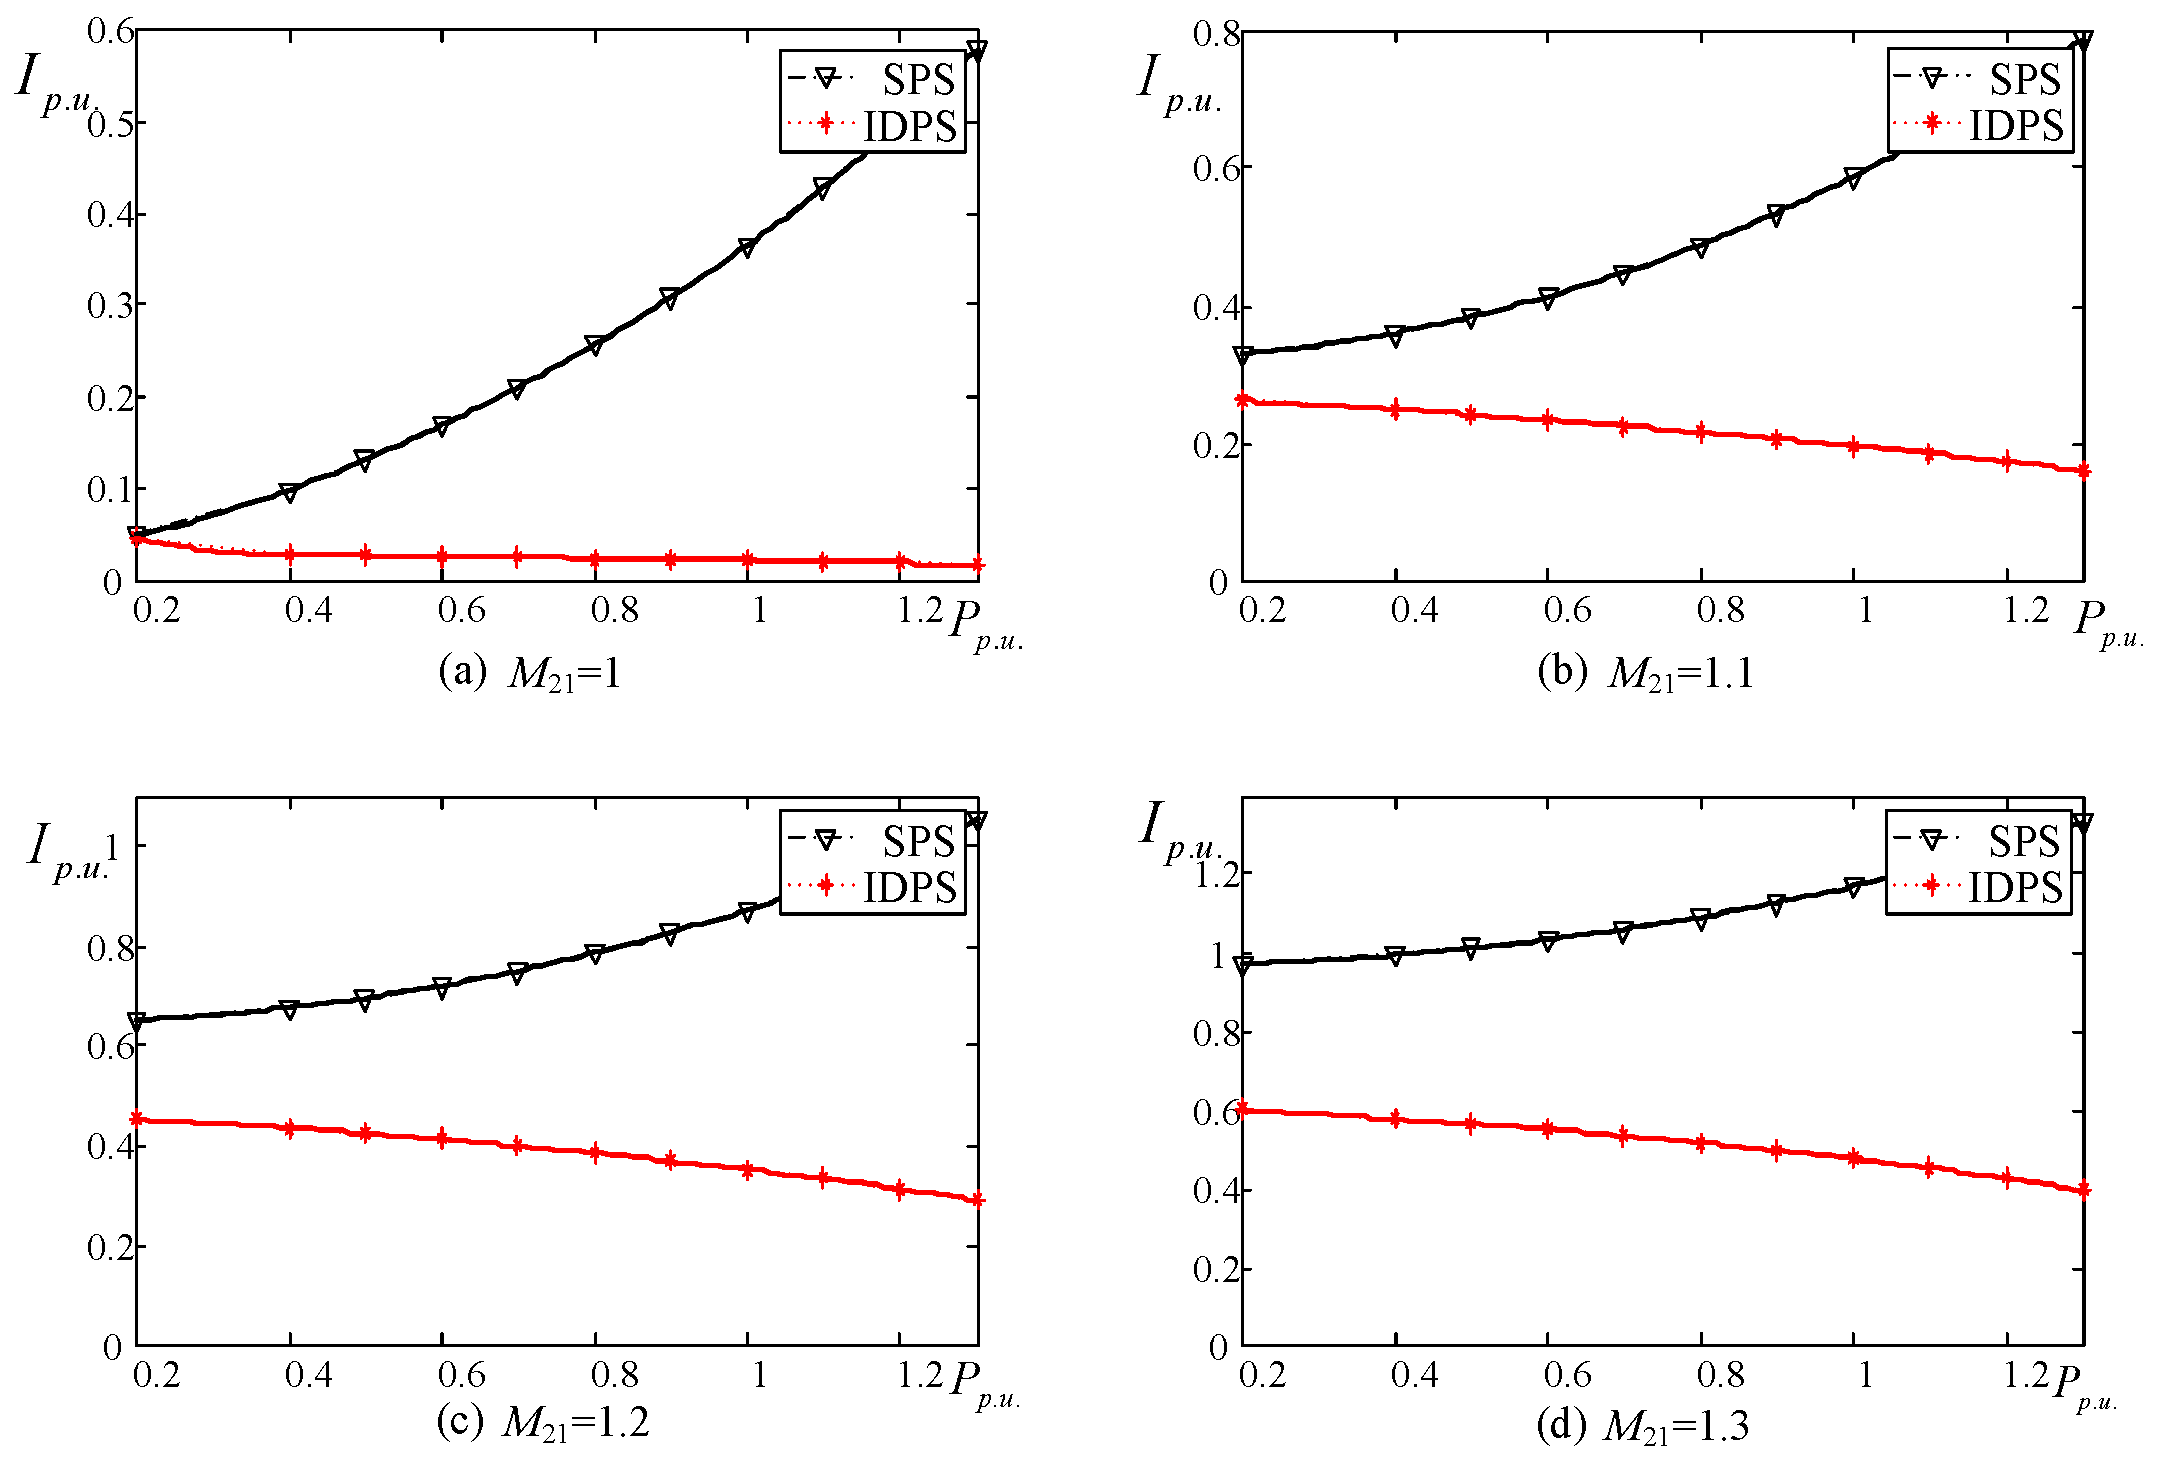
The relationship between the RMS current and the transmission power under the conditions of SPS and IDPS control is shown in Figure 9. From Figure 9, it can be seen that if M21≥1, IDPS control has a smaller RMS current than that of SPS control when the TAB transfers a fixed power. This conclusion is particularly obvious under the condition where M21 = 1. The RMS current of i2 under IDPS control decreases as the value of M21 becomes closer to 1. With an increase in the transmission power, the RMS current of i2 also increases. High transmission power also means that there will be a large phase-shift angle, and this large phase-shift angle means that there will be a high RMS current; thus, there is a positive correction among the transmission power, the phase-shift angles and the RMS current.
In the charging state, the maximum power rating is 3.5 kW, which is restricted by the limitations of household electricity. In the DC-DC state, the auxiliary battery receives power from the Li-ion battery, which has a power rating of 1.6–2.2 kW. For a specific car, the transmission power has a constant value. Because the transmission power in the EV is a constant value, we thus only need to determine the optimal parameters that mean that M21 = 1 and M31 = 1, without considering abnormal operation conditions.

5. Simulation and Experimental Results

5.1. Simulation Results

From the previous analysis, we know that IDPS control can not only achieve ZVS but also a minimum RMS current under isolation control. The phase shift angles under IDPS control can be determined using the MATLAB optimization algorithms of Equation (20). To verify the validity of these angles, a simulation based on the parameters of the Nissan Leaf is constructed using PSIM software. These parameters are shown in Table 2.
Because of the symmetry of the TAB, we can analyze Q1 of Port1 rather than Q1–Q4, Q5 of Port2 rather than Q5 and Q8, Q7 of Port2 rather than Q7 and Q6, and Q9 of Port3 rather than Q9–Q12. In Figure 10, the square wave vgs represents the drive signal of each active component; the other line, iD, represents the drain current of each active component. Because the drain current is negative or zero at the rising edges of the drive signal, DPS under isolation control is thus effective in achieving ZVS.
The steady-state waveforms of SPS and IDPS control are shown in Figure 11. v1, v’2, v’3, i1, i2, i3 and the instantaneous powers of Port1–Port3 are shown in Figure 11a,b. From the simulation results, we know that the transmission power of both Port1 and Port3 is 3.5 kW, while the transmission power of Port2 is zero. Isolation control can be achieved in both SPS control and IDPS control. From Figure 11a, the peak current of i2 is 178.8 A, the RMS current is 36.6 A, and the reactive power of Port2 is 472 W. Excessive peak currents have a negative effect on the switching devices and excessive RMS currents will increase the system losses and reduce system efficiency. From Figure 11b, the peak current of i2 is 4.3 A, which is 2% of the SPS condition, the RMS current of i2 is only 1.7 A, which is 4.6% of the SPS condition, and the reactive power of Port2 is only 15.32 W. The effectiveness of IDPS control in achieving ZVS and a minimum RMS current under isolation control conditions is validated by the simulations. From Figure 12, when the load is changed from 35 Ω to 30 Ω at 0.25 s, the Port3 output voltage V3dc, output current I3dc and leakage inductance current i3 reach a new stable state after a short transient process.

5.2. Experimental Results

To verify that the performance of IDPS is better than that of SPS, a small-scale prototype based on DSP28335 is constructed. The experimental prototype is shown in Figure 13. The main parameters of the TAB are as follows: V1 = 48 V, V’2DC = 12 V, V’3DC = 48 V, L1 = 150 μH, L’2 = 10 μH, L’3 = 180 μH, fs = 20 kHz, and n1:n2:n3 = 4:1:4. The transaction power between Port1 and Port3 is 50 W. The steady-state waveforms of v1, v’2, v’3, i1, i2 and i3 on Port1-Port3 are shown in Figure 14.
The phase shift angles can be obtained under SPS and IDPS conditions using the analysis of section IV.B. As shown in Figure 15a, P1 = 54.62 W, P2 = 1.31 W, and P3 = 49.25 W under SPS control. As shown in Figure 15b, P1 = 53 W, P2 = 3.35 W, and P3 = 51 W under IDPS control. In the experiments, a constant voltage can be maintained in Port2. By taking the power loss and core loss into consideration, isolation control of Port2 can be achieved.
The experimental waveforms in Figure 14 and Figure 15 are similar to the simulated waveforms shown in Figure 11. The feasibility of isolation under DPS control is verified. The main advantages of IDPS over SPS are the low peak current and RMS current characteristics under isolation control. From Figure 14 and Figure 15, the RMS current and the peak current of the leakage inductance under IDPS control are 0.4 A and 0.5 A, respectively, and are thus much smaller than the corresponding values of 1.5 A and 3.75 A obtained under SPS control.
Additionally, the ZVS condition can be achieved under IDPS control. As shown in Figure 16, the currents are negative at the falling edges of the voltages.

6. Conclusions

A battery charger and a DC-DC converter are essential components of EVs. This paper gives a brief introduction to the use of a TAB converter working as a combined charger and the use of SPS control to achieve isolation control. The IDPS control strategy is first applied to isolation control. Based on mathematical models and simulations, some of the features of the strategy can be summarized as follows. Optimal parameters are given based on considerations of ZVS and the RMS current. DPS control can not only achieve ZVS but also provides a larger ZVS region than SPS control. IDPS control has a smaller RMS current and peak current than TPS control when the TAB is working at a fixed power. The experimental waveforms are similar to the simulated waveform, and thus the feasibility of DPS under isolation control is verified.

Acknowledgments

This research work was supported by the National Science Foundation of China [grant number 51577109]; and the Shandong Provincial Natural Science Foundation [grant number ZR2015EM050].

Author Contributions

Zhixiang Ling and Hui Wang proposed the idea, designed the method and wrote the paper; Kun Yan and Jinhao Gan performed the experiments and verified the validity of the method.

Conflicts of Interest

The authors declare no conflict of interest.

References

  1. Solero, L.; Lidozzi, A.; Pomilio, J.A. Design of multiple-input power converter for hybrid vehicles. IEEE Trans. Power Electron. 2005, 20, 1007–1016. [Google Scholar] [CrossRef]
  2. Lai, C.M.; Yang, M.J. A high-gain Three-Port power converter with fuel cell, battery sources and stacked output for hybrid electric vehicles and DC-microgrids. Energies 2016, 9, 180. [Google Scholar] [CrossRef]
  3. Kim, S.Y.; Jeong, I.; Nam, K.; Song, H.S. Three-port full bridge converter application as a combined charger for PHEVs. In Proceedings of the Vehicle Power and Propulsion Conference, Dearborn, MI, USA, 7–10 September 2009.
  4. Tao, H.; Kotsopoulos, A.; Duarte, J.L. Multi-input bidirectional DC-DC converter combining dc-link and magnetic-coupling for fuel cells systems. In Proceedings of the Industry Applications, Hong Kong, China, 2–6 October 2005.
  5. Yilmaz, M.; Krein, P.T. Review of battery charger topologies, charging power levels, and infrastructure for plug-in electric and hybrid vehicles. IEEE Trans. Power Electron. 2013, 28, 2151–2169. [Google Scholar] [CrossRef]
  6. Wang, Z.; Chu, K.; Liu, B.; Cheng, M. Three-port high-frequency transformer based current-source electric drive system for hybrid electric vehicles. In Proceedings of the Magnetics, Beijing, China, 11–15 May 2015.
  7. Capasso, C.; Veneri, O. Experimental study of a DC charging station for full electric and plug in hybrid vehicles. Appl. Energy 2015, 152, 131–142. [Google Scholar] [CrossRef]
  8. Sayed, K.; Gabbar, H.A. Electric Vehicle to Power Grid Integration Using Three-Phase Three-Level AC/DC Converter and PI-Fuzzy Controller. Energies 2016, 9, 532. [Google Scholar] [CrossRef]
  9. Kim, S.Y.; Song, H.S.; Nam, K. Idling port isolation control of three-port bidirectional converter for EVs. IEEE Trans. Power Electron. 2012, 27, 2495–2506. [Google Scholar] [CrossRef]
  10. Michon, M.; Duarte, J.L.; Hendrix, M.; Simoes, M.G. A three-port bi-directional converter for hybrid fuel cell systems. In Proceedings of the Power Electronics Specialists Conference, Aachen, Germany, 20–25 June 2004.
  11. Tao, H.; Kotsopoulos, A.; Duarte, J.L.; Hendrix, M. Design of a soft-switched three-port converter with DSP control for power flow management in hybrid fuel cell systems. In Proceedings of the 2005 European Conference on Power Electronics and Applications, Dresden, Germany, 11–14 September 2005.
  12. Wang, Z.; Liu, B.; Zhang, Y.; Cheng, M. The chaotic-based control of three-port isolated bidirectional DC/DC converters for electric and hybrid. Energy 2016, 9, 83. [Google Scholar] [CrossRef]
  13. Tao, H.; Kotsopoulos, A.; Duarte, J.L.; Hendrix, M. A Soft-switched Three-Port Bidirectional Converter for Fuel Cell and Supercapacitor Applications. In Proceedings of the Power Electronics Specialists Conference, Recife, Brazil, 12–16 June 2005.
  14. Zhao, C.H. Isolated Three-port Bidirectional DC-DC Converter. Ph.D. Thesis, ETH university, Zurich, Switzerland, 2010. [Google Scholar]
  15. Bai, H.; Nie, Z.; Mi, C.C. Experimental comparison of traditional phase-shift, and model-based control of isolated bidirectional DC-DC converters. IEEE Trans. Power Electron. 2010, 25, 1444–1449. [Google Scholar] [CrossRef]
  16. Zhao, B.; Song, Q.; Liu, W.H. Power characterization of isolated bidirectional dual-active-bridge DC-DC converter with dual-phase-shift control. IEEE Trans. Power Electron. 2012, 27, 4172–4176. [Google Scholar] [CrossRef]
  17. Zhao, B.; Yu, Q.G.; Sun, W.X. Extended-phase-shift control of isolated bidirectional DC-DC converter for power distribution in micro-grid. IEEE Trans. Power Electron. 2012, 27, 4667–4680. [Google Scholar] [CrossRef]
  18. Zhao, B.; Song, Q.; Liu, W. Efficiency characterization and optimization of isolated bidirectional DC-DC converter based on dual-phase-shift control for DC distribution application. IEEE Trans. Power Electron. 2013, 28, 1711–1727. [Google Scholar] [CrossRef]
  19. Rodriguez, A.; Vazquez, A.; Lamar, D.G. Different purpose design strategies and techniques to improve the performance of a dual active bridge with phase-shift control. IEEE Trans. Power Electron. 2015, 30, 709–804. [Google Scholar] [CrossRef]
  20. Song, X.; Xiao, J.; Niu, J.R.; Li, W.H.; Sun, H.W. A three-port DC-DC converter with phase shift control for the hybrid renewable energy generation system. Electr. Mach. Control 2015, 30, 36–44. [Google Scholar]
  21. Zheng, W.; Kai, C.; Bing, Z.; Yue, Z. Three-port bidirectional DC/DC converter with duty cycle and phase-shifting control. Electr. Mach. Control 2015, 19, 81–87. [Google Scholar]
  22. Jiang, Y.J. Optimal Idling Control Strategy for Three-Port Full-Bridge Converters. Master's Thesis, Nanjing University of Aeronautics and Astronautics, Nanjing, China, 2014. [Google Scholar]
  23. Bai, H.; Mi, C. Eliminate reactive power and increase system efficiency of isolated bidirectional dual-active-bridge DC-DC converters using novel dual-phase-shift control. IEEE Trans. Power Electron. 2008, 23, 2905–2914. [Google Scholar] [CrossRef]
  24. Zhao, C.H.; Round, S.D.; Kolar, J.W. An isolated three-port bidirectional DC-DC converter with decoupled power flow management. IEEE Trans. Power Electron. 2008, 23, 2443–2453. [Google Scholar] [CrossRef]
Figure 1. Different types of three-port active bridge (TAB): (a) DC link interfacing (DI); (b) Magnetic couple interfacing (MI).
Energies 09 00715 g001
Figure 2. Different power transmission type in three-port active bridge (TAB).
Energies 09 00715 g002
Figure 3. Structure of electric vehicle (EV) charging system.
Energies 09 00715 g003
Figure 4. Three-port active bridge (TAB) for electric vehicles (EVs) as a combined charger.
Energies 09 00715 g004
Figure 5. Simplified fundamental equivalent circuit of three-port active bridge (TAB) (a) Y-type primary referred circuit; (b) △-type primary referred circuit.
Energies 09 00715 g005
Figure 6. Vector diagrams for the charging mode.
Energies 09 00715 g006
Figure 7. Idealized steady-state waveforms under isolation control. (a) Single phase shift (SPS) control; (b) Dual phase shift (DPS) control.
Energies 09 00715 g007
Figure 8. The scope of zero-voltage-switching (ZVS) corresponding to different M31 (a)–(c) Different parameters under single phase shift (SPS) control; (d)–(f) Different parameters under dual phase shift (DPS) control.
Energies 09 00715 g008
Figure 9. The RMS current of i2 in single phase shift (SPS) control and DPS control (a) M21 = 1; (b) M21 = 1.1 (c) M21 = 1.2 (d) M21 = 1.3.
Energies 09 00715 g009
Figure 10. The zero-voltage-switching (ZVS) of different active devices under improved dual-phase-shift (IDPS) control: (a) Q1 of Port1; (b) Q5 of Port2; (c) Q7 of Port2; (d) Q9 of Port3.
Energies 09 00715 g010
Figure 11. The steady-state waveforms of isolation control: (a) Single phase shift (SPS) control; (b) Improved dual-phase-shift (IDPS) control.
Energies 09 00715 g011
Figure 12. Waveforms of Port3 output voltage, output current and leakage current.
Energies 09 00715 g012
Figure 13. Photo of the experimental prototype.
Energies 09 00715 g013
Figure 14. Experimental waveforms of isolation control. (a) AC voltage of each port under single-phase-shift (SPS) control; (b) AC current of each port under single phase shift (SPS) control; (c) AC voltage of each port under improved dual-phase-shift (IDPS) control; (d) AC current of each port under improved dual-phase-shift (IDPS) control.
Energies 09 00715 g014
Figure 15. Experimental waveforms of isolation control: (a) Instantaneous power of each port under Single phase shift (SPS) control; (b) Instantaneous power of each port under improved dual-phase-shift (IDPS) control.
Energies 09 00715 g015
Figure 16. The steady-state waveforms of Port1–Port3.
Energies 09 00715 g016
Table 1. Zero-voltage-switching (ZVS) regions of single phase shift (SPS) and improved dual-phase-shift (IDPS) control.
PortsSPS ControlIDPS Control
Port1 M 21 π + 2 φ 3 π φ 3 M 21 π + 2 φ 3 π 2 δ 2
Port2 M 21 π φ 3 π M 21 1
Port3 M 21 π + 2 φ 3 π φ 3 M 21 π + 2 φ 3 π 2 δ 2
Table 2. Parameters of Nissan Leaf.
ParametersValue
V1(V)311
V2DC(V)13
V3DC (V)350
Output power (KW)3.5
Inductor L1 (uH)72.8
Inductor L’2 (uH)0.13
Inductor L’3 (uH)90.18
n1:n2:n310:0.45:11.3
Load(Ω)35
Switching frequency (KHz)20

