1. Introduction
Mediterranean cities base most of their appeal on the presence of sun. A mild climate, together with a number of days with clear skies [
1,
2], brings about an appropriate environment to make the most of radiation. Many countries located at northern latitudes cannot take advantage of this resource and, consequently, the management of this energy is of great importance for them. On the other hand, the situation in southern latitudes is the opposite because the number of hours with direct sunlight and its intensity are more than is necessary [
3]. Therefore, the abundance of radiation is a double-edged sword. The existence of direct sun implies different types of radiation, as the spectral emission diagram of the sun shows. Most of the spectrum is made up of visible light, but an important percentage is composed of ultraviolet (UV) and infrared (IR) waves. The excess of UV or IR radiation involves health and thermal effects [
4,
5,
6] on both people and the environment. In the case of cities, the consequences of long-wave radiation can be positive to put into practice solar passive systems [
6]. On the other hand, an excess of this type of radiation, among other aspects, can increase the effects of urban heat island (UHI) as proved by the studies on urban climate [
7,
8,
9,
10,
11]. While the consequences of UV and IR radiation are not the object of this study, it is important to consider that they necessarily coexist with daylight.
When analyzing the energy demand of buildings, it is noticed that artificial lighting involves a significant share of the total demand [
12]. The study of daylight, through parameters such daylight factor (DF), provides information about the expected distribution and amount of light inside buildings as a percentage of the illuminance available outside [
13,
14,
15]. Apart from this, in Mediterranean countries, where the illuminance in a horizontal surface outside can be as high as 100,000 lux [
3] and considering a window-to-wall factor of up to 30%, the luminous flux entering the building can reach a noteworthy value. Despite that, too often the illuminance reached inside is under this value or the artificial lighting is switched on, even in sunny periods. On this basis, the question is clear: is it necessary to spend so much energy on lighting in entrance areas when the light level in the street is far more than enough?
The situation at the entrance of buildings is particularly representative in that sense [
16]. There, the contact with the city is direct and the possibility to benefit from daylight and even direct sunlight is easy to reach. Nevertheless, if a minimum comfort or visual performance is not reached it is required to resort to other means, such as an extensive use of artificial lighting. The overuse of lighting just after the entrance can be explained by the visual adaptation process [
17,
18,
19]. The coexistence of high and low values of illumination is critical when passing consecutively from one situation to the another, as happens in entrance areas. The visual system in this state has a few seconds to adapt from a hundred thousand lux to a few hundred, instead of the few minutes required for complete vision [
20]. As a consequence, the user suffers a kind of sudden blindness inside which reduces his quality of vision for a short time. This effect is usually compensated with artificial lighting. Another aspect to consider is the direction of movement. It influences visual performance, as adaptation is faster when going out of the building, from lower to higher energy levels, than the opposite [
21]. In the work presented here the entrance direction is studied, as it is the most critical situation in terms of vision.
In fact, the adaptation process in the transition zone is a matter of contrast. In broad terms, it is defined by the difference between the luminosity of the city and the luminosity of the interior, which determine the quality of vision when entering a building. The comparison between both situations through the visual scenes before and during the transition provides an idea of the expected visual performance inside. One of the main objectives of this work is to compare both situations and connect them with the transition.
The transition zone has been studied from the thermal point of view [
22,
23,
24,
25] as an intermediate comfort area. The thermal requirements of users in this zone seem to be halfway between inside and outside and are more flexible than the requirements in static areas. In terms of visual comfort, the conception of it as a dynamic space determines the characteristics of the elements along the way [
26] as well as other parameters related to daylight, such as the modelling factor [
27].
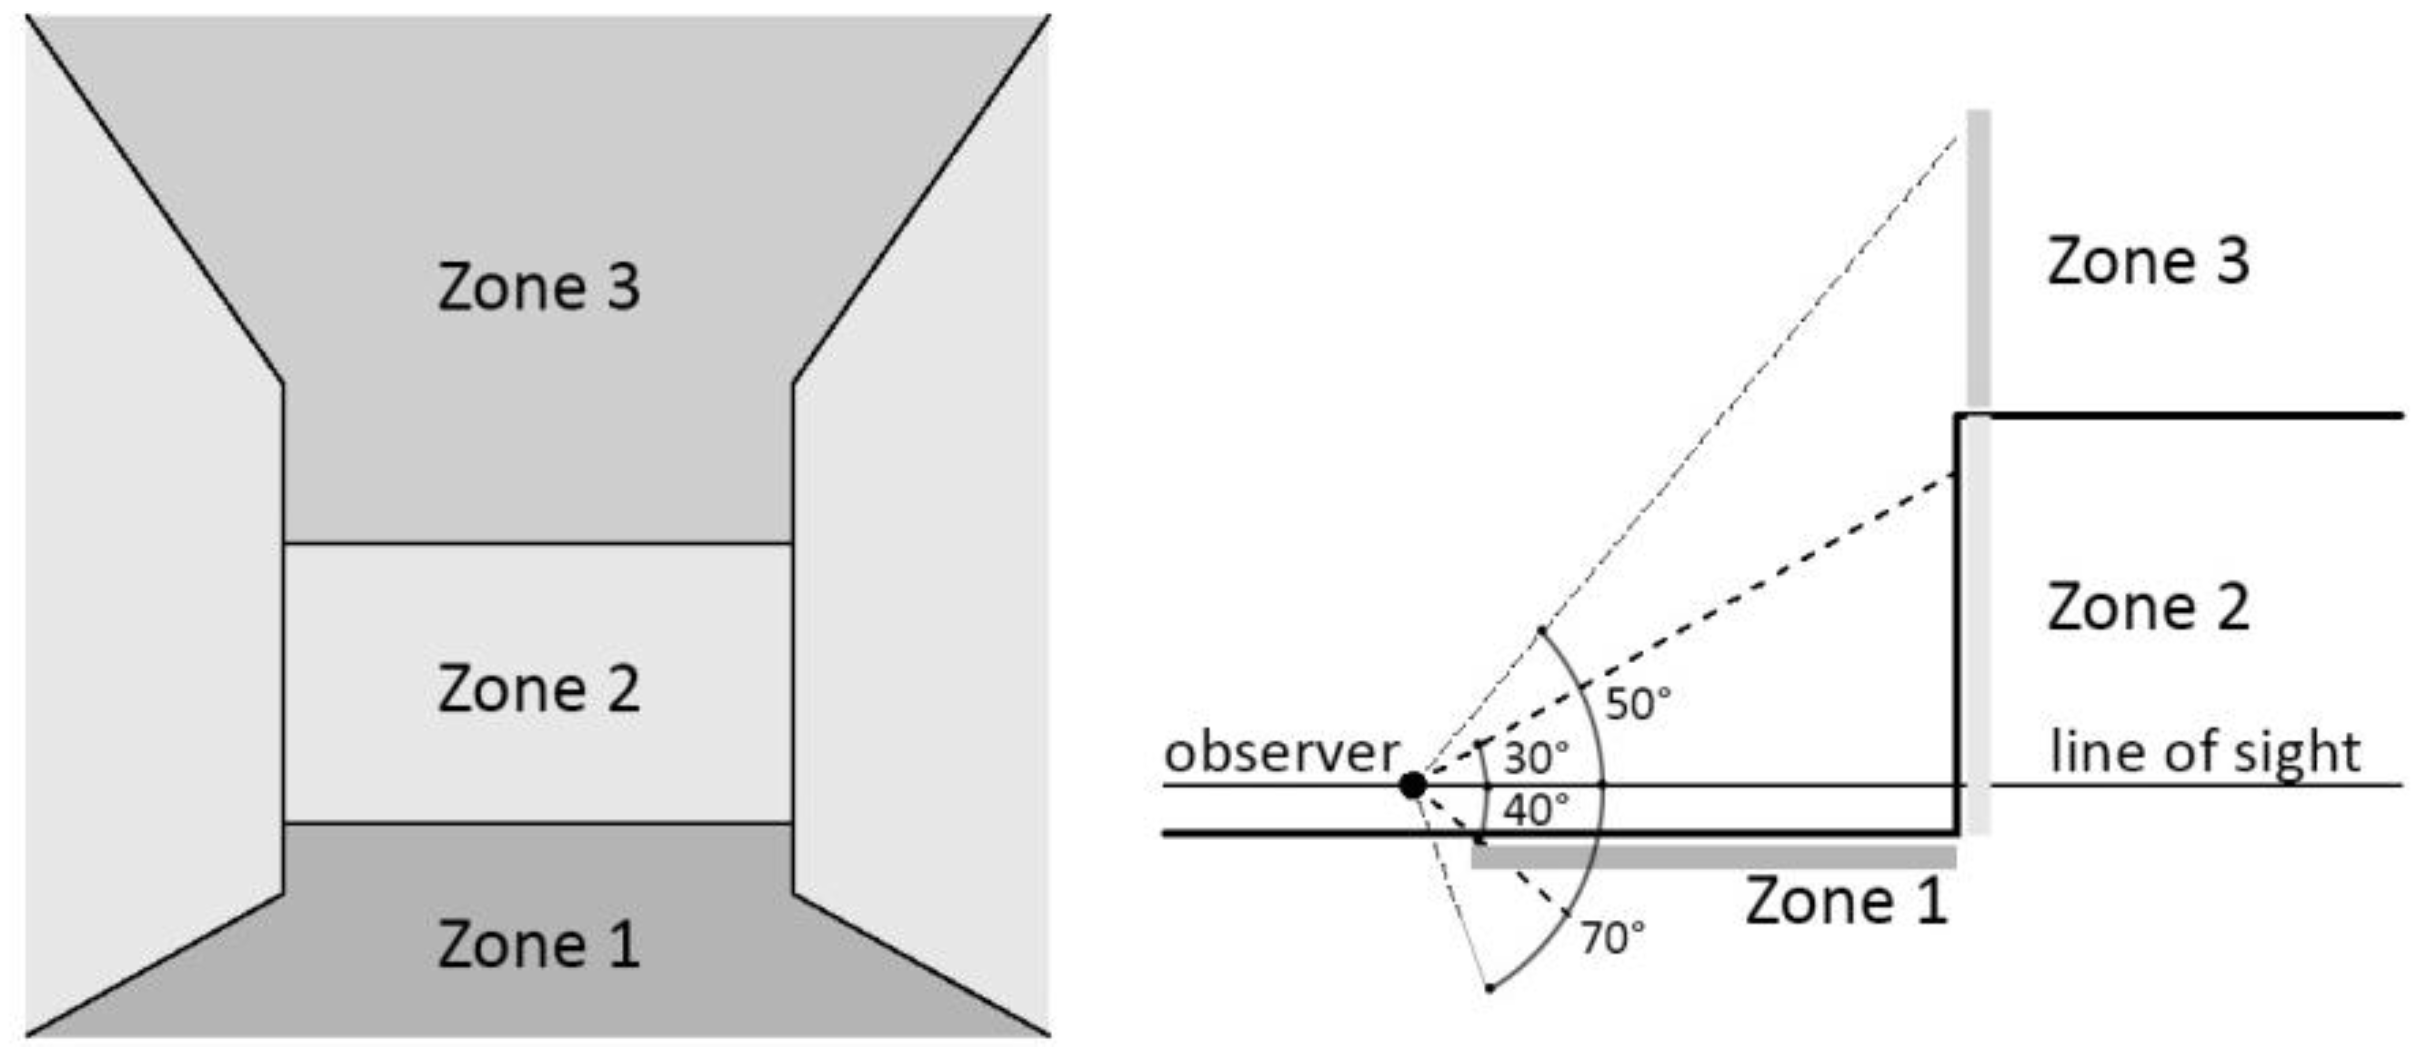
As the aim of this research is to assess visual contrast in transit, the parameters to study were illuminance and luminance from the surfaces within the visual scene. But first, the analysis of urban landscape was set out in terms of geometry, in a way that could be compared with the scene inside. In order to simplify the cases, a three-zone division of the scene, which is explained in the Results section, was laid out. In each zone, the parameters illuminance and luminance were measured. Horizontal and vertical illuminance informs about sunlight reaching the surfaces, though luminance offers better information about the appearance of surfaces. Luminance, or brightness if we strictly refer to perception [
17], determines the luminosity of the visual scene as a composition of surfaces with different brightness. In urban landscapes, in addition, light and shadow are the principal source of contrast within a scene. A characteristic of direct radiation is that it is a source of high contrast, which puts the visual system to the test. Apart from this, sunlight is featured by a common occurrence of sun patches, clearly present in urban landscapes but also having great impact indoors [
28]. The analysis of daylight in urban and interior scenes, along with their distribution, offers an approach to the contrast caused by a strong incidence of sunlight in Mediterranean cities.
3. Discussion
The results obtained from luminance and illuminance measurements offer useful information about the expected contrast during the transition from the exterior environment of the Mediterranean city to the interior of the building. As the fieldwork was carried out during a high radiation period (summer, near noon), the values show an expected extreme contrast, either between light and shade points on urban surfaces or between inside and outside.
Before discussing the results in terms of light values, a reflection on the composition of the visual field is needed. The analysis of street-view and interior scenes has proved that the top, covered by the sky vault or the ceiling, has little importance in the whole scene. It is for that reason that pavements, together with the main vertical surfaces, require the maximum attention in the project design.
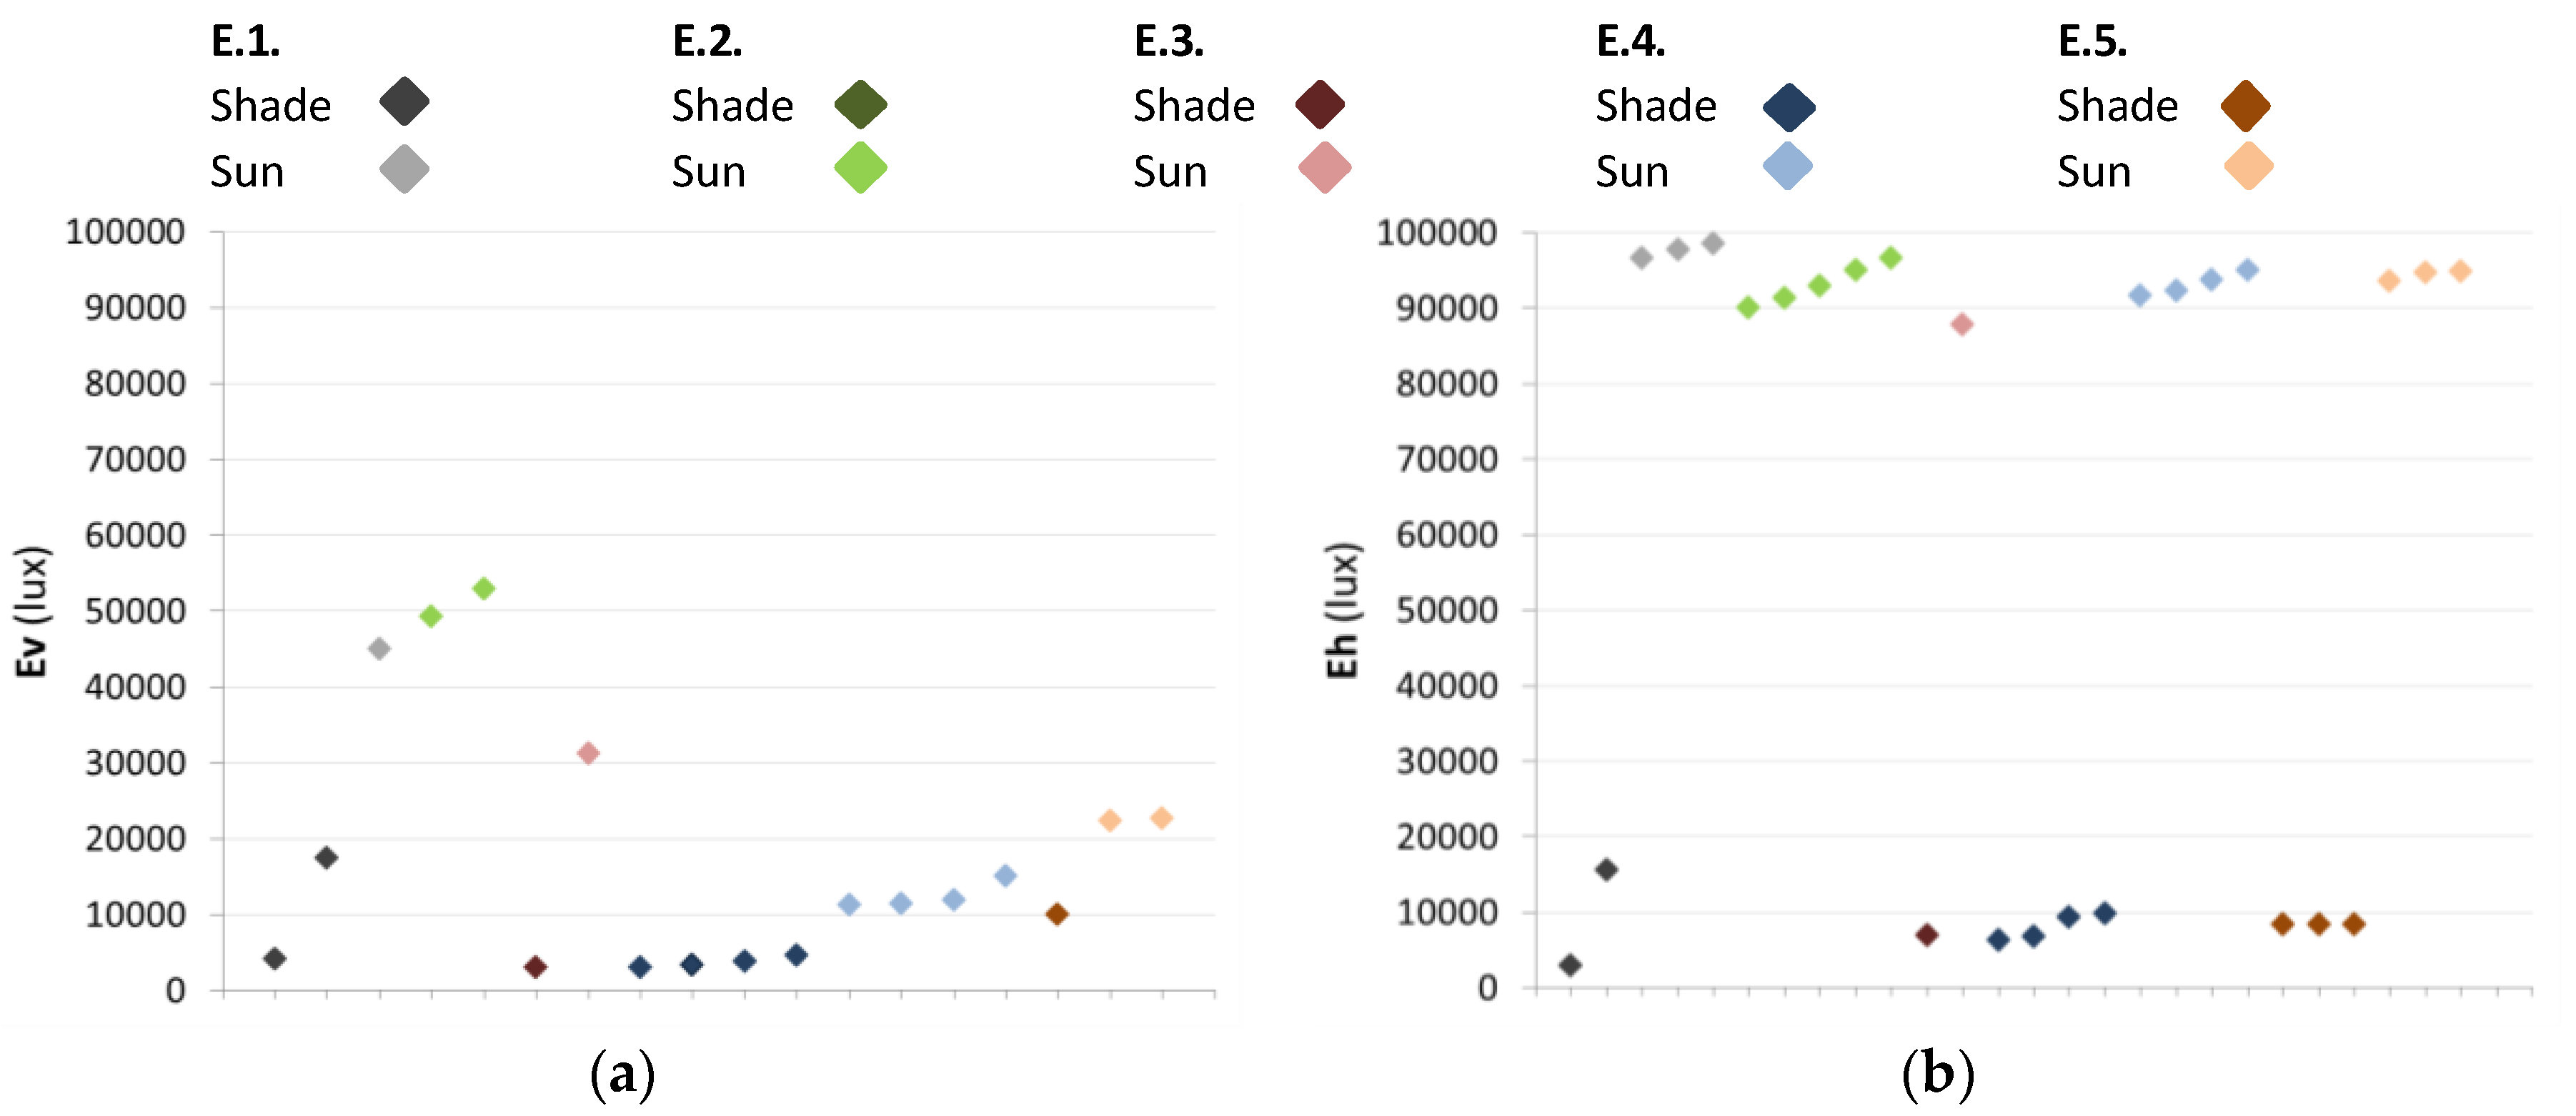
If we focus on the illuminance results measured in the middle and the bottom of the urban visual scene (
Figure 2a,b), it is noticeable that the higher contrast is on pavements. Indeed, there is a clear difference between the quantity of light reaching sunny and shaded points in street pavements; this difference is about 10:1. Illuminance (
EH) on street pavement reaches as high as 95,000 lux, next to the reference value of 100,000 lux for a horizontal surface at full sunlight [
3]. The measured
EH values at shaded pavements are about 10,000 lux. This distinction is not so noticeable at the middle of the scene, in vertical surfaces. While the incidence angle of sun is similar for horizontal surfaces, the composition of urban fabric implies the existence of façades with different orientations, which means also different sunbeam slopes and changeable intensities as a consequence [
14]. This holds true as long as measures are taken at similar hours, as was the case in this study. Apart from a different angle of incidence over vertical surfaces, the contrast between sun and shade for building façades also depends on the urban tissue and obstructions [
32], and it has not proved to be as high as in pavements, in general terms. Besides, the higher illuminance values measured in pavements double the maximum measurement in façades.
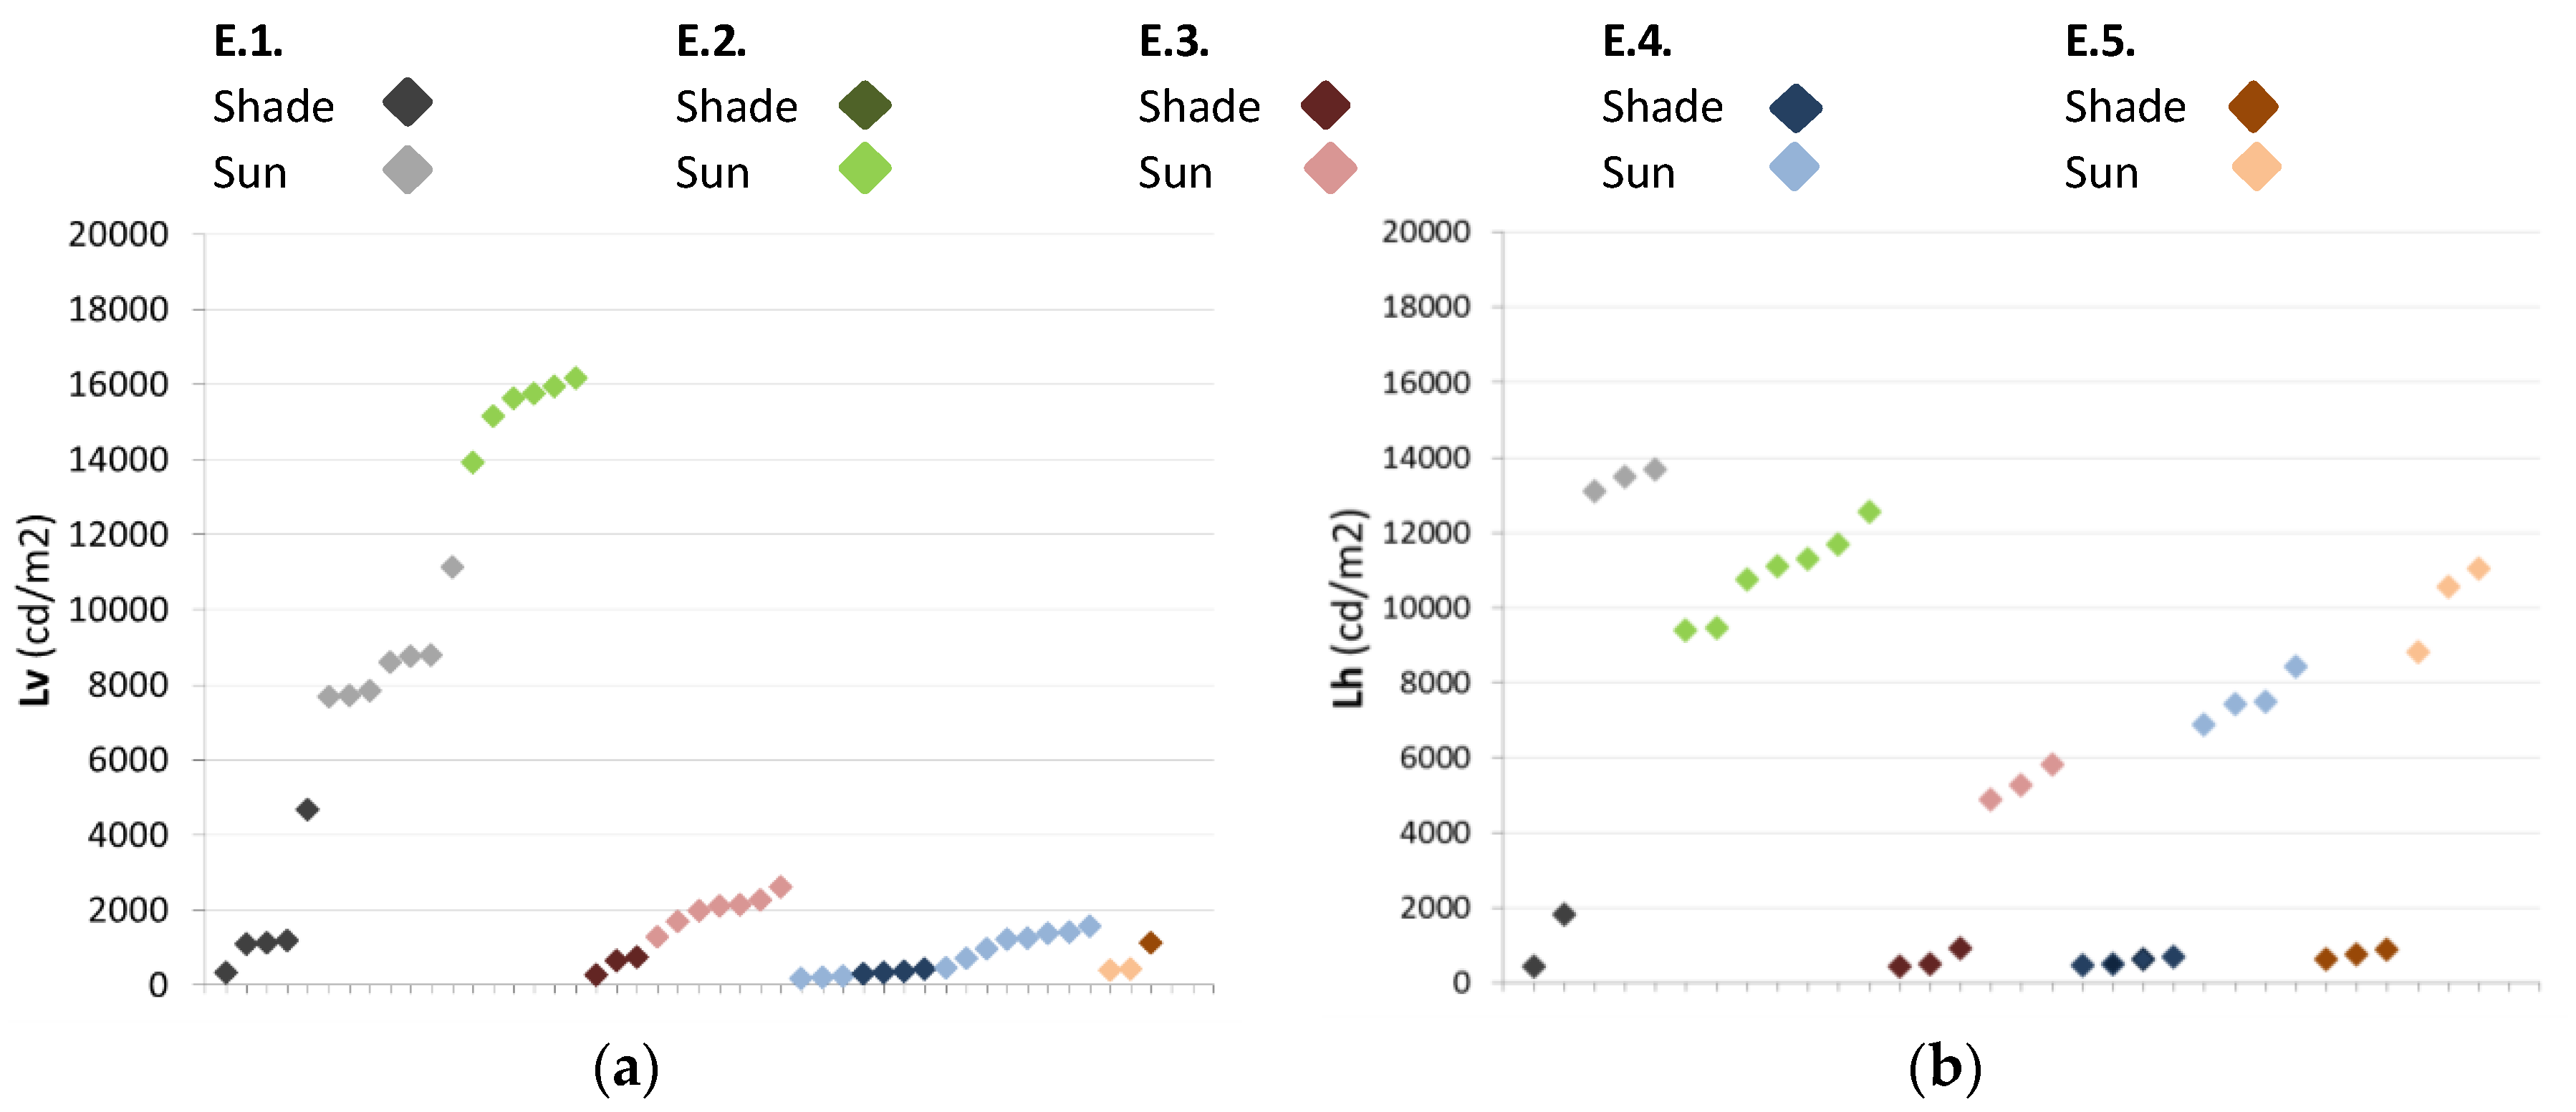
Apart from the available light measured by illuminance, the appearance of the city depends basically on the luminance of the different surfaces of the scene. As for
LV and
LH measurements (
Figure 3a,b), the trend is similar to illuminance results. The appearance of pavements remains outlined by the difference between sun and shade points. The contrast is higher with light-colored materials and finishes, such as light grey concrete or granite (Cases E.1, E.2 and E.5). The influence of materials here is clear, because it tends to increase or decrease brightness contrast [
33]. In a similar way, the contrast between light and colored façades is decisive for the appearance of an urban scene. The cases with white façades show higher
LV luminance values and greater contrast between sun and shade, while the colored ones have closer values for sun and shade. The difference is quite noticeable and can be seen in
Figure 3a,b. At the bottom of the graph, the lower values define a stripe with sun and shade points together. This lower stripe has a series of values under 2000 cd/m
2, and the vast majority of shade points remain under 1000 cd/m
2. As luminance inside is expected to be below this value, the use of shadow seems to be an opportunity to reduce the contrast between the urban daylight and the interior space.
In this sense, it is interesting to compare the shade values in street-view scenes with the interior measurements, for both pavements and vertical surfaces (
LH,
LV). The results obtained for vertical surfaces (
Figure 4a) show a slight overlap of luminance values inside and outside, located in the band of 200–400 cd/m
2. The darker vertical shadows in urban context are consequently next to the brighter vertical surfaces in the building in terms of brightness. If we analyze case by case, it is remarkable that the difference between the shadowed points outside and those inside is not always so alike, because it depends on the context. In Case E.4, for example, the transition is quite continuous because the shaded façades are colored, while the wall finishes in the transition zone are white, so materials influence the perception of luminosity [
34]. Here, the use of a darker material outside and a lighter one inside soften the transition. In contrast, Case E.3 shows the same maroon in façades and entrance walls, and consequently the gap outside–inside is higher. The extreme contrasted cases are buildings with white façades and walls. In Case E.1, most shadows remain over 1000 cd/m
2 even though there is a deep shadow located under the porch before the entrance. This value is slightly over 400 cd/m
2 and is similar to shade values of other case studies. It can be deduced in this case that the use of a shaded zone before the entrance contributes to creating shadows in façades, which are close to luminance values of walls inside the building.
A similar reflection can be made about pavements (
Figure 4b). The measurements of luminance in pavement shaded points do not overlap with the interior ones, but they are very close. The minimum values from shadow in street pavements are about 400 cd/m
2, while the maximum values from pavements inside are under 300 cd/m
2. However, most of them are next to 100 cd/m
2. As it happened in Case E.1 with vertical surfaces, the use of a porch creates a transition zone with values of shadow in pavements next to the values inside. As there are different degrees of shadow depending on the position of the measured point, elements such as canopies, porches, or other such structures can be used to improve and soften visual transition. The important presence of pavements within the composition of the visual scene, along with the possibility of using different materials as a finish, converts the ground in an interesting zone to improve visual adaptation.
As said above, different degrees of shadow occur simultaneously in Mediterranean cities. This situation can be used in street-view situations, as an element for improving vision in urban areas, paying special attention to pavements. But the comparison between urban and inner pavement luminance values can also help visual adaptation in transition zones.
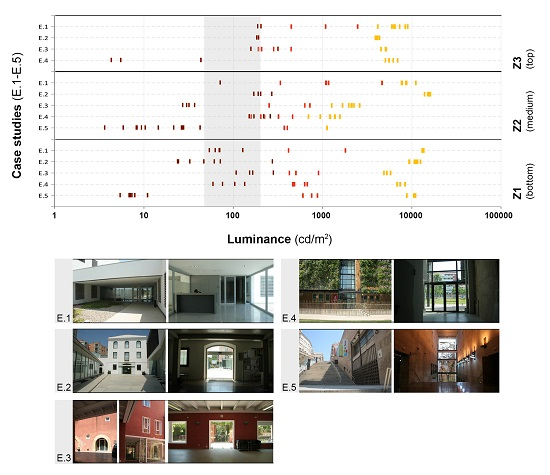
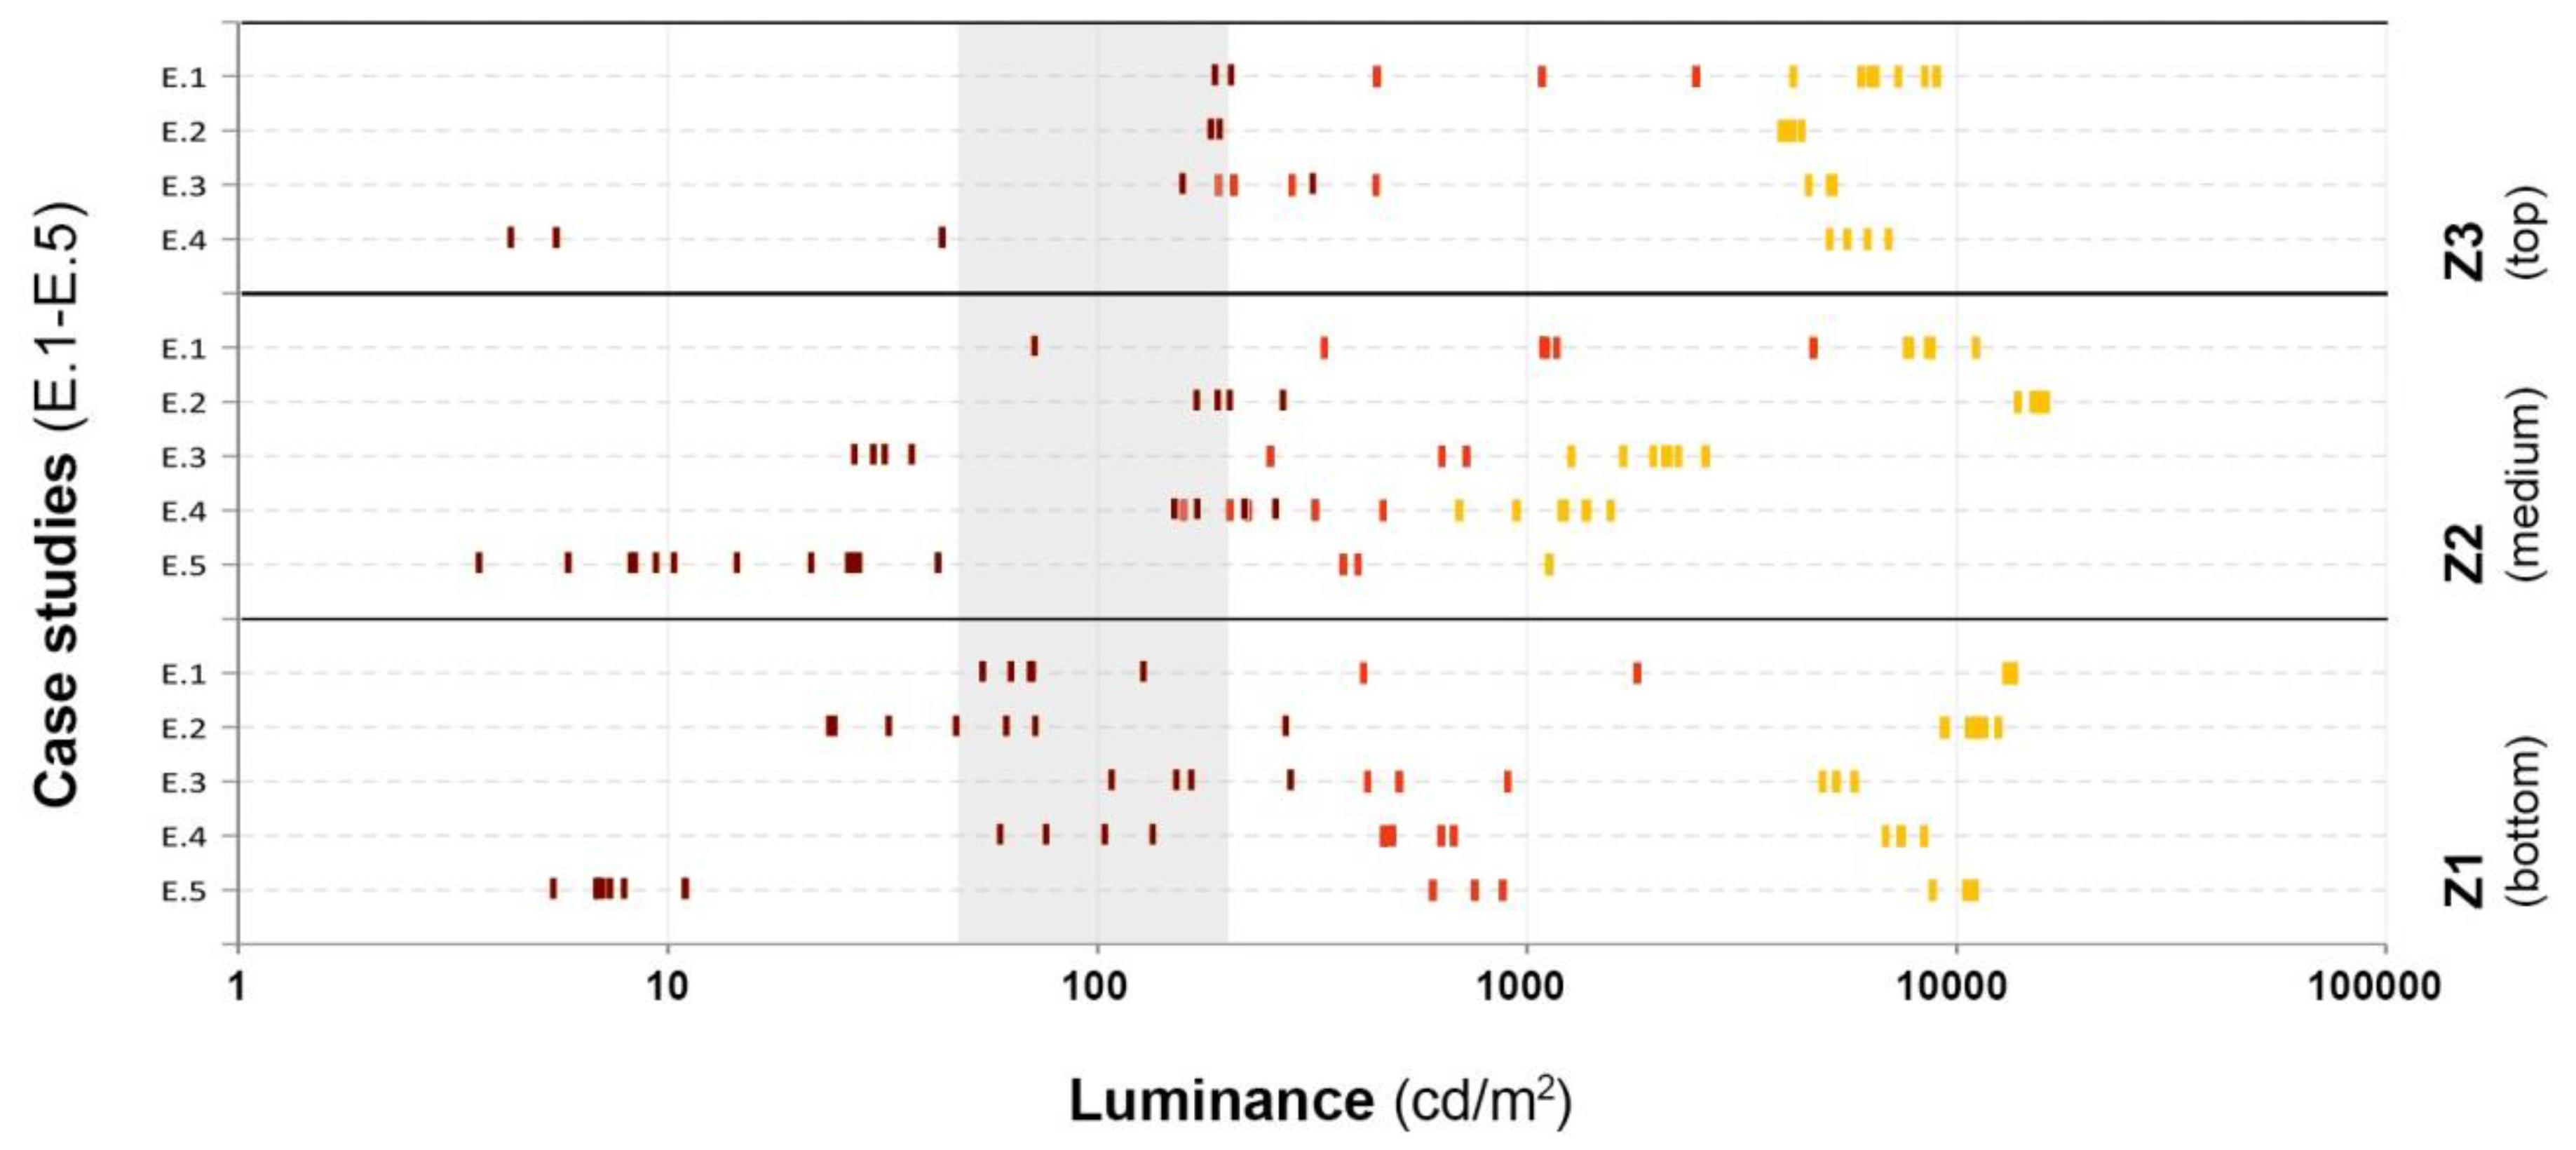
Figure 5 shows graphically the summary of all the measurements carried out in the case studies. The results are divided into the bottom, medium, and top zones in the visual scene, and are distinguished by colors according to their position at sun, shade, or inside the transition space. It can be easily perceived that the overlapping among the points, in which shadows play an important role, can solve the problem of transition. It is noticeable between sun and shade points in the urban context, and between street shade and interior points, as pointed out before. It proves that the use of shadow is an interesting resource to improve vision in entrance spaces and limit the energy demand for lighting in these areas.
4. Materials and Methods
4.1. Case Studies
Transition spaces can be considered as places where there is an exchange between interior and exterior environmental conditions. This study is focused particularly on access spaces (or transition spaces) and their immediate surroundings, the urban fabric. Transition spaces involve a movement, being part of the entrance and exit building itinerary.
The fieldwork was carried out by studying five access areas in different public buildings: the Science and Technology park for Tourism and Leisure of Catalonia (E.1), the Civic Centre East Reus (E.2), the Architects Association of Catalonia (E.3), the Old “Tabacalera” building (E.4), and the Congress Centre and Trade Fair (E.5). All case studies were situated in the same geographical and climatic environment and were measured in comparable conditions regarding time of day and period of the year. The climatic zones of each case of study, according to the “Local Climate Zone” (LCZ) classification provided by Steward and Oke [
35] are LCZ-2 for Cases E.2, E.3 and E.5; LCZ-3 for case E.1; and LCZ-5 for Case E.4.
The case studies are situated in five environments with different urban tissues located around Tarragona, a city situated in the eastern coast of Catalonia, 100 km south of Barcelona, 41.1° N 1.1° E on average. They range from a disseminated environment to a dense tissue, and comprise different finishes, colors and textures of building façades. Case E.1 is an isolated building located in a low-density facilities area. The transition from the exterior to the entrance hall takes place through a small court and a porch. The prevailing color is bright white. The second case (E.2) is a civic center located in a dense urban fabric in front of a green area. Here, the building itself defines an open transition zone facing the main façade, painted in white. Behind this, there is the main hall of the center. In Case E.3, the building is placed in the old town of Tarragona. A sequence of a porch and a courtyard before the entrance hall define the transition to the interior. Maroon façades compose the vision along the way. The fourth case (E.4) is a big structure with a double façade in front of an avenue: the exterior one is a vertical garden, while the inner one is painted in orange-yellow. The place between both façades defines the transition zone, just before the entrance itself. The last case, E.5, is a big dimension building located in a place with a remarkable slope. The entrance is produced at half level and leads to an atrium which organizes the distribution of circulation inside. Here, the materials are brown brick and concrete. As the solutions differ from one to the other, the sample comprises a variety of situations. The election of the case studies was based on different factors: the urban morphology of the surrounding tissue, the characteristics of the chosen buildings and their relation with the immediate exterior space, and the ability to easily identify the previously defined areas (Z.1, Z.2 and Z.3) in the urban visual scene.
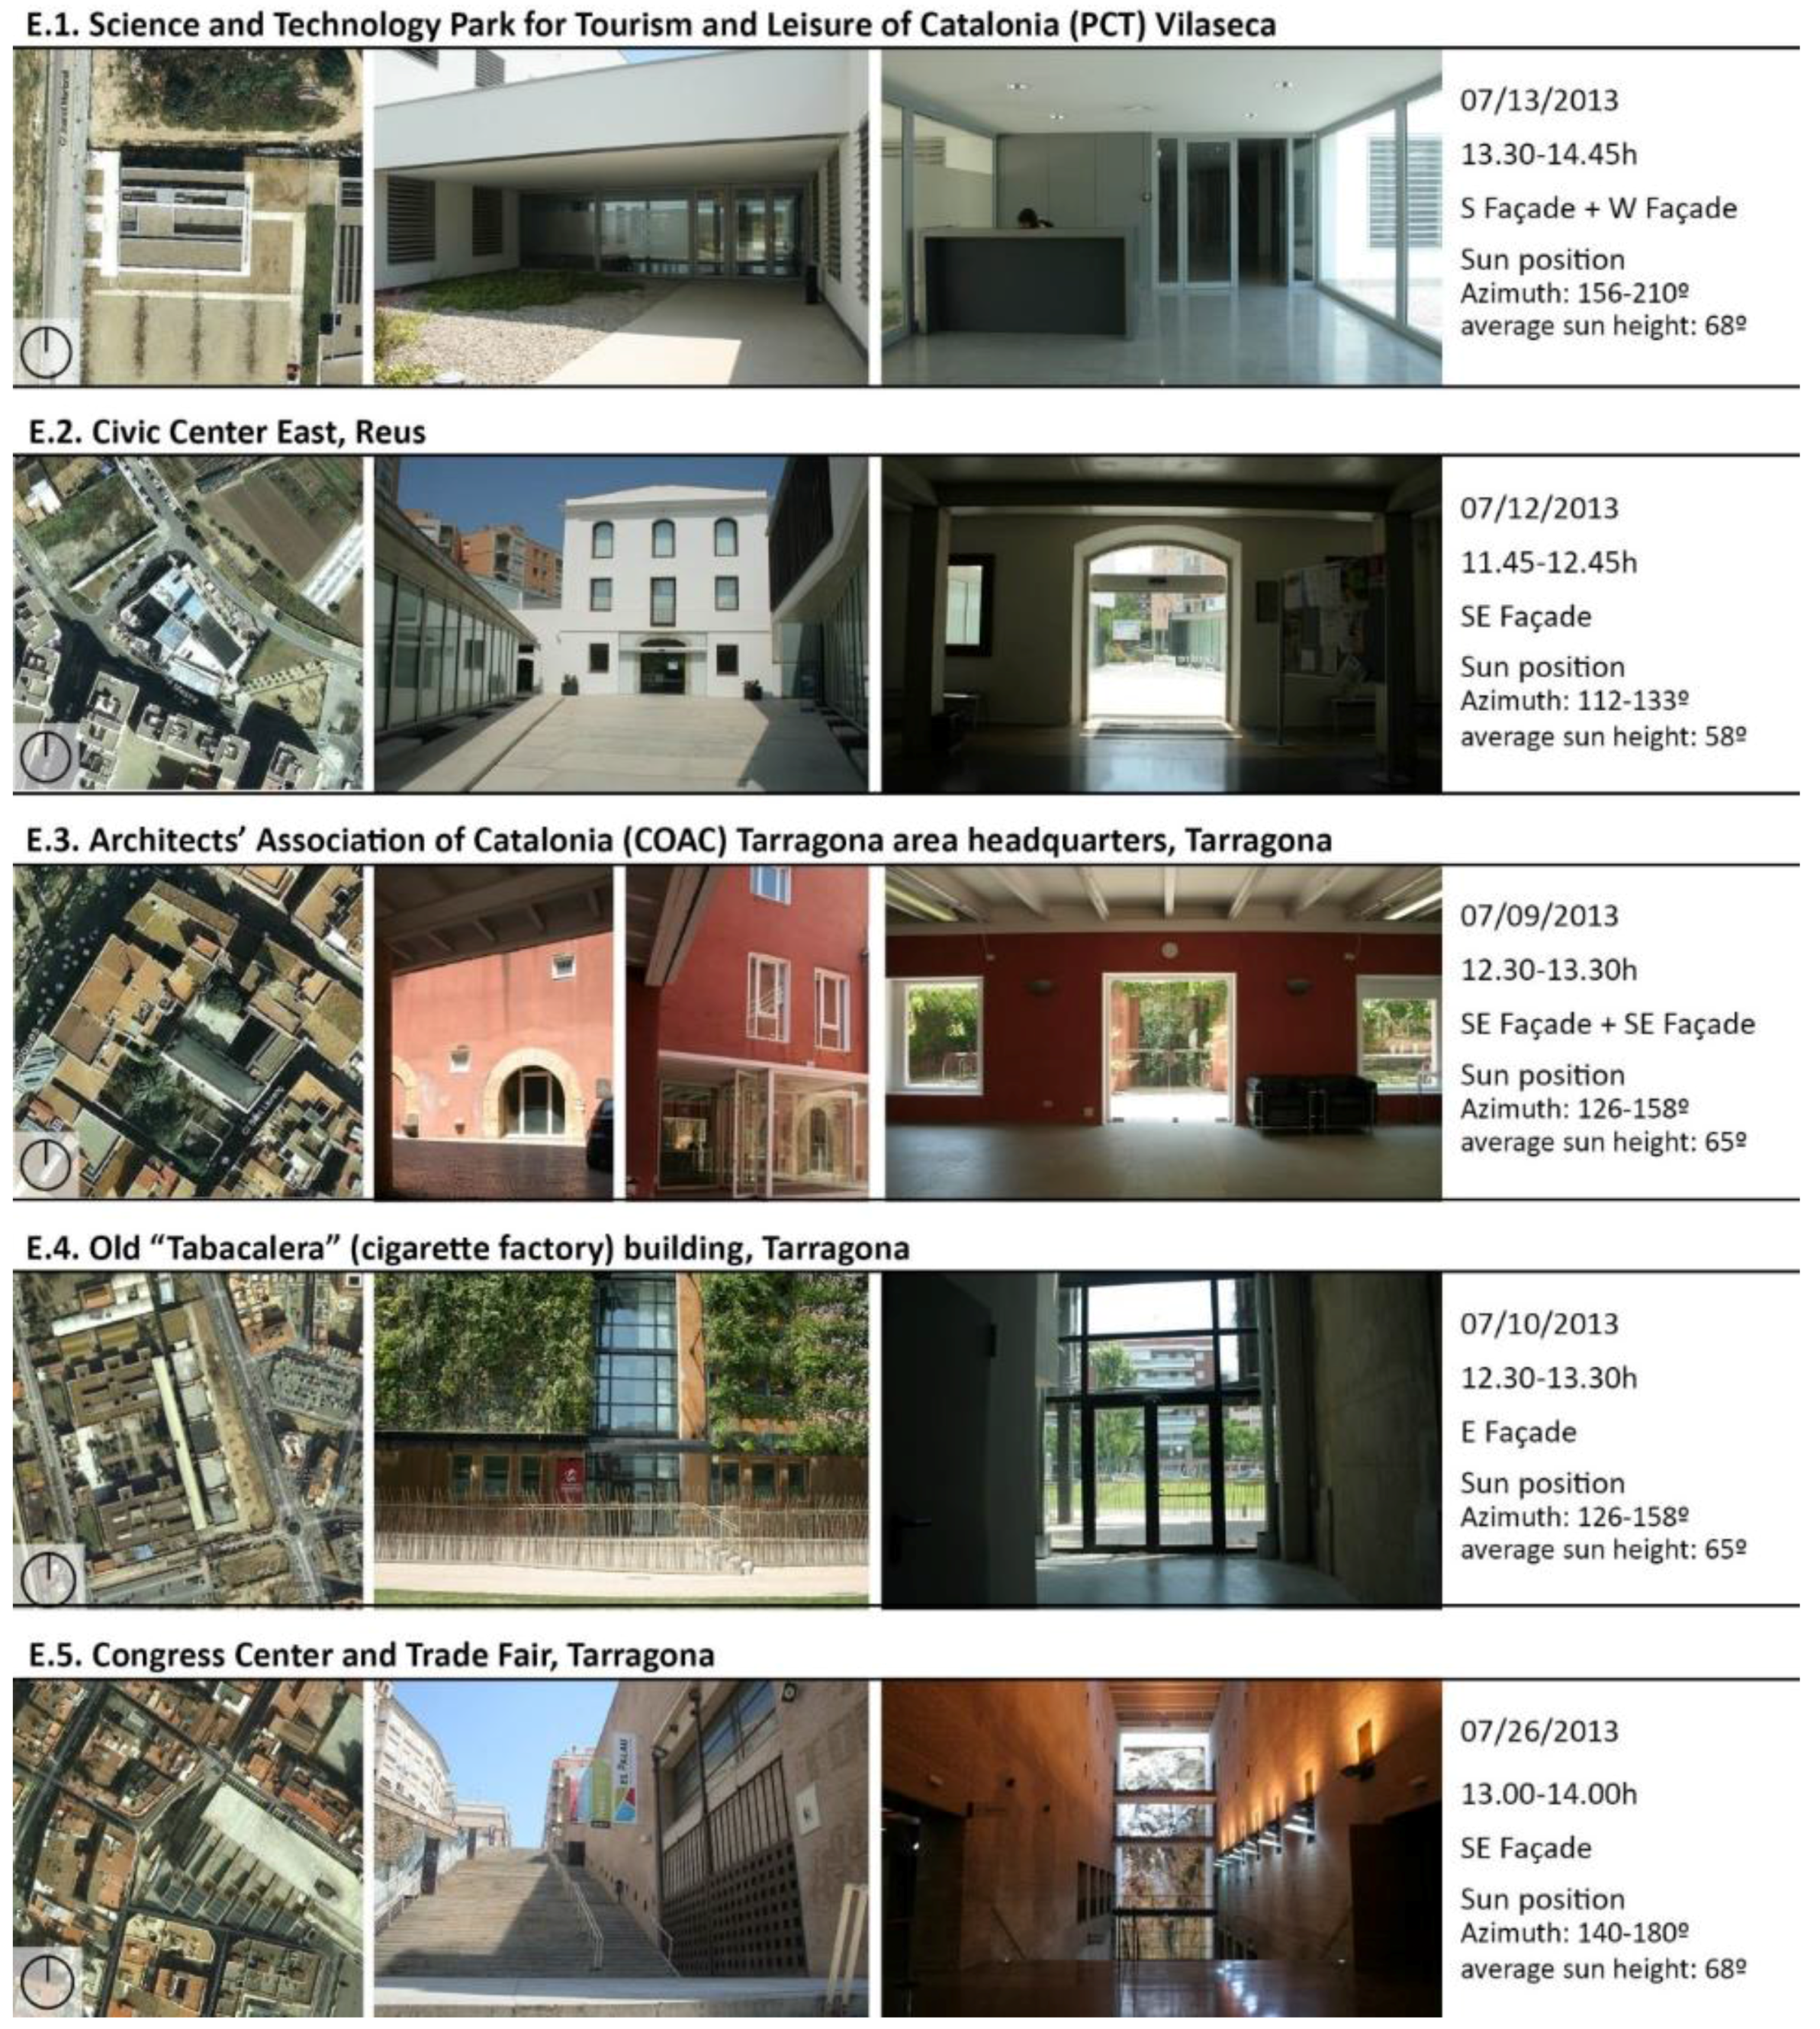
The case studies characteristics are described in the records cards (
Figure 6). Their explanation comprises the place and time position of the fieldwork as well as the orientation of the measured façades. The sun position was similar in all cases and is defined by the azimuth angle (α) and sun height (β). Throughout the process, the azimuth angle was between 122° and 183°, practically south, and the sun height ranged from 58° to 68°.
4.2. Materials
The instrumental used was a luxmeter Lutron LX-102 (a 5% class instrument, Lutron Electronic Enterprise Co. Ltd., Taipei, Taiwan) and a luminance meter Konica Minolta LS-110 (a 2% class instrument, Konika Minolta Sensing Inc., Tokyo, Japan). A digital camera Canon EOS 350D (Canon Inc., Tokyo, Japan) was also used to document the process.
4.3. Method
Each environment was analyzed in terms of luminance and illuminance. The objective was to obtain lighting data at the daily hours and time of the year with most solar incidence and clear sky conditions, a common situation in this climate, giving rise to high levels of illuminance.
For this reason, the field work was carried out at the beginning of July 2013, between 12:00 and 14:00 p.m., and days with nebulosity were discarded. Light values were obtained during periods of maximum insolation due to the optimal clear sky condition offered in the summer of 2013.
In each case of study, two sections were defined for light measurements. The first one was the urban area in front of the building entrance. The second one was the so-called transition zone, the access area inside the building.
In the exterior section, the measurements consisted on vertical illuminance and luminance in façades (EV, LV), horizontal illuminance and luminance in pavements (EH, LH), and sky luminance (LS). Therefore, the measured points were located in light and shade pavements (Zone 1), light and shade façades (Zone 2) and the visible sky next to the top of the buildings (Zone 3). In some cases, the shaded side of porches were measured in Zone 3, at the top of the visual field. The measurements were made at representative points of each zone in order to have a wide range of light data, and were selected from observation on site.
In the interior section, the measurements were also carried out in the three descripted zones: bottom, medium, and top. In this case, vertical illuminance and luminance in walls (
EV,
LV), horizontal illuminance and luminance on floors (
EH,
LH), and ceiling luminance (
LS) were measured. The point selection was made with the same criteria as in the exterior section, but without distinguishing sun and shade areas. An example of the position of the measurement points located both inside and outside for Case E.2 is illustrated in
Figure 7. The procedure carried out in the other case studies was the same.
The measured values were then arranged in tables of luminance and illuminance values for each case study, and were divided into three categories corresponding to the defined zones of the visual scene, as shown in the Results section.
5. Conclusions
This article extends the knowledge of light distribution in Mediterranean cities as sunlit environments, and at the same time brings up the issue of the generated contrast in certain situations. After all, it is a question of daylight management, because in urban Mediterranean areas there is no shortage of this resource. As said before, one of the main consequences is the existing contrast between highly bright cities and quite darker interiors, making visual adaptation difficult.
In fact, the measurements carried out at different vertical and horizontal surfaces of the Mediterranean city show a strong contrast between inside and outside the building. To prove it, it was necessary to establish a range of reference values of luminance in sunlit and shadowed areas outside. In that sense, the results obtained in this work serve as a reference for weighting the existing contrast between both situations.
This contrast is particularly high between extreme values but, between the maximum and minimum values (outside and inside), there is a zone with a slight overlap. This zone includes the darker shadows outside and the brighter points from inside the building. The mentioned values are between 200 cd/m2 and 400 cd/m2, and can be used to ease the transition and improve visual adaptation. The transposition of these values to architecture means that the use of shadow just before the entrance of buildings can significantly improve the quality of vision inside, reducing luminance contrast along the path. It can be complemented by introducing luminosity inside, by means of light-colored materials or strategically placed windows.
If such measures are carried out, it is essential to pay attention to pavements. The analysis of visual scenes has shown that pavements play an important role in the whole image. While ceilings or the sky vault barely appear in the visual scene, pavements cover a large part of it. For that reason, it is necessary to pay attention to them when designing a space. In broad terms, it determines the quality of vision of a space.
In the Introduction section a simple question was posed: is it necessary to spend so much energy for lighting in entrance areas when the light level in the street is far more than enough? From the results obtained in this study, it seems that architectural design can provide solutions for a more sensible use of daylight in entrance areas, avoiding an overuse of installed power for artificial lighting.


