
Modelling Behaviour of a Carbon Epoxy Composite Exposed to Fire: Part I—Characterisation of Thermophysical Properties


Abstract
:1. Introduction
2. Review of the Literature
2.1. Kinetic Model
2.1.1. Single-Step Kinetic
2.1.2. Multi-Step Kinetic
2.2. Thermal Properties
3. Experimental
3.1. Materials
3.2. Thermogravimetric Analysis
3.3. Specific Heat Capacity
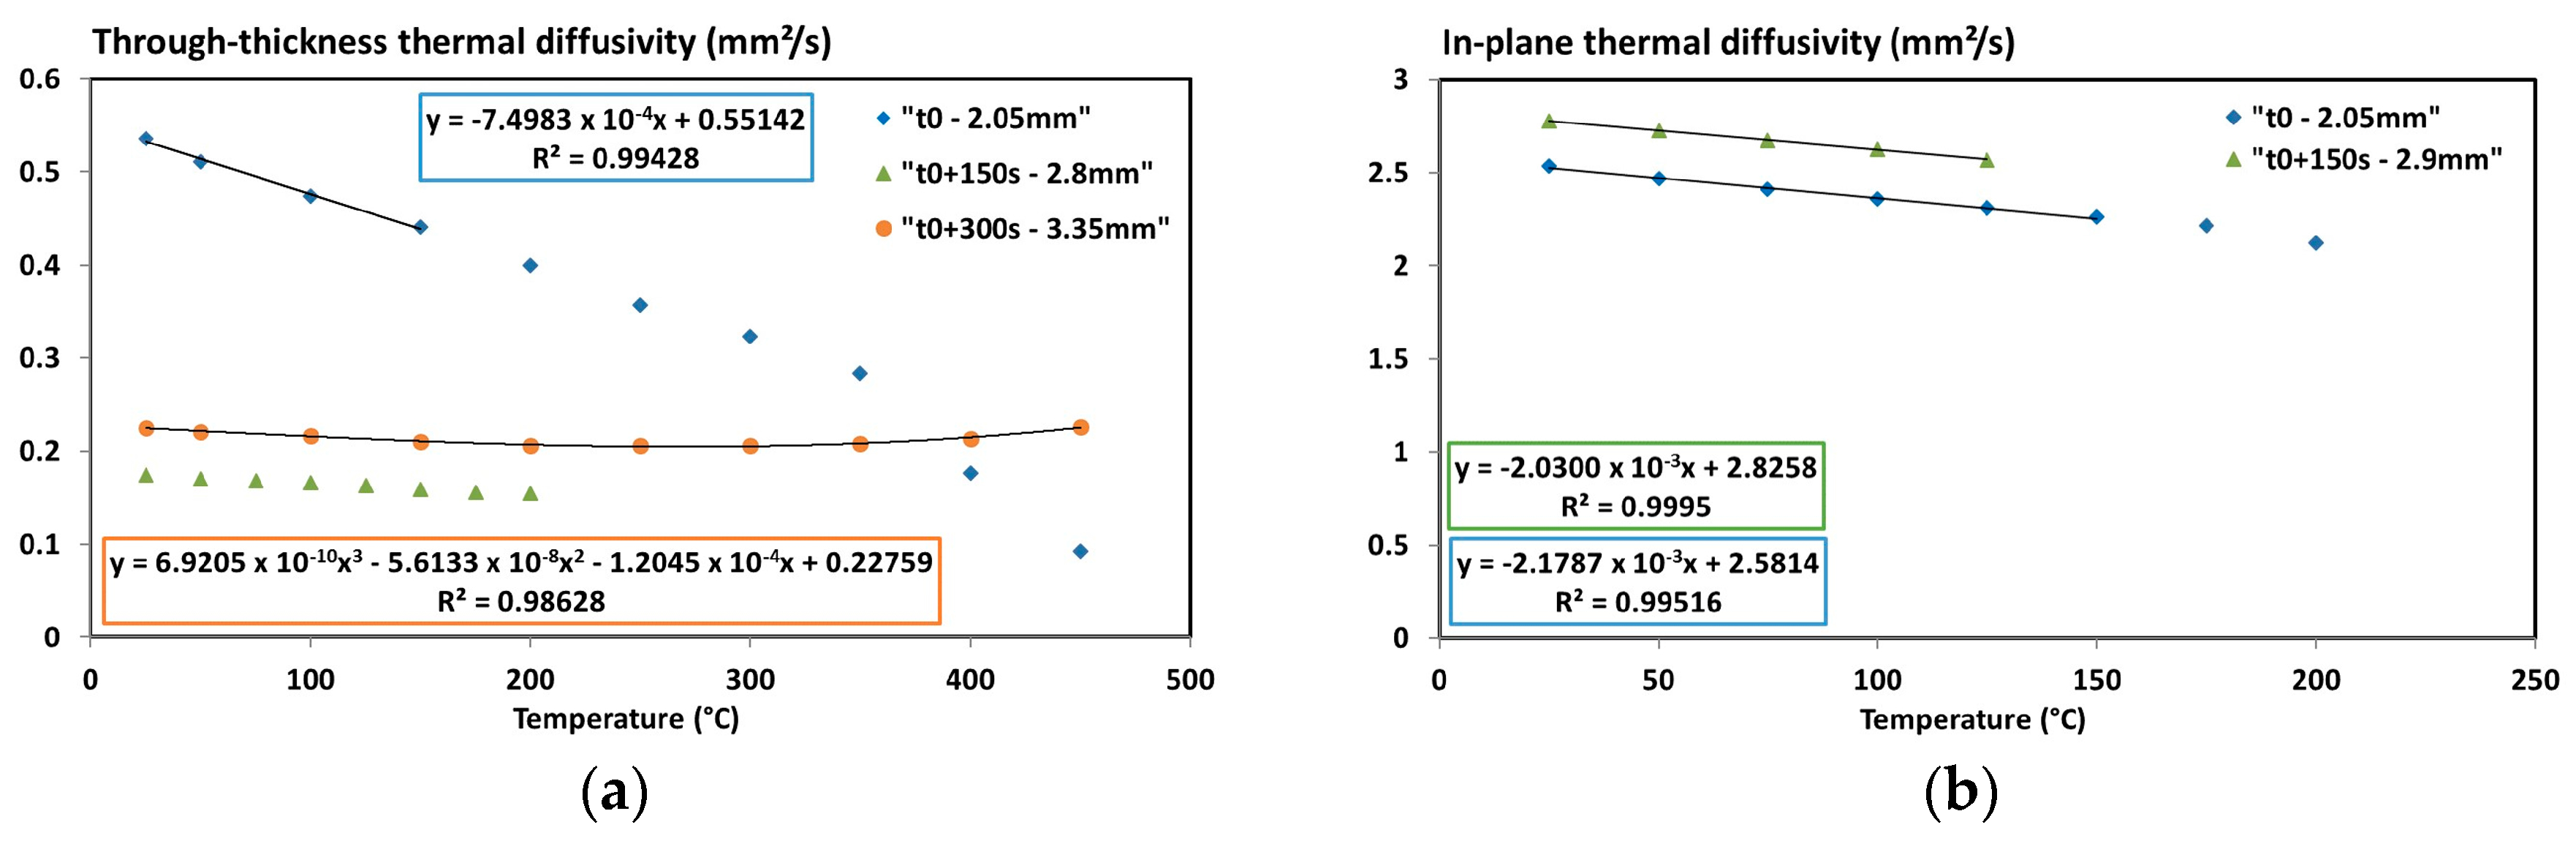
3.4. Thermal Diffusivity
3.5. Gas Phase Analysis
4. Results and Discussion
4.1. Density
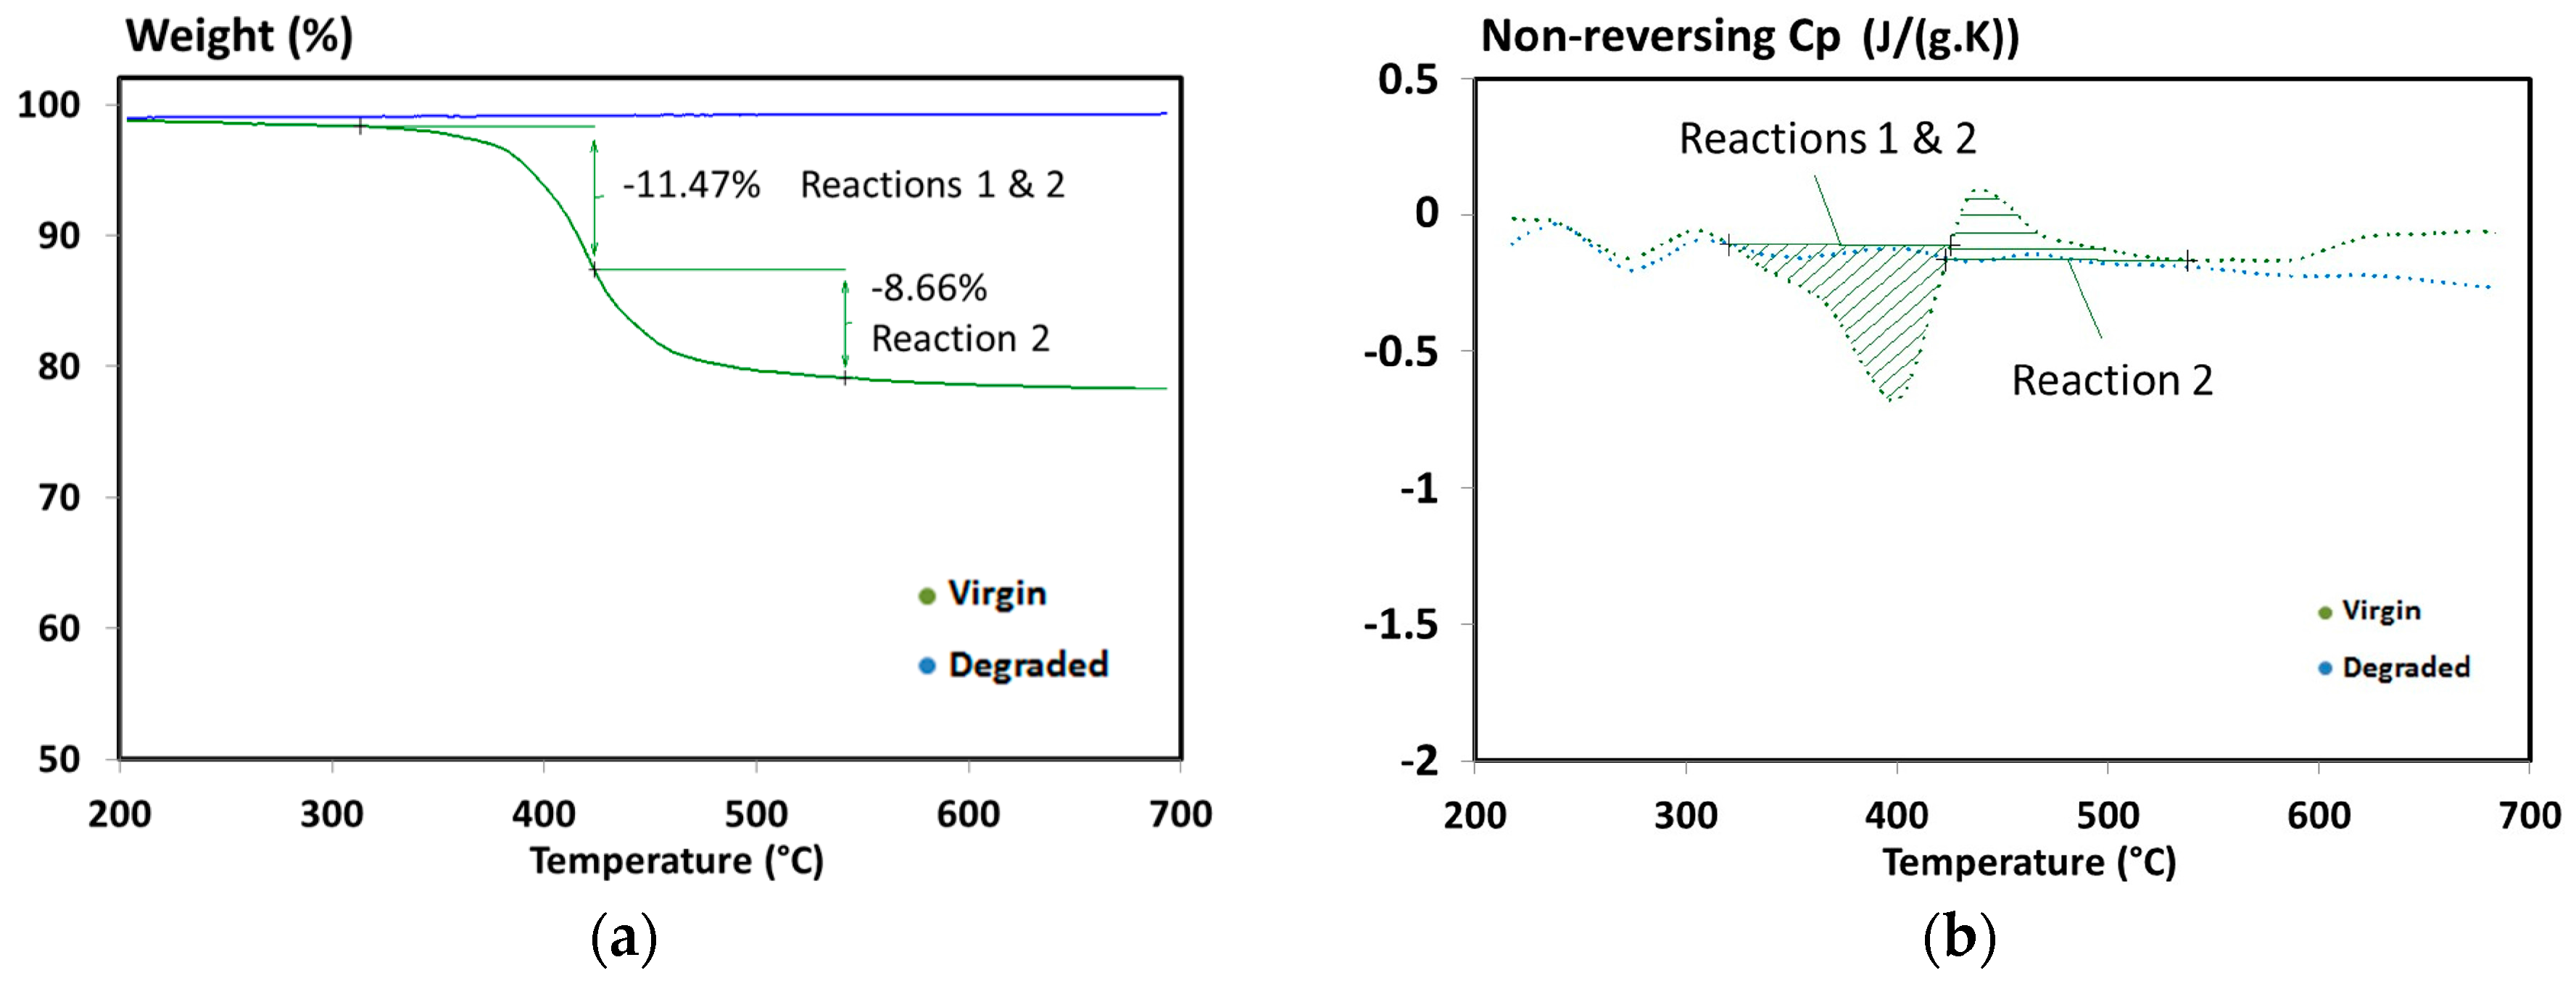
4.2. Kinetic Analysis
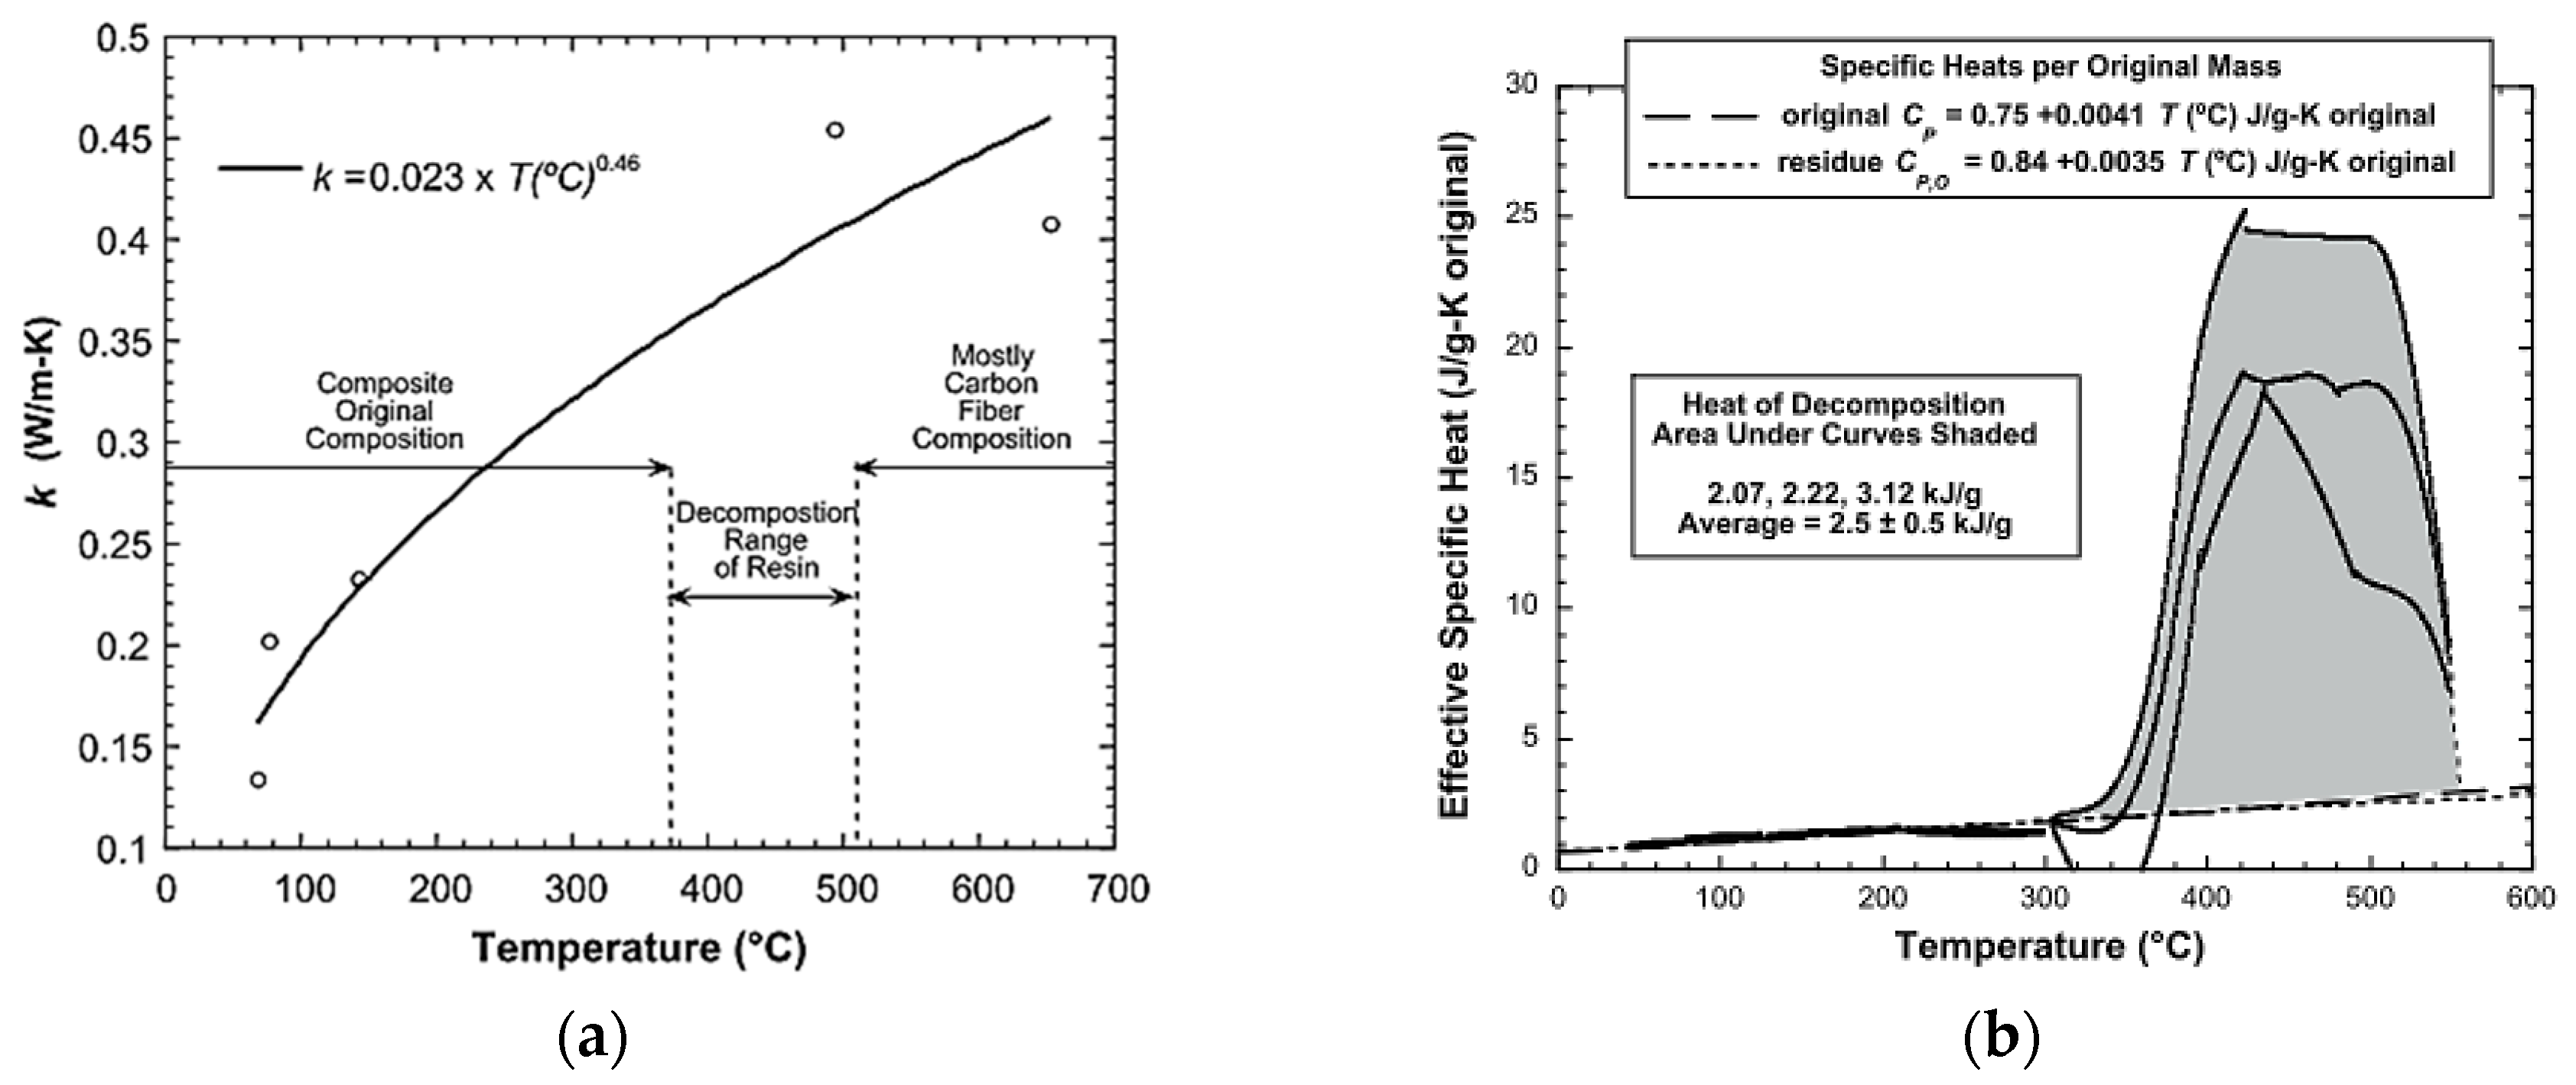
4.3. Heat of Decomposition
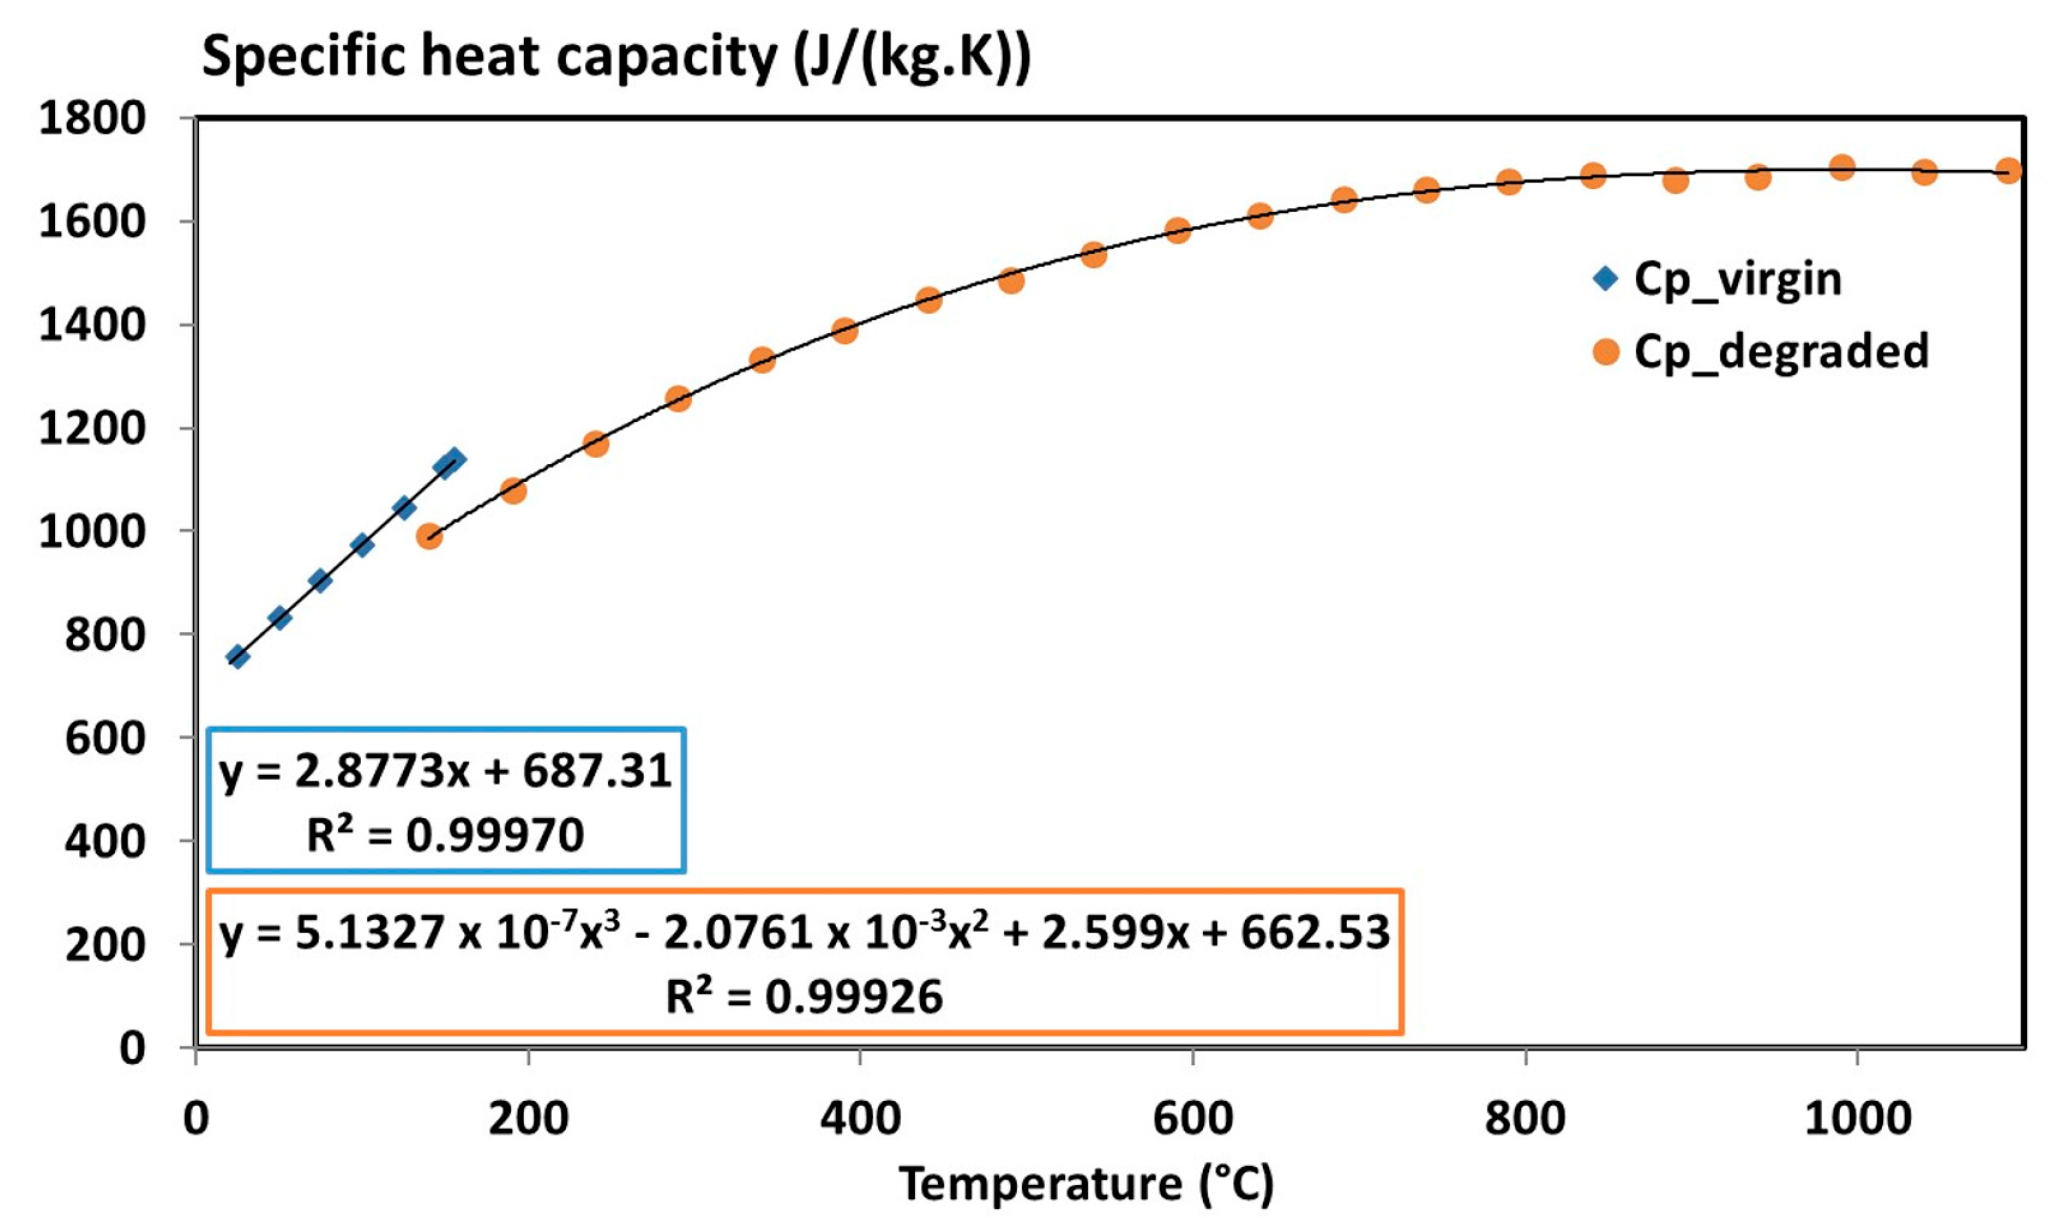
4.4. Effective Specific Heat Capacity
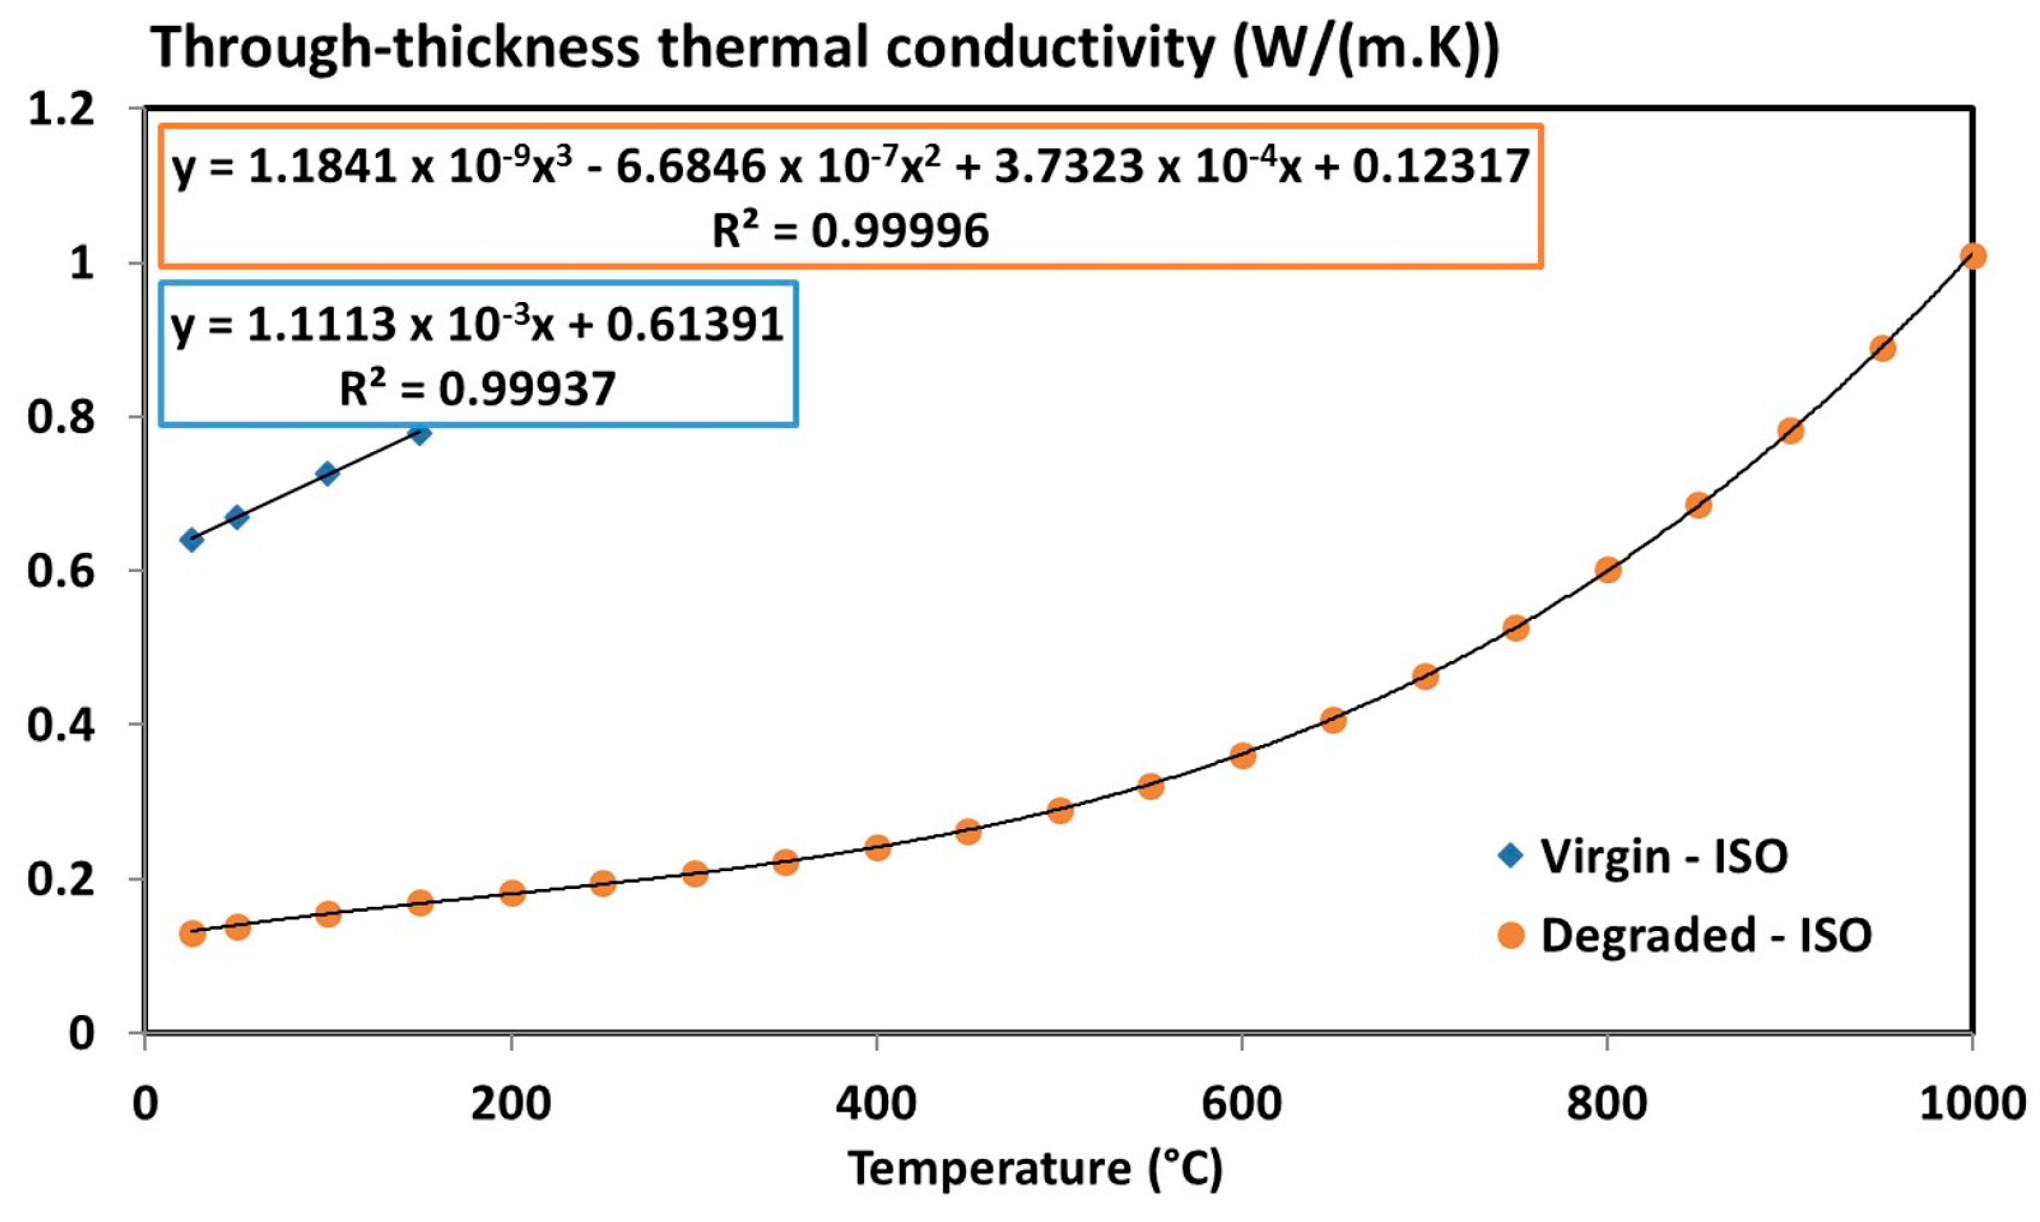
4.5. Effective Thermal Conductivity
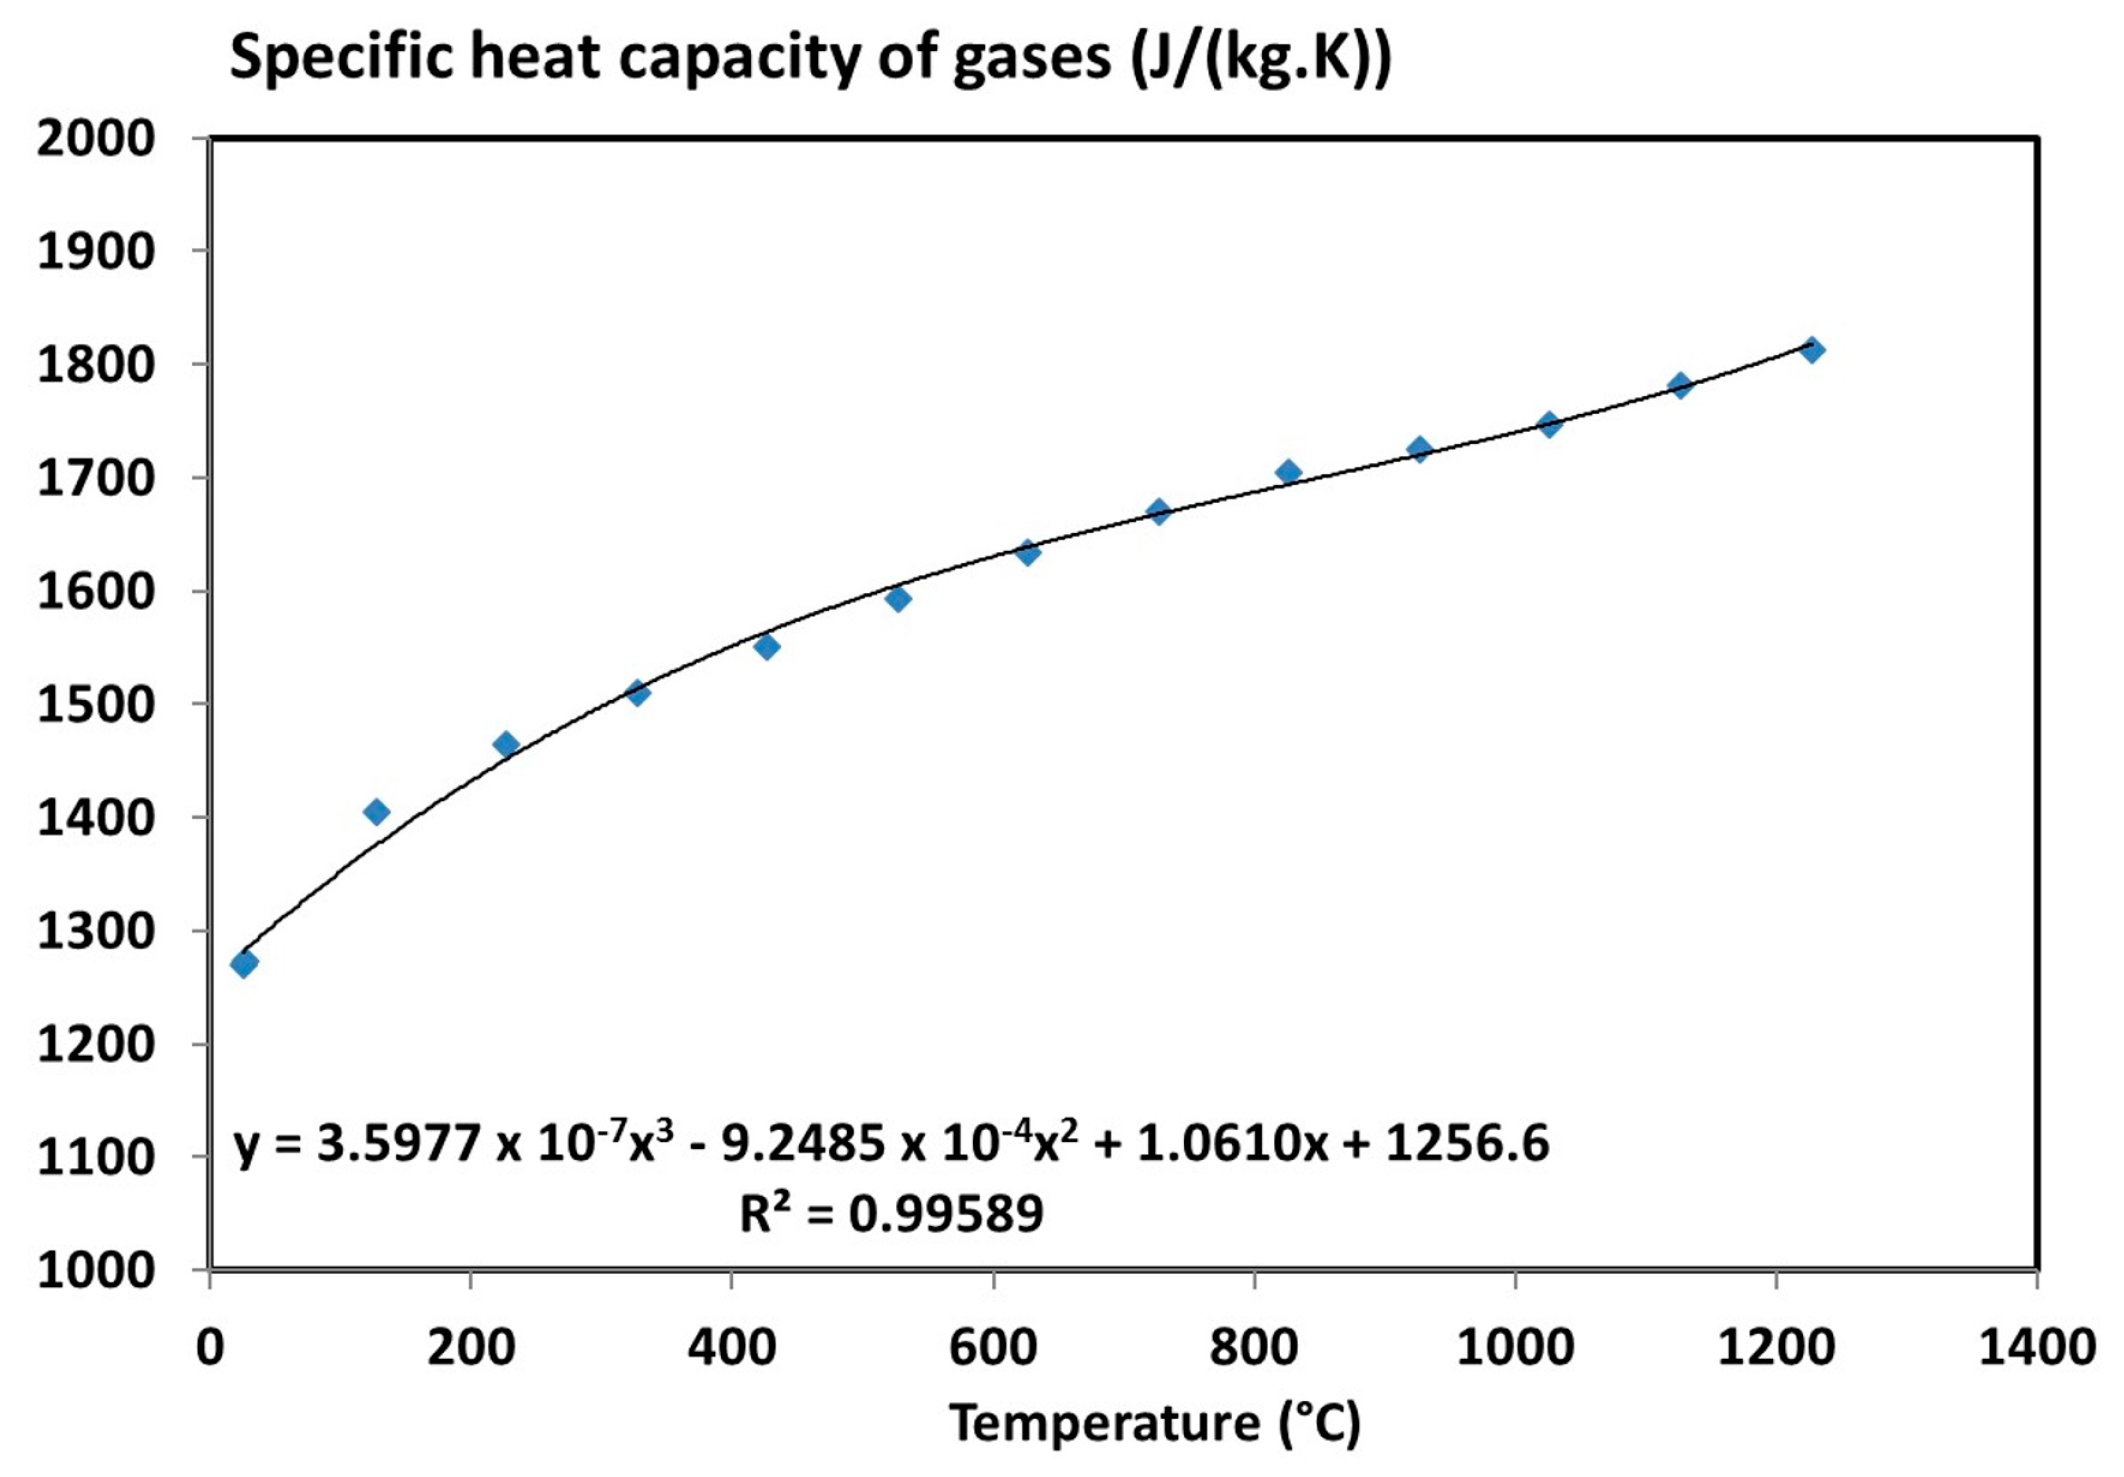
4.6. Specific Heat Capacity of Gases
4.7. Summary
5. Conclusions
Acknowledgments
Author Contributions
Conflicts of Interest
References
- Tranchard, P.; Samyn, F.; Duquesne, S.; Thomas, M.; Estèbe, B.; Montès, J.-L.; Bourbigot, S. Fire behaviour of carbon fibre epoxy composite for aircraft: Novel test bench and experimental study. J. Fire Sci. 2015, 33, 247–266. [Google Scholar] [CrossRef]
- ISO2685:1998(E). Aircraft—Environmental Test Procedure for Airborne Equipment—Resistance to Fire in Designated Fire Zones; the International Organization for Standardization (ISO): Geneva, Switzerland, 1998. [Google Scholar]
- Gibson, A.G.; Mouritz, A.P.; Wu, Y.; Gardiner, C.P.; Mathys, Z. Validation of the gibson model for the fire reaction properties of fibre-polymer composites. In Composites in Fire 3: 3rd International Conference on the Response of Composite Materials to Fire; CompositeLink: Newcastle, UK, 2003. [Google Scholar]
- Gibson, A.G.; Wright, P.N.H.; Wu, Y.-S.; Mouritz, A.P.; Mathys, Z.; Gardiner, C.P. The integrity of polymer composites during and after fire. J. Compos. Mater. 2004, 38, 1283–1307. [Google Scholar] [CrossRef]
- Tranchard, P.; Thomas, M. Modélisation de la thermo-dégradation d’un composite aéronautique. In Congrès Français de Thermique; Société Française de Thermique: Paris, France, 2012; pp. 43–48. [Google Scholar]
- Tranchard, P. Modelling the Behaviour of a Carbon/Epoxy Composite Submitted to Fire. Ph.D. Thesis, University of Lille, Lille, France, 2015. [Google Scholar]
- Pering, G.A.; Farrell, P.V.; Springer, G.S. Degradation of tensile and shear properties of composites exposed to fire or high temperature. J. Compos. Mater. 1980, 14, 54–68. [Google Scholar]
- Eekelen, A.J.; Bouilly, J.M.; Hudrisier, S.; Aspa, Y. Design and Numerical Modelling of Charring Material Ablators for Re-Entry Applications, 6th ed.; European Workshop on Thermal Protection Systems and Hot Structures: Stuttgart, Germany, 2009. [Google Scholar]
- Nelson, J.B. Determination of Kinetic Parameters of Six Ablation Polymers by Thermogravimetric Analysis; National Aeronautics and Space Administration: Washington, DC, USA, 1967.
- Mamleev, V.; Bourbigot, S.; Bras, M.L.; Lefebvre, J. Three model-free methods for calculation of activation energy in tg. J. Therm. Anal. Calorim. 2004, 78, 1009–1027. [Google Scholar] [CrossRef]
- Friedman, H.L. Kinetics of thermal degradation of char-forming plastics from thermogravimetry. application to a phenolic plastic. J. Polym. Sci. Part C Polym. Symp. 1964, 6, 183–195. [Google Scholar] [CrossRef]
- Ozawa, T. A new method of analyzing thermogravimetric data. Bull. Chem. Soc. Jpn. 1965, 38, 1881–1886. [Google Scholar] [CrossRef]
- ASTM_E698. Standard Test Method for Arrhenius Kinetic Constants for Thermally Unstable Materials Using Differential Scanning Calorimetry and the Flynn/Wall/Ozawa Method; ASTM International: West Conshohocken, PA, USA, 2016. [Google Scholar]
- Coats, A.W.; Redfern, J.P. Kinetic parameters from thermogravimetric data. Nature 1964, 201, 68–69. [Google Scholar] [CrossRef]
- Flynn, J.H. The isoconversional method for determination of energy of activation at constant heating rates. J. Therm. Anal. 1983, 27, 95–102. [Google Scholar] [CrossRef]
- Opfermann, J.; Kaisersberger, E. An advantageous variant of the ozawa-flynn-wall analysis. Thermochim. Acta 1992, 203, 167–175. [Google Scholar] [CrossRef]
- Brown, M.E.; Maciejewski, M.; Vyazovkin, S.; Nomen, R.; Sempere, J.; Burnham, A.; Opfermann, J.; Strey, R.; Anderson, H.L.; Kemmler, A.; et al. Computational aspects of kinetic analysis: Part a: The ictac kinetics project-data, methods and results. Thermochim. Acta 2000, 355, 125–143. [Google Scholar] [CrossRef]
- Šesták, J.; Berggren, G. Study of the kinetics of the mechanism of solid-state reactions at increasing temperatures. Thermochim. Acta 1971, 3, 1–12. [Google Scholar] [CrossRef]
- ASTM_E176. Standard Terminology of Fire Standards; ASTM International: West Conshohocken, PA, USA, 2010. [Google Scholar]
- Chippendale, R.D.; Golosnoy, I.O.; Lewin, P.L. Numerical modelling of thermal decomposition processes and associated damage in carbon fibre composites. J. Phys. D Appl. Phys. 2014, 47, 385301. [Google Scholar] [CrossRef]
- Quintiere, J.G.; Walters, R.N.; Crowley, S. Flammability Properties of Aircraft Carbon-Fiber Strutural Composite; DOT/FAA/AR-07/57; Federal Aviation Administration (FAA): Washington, DC, USA, October 2007.
- Burns, L.A.; Feih, S.; Mouritz, P.A. Fire-Under-Load Testing of Carbon Epoxy Composites, 47th ed.; AIAA Aerospace Sciences Meeting Including The New Horizons Forum and Aerospace Exposition: Orlando, FL, USA, 2009. [Google Scholar]
- Sikoutris, D.E.; Vlachos, D.E.; Kostopoulos, V. Multi stage decomposition modeling of polymer matrix composites. In Composites in Fire 6, 6th International Conference on Composites in Fire; CompositeLink: Newcastle, UK, 2011. [Google Scholar]
- McGurn, M.T.; DesJardin, P.E.; Dodd, A.B. Numerical simulation of expansion and charring of carbon-epoxy laminates in fore environments. Int. J. Heat Mass Transf. 2012, 55, 272–281. [Google Scholar] [CrossRef]
- Lattimer, B.Y.; Ouellette, J.; Trelles, J. Thermal response of composite materials to elevated temperatures. Fire Technol. 2009, 47, 823–850. [Google Scholar] [CrossRef]
- Lattimer, B.Y.; Ouellette, J. Properties of composite materials for thermal analysis involving fires. Compos. A Appl. Sci. Manuf. 2006, 37, 1068–1081. [Google Scholar] [CrossRef]
- Sikoutris, D.E.; Vlachos, D.E.; Kostopoulos, V.; Jagger, S.; Ledin, S. Fire burnthrough response of cfrp aerostructures. Numerical investigation and experimental verification. Appl. Compos. Mater. 2011, 19, 141–159. [Google Scholar] [CrossRef]
- Bai, Y. Material and Structural Performance of Fiber-Reinforced Polymer Composites at Elevated and High Temperatures. Ph.D. Thesis, Ecole Polytechnique federale de Lausanne, Lausanne, Switzerland, 2009. [Google Scholar]
- Lattimer, B.Y.; Ouellette, J.; Trelles, J. Measuring properties for material decomposition modeling. Fire Mater. 2011, 35, 1–17. [Google Scholar] [CrossRef]
- Scott, E.; Beck, J.V. Estimation of thermal properties in epoxy matrix/carbon fiber composite materials. J. Compos. Mater. 1992, 26, 132–149. [Google Scholar] [CrossRef]
- McKinnon, M.; Stoliarov, S. Pyrolysis model development for a multilayer floor covering. Materials 2015, 8, 6117–6153. [Google Scholar] [CrossRef]
- Thomas, M. Proprietes Thermiques de Materiaux Composites: Caracterisation Experimentale et Approche Microstructurale. Ph.D. Thesis, Graduate Engineering School of the University of Nantes, Nantes, France, 2008. [Google Scholar]
- Paris, C.; Bernhart, G.; Olivier, P.A.; De Almeida, O. Influence de cycles de cuisson rapides sur le préimprégné aéronautique M21/T700: Suivi de polymérisation et propriétés mécaniques. Matériaux Techniques 2012, 100, 611–622. [Google Scholar]
- Hexcel. Hexply® M21 Epoxy Resin. Available online: http://www.aerosparesltd.com/files/hexcel/hexply_m21.pdf (accessed on 7 March 2017).
- Moukhina, E. Determination of kinetic mechanisms for reactions measured with thermoanalytical instruments. J. Therm. Anal. Calorim. 2012, 109, 1203–1214. [Google Scholar] [CrossRef]
- Buch, J.D. Thermal Expansion Behavior of a Thermally Degrading Organic Matrix Composite; ASME Publication AD-04: New York, NY, USA, 1982; pp. 35–49. [Google Scholar]
- Li, C.; Kang, N.; Labrandero, S.D.; Wan, J.; González, C.; Wang, D. Synergistic effect of carbon nanotube and polyethersulfone on flame retardancy of carbon fiber reinforced epoxy composites. Ind. Eng. Chem. Res. 2014, 53, 1040–1047. [Google Scholar] [CrossRef]
- Rose, N. Thermal Degradation and Fire Performance of Epoxy Resins Used in the Aeronautic Industry. Ph.D. Thesis, Université des Sciences et Technologies de Lille, Lille, France, 1995. [Google Scholar]
- Zhang, H. Fire-Safe Polymers and Polymer Composites; DOT/FAA/AR-04/11; Federal Aviation Administration (FAA): Washington, DC, USA, 2004.
- Levchik, S.V.; Weil, E.D. Thermal decomposition, combustion and flame-retardancy of epoxy resins—A review of the recent literature. Polym. Int. 2004, 53, 1901–1929. [Google Scholar] [CrossRef]
- Kalogiannakis, G.; Van Hemelrijck, D.; Van Assche, G. Measurements of thermal properties of carbon/epoxy and glass/epoxy using modulated temperature differential scanning calorimetry. J. Compos. Mater. 2004, 38, 163–175. [Google Scholar] [CrossRef]
- Cezairliyan, A.; Miiller, A.P. Specific heat capacity and electrical resistivity of a carbon-carbon composite in the range 1500–3000 k by a pulse heating method. Int. J. Thermophys. 1980, 1, 317–326. [Google Scholar] [CrossRef]
- Lorette, C. Outils de Caractérisation Thermophysique et Modèles Numériques pour les Composites Thermostructuraux à Haute Température. Ph.D. Thesis, Université Bordeaux 1, Bordeaux, France, 2007. [Google Scholar]
- Henderson, J.B.; Wiebelt, J.A.; Tant, M.R. A model for the thermal response of polymer composite materials with experimental verification. J. Compos. Mater. 1985, 19, 579–595. [Google Scholar] [CrossRef]
- Henderson, J.B.; Wiecek, T.E. A mathematical model to predict the thermal response of decomposing, expanding polymer composites. J. Compos. Mater. 1987, 21, 373–393. [Google Scholar] [CrossRef]
- Mouritz, A.P.; Gibson, A.G. Fire Properties of Polymer Composite Materials; Solid Mechanics and Its Applications: New York, NY, USA, 2006. [Google Scholar]
- Babrauskas, V. The cone calorimeter. In The SFPE Handbook of Fire Protection Engineering, 4th ed.; National Fire Protection Association (NFPA): Quincy, MA, USA, 2008. [Google Scholar]
- ISO13927. Simple Heat Release Test Using a Conical Radiant Heater and a Thermopile Detector; The International Organization for Standardization (ISO): Geneva, Switzerland, 2001. [Google Scholar]
- Marker, T.R.; Speitel, L.C. Development of a Laboratory-Scale Test for Evaluating the Decomposition Products Generated inside an Intact Fuselage during a Simulated Postcrash Fuel Fire; DOT/FAA/AR-TN07/15; Federal Aviation Administration (FAA): Washington, DC, USA, 2008.
- Lemmon, E.W.; McLinden, M.O.; Friend, D.G. Thermophysical Properties of Fluid Systems in NIST Chemistry WebBook; Linstrom, P.J., Mallard, W.G., Eds.; NIST Standard Reference Database Number 69; National Institute of Standards and Technology: Gaithersburg, MD, USA, 1998.


| Material | Step | Heating Rate (°C/min) | n (-) | A (1/s) | Ea (kJ/mol) | |
|---|---|---|---|---|---|---|
| Carbon fibre/epoxy | 1 | 1, 3, 10, 30 | 1 | 9.67 × 10¹⁰ | 182 | [19] |
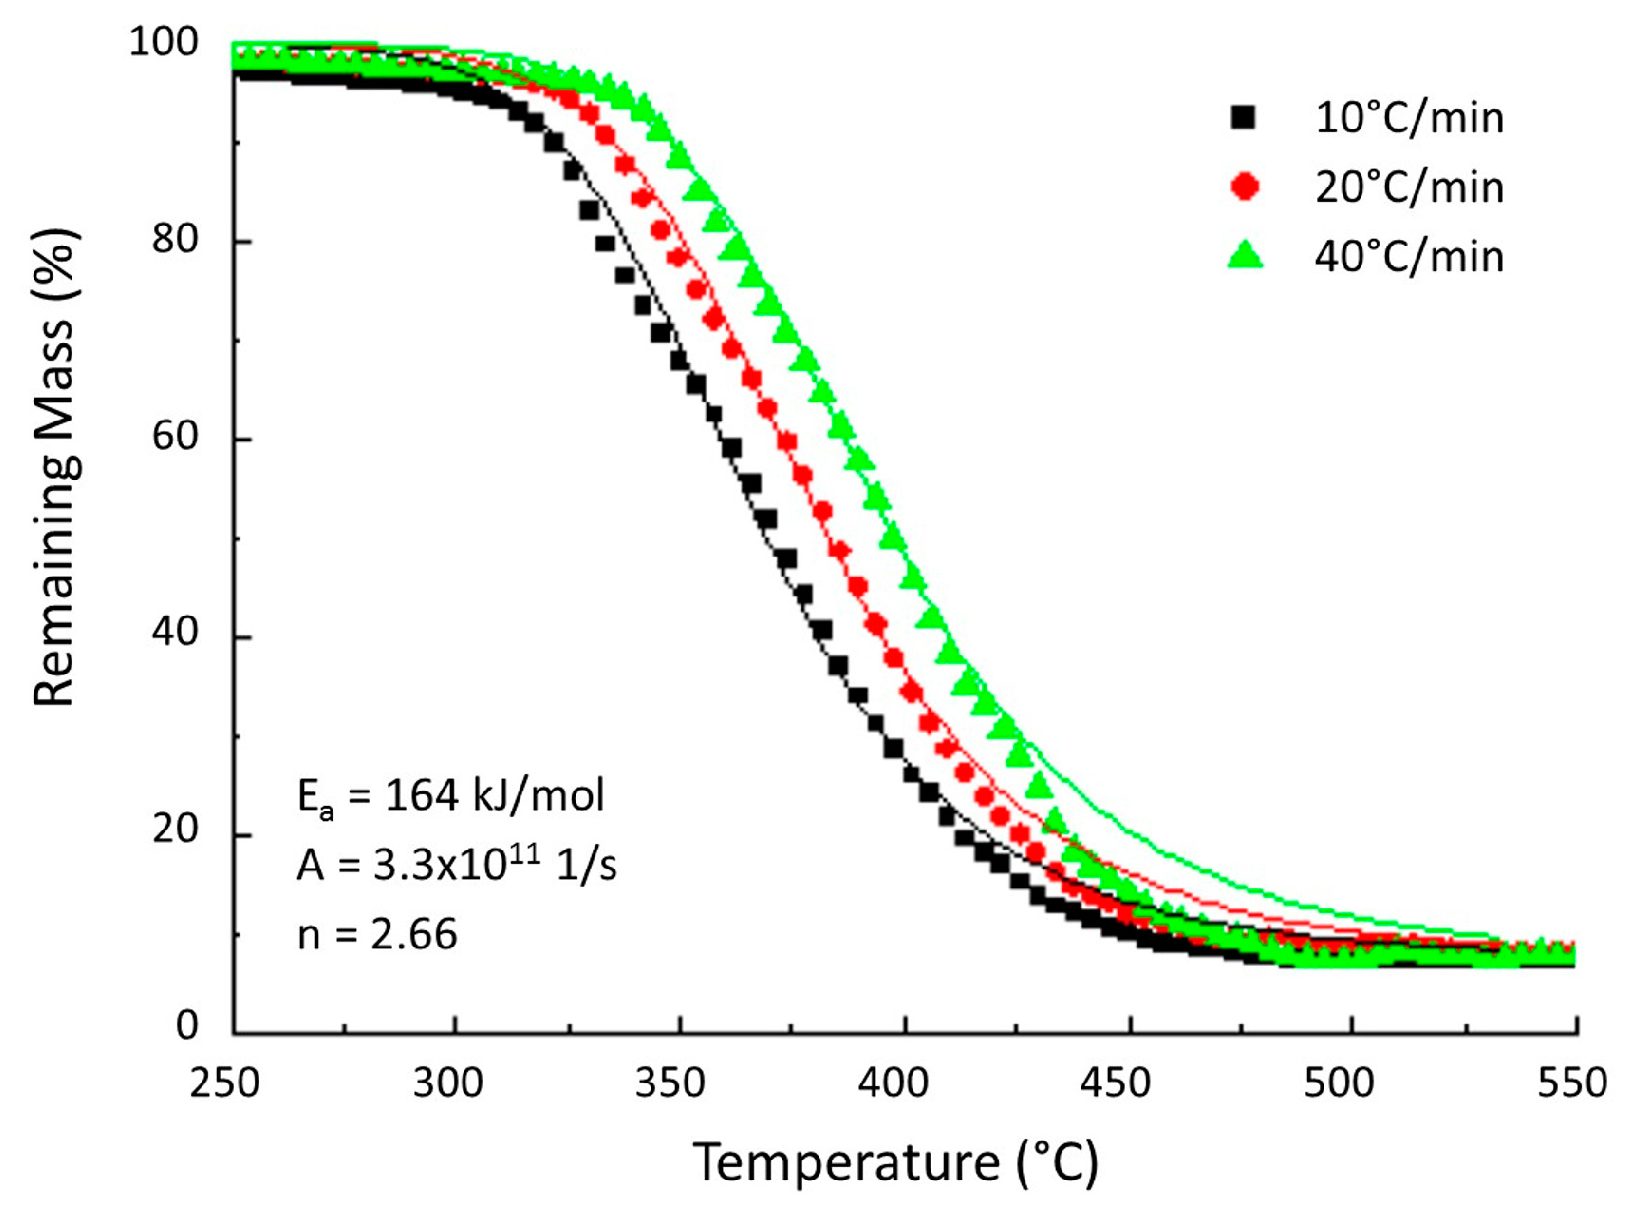
| Woven carbon fibre/R118 | 1 | 10, 20, 40 | 2.68 | 3.3 × 10¹¹ | 164 | [18] |
| T700/M21 | 1 | 5, 10, 20 | 1.344 | 3.15 × 10¹¹ | 181.73 | [20] |
| Carbon fibre/epoxy | 1 | 10–50 | 1.272 | 2.14 × 10¹⁰ | 165.432 | [21] |
| 2 | 1.902 | 54.2 | 60.472 | |||
| 3 | 3.651 | 3111.22 | 36.236 |
| Properties | Equipment Used | |
|---|---|---|
| Names | Unit | |
| Virgin density, | (kg/m3) | High precision balance + calliper |
| Degraded density, | (kg/m3) | High precision balance + calliper |
| Arrhenius parameters, | (1/s, J/mol, -) | Kinetic analysis based on numerical methods |
| Virgin specific heat capacity, | (J/(kg·K)) | Modulated DSC up to the decomposition temperature, reversing signal |
| Degraded specific heat capacity, | (J/(kg·K)) | Modulated DSC up to 1100 °C, reversing signal |
| Heats of decomposition, | (J/kg) | Modulated DSC up to 1100 °C, non-reversing signal |
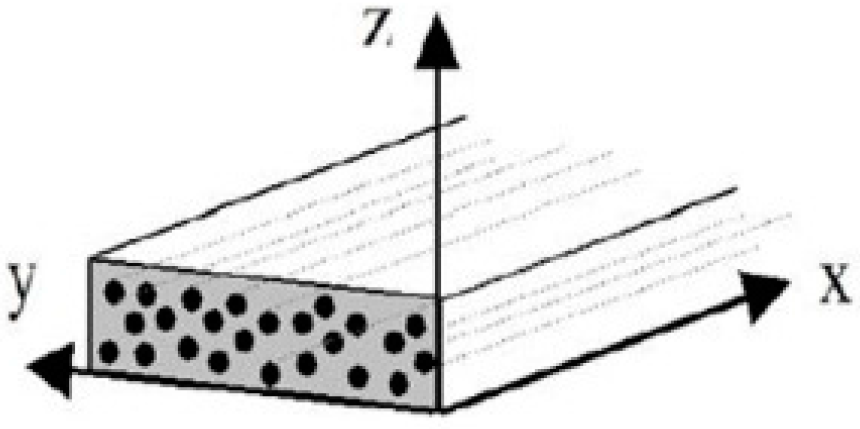
| Tensor of the virgin thermal conductivity, | (W/(m·K)) | Measurement of the thermal diffusivity using LFA in the three main directions |
| Tensor of the degraded thermal conductivity, | (W/(m·K)) | Measurement of the thermal diffusivity using LFA in the three main directions |
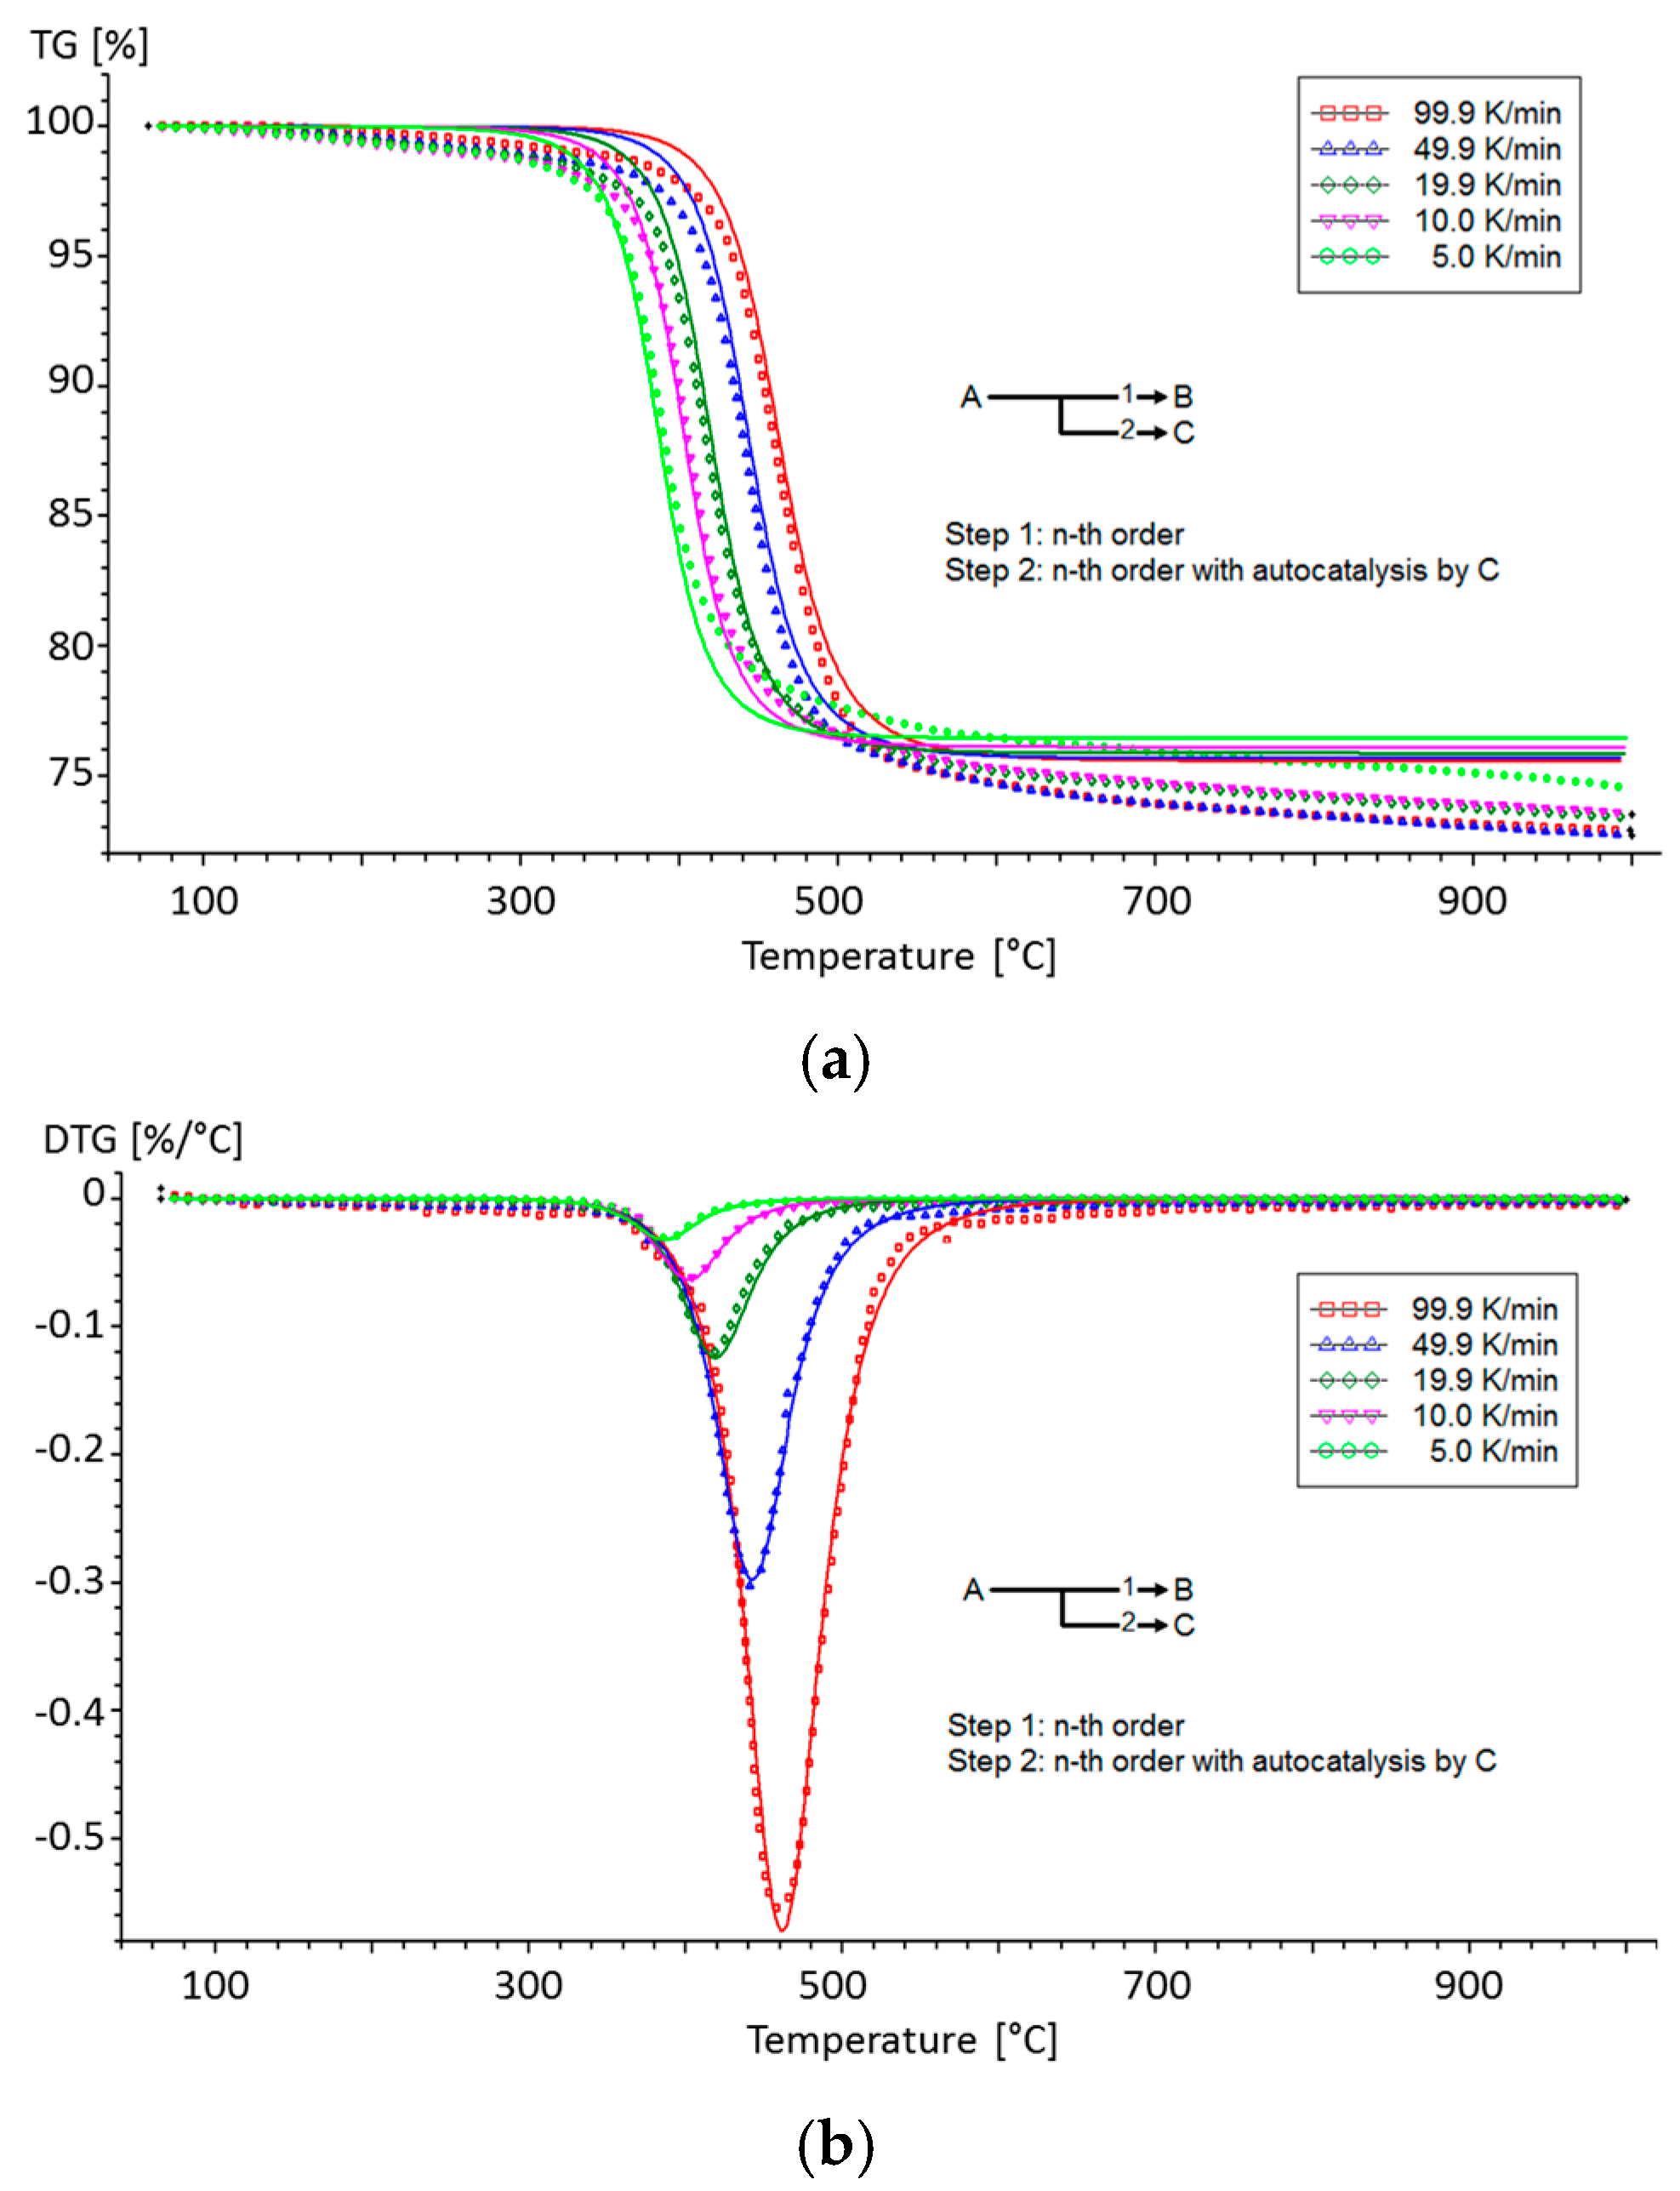
| Reaction | Step 1 | Step 2 | Unit | |
|---|---|---|---|---|
| nth order decomposition | ||||
| Activation energy | Ea | 58.7107 | 146.6740 | (kJ/mol) |
| Frequency | Log A | 0.8585 | 8.7268 | (1/s) |
| Order | n | 1.1125 | 2.0825 | (-) |
| Contribution | Fraction | 0.5540 | 0.9479 | (-) |
| Autocatalysis | ||||
| Constant | logKcat | - | 0.8744 | (-) |
| Gases | H2O | CO2 | CO | SO2 | CH4 | NH3 |
|---|---|---|---|---|---|---|
| Volume fraction (Vi) (-) | 0.675 | 0.213 | 0.038 | 0.039 | 0.019 | 0.01 |
| Name | Exp. | Value 1 | Unit |
|---|---|---|---|
| Virgin density | 1575 | (kg/m3) | |
| Degraded density | 1165 | (kg/m3) | |
| Virgin specific heat capacity | 2.8773 T + 687.31 with 20 °C ≤ T ≤ 300 °C | (J/(kg·K)) | |
| Degraded specific heat capacity | 5.1327 × 10⁻⁷ T3 − 2.0761 × 10⁻³ T2 + 2.599 T + 662.53 | (J/(kg·K)) | |
| Gas specific heat capacity | 3.5977 × 10⁻⁷ T3 − 9.2485 × 10⁻⁴ T2 + 1.0610 T + 1256.6 | (J/(kg·K)) | |
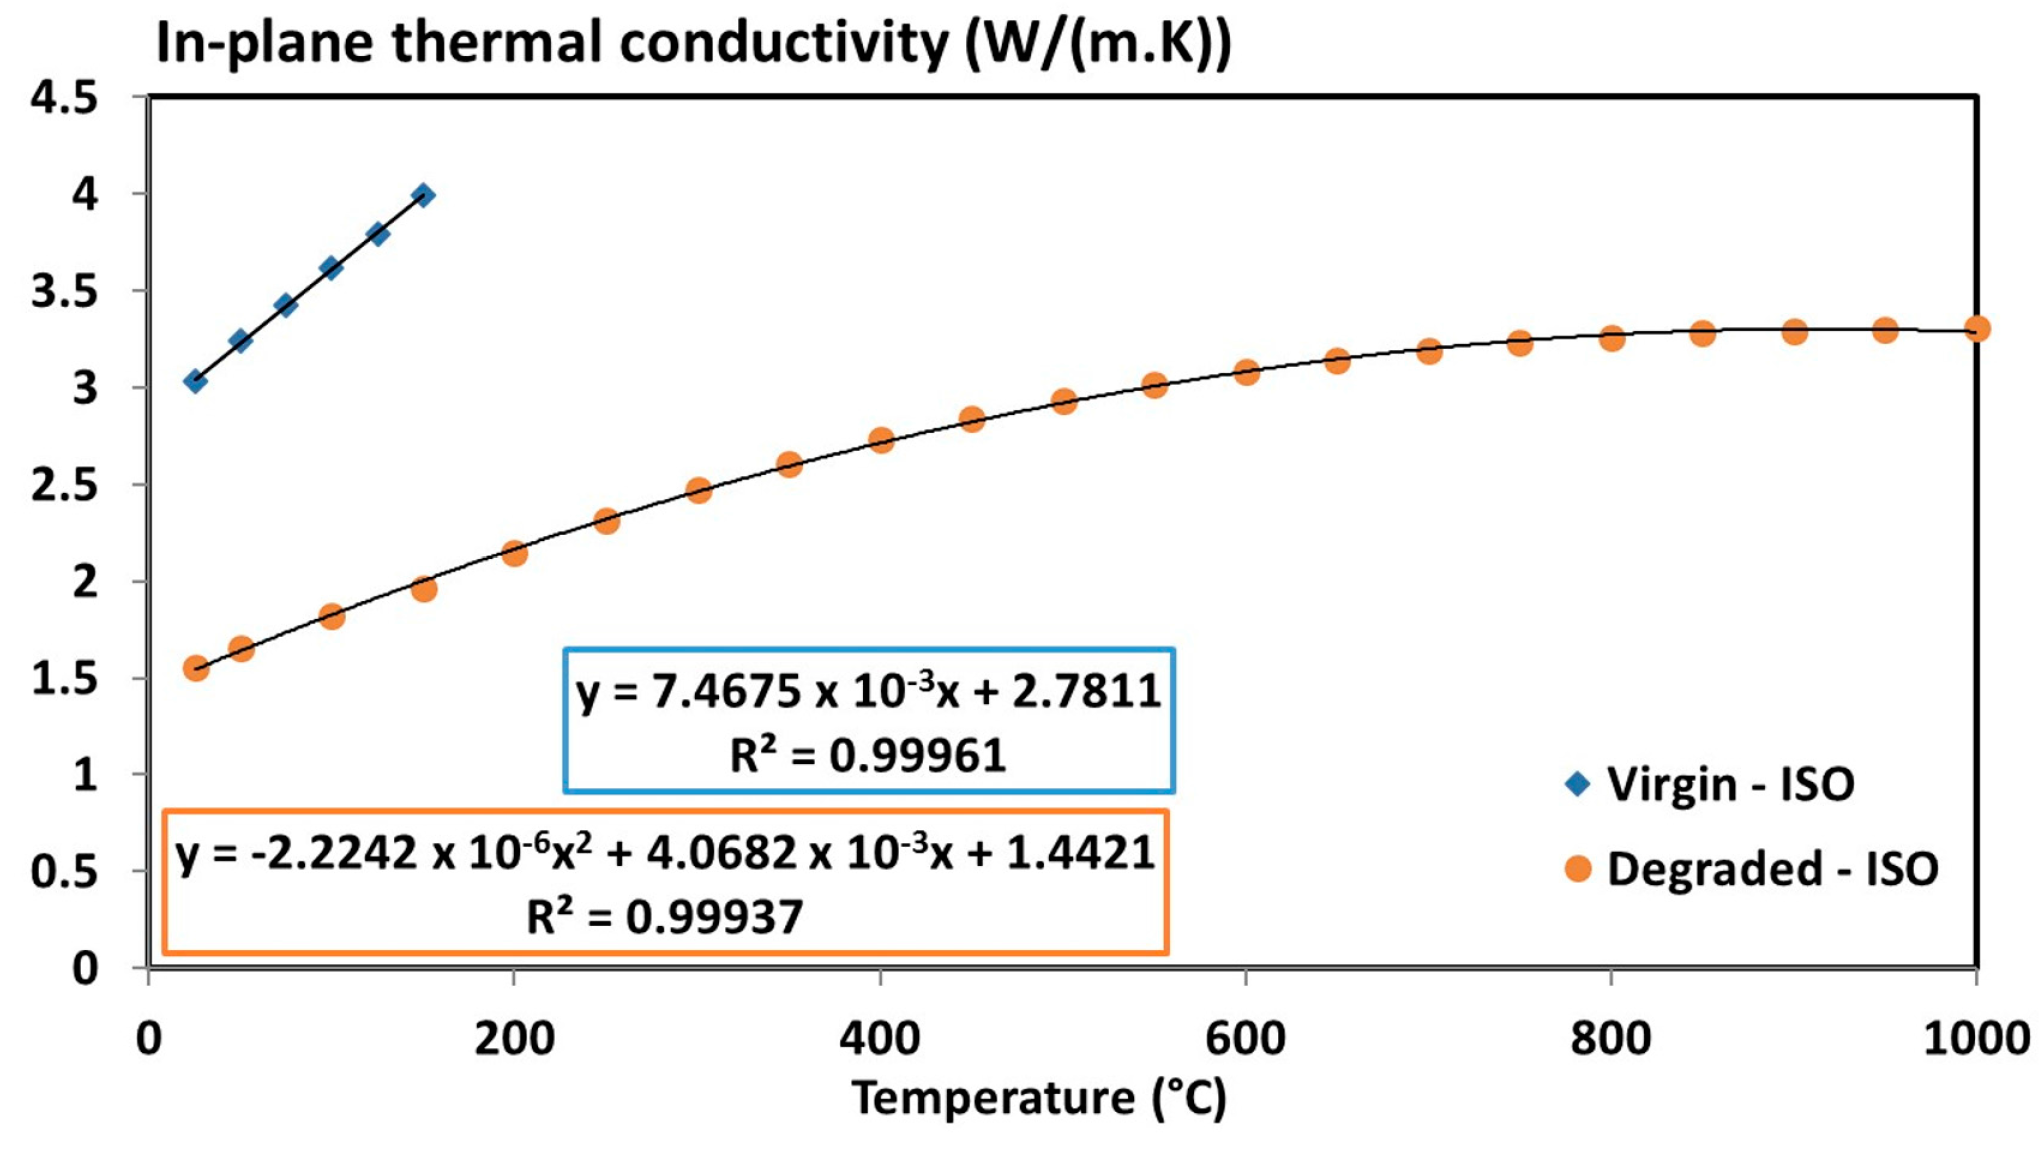
| Tensor of the virgin thermal conductivity, | 7.4675 × 10⁻³ T + 2.7811 with 20 °C ≤ T ≤ 150 °C | (W/(m·K)) | |
| 1.1113 × 10⁻³ T + 0.61391 with 20 °C ≤ T ≤ 150 °C | (W/(m·K)) | ||
| Tensor of the thermal conductivity, | −3.5481 × 10⁻⁶ T2 + 6.4898 × 10⁻³ T + 2.3005 | (W/(m·K)) | |
| 7.4228 × 10⁻¹⁰ T3 − 4.1903 × 10⁻⁷ T2 + 2.3397 × 10⁻⁴ T + 7.7211 × 10⁻² | (W/(m·K)) | ||
| Heats of decomposition | 259.54 | (kJ/kg) | |
| −152.22 | (kJ/kg) | ||
| Arrhenius parameters step 1 | 7.2193; 58.7107; 1.1125; 0.554 | (1/s, kJ/mol, -, -) | |
| Arrhenius parameters step 2 | 5.3309 × 10⁸; 146.674; 2.0825; 7.4886; 0.9479 | (1/s, kJ/mol, -) (-, -) |
© 2017 by the authors. Licensee MDPI, Basel, Switzerland. This article is an open access article distributed under the terms and conditions of the Creative Commons Attribution (CC BY) license (http://creativecommons.org/licenses/by/4.0/).
Share and Cite
Tranchard, P.; Samyn, F.; Duquesne, S.; Estèbe, B.; Bourbigot, S. Modelling Behaviour of a Carbon Epoxy Composite Exposed to Fire: Part I—Characterisation of Thermophysical Properties. Materials 2017, 10, 494. https://doi.org/10.3390/ma10050494
Tranchard P, Samyn F, Duquesne S, Estèbe B, Bourbigot S. Modelling Behaviour of a Carbon Epoxy Composite Exposed to Fire: Part I—Characterisation of Thermophysical Properties. Materials. 2017; 10(5):494. https://doi.org/10.3390/ma10050494
Chicago/Turabian StyleTranchard, Pauline, Fabienne Samyn, Sophie Duquesne, Bruno Estèbe, and Serge Bourbigot. 2017. "Modelling Behaviour of a Carbon Epoxy Composite Exposed to Fire: Part I—Characterisation of Thermophysical Properties" Materials 10, no. 5: 494. https://doi.org/10.3390/ma10050494