1. Introduction
The interest in controlling grain growth in ceramic fabrication processes generally arises from two main causes. It may be a direct end in itself, insofar as the grain size of the finished article is one of the major factors determining its properties; alternatively it may be a means to the end of preparing articles of close to theoretical density. As a consequence, the justification for efforts to control grain size is sought in the advantage brought either by a specific grain size or by high density.
Grain size can affect the properties of the finished article. While few properties of ceramics are completely independent of grain size, most attention has been drawn to those mechanical and dielectric/magnetic properties where the structure-property relationship is very clear. The most striking of these are the effect of grain size
on fracture strength,
[
1,
2], the effect of grain size on high temperature creep deformation,
, where
m is a constant whose value depends on the creep mechanism [
3]. A wide range of electrical and magnetic parameters are affected by grain size [
4,
5].
The second reason for controlling grain growth has been found in the search for high density in sintering [
6]. The recognition that densification can only proceed at a reasonable rate as long as the sources and sinks for the associated diffusion process are kept close together and, more particularly, the identification of the grain boundary and the pore as the sources and sinks for the diffusion atoms, have suggested that ultimate density is only to be expected where pores remain attached to grain boundaries [
7].
Similarly to many other ceramic materials, nuclear fuel based on UO
2 and (U,Pu)O
2 is processed by powder sintering. However, in this case the main reason for controlling grain growth is to reduce the fission gas release in the fuel rods, in order to achieve increases in fuel burnup. With this in mind, the processing of ‘coarse grain’ microstructures was considered as early as the 1970’s with the aim of reducing the fraction of gas released by increasing the diffusion distances to the grain boundaries. Positive results were reported for coarse-grained UO
2, obtained by annealing [
8]. Grain growth in the final stage of sintering is the result of interactions between the grain boundaries and the residual porosity.
In addition to the atomic diffusion, a rather important mechanism of fission gas release from the interior of fuel grains to the grain boundaries under irradiation conditions is collection of gas lodged in the fuel matrix by moving grain boundaries. Incorporation of fission gas in a grain boundary by those mechanisms is irreversible because the thermodynamic solubility of the rare gases in UO2 is essentially small. Fission products in the grain boundaries migrate along the boundaries and precipitate into gas bubbles which eventually link up and vent to the environment. The latter phenomenon is important at high burnup, but the former process is dominant at low burnup resulting in significant growth of the bubbles and fuel swelling (reducing the thermal conductivity of the fuel material).
Grain growth is the process by which the mean grain size of aggregates of crystals increases. The driving force for this process results from the decrease in free energy which accompanies reduction in total grain boundary area. Second-phase inclusions act as pinning agents to grain boundaries since the attachment of an inclusion reduces the total boundary energy by an amount equal to the specific surface energy times the area occupied by the inclusions. If the inclusions are relatively immobile, a boundary pinned at an inclusion can only move by breaking free. This occurs when the driving force for the boundary migration exceeds the pinning force exerted by inclusions on the boundary. In the case of mobile second-phase inclusions (e.g. gas bubbles or sintering pores), they migrate along with the boundaries, in some circumstances giving a boundary migration rate controlled by the movement of the second-phase particles.
Burke and Turnbull [
9] deduced a parabolic relationship for normal grain growth kinetics. They modelled migration of a boundary as occurring by atom transport across the boundary due to a surface curvature and pressure gradient between grains. In this approach the driving force applied to the boundary of a spherical grain with radius
is written as:
where
is the surface energy of the boundary, and
≈ 1−2 is a geometric factor. Under simplifying assumption
, where
is the mean grain radius, the mean grain boundary velocity is given by equation:
where
is the grain boundary mobility, and
. After integration, Equation (2) results in the parabolic grain growth.
A more appropriate treatment of the grain growth problem with consideration of grain coalescence was performed by Greenwood [
10], who modified Equation (1) to the form:
where
is the critical radius which varies with time. Therefore the grain boundary velocity of a spherical grain with the radius
is given by equation:
Grains grow or collapse depending on whether or , respectively.
Using Equation (4), the kinetics become identical with those for Ostwald ripening of a distribution of second phase particles, with interphase reactions controlling the rate at which large particles grow at the expense of smaller ones. Hillert [
11] used previous analysis of Lifshitz and Slyozov [
12] for Ostwald ripening to obtain parabolic kinetics for grain growth. According to Hillert's theory [
11] the critical radius satisfies equation:
whereas the mean grain radius
is related to the critical radius
by:
So, for the mean grain growth velocity this results in:
where
Hence, in comparison with the simplified approach [
10], the effective mobility of the mean grain boundary migration in Equation (7) turns out to be one order of magnitude smaller than in Equation (2).
Speight and Greenwood [
13] applied the grain growth theory to nuclear fuels taking into consideration the sweeping of entrapped gas by the front of an advancing grain boundary. The basic postulate of their model is that small bubbles, because they exert a minimal drag force on an advancing grain surface, are swept along with the moving boundary, whereas large bubbles, because of their higher drag, can detach from the advancing surface.
In order to calculate the retarding effect of bubbles or pores on a separately moving grain boundary, Nichols [
14] showed that in presence of the attached bubbles (or pores) the grain boundary motion is governed by the net force
, where
F is the force applied to a separate bubble and
is the surface concentration of bubbles, moving along with the grain boundary. Therefore the grain boundary velocity was calculated modifying Equation (2) as:
Simultaneously, the bubble velocity
is equal to
, until the bubble is attached to the boundary [
9]:
where
, and
is the bubble diffusion coefficient (dependent on the bubble radius
).
Using Equations (9) and (10) the force
F can be calculated as:
Therefore, one derives the equation for the grain boundary velocity [
14]:
or
where
is the grain boundary velocity in the lack of the attached bubbles.
However, Nichols analysed a simplified problem of a single boundary movement representing an average behaviour of an aggregate of crystals, without consideration of a real size distribution of grains and their coalescence. Such a consideration can be done in the framework of Hillert’s mean-field approach [
11] and was performed in the author paper [
15]:
It is important to note from Equation (14) that pore (bubble) parameters control boundary movement when
. Comparing Equation (14) with Equation (13) one can see that in the advanced model (with application of Hillert’s approach to consideration of grain size distribution) this occurs significantly earlier when
,
i.e., at grain size one order of magnitude smaller than in the simplified approach [
14].
To take into account different kinds of gas bubbles on the grain boundary,
i.e., face (
f), edge (
e) and corner (
c) bubbles, relationship similar to Equation (10) should be applied to each kind of porosity [
16]:
therefore, the net force acting on the boundary takes the form:
and for the grain boundary velocity one obtains [
15]:
In the absence of porosity the grain growth under isothermal conditions can be satisfactorily described by parabolic kinetics, derived by direct integration of Equation (7):
where
and
are the average grain radii of the sample before annealing and after an annealing time
t at a temperature
T, respectively.
In porous materials the grain growth is the result of interactions between grain boundaries and pores, which give rise to drag effect which impedes boundary motion in accordance with Equation (14). For instance, for materials with the total porosity invariable during annealing the grain growth was approximated in [
14,
17] by a more slow kinetic equation:
with the growth exponent
n = 3 or 4, depending on pore migration mechanism, in a good agreement with experimental observations, e.g. [
18,
19]. However, recently it was revealed that in many cases the normal grain growth kinetics must be described by non-integer exponents, somewhat different from 3 or 4 [
20].
In
Section 2 it is shown, following the original publication of the author [
21], that additional consideration of the porous material densification (
i.e., porosity reduction under high temperature annealing conditions) in the course of the grain growth allows explanation of complicated grain growth kinetics characterised by non-integer growth exponents observed in the tests.
In application to irradiated materials with gas bubbles formed on the grain boundaries, Nichols’ approach [
14] has another deficiency associated with consideration of a retarding effect using the standard mechanisms of bubble mobility derived by Shewmon [
22] for spherical (e.g. intragranular) bubbles. However, besides a more complicated (so called “lenticular”) shape of grain face bubbles, the migration mechanism of these bubbles might be essentially different from that of the intragranular bubbles, owing to their specific location on and interaction with a grain boundary. A new mechanism of the lenticular grain face bubble migration which controls the bubble mobility and determines the drag force exerted on the grain boundary, proposed in the author’s paper [
15], will be presented in
Section 3.
In
Section 4 of the current paper the new mechanism is extended to consideration of the grain boundary peripheral (edge and corner) bubbles migration associated with vacancy fluxes along the grain boundary, following the original publication of the author [
23].
In
Section 5 further generalization and improvement of the model for the grain growth controlled simultaneously by sintering pores and gas bubbles migration (also considered in [
23]), is presented. For this purpose, pore coalescence during grain growth and pores shrinkage, caused by vacancies thermal evaporation from pores and by vacancies knockout from pores under irradiation, are self-consistently considered in the improved model.
Implementation of the advanced grain growth model in the MFPR code designed for modelling fuel performance and fission products release [
24,
25], and its validation against various tests are presented in
Section 6.
2. Effect of Sintering Pores on Normal Grain Growth Kinetics
For explanation of the normal grain growth kinetics, Equation (19), a series of models has been proposed, most of them based on consideration of Kingery and François [
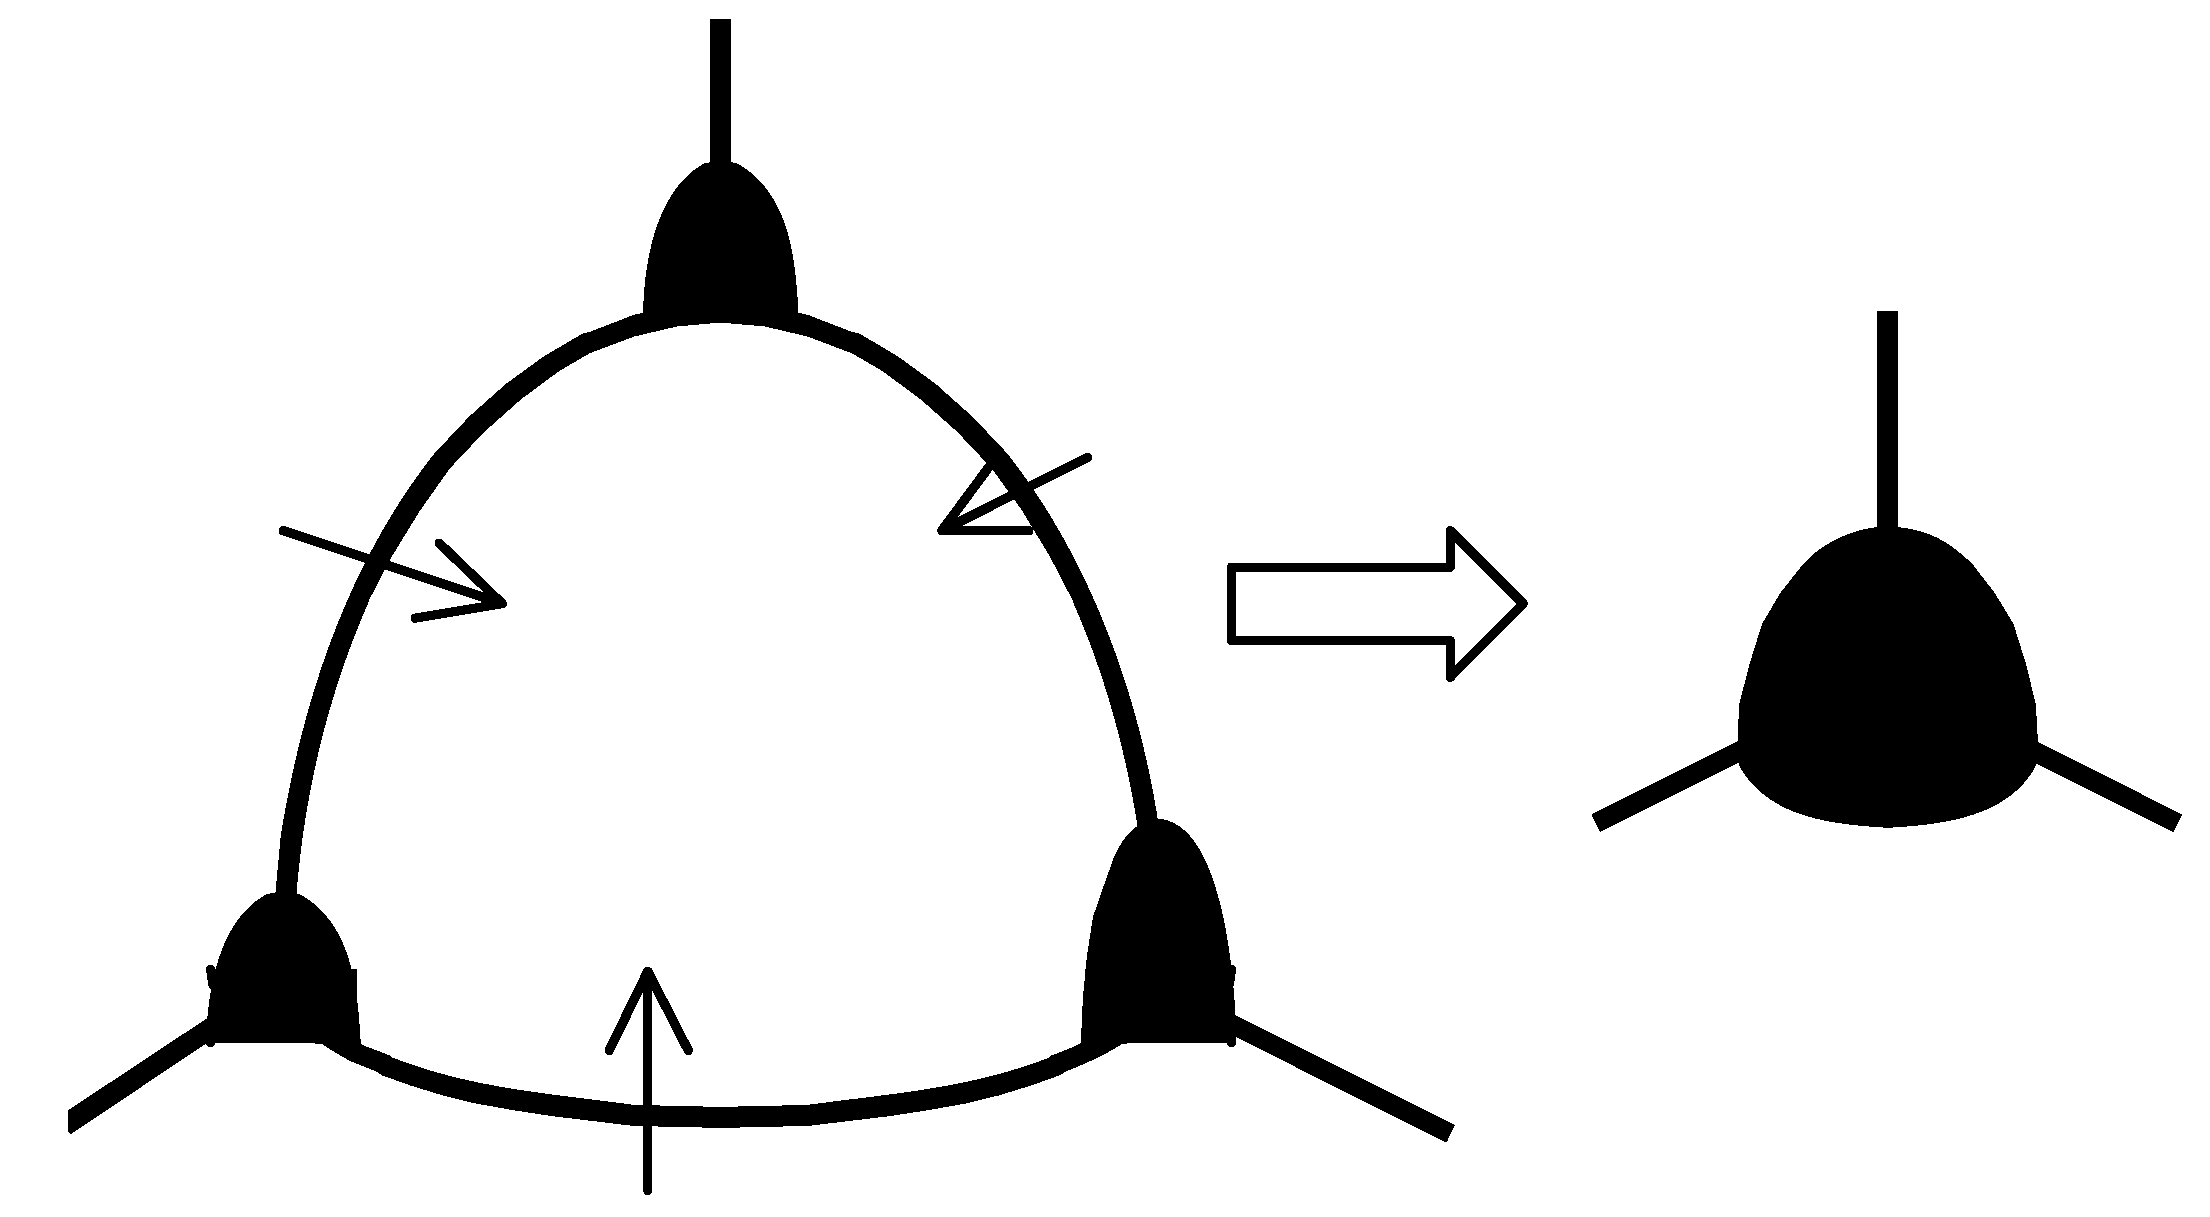
26]. They assumed that, as grains are removed in the growth process, pores migrating with the boundaries are brought together, and pore growth occurs together with grain growth, see
Figure 1. After, say, twofold increase of the mean grain size, an amount of grains
decreases by one order of magnitude (
), and practically all pores are located at grain corners, so amount of pores
becomes proportional to the amount of grains,
.
Figure 1.
Pore migration with boundaries and resulting pore growth during normal grain growth.
Figure 1.
Pore migration with boundaries and resulting pore growth during normal grain growth.
Kingery and François additionally assumed that in the later stages of sintering grain growth is relatively faster than fuel densification, so that the pore fraction remains essentially constant. Under such an assumption, the mean pore radius
and thus is proportional to the mean grain radius:
On this basis, to account for drag effect of the pores, they proposed to introduce an additional factor in the r.h.s of Equation (7), leading to Equation (19) with n = 3 after integration.
Later Nichols [
14] derived a more appropriate equation for the drag force, Equation (12), which was applied by Brook [
17] to consideration of normal grain growth kinetics controlled by pore migration. Using this equation for the later stages of sintering when corner pore mobility controls boundary movement, Brook obtained an equation:
where
is the surface concentration of pores on the boundary, and pore mobility:
is determined by migration mechanism,
i.e.,
n = 3 for the mechanisms of lattice diffusion and gas phase transport at
P = const., and
n = 4 for the surface diffusion mechanism [
22]. He also noticed that for the considered situation where pores are located at grain corners, their separation is proportional to
, so the surface concentration of pores on the boundary is inversely proportional to
:
Substitution of Equations (22) and (23) in Equation (21) results in:
or, after its integration:
Therefore, namely the pore migration mechanisms by lattice diffusion and gas phase transport at P = const. provide grain growth kinetics with n = 3, whereas n = 4 is afforded by the surface diffusion mechanism.
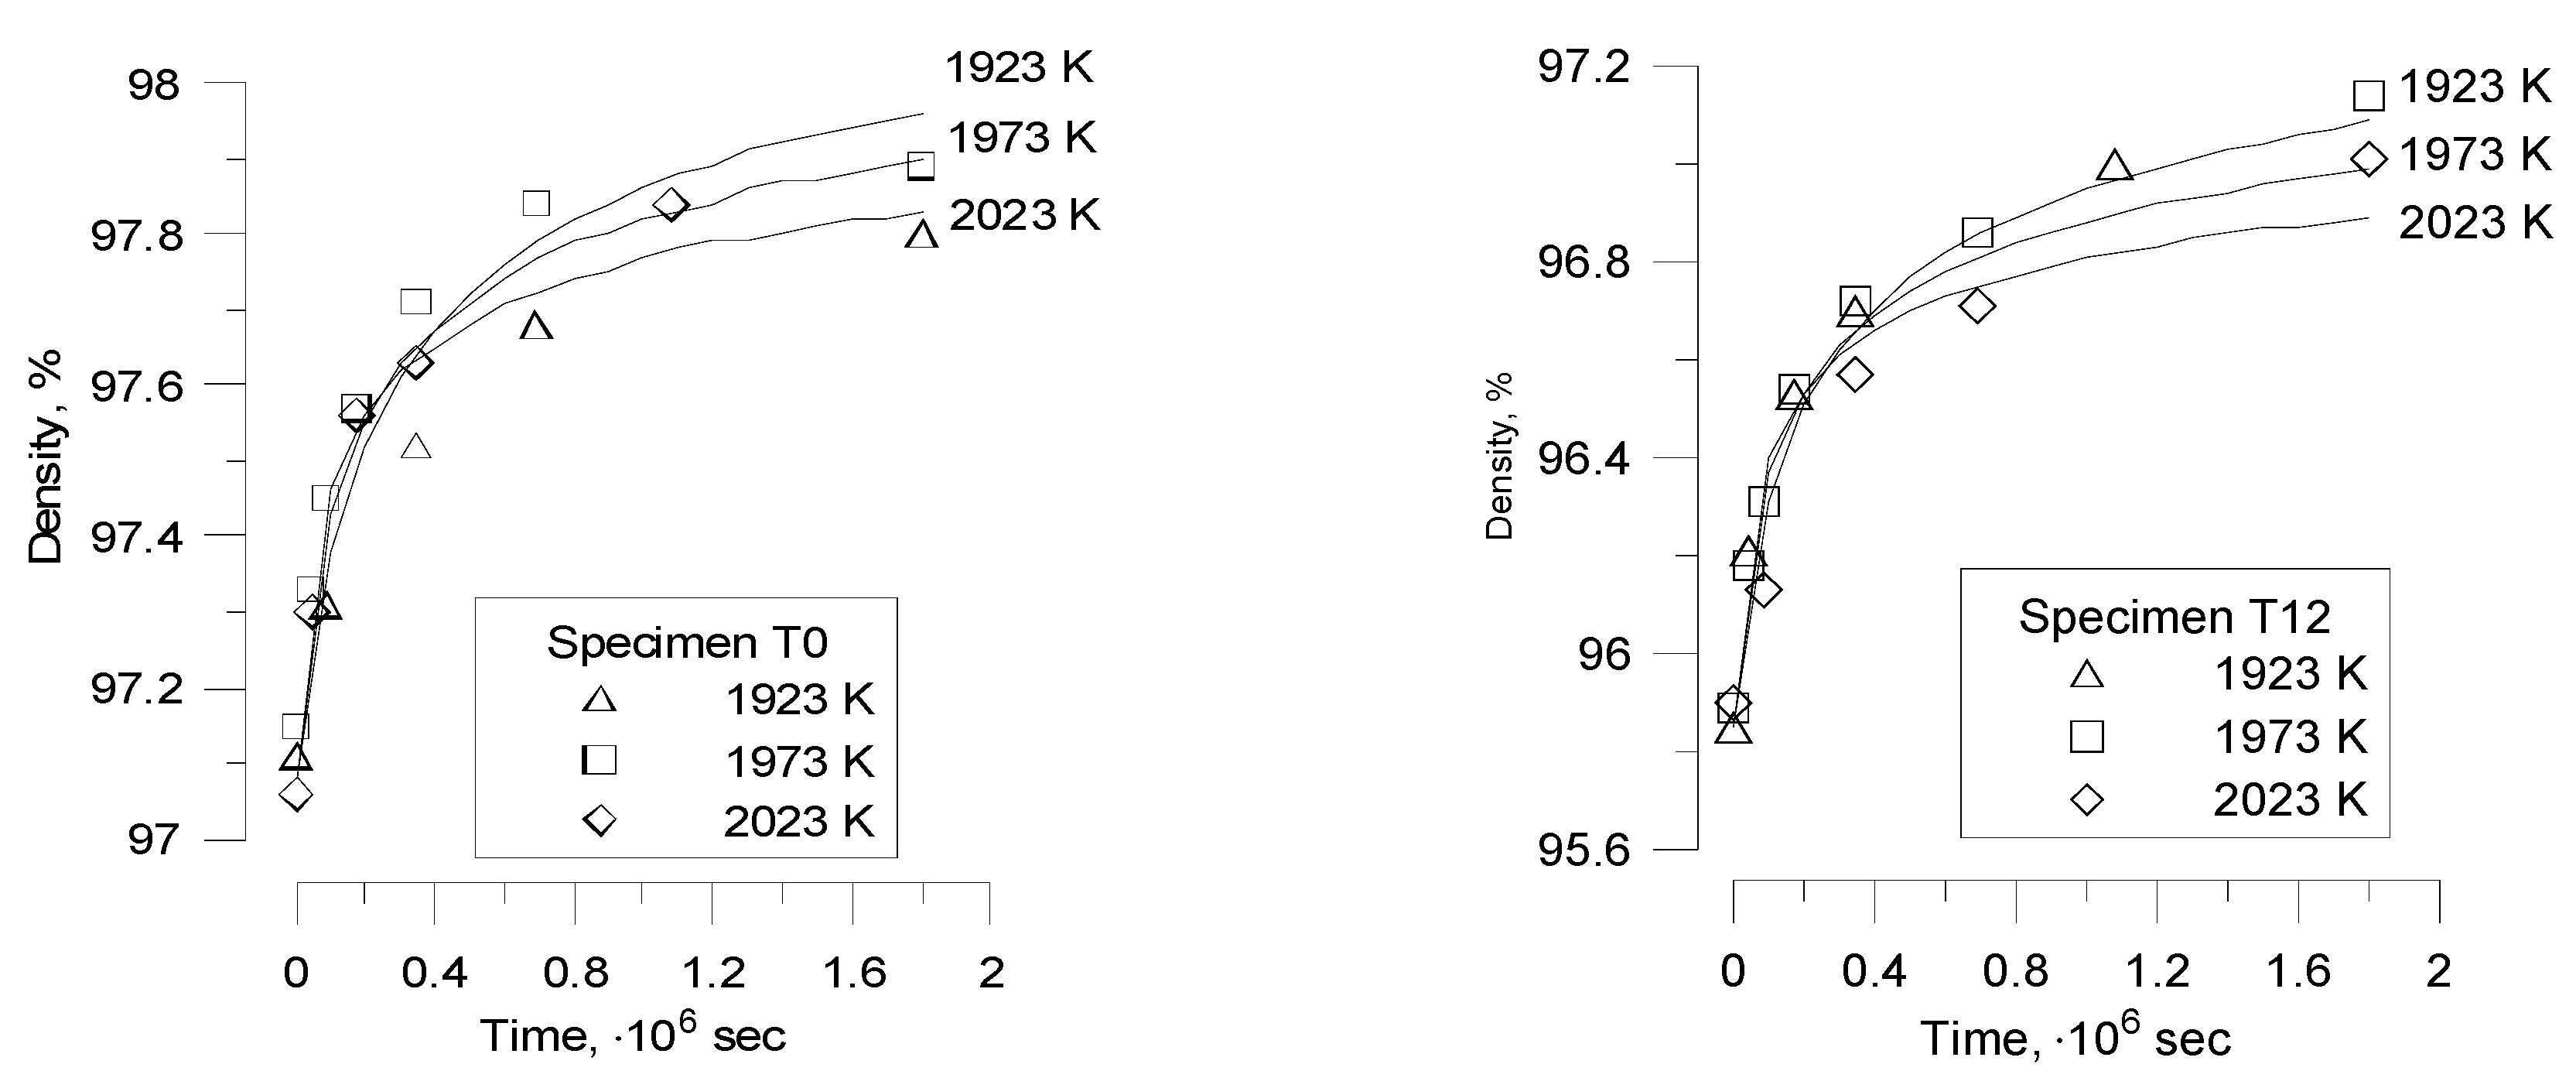
Nevertheless, Bourgeois
at al. [
20] noticed that to describe grain growth during porous UO
2 thermal treatment (sintering) in their recent tests, the slope
as a function of
might be quite different from 1, whether with
n = 3 or
n = 4, and also from one temperature to another. Therefore, in order to describe grain growth in these cases, a non-integer exponent
n must be used.
In order to explain such behaviour, one should take into account that Equation (25) was derived under simplifying assumption that the pore fraction remains essentially constant during grain growth,
However, this assumption was not confirmed in the new tests [
20]. Indeed, in these tests changes in density of fuel pellets during heat treatment were monitored simultaneously with the grain growth measurements, which demonstrated a plain correlation between grain growth and fuel densification.
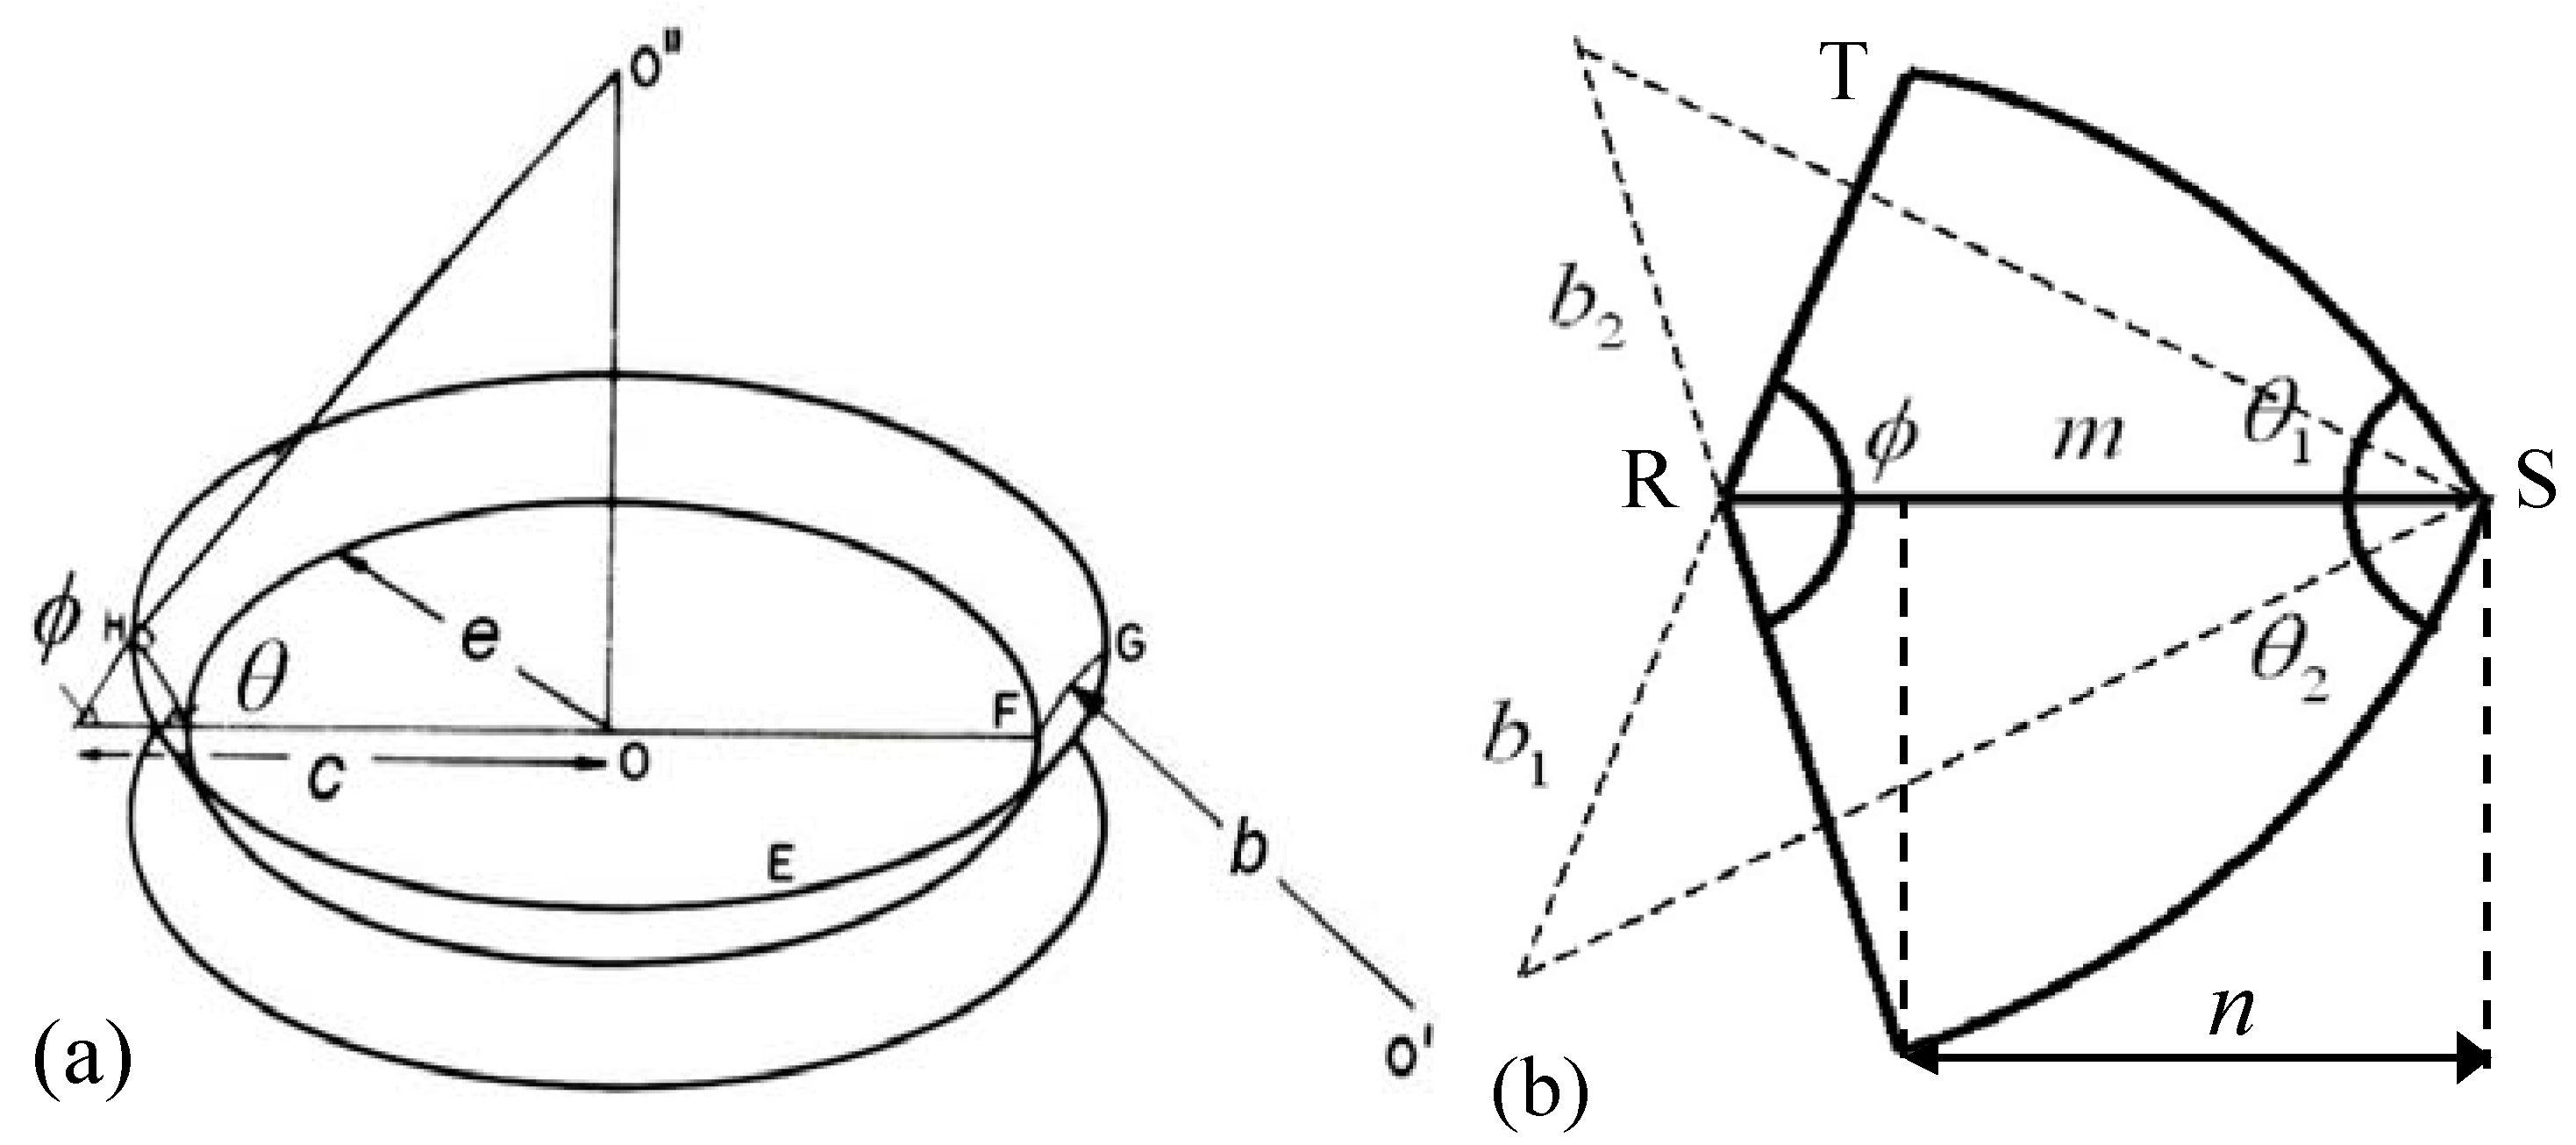
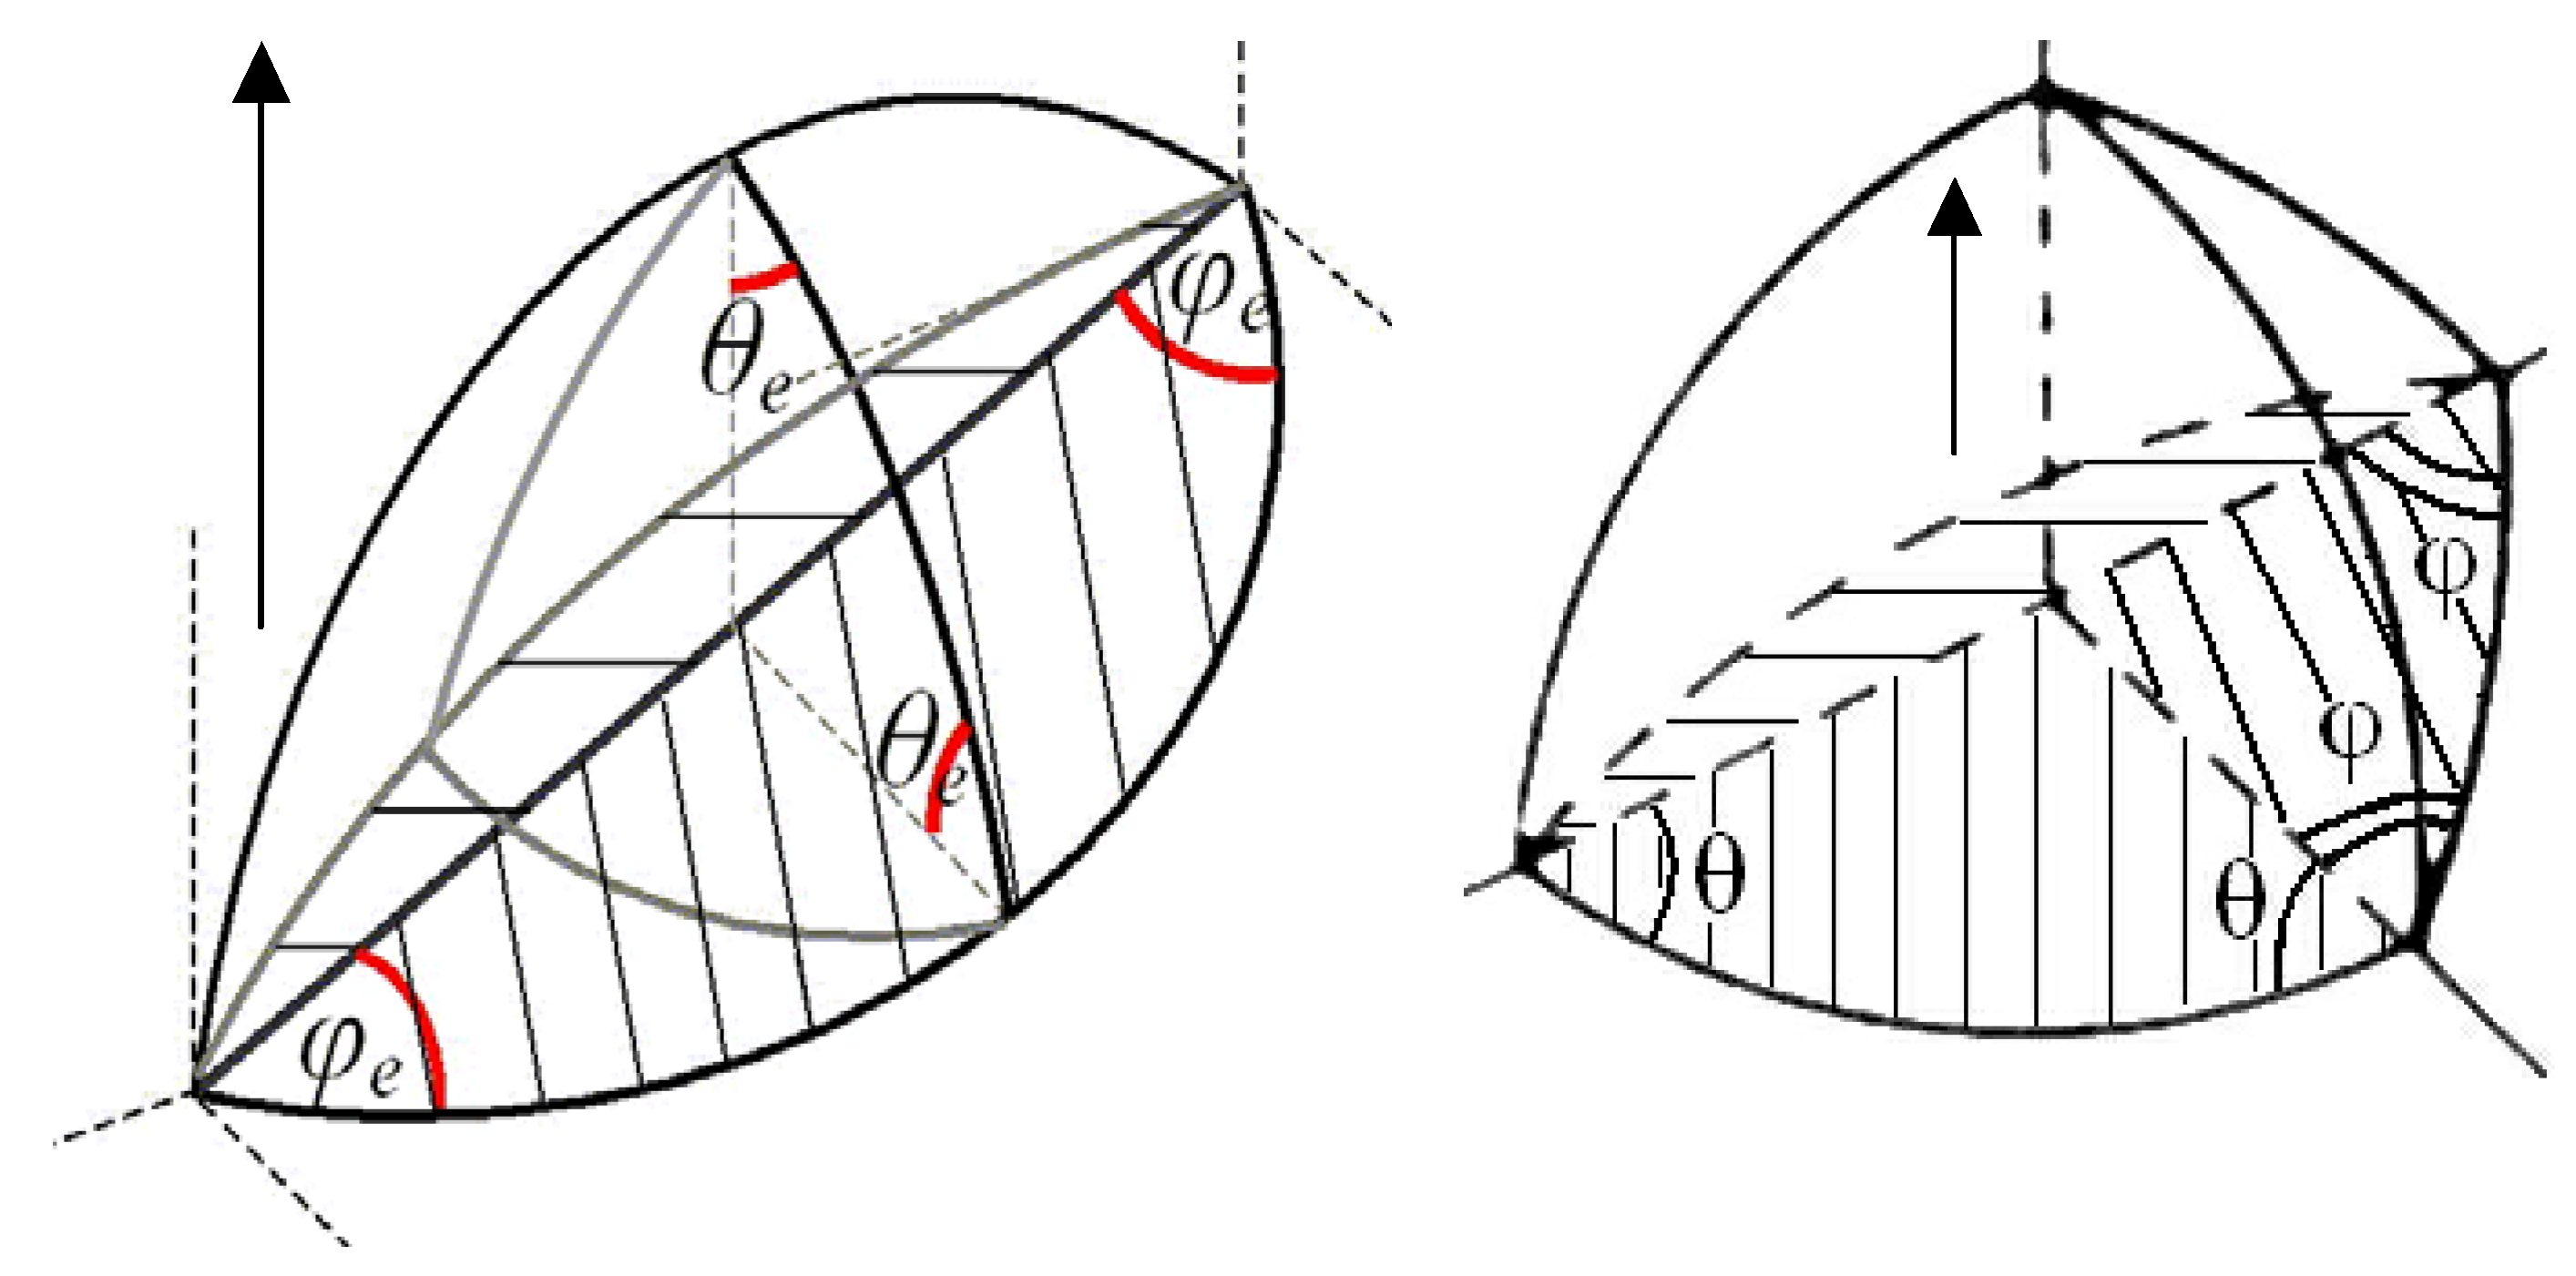
In order to take into consideration shrinkage of isolated pores owing to vacancies evaporation during thermal annealing, Speight and Beere’s approach [
27] (for the grain face cavities) was applied in [
21] to the case of the corner pore located at intersection of 6 grain faces (4 hexagonal and 2 square) of UO
2 grains considered as truncated octahedron (see details of this structure in
Section 4):
Where
Dgb is the grain boundary self-diffusion coefficient of uranium atoms, 2
w is the thickness of the grain boundary,
is the surface tension of the pore,
is the dimensionless factor,
determines the radius of the sink free zone
, which can be estimated taking into account that 24 corners are distributed over the grain surface with the area of ≈
,
i.e.,
Therefore, decrease of an isolated pore radius can be evaluated from Equations (26)-(27) as:
where
Neglecting pores shrinkage, one can obtain (following Kingery and François [
26]) that variation of total porosity in the course of pores coalescence is zero,
. However, taking pores shrinkage into consideration, one will obtain that in this case
where
and
Here
denotes variation of the pore mean volume owing solely to pores shrinkage, Equation (26), whereas
denotes total variation of the pore mean volume owing to pores simultaneous shrinkage and coalescence [
21].
Substituting Equations (26), (31) and (32) in Equation (30), one obtains
In the case when the corner pore mobility controls grain boundary movement, the relationship for the mean grain radius growth controlled by pore mobility, similar to Equation (14), takes the form:
where Equation (27) was used for
, and
[
22], if the surface diffusion mechanism controls the pore migration kinetics. Substituting this value in Equation (34), finally one obtains:
where
.
The system of Equations (33) and (35) has the solution:
and
The total porosity reduction can be calculated as
and after substitution of Equation (36):
where
.
Substituting Equations (29) and (37) in Equation (38), one can evaluate:
where
1−2, parameter
β depends on the fuel porosity (see designations after Equation (26)) and for the fuel density 96-98% varies in the range 0.2–0.3. Numerical estimations of Equation (39) presented in [
21] are in a reasonable agreement with the exponents derived from the measured in [
20] correlations between grain growth and fuel densification,
.
This means, as seen from Equation (37), that for the surface diffusion mechanism of pores the power exponent attains non-integer value ≈ 3.6–3.7, in a qualitative agreement with observations [
20]. Direct comparison of calculation results with the measurements will be presented in
Section 6.2.
3. Grain Growth Kinetics Controlled by Grain Face Bubble Migration
In accordance with [
22], the mobility of a spherical intragranular bubble with radius
is determined by various migration mechanisms:
where
n = 3 for the mechanisms of lattice diffusion and gas phase transport, and
n = 4 for the surface diffusion mechanism.
It was usually assumed that the same migration mechanisms can be also applied to the grain face bubbles with some renormalisation of the proportionality coefficient in Equation (40), owing to a more complicated lenticular form of these bubbles. However, a more profound difference from free intragranular bubbles arises on grain faces, which can significantly reduce the intergranular bubble mobility and thus migration velocity of the grain boundary. This new rate determining mechanism proposed in [
15] of bubble migration will be presented in this Section.
3.1. Phenomenological Consideration
Before presenting a more detailed “microscopic” consideration of the grain boundary migration with attached gas-filled bubbles, a phenomenological approach to calculation of the retarding force exerted by bubbles on the moving boundary will be presented.
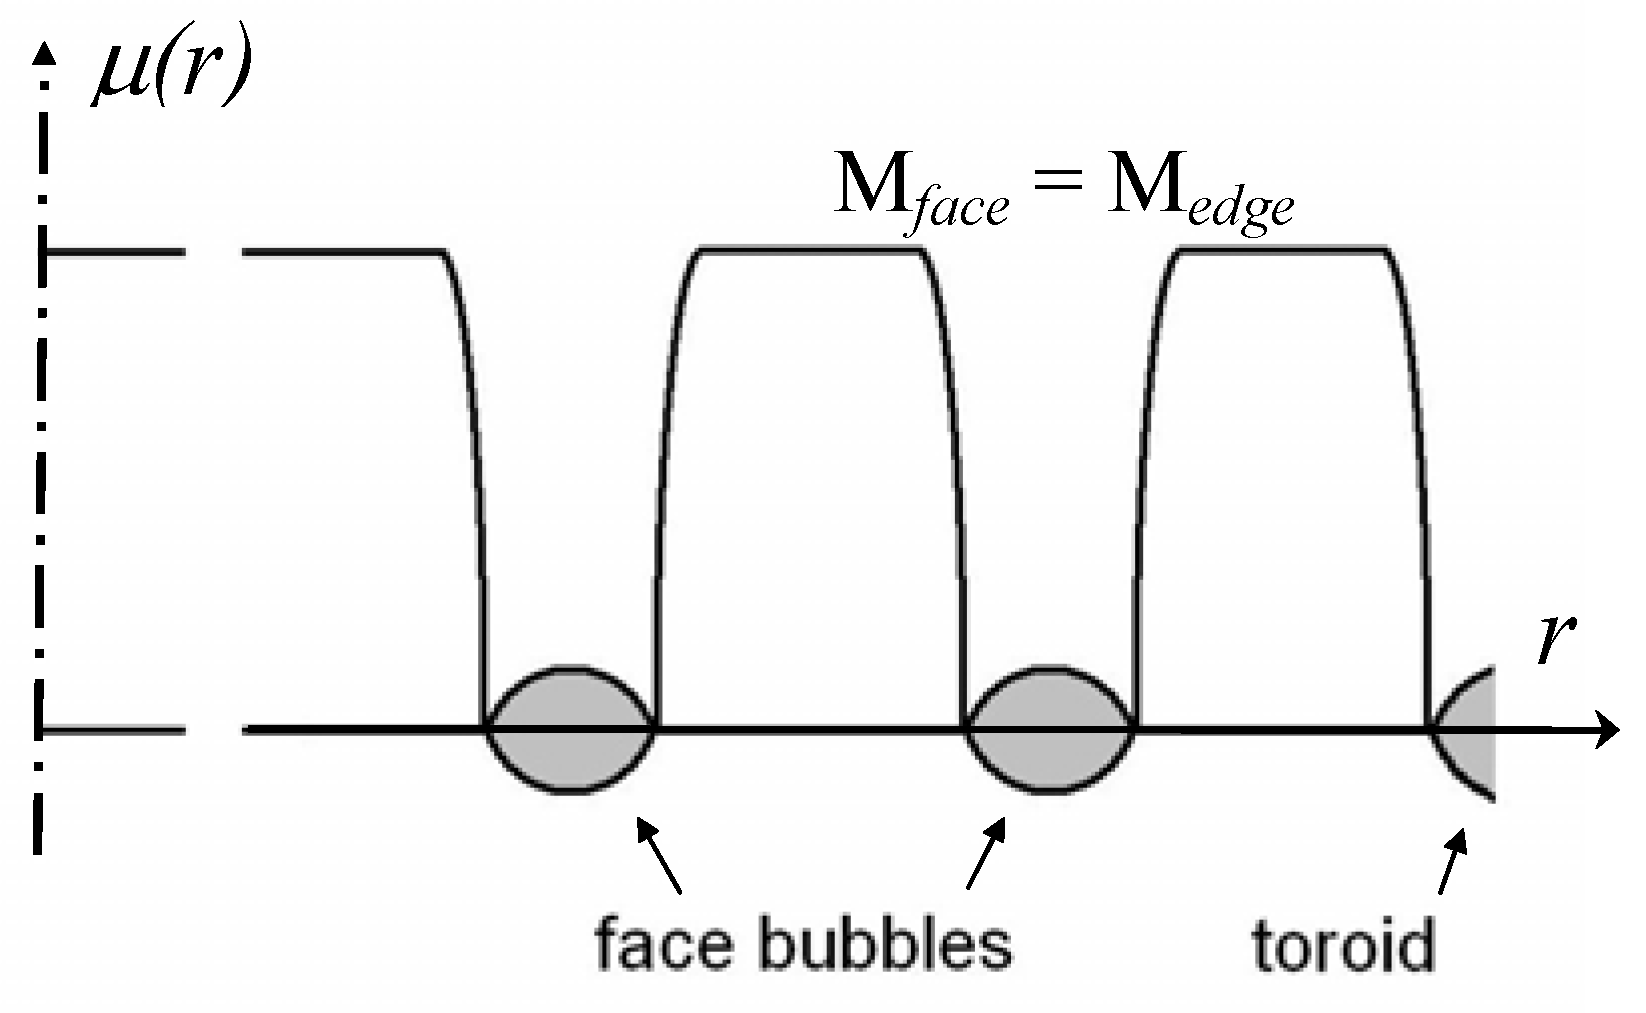
The driving force for the boundary migration can be derived from the pressure gradient across the boundary arising from its curvature given by expression
(see
Section 1). This pressure gradient between the two adjacent grains provides different boundary conditions also for gas bubbles in these grains; in particular, an additional external hydrostatic pressure
is applied to the spherical segment of the lenticular bubble surface in the shrinking grain.
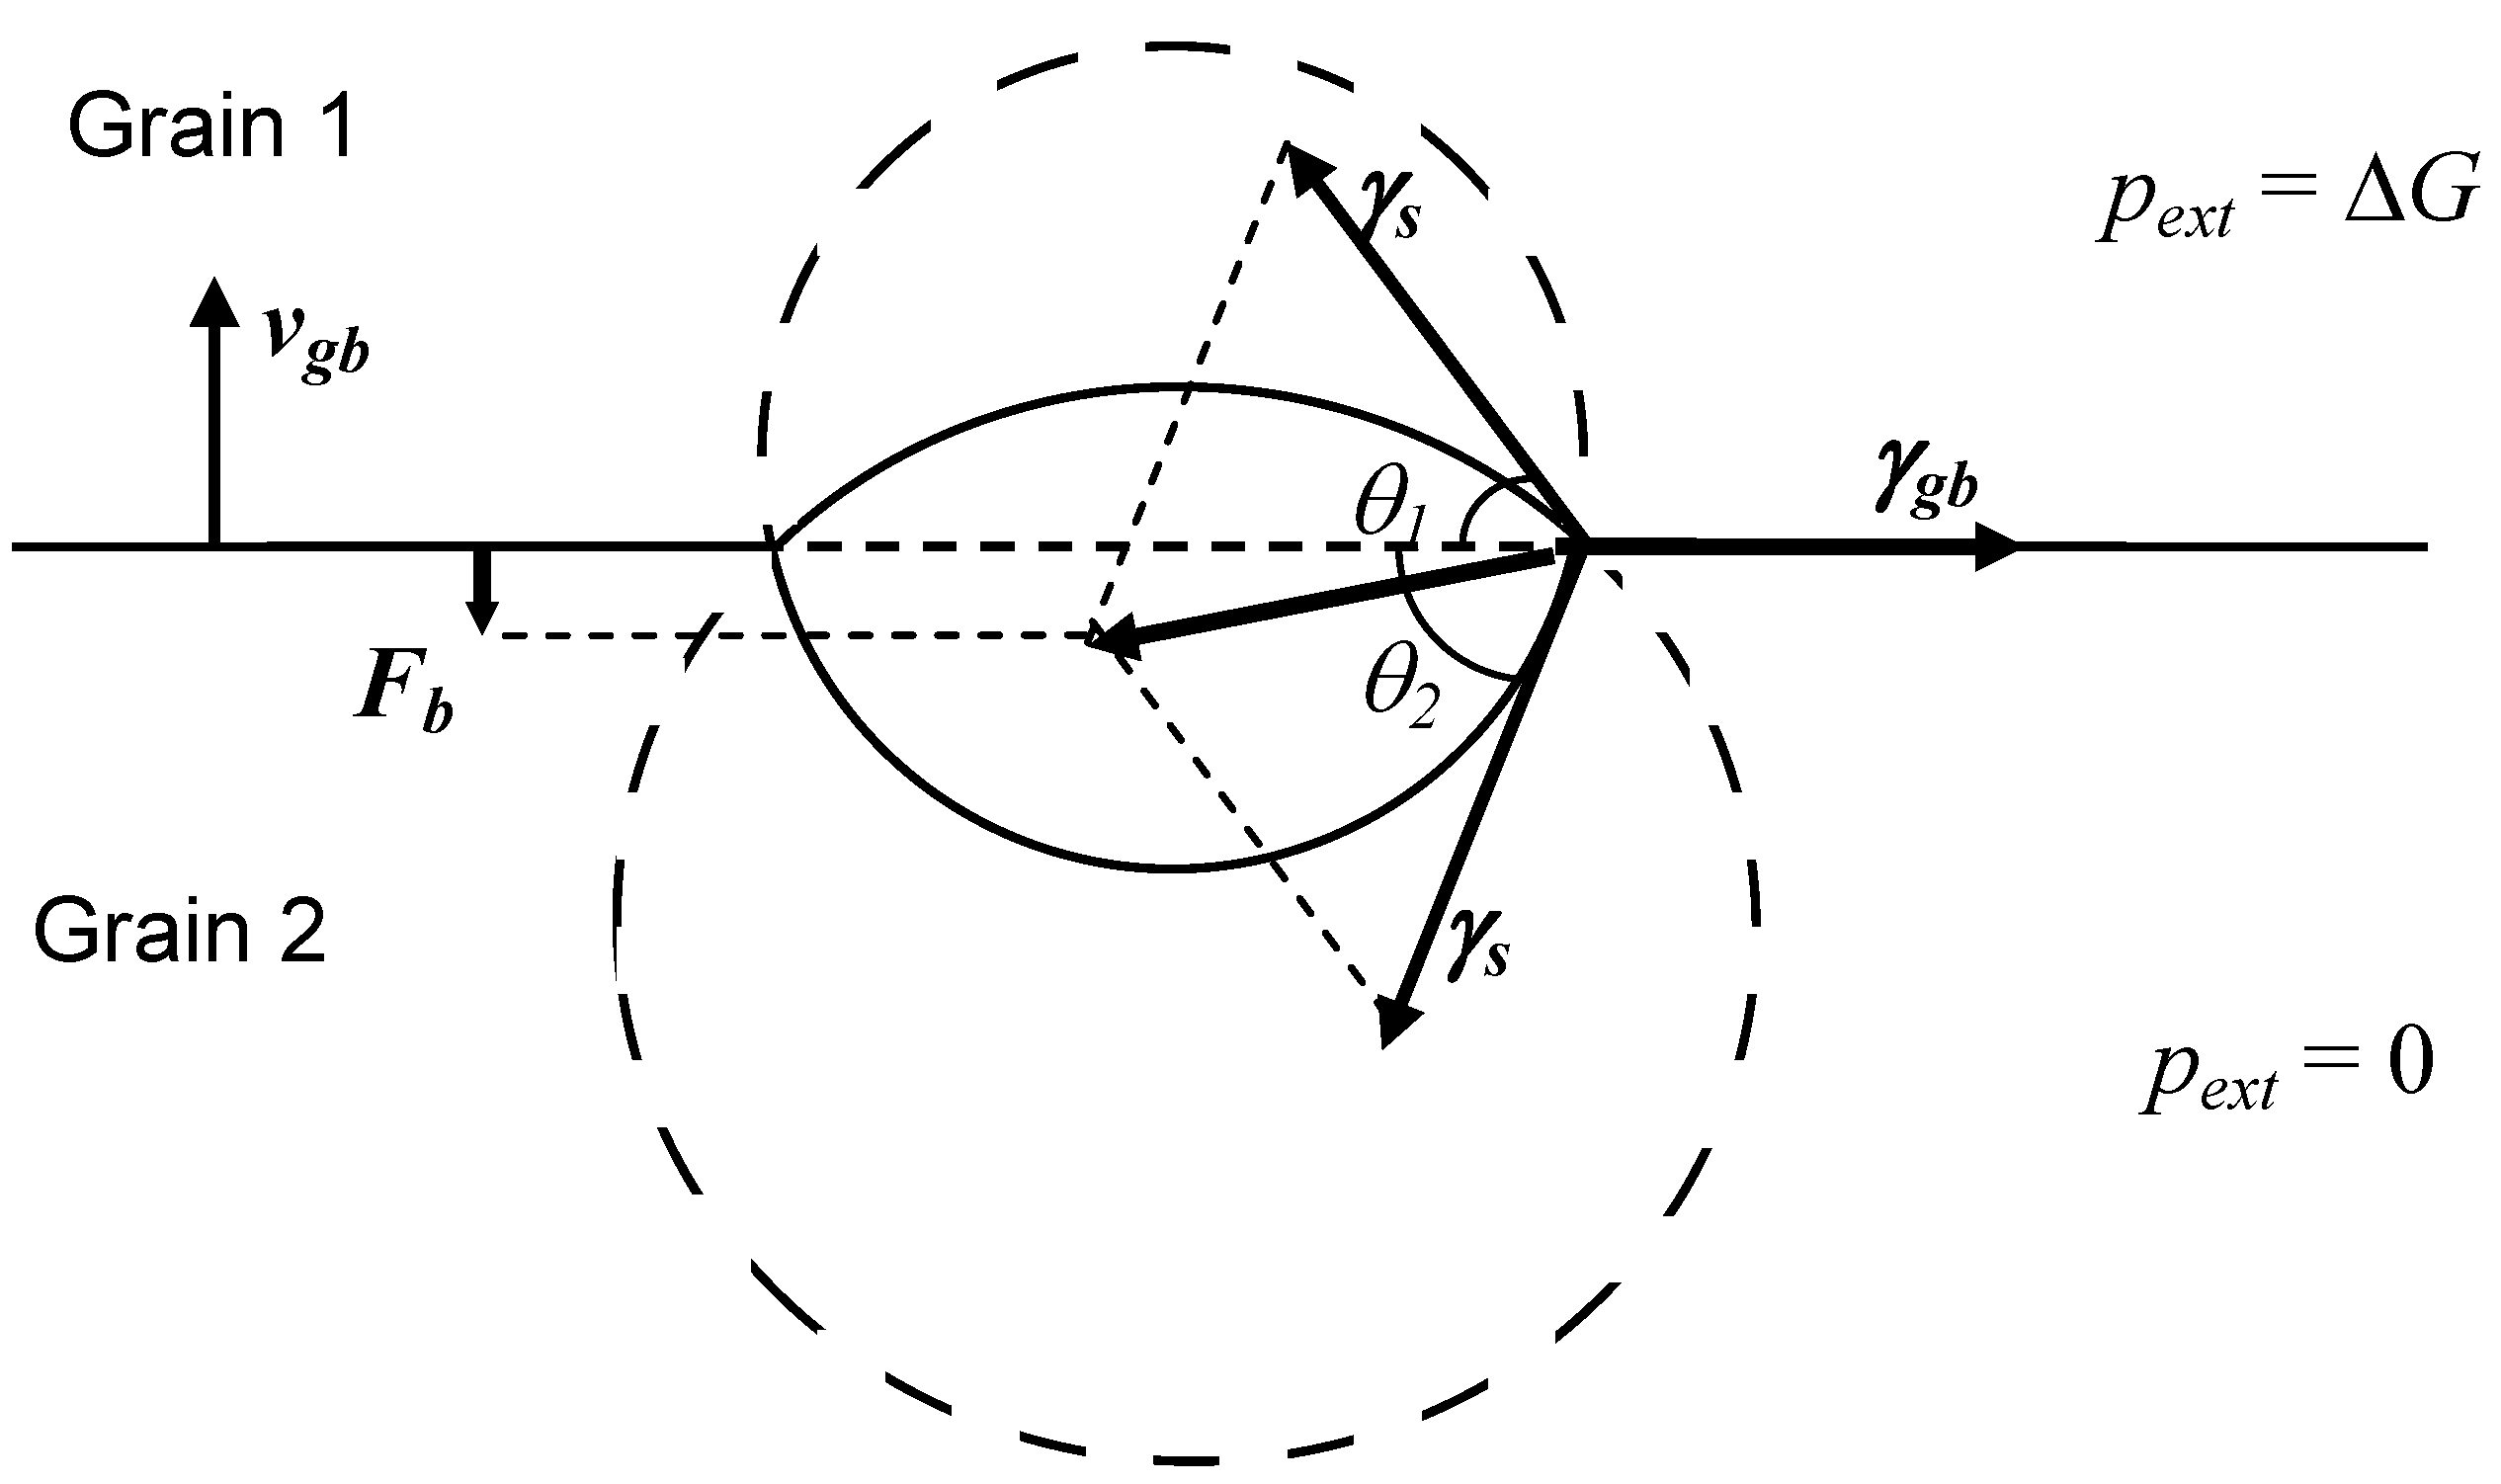
In order to clarify the nature of the drag force exerted on the grain boundary by an attached bubble, at first a simplified limiting case of a complete equilibrium of the lenticular bubble with both grains (shrinking and growing) separated by the boundary under steady-state conditions, will be considered,
Figure 2. In this limiting case:
where
is the internal bubble pressure,
and
are the curvature radii of the two surface segments of the bubble.
One can see from Equations (41) and (42) that the curvature radii of the two bubble surfaces are different, this induces different contact angles
and
with the grain boundary:
where
is the projected radius of the bubble in the plane of the boundary.
Figure 2.
Determination of the drag force exerted by attached lenticular bubble on moving grain boundary.
Figure 2.
Determination of the drag force exerted by attached lenticular bubble on moving grain boundary.
Assuming a balance between the surface tension forces in the plane of the grain boundary under steady-state conditions:
one can calculate a net force exerting by the bubble on the grain boundary in the normal to the grain boundary direction (see
Figure 2):
Substituting Equations (41)–(44) in Equation (45), one gets:
and therefore, in accordance with Equation (2), the driving force for the grain boundary migration is reduced proportionally to the reduction of the grain boundary area owing to its coverage with bubbles:
The above presented consideration of the bubble equilibrium with the two grains can be justified only in the case when the rate determining process of bubble mobility is infinitely fast in comparison with the grain boundary migration. In a more general case of a finite bubble mobility, a complete equilibrium between the bubble and the two grains is not attained, hence Equations (41) and (42) are not anymore valid. It is straightforward to show that in order to uphold a coherent migration of the grain boundary and the attached bubble in this case, the values
and
become non-zero and obey the relationship:
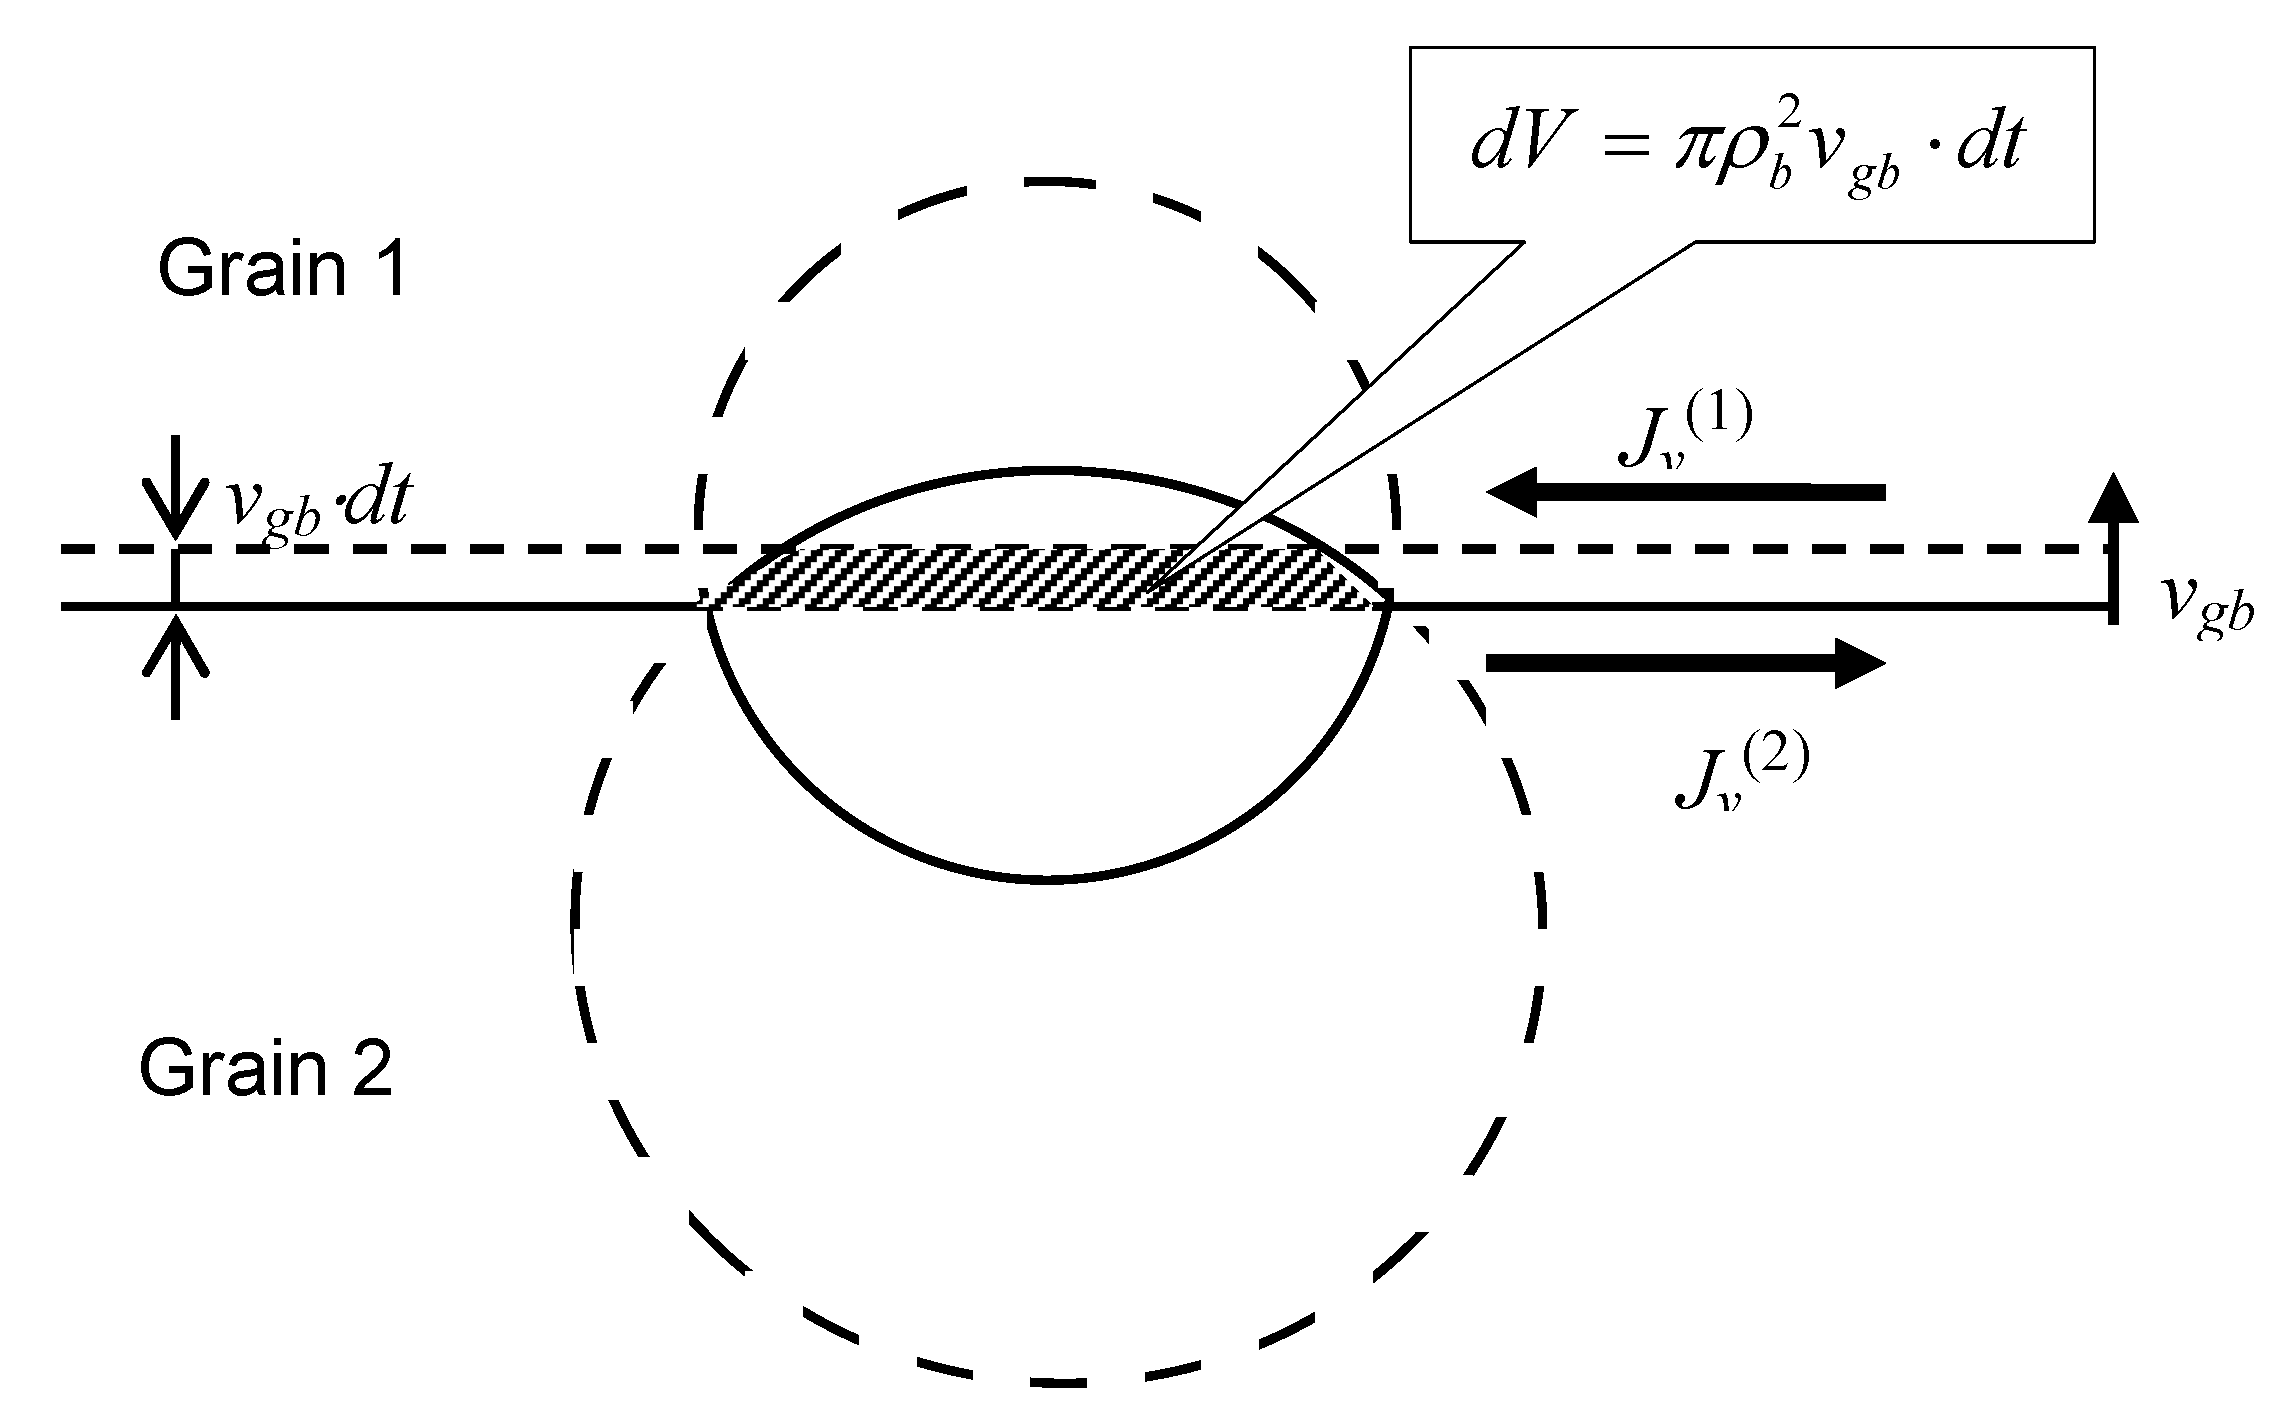
Indeed, during a time interval
the grain boundary moves over a distance
. If the bubble is “frozen” at its position, the volume of the upper part of the bubble will be decreased by a value
, whereas the volume of the lower part will be increased by the same value
, see
Figure 3.
Figure 3.
Determination of vacancy fluxes along the grain boundary in two adjacent grains providing relocation of a lenticular bubble coherently with the grain boundary.
Figure 3.
Determination of vacancy fluxes along the grain boundary in two adjacent grains providing relocation of a lenticular bubble coherently with the grain boundary.
In order to sustain the bubble migration with the grain boundary velocity
, vacancy fluxes along the upper and lower surfaces of the grain boundary,
and
, should compensate these volume variations:
where
is the vacancy volume. It is assumed that each of the vacancy fluxes (
or
) occurs in a thin surface layer with a thickness
w ≈ 0.5 nm of the corresponding grain (grain 1 or grain 2), characterised by a relatively high self-diffusion coefficient
.
These fluxes will be farther calculated in the following
Section 3.2, nevertheless, from the physical point of view (confirmed by calculations presented below) it is clear that the values of
and
are determined by the pressure differences
and
, respectively, which should obey condition
, Equation (48), in order to sustain relationship
, Equation (49).
Equations (43)–(45) are still valid for the considered case of a non-equilibrium bubble with the steady-state lenticular shape, and along with Equation (48) determine the retarding force:
Substitution Equation (50) in Equation (9) results in:
Superposition of Equations (51) and Equation (49) with explicitly calculated fluxes and as a function of ε will finally determine the migration of the grain boundary with attached bubbles.
The same result, Equation (51), derived in the present Subsection in phenomenological approach (
i.e., by consideration of mechanical forces, acting on the boundary and bubbles), can be obtained in a more accurate microscopic approach based on self-consistent calculation of vacancy fluxes across and along the grain boundary, which will be presented in the following
Subsection 3.2.
3.2. Microscopic Consideration
In accordance with Cole, Feltham and Gillam [
28], migration of a grain boundary of a growing grain takes place in steps of one interatomic spacing
a as atoms transfer from the neighbouring grain across the boundary under the pressure difference Δ
G across the boundary:
where
υ is the atomic oscillation frequency on the grain boundary,
Q is the activation energy for self-diffusion in the grain boundary, Ω is the atomic volume. The grain boundary mobility
, can be also evaluated following Burke and Turnbull [
9] as:
where 2
w ≈ 1 nm is the thickness of the grain boundary,
is the self-diffusion coefficient in the grain boundary.
The above described process of atomic jumps can be equivalently considered as translations of vacancies from the growing grain to the adjacent one with the same rate as translations of atoms in the opposite direction. The corresponding flux of vacancies
in the normal to the grain boundary direction is uniform over the grain boundary surface (with the total area
S) and thus determines the grain boundary relocation during the time interval
, in accordance with the following relationship:
. Therefore, the grain boundary migration velocity
can be represented in the form
, and thus:
In the presence of attached bubbles with the surface coverage
and mean projected radius
, the vacancy flux takes place across the reduced surface of the grain boundary
. In the limiting case (corresponding to an infinite bubble mobility, or
ε → 0), when the lenticular bubble attains equilibrium with both grains separated by the boundary, the vacancy flux is still uniform over the reduced grain boundary surface, and thus, Equation (54) can be used in the balance equation:
Therefore, in this case the grain boundary velocity is calculated as:
in agreement with Equation (47).
In a more general case of a limited bubble mobility when a complete equilibrium between the bubble and the grains is not attained and ε > 0, a spatial variation of the vacancy chemical potential over the grain boundary faces takes place. On the one hand, this chemical potential variation induces the vacancy fluxes to (from) the bubble along the upper (lower) surface of the grain boundary, and , introduced in Equation (49). On the other hand, the pressure drop across the boundary becomes also non-uniform over the grain face area. In order to calculate the total vacancy flux across the boundary in this case, one should self-consistently consider the vacancy transport along and across the grain boundary, on the base of calculation of the spatial variation of the vacancy chemical potential.
As shown by Speight and Beere [
27], variation of the surface chemical potential
in a grain reflects exactly the steady state distribution of normal stresses over the grain boundary area unoccupied by bubbles. In the currently considered problem with a moving grain boundary under pressure difference across the boundary, such a conclusion should be generalised and independently applied to each of the two adjacent grains,
. The integral of these stresses over the area (with the mean radius
) associated with one bubble must equal the total load applied to each face of the grain boundary. Hence, following [
27], one obtains:
where the first term on the r.h.s. arises from the normal stresses
at each of two surfaces of the grain boundary in the absence of attached bubbles. In the presently considered case these stresses uphold the pressure gradient Δ
G across the grain boundary,
i.e.,
The second term on the r.h.s. of Equation (57) expresses the force which the bubble surface tension exerts on the boundary. This term can be calculated as the integral of the normal stress on the lenticular bubble surface over the corresponding surface segment of the bubble: .
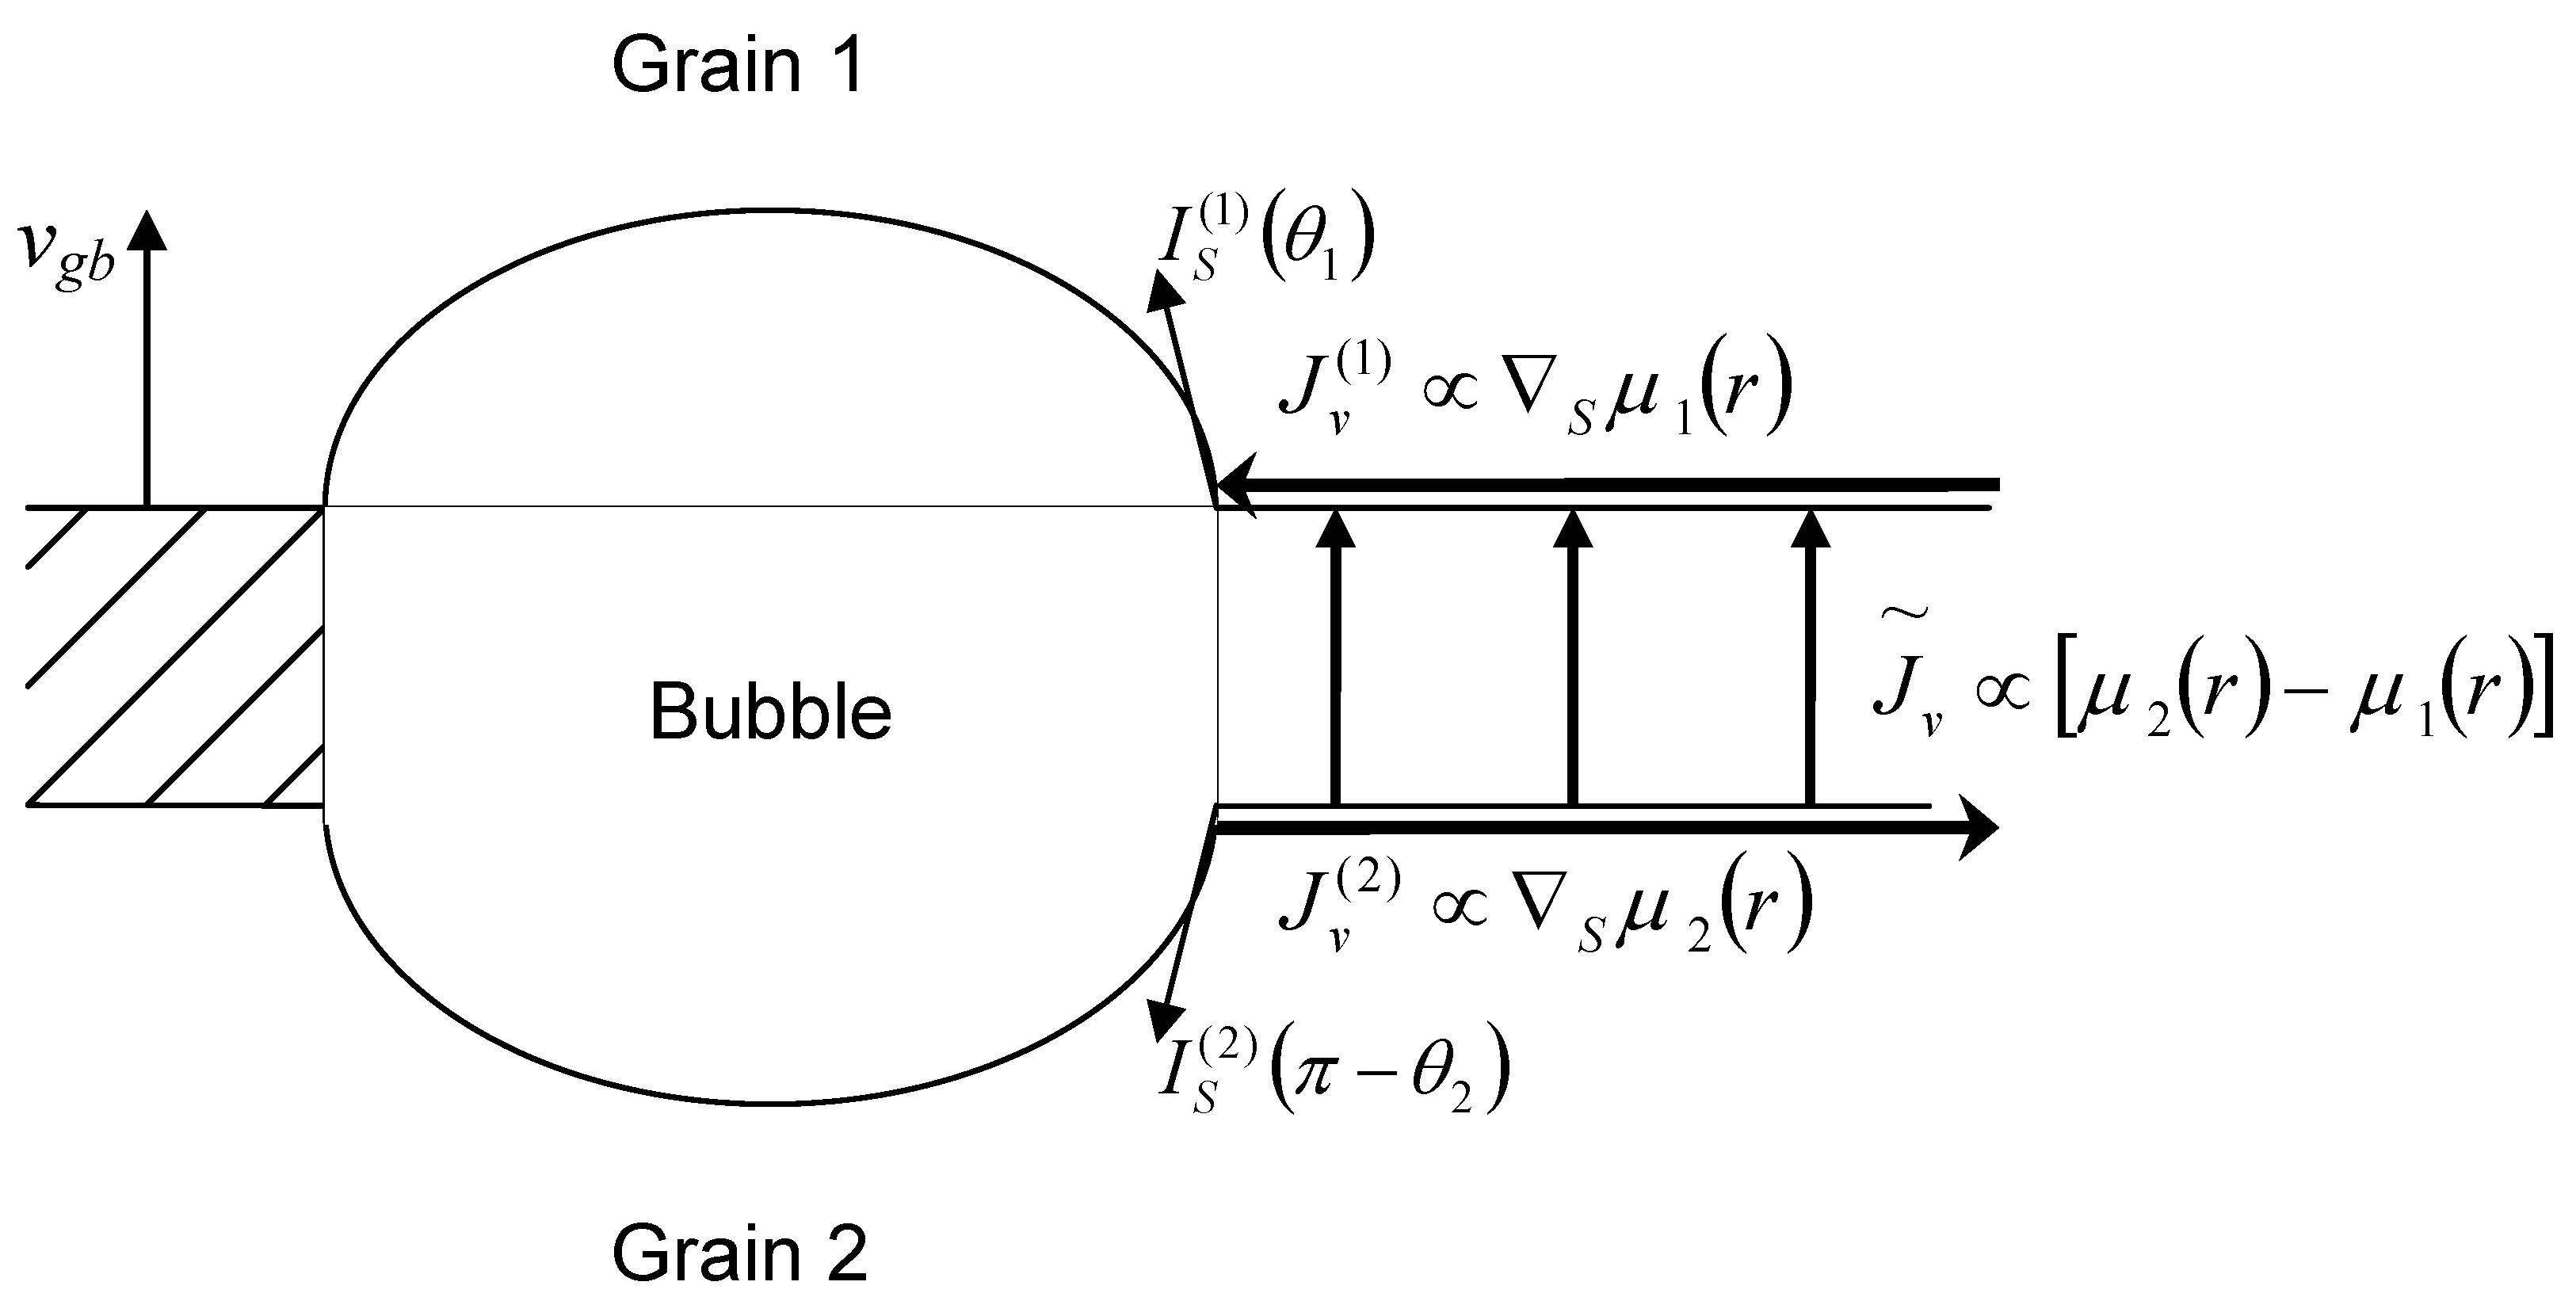
As illustrated in
Figure 4, the chemical potential gradients along the grain face surfaces,
and
, determine the vacancy surface fluxes
and
, introduced in Equation (49), whereas the chemical potential drop across the grain boundary
determines the vacancy flux across the grain boundary:
Integrating this flux over the grain boundary area unoccupied with bubbles and using Equation (57) one can calculate the grain boundary velocity:
The second term on the r.h.s. of Equation (60) is calculated from Equation (48):
Substitution of Equations (58) and (61) in Equation (60) results in:
which exactly coincides with Equation (51).
Figure 4.
Schematic representation of vacancy fluxes along and across the grain boundary.
Figure 4.
Schematic representation of vacancy fluxes along and across the grain boundary.
An additional relationship between
and
can be obtained from the balance equation, Equation (49), if the surface vacancy fluxes
and
are properly ascertained. These fluxes obey the continuity equations on each face of the grain boundary, which in the system of coordinates moving along with the grain boundary take the form:
or
with the boundary conditions:
It is straightforward to see that integration of Equation (64) over the surface non-occupied with the bubbles, directly results in the first part of Equation (60), if Equation (49) is valid.
Superposition of equations (64) forms the system of Laplace and Helmholtz type equations for
and
with the solution obeying Equation (65), which determines the vacancy fluxes at the bubble surface [
15]:
where
, and
and
represent the first and the second modified Bessel functions of the zeroth and first kind, respectively.
Substitution of Equation (66) in Equation (49) results in the additional relationship for the grain boundary velocity:
where
.
In the meaningful limit
,
, one has with a very good accuracy
, until
:
Superposition of Equations (62) and (68) allows exclusion of the parameter
ε and final calculation of the grain boundary velocity:
where the bubble mobility is presented by the expression in brackets of Equation (68):
A further simplification of Equation (70) can be attained using evaluation of the grain boundary mobility
in Equation (53) resulting in
. In this case the bubble mobility can be approximated as:
For gas bubbles in UO
2 the surface diffusion mechanism of bubble migration generally dominates over the two other mechanisms of lattice diffusion and gas phase transport (see, e.g. [
29]). For this reason, in derivation of Equations (70) and (71) it was implicitly assumed that the surface diffusion of uranium atoms along the two segments (upper and lower) of the bubble surface disconnected by the grain boundary, was fast enough to redistribute in the bubble all vacancies absorbed from the upper surface of the grain boundary (flux
) and desorbed to the lower one (flux
), in order to sustain its steady-state lenticular shape in the course of grain boundary migration. This assumption can be explicitly grounded if one compares two expressions for the bubble mobility by the new mechanism, Equation (71), and by the bubble surface diffusion mechanism. For the lenticular grain face bubble the mobility by the surface diffusion mechanism was derived in [
15]:
where
θ0 ≈
θ1 ≈
θ2 ≈ 50° for UO
2.
Therefore, comparing Equations (71) and (72) one can see that
. From analysis of experimental data for UO
2 (see below
Section 6) one can conclude that
exceeds
by 1–2 orders of magnitude in a wide range of temperatures above 1000 K, increasing with temperature. At higher temperatures
T ≈ 2000 K, when the grain growth becomes noticeable, the ratio
attains 3 orders of magnitude. Therefore, for the practical interval of bubble sizes
,
i.e., from ≈ 1 nm up to ≈ 1 μm, the ratio
is still small.
5. Combined Retarding Effect of Pores and Bubbles on Grain Growth in Irradiated Fuel
As shown in
Section 2, consideration of fuel densification (
i.e., porosity reduction) owing to thermal evaporation of vacancies from pores allows explanation of complicated grain growth kinetics characterised by non-integer growth exponents observed in the tests [
20] on thermal annealing of porous UO
2 fuel. However, under irradiation conditions pores additionally shrink owing to vacancy knockout mechanism [
32,
33] based on the assumption that fission fragments passing through a pore can, via atomic collisions, effectively knock vacancies from the pore, therefore, both pore shrinkage mechanisms should be considered simultaneously.
On the other hand, intergranular gas bubbles grow up under irradiation conditions owing to sinking of fission gas to the grain boundaries leading to significant fuel swelling. Therefore, the retarding effect on the moving grain boundaries from both types of intergranular porosity, i.e., pores and gas-filled bubbles, should be simultaneously considered in the general case of porous fuel under irradiation conditions.
The additional mechanism of the irradiation-induced vacancy knockout from pores [
32,
33] results in the following rate equation (instead of Equation (33)):
where the new term in the r.h.s. corresponds to the vacancy knockout by fission fragments:
F is a fission rate, η = 100 is the number of vacancies knocked out of a pore per collision with the fission fragment and λ = 10–6 m is the length of the fission fragment path.
In Hillert’s mean field approximation for grains coalescence, Equation (17), the mean grain boundary velocity supplemented with the additional type of inclusions (pores) takes the form:
where, for the UO
2 typical case of relatively large pores with
Rp ≥ 1 μm the surface diffusion mechanism controls the pore migration kinetics:
Finally, taking into consideration the additional term associated with the pores, Equation (100) takes the form:
which in combination with Equation (103) determines the grain growth kinetics controlled by pore and bubble migration in irradiated fuel.
7. Conclusions
New mechanisms of the grain growth in irradiated and non-irradiated porous ceramic materials proposed and developed in the recent papers of the author, are reviewed in the current paper. As the first step of the new model development, Nichols’ approach [
14] to consideration of the drag force exerted by attached bubbles and pores on migrating grain boundaries is combined with supplementary consideration of grains coalescence within Hillert’s mean field approach [
11]. It is shown that the boundary migration rate becomes controlled by the movement of the second-phase particles with significantly smaller sizes than predicted in the simplified approach [
14]. An additional consideration of various types of grain boundary pores and bubbles (
i.e., grain face, edge and corner) which exert different drag forces owing to their different shapes and sizes, was performed.
However, Nichols’ analysis [
14] is based on consideration of retarding effect of bubbles on moving boundary using the standard (lattice diffusion, gas phase transport or surface diffusion) mechanisms of bubble mobility derived for intragranular bubbles. This approach was re-considered in the present paper taking into account a more complicated, lenticular shape of the grain face bubbles. Furthermore, migration mechanism of the grain face bubbles might be essentially different from the intragranular bubbles, owing to their specific location on and interaction with a grain boundary. The new mechanism of the lenticular grain face bubble migration is associated with vacancy fluxes over the grain boundary surfaces to the bubble, which afford coherent relocation of the grain boundary-bubble complex. The calculated mobility of the grain face bubble is characterised by a slower dependence on its projected radius,
, in comparison with the surface diffusion mechanism,
, which sustains its steady-state lenticular shape in the course of bubble migration. In particular, for UO
2 the new mechanism becomes the rate controlling step for bubbles migration in a wide range of their radii from ~ 1 nm to ~ 1 μm, and correspondingly, determines the drag force exerted by bubbles on the grain boundary.
The new mechanism of the grain boundary bubbles migration which controls the bubble mobility and determines the drag force exerted on the grain boundary, is further developed in application to the peripheral (edge and corner) intergranular bubbles. As a result, the growth kinetics of grains with different types of intergranular bubbles is calculated. It is shown that contribution of the peripheral bubbles to the retarding effect can be significant, especially under irradiation conditions with high fission rates in UO2 fuel.
The new model for the grain growth was also applied to consideration of as-fabricated porous fuel on the base of self-consistent simulation of grain growth and fuel densification, which occurs under annealing conditions owing to thermal evaporation of vacancies from pores. Under irradiation conditions the pore shrinkage is significantly increased owing to vacancy knockout from pores by fission particles, on the one hand, and intergranular bubbles growth takes place owing to sinking of fission gas atoms from grains, on the other hand. Simultaneous consideration of the intergranular bubbles and pores evolution allows further improvement of the model predictions for the grain growth under irradiation conditions.
The new model was implemented in the integral code MFPR and validated against various test under annealing [
8,
20] and irradiation [
36] conditions with various types (dense and porous) fuel pellets, with and without pre-irradiation. The new code predictions for these tests are essentially improved and are in a satisfactory agreement with observations.


