Diffuse Reflectance Infrared Fourier Transform Spectroscopy for the Determination of Asbestos Species in Bulk Building Materials

 ,
, 
Abstract
: Diffuse reflectance infrared Fourier transform (DRIFT) spectroscopy is a well-known technique for thin film characterization. Since all asbestos species exhibit intense adsorptions peaks in the 4000–400 cm−1 region of the infrared spectrum, a quantitative analysis of asbestos in bulk samples by DRIFT is possible. In this work, different quantitative analytical procedures have been used to quantify chrysotile content in bulk materials produced by building requalification: partial least squares (PLS) chemometrics, the Linear Calibration Curve Method (LCM) and the Method of Additions (MoA). Each method has its own pros and cons, but all give affordable results for material characterization: the amount of asbestos (around 10%, weight by weight) can be determined with precision and accuracy (errors less than 0.1).1. Introduction
Italy is a country covering a surface area of 301,340 km2, with about 60,626,442 inhabitants and a population density of 201 inhab./km2. It is thus a very densely populated country, with much of its territory urbanized and requiring careful protection of valuable cultural or natural assets.
This country has been one of the biggest producers of raw asbestos, by mining, and asbestos containing material (ACM), especially for building applications. Asbestos is a common name for classifying a family of silicate minerals, which are sub-divided in amphibole and layer-silicate asbestos on the basis of their structures and chemical compositions [1,2]. Only five species of asbestos are regulated by Italian law, due to their established hazard; namely, anthophyllite, grunerite, crocidolite and tremolite varieties belong to the amphibole group, while chrysotile belongs to the serpentine group. Even if crocidolite is by far the most hazardous kind of asbestos, chrysotile accounts for over 90% of the world’s consumption of this material, so we focused our investigation on this world-wide diffused silicate [Mg3Si2O5(OH)4].
Italy was the first European country banning asbestos in 1992: the extraction, import, export, marketing and fabrication of asbestos-based products were forbidden [3,4]. Among the European Community, Italy has one of the most restrictive laws about asbestos.
Legal prescriptions, published over the last 20 years, covered the main items in occupational fields, such as personal and work environment exposure, threshold limits values (sampling, analysis, etc.), technical standards for remediation, mapping, classification of asbestos containing waste (ACW), landfill management, inertization and re-use methods, and so on. Due to its chemical composition, inertized ACW can be used as a filler in building materials [5]; concrete and mortar mixtures are good matrices for waste immobilization [6–10]. Furthermore, a lot of studies dealt with the pathogenic mechanisms by which asbestos act [11].
From the analytical point of view, the Italian Ministerial Decree issued on 6 September 1994, indicates some analytical techniques and methods for qualitative and quantitative ACM characterization: X-ray diffraction (XRD), Fourier transform infrared spectroscopy (FTIR) and scanning electron microscopy (SEM), but gives a specific description of the analytical procedures only in case of XRD and SEM. XRD can detect the content of asbestos with a detection limit of 10% weight by weight (w/w); SEM is able to reveal asbestos traces (less than 0.1% w/w). The FTIR method is still not officially defined. It is well known that different types of asbestos can be identified and quantified by means of FTIR spectroscopy: strong and specific sharp peaks can be found in the absorption spectra in the 4000–400 cm−1 wavenumber region [12,13]. Several studies have demonstrated that FTIR is suitable for the quantification of micrograms of different kinds of asbestos in host matrices, and the FTIR limit of detection could be even less than 1% w/w in the case of bulk samples [14,15]. For these reasons, although samples require careful pre-treatment before analysis, FTIR could be an alternative approach with respect to other used techniques [16–19]. In our recent paper, we have compared different analytical FTIR procedures for a low content of asbestos in bulky materials [20], also focusing our attention on sample preparation: classic FTIR measurements are done on powders dispersed in potassium bromide (KBr), which is transparent to infrared radiation. The way powders are obtained by massive ACM is simple milling (both by hands or automatic), but it is not a trivial process: the powder size should be less than one micron on average, and the milling step should not damage the fiber structure; otherwise, the result is false [21]. Some FTIR related techniques, like diffuse reflectance infrared Fourier transformed (DRIFT) spectroscopy, can be applied to non-transparent media and could avoid sample milling, thus being very attractive for rapid and in situ asbestos analysis; on the other hand, since DRIFT is a surface-limited analytical technique, the detection limit is larger than the FTIR classical one. In this paper, we compared different quantitative procedures applied to the DRIFT spectra of ACM and demonstrated that this technique is well suited for quantifying asbestos content in bulk material with high precision and accuracy, at least in ACM coming from building remediation, containing between 10% and 20% w/w of asbestos.
2. Theory
DRIFT is a surface localized FTIR spectroscopy, since it can provide both chemical and structural information for all types of solid surfaces. When infrared radiation reaches a sample surface, one or several processes can occur: light can be adsorbed, reflected from the surface, or it can penetrate the sample before being scattered. If scattering centers, which are fibers in the case of ACM, are randomly oriented, the phenomenon is isotropic and generates a diffuse reflectance [22]. The scattered light is then collected and relayed to the IR detector, where the absorption by chemical groups is revealed. DRIFT spectrometry has many advantages with respect to the conventional transmission (or reflection) FTIR method: DRIFT is a fast and non-destructive technique, since the sample can be directly analyzed, both as it is or in its powdered form; moreover, DRIFT is better suited to the analysis of strongly absorbing materials, whose main characteristic are very low signal and sloping baselines when analyzed in transmission. Since the optical phenomena that generate DRIFT signals are different from those involved in transmittance spectrometry, the spectra obtained by these methods cannot be considered equivalent. It is therefore mandatory to verify that DRIFT, which is a powerful experimental technique, can be usefully used as an analytical quantitative method in measuring the amount of asbestos contained in bulk materials.
All type of asbestos minerals exhibit strong absorption in the 1200–900 cm−1 band, due to Si–O stretching vibration and in 600–900 cm−1, due to vibration of the silicate chain, to metal-oxygen stretching and Si–O bending vibration [23,24]. O–H stretching vibrations give distinct peaks in the region 3600–3700 cm−1 [25]. In addition, O–H bending frequencies lie in the 950–600 cm−1 region [26]. The linear absorbance (in the following, always referred to as the peak height), or the area, of strong absorption peaks, called, for this reason, “analytical” peaks, can be used to quantify the weight of asbestos, expressed in micrograms or in concentration weight by weight (w/w). The analytical peaks for different types of asbestos are reported in Table 1 [27–29]. Chrysotile shows double O–H peaks stronger at about 3685 cm−1 and weaker at 3655 cm−1 [26]. A broad O–H bending band is present at 605 cm−1, Si–O stretching vibration at 1069, 1033 and 959 cm−1, and evident bands at about 606, 434 and 300 cm−1 can be assigned to Mg–OH bending frequency [20,25].
In this work, we have applied and compared three different analytical procedures (the Method of Addition, partial least squares and the Linear Calibration Curve Method) for the quantitative determination of a few micrograms of asbestos in bulk materials.
2.1. Method of Additions
Quantitative analyses using calibration curves are based upon measuring a property of a sample that changes with the analyte concentration [20]: in the present case, the calibration curves are obtained by plotting the height of the absorption peak, hM, as a function of the concentration, Cx; i.e., hM = A + B Cx. The Method of Addition (MoA) is a classic internal standard method developed for the quantitative determination of an analyte in a complex matrix and, therefore, is less dependent on the matrix composition and complexity [15]. The calibration curve is calculated by evaluating hM for a series of mixtures obtained by multiple additions of known quantities of standard asbestos to the original matrix. The standard asbestos was provided by the USA National Institute for Standards and Technology (SRM 1866b, nominal concentration by weight greater than 90%, CAS Number: 12001-29-5). The unknown weight concentration of asbestos in the sample is given by the intersection between the calibration line and the x-axis, i.e.:
The relative error is, in this case:
where δA and B are relative errors on A and B, respectively.
Once the calibration curve has been calculated, the concentration of an unknown sample of analyte is evaluated by measuring the response of the unknown asbestos sample under the same conditions as used for the standard. From the mathematical point of view, MoA is a regression line formula, and for this reason, its intrinsic precision could be limited with respect to other analytical procedures [30].
2.2. Partial Least Square
The Partial Least Squares (PLS) Method is currently used to solve both descriptive and predictive problems in experimental life sciences, especially in chemistry [31–33]. In a few words, PLS connects two generic data matrices, X and Y, by a linear multivariate model, allowing the analysis of data with many, noisy, collinear, and, even, incomplete variables in both X and Y. PLS precision of model parameters estimation improves by increasing the number of relevant variables and observations [34–38]. This statistical approach can be used to predict the properties of interest, based on the measurement of chemical system observables, such as an infrared spectrum, but it also holds for Raman or nuclear magnetic resonance spectra. A detailed description of how PLS works is out of the scope of this work, so we can only underline that the goal of PLS regression is to predict values of Y (namely, concentrations of asbestos in different samples) from known values of X (namely, the analytical peak heights of samples and reference standards), but there are, in the literature, a lot of PLS applications for chemometrics, i.e., the quantification of chemical quantities through statistical methods [30,35–44].
2.3. Linear Calibration Curve Method
LCM is commonly used in quantitative chemistry, and it has been adopted successfully for the determination of asbestos in bulk materials by means of XRD [20]. This analytical procedure can be also used in DRIFT quantitative spectrometry; also in this case, the curves are obtained by plotting the height of the absorption peak, hM, as a function of the concentration, Cx (w/w), of the analyte, but sample mixtures contain known quantities of a given standard of asbestos together with one or two materials that mimic a matrix (in our case, a commercial concrete; see also the Experimental section) [16,45]. Since the standard is not added, but it is used as a sample itself, LCM is an external standard method, and it can work well only if the standard is really the same material as that contained in the ACM.
The calibration curve can always be approximated to a straight line, at least for very small ranges of concentration, the equation of which is, again: hM = B Cx + A. It is therefore possible to find the best line that interpolates the experimental points and that determines the line parameters, A and B, and also the relative errors, δA and δB. The unknown concentration of asbestos in the analyzed sample is determined by using the following formula:
Relative and absolute errors on this quantity, εr and εa, respectively, are calculated by the usual formulas of error propagation:
where the error on hM, δhM, is the statistical indetermination of several independent measurements on the same sample. Even if LCM is largely adopted in spectroscopy, quantitative results from the LCM procedure can be strongly affected by the interference of the matrix in which the asbestos is embedded. As happens with most spectrometric techniques, some peaks of the analyte can be partially or fully masked by other substances’ peaks, preventing correct quantitative measurements [46].
3. Results and Discussion
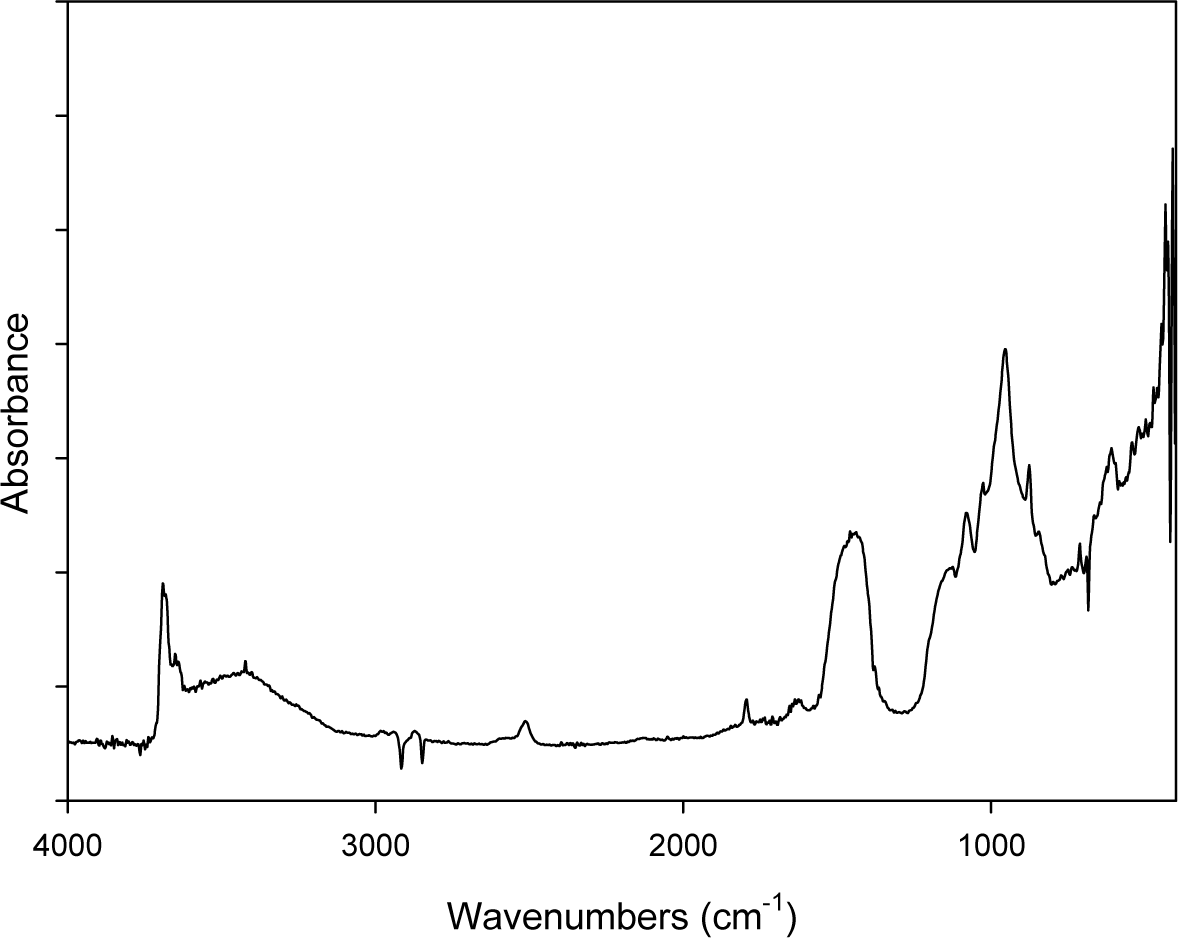
Figure 1 shows the DRIFT spectrum of ACM powders: the characteristic doublet absorption peaks at 3688 cm−1 and 3645 cm−1 of chrysotile are evidenced well. Other peaks are ascribed to the C–O (2924–2854 cm−1; 2400–2200 cm−1 and 1720 cm−1), Si–O–Si (1090–1000 cm−1) and S–O (1200–650 cm−1) chemical groups present in the compound that constitutes the cement matrix in which the asbestos is embedded (see also the ACM description in the Experimental section).
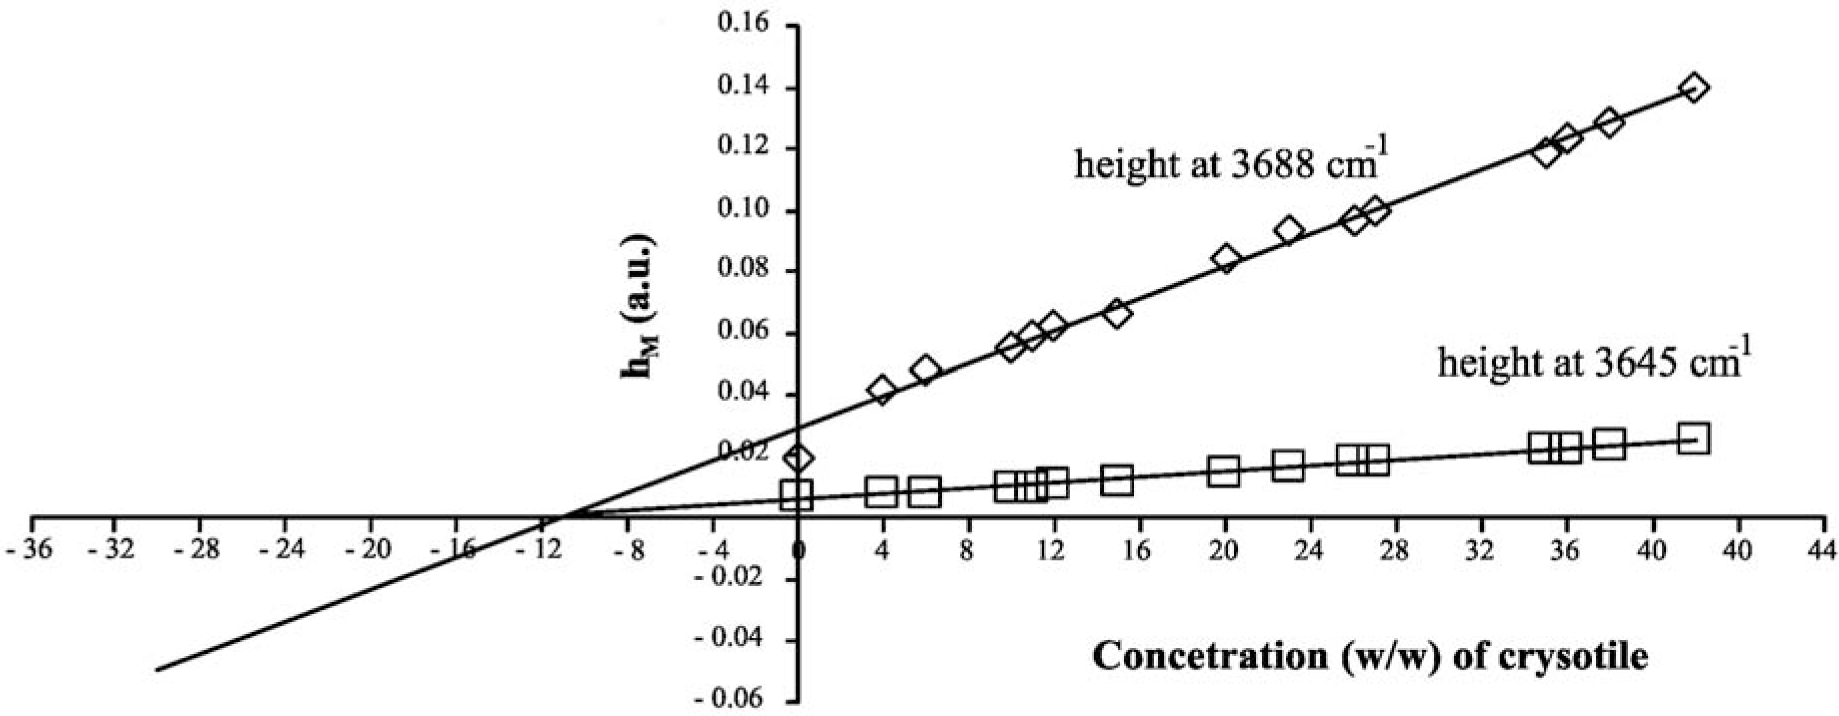
The MoA linear curves are shown in Figure 2; the relevant parameters are reported in Table 2. The x-intercept of the MoA plot corresponds to the unknown amount of analyte that should be present in the sample. Since chrysotile shows two characteristic absorption peaks that can be used as analytical references, two MoA curves can be elaborated, one for each peak: of course, both the results should be the same if there are no systematic errors in the quantitative procedure. By elaborating data referring to the 3688 cm−1 peak, an asbestos concentration of 11.23% ± 0.06% is estimated; in the case of a peak at 3645 cm−1, the concentration is calculated as 11.20% ± 0.05%. This result demonstrates that the DRIFT technique could be simple, fast and also very accurate and precise.
In Table 3, the composition of the mixtures used for the calibration and validation steps required by the PLS-based chemometric procedure is reported (see the Experimental section for a brief explanation of how the TQ Analyst software works).
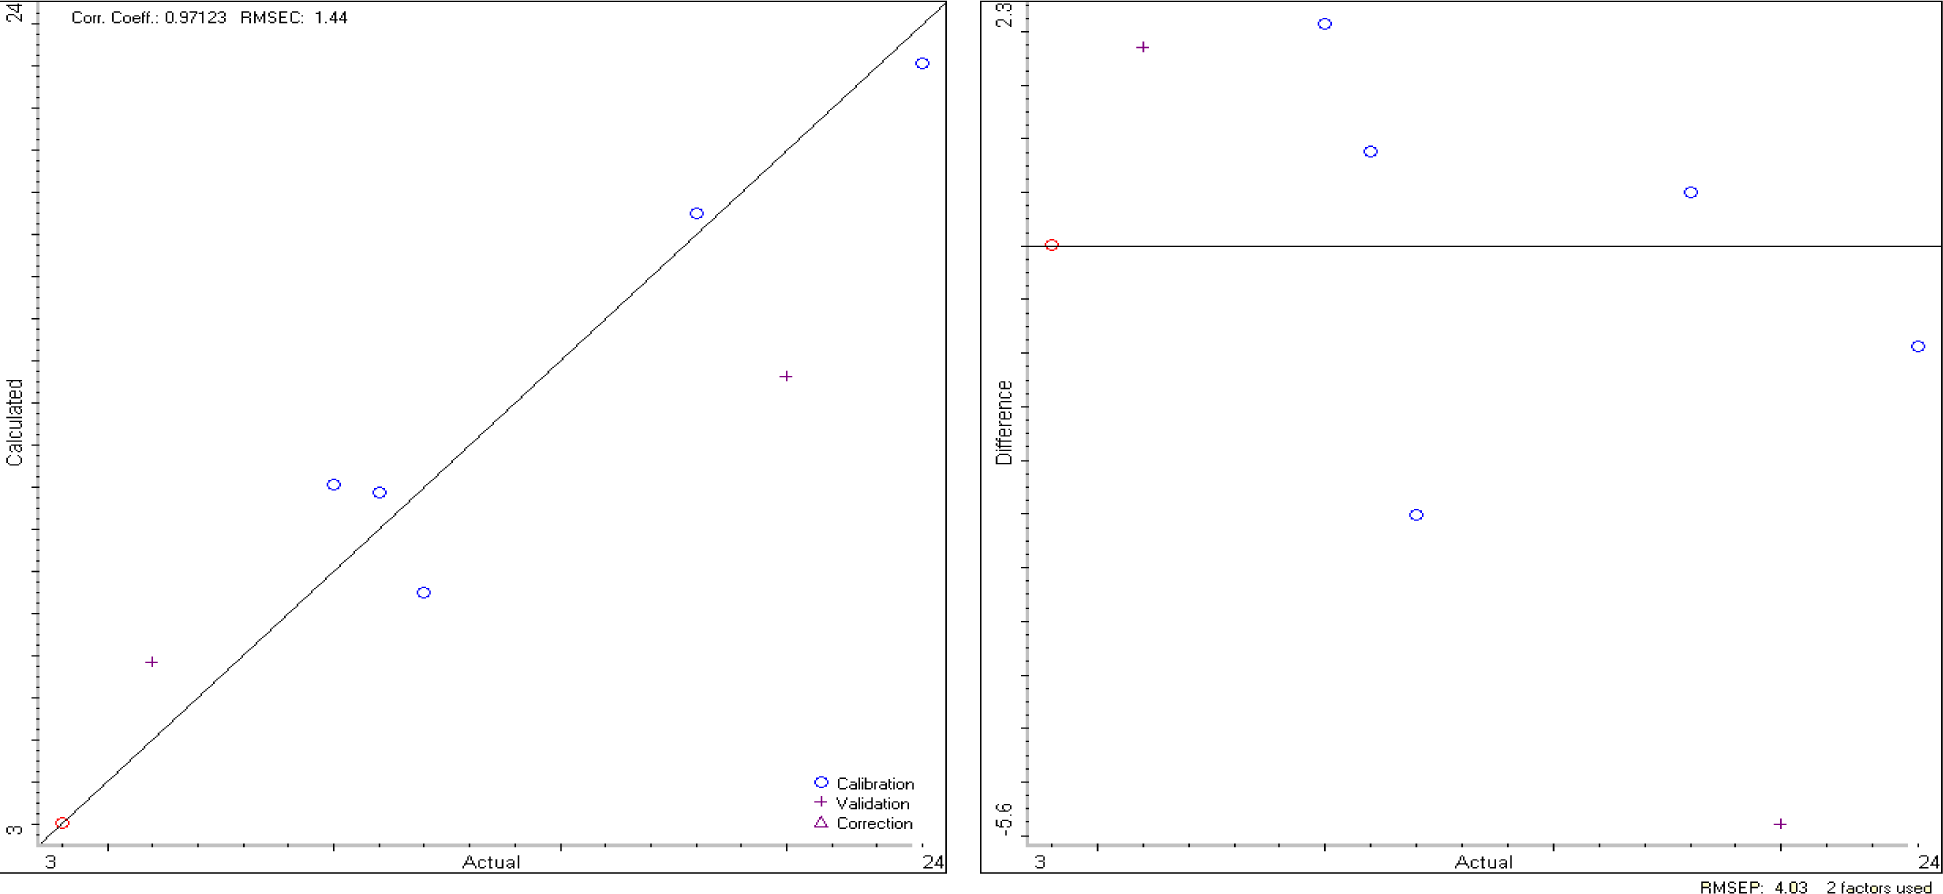
The TQ Analyst software elaborates data from the DRIFT spectra and, as a result, produces a calibration curve and a validation curve, as reported in Figure 3.
If we apply the calibration model to the unknown sample, previously analyzed by MoA, we obtain the results reported in Table 4, which are very close to that of MoA, even if the errors are slightly larger.
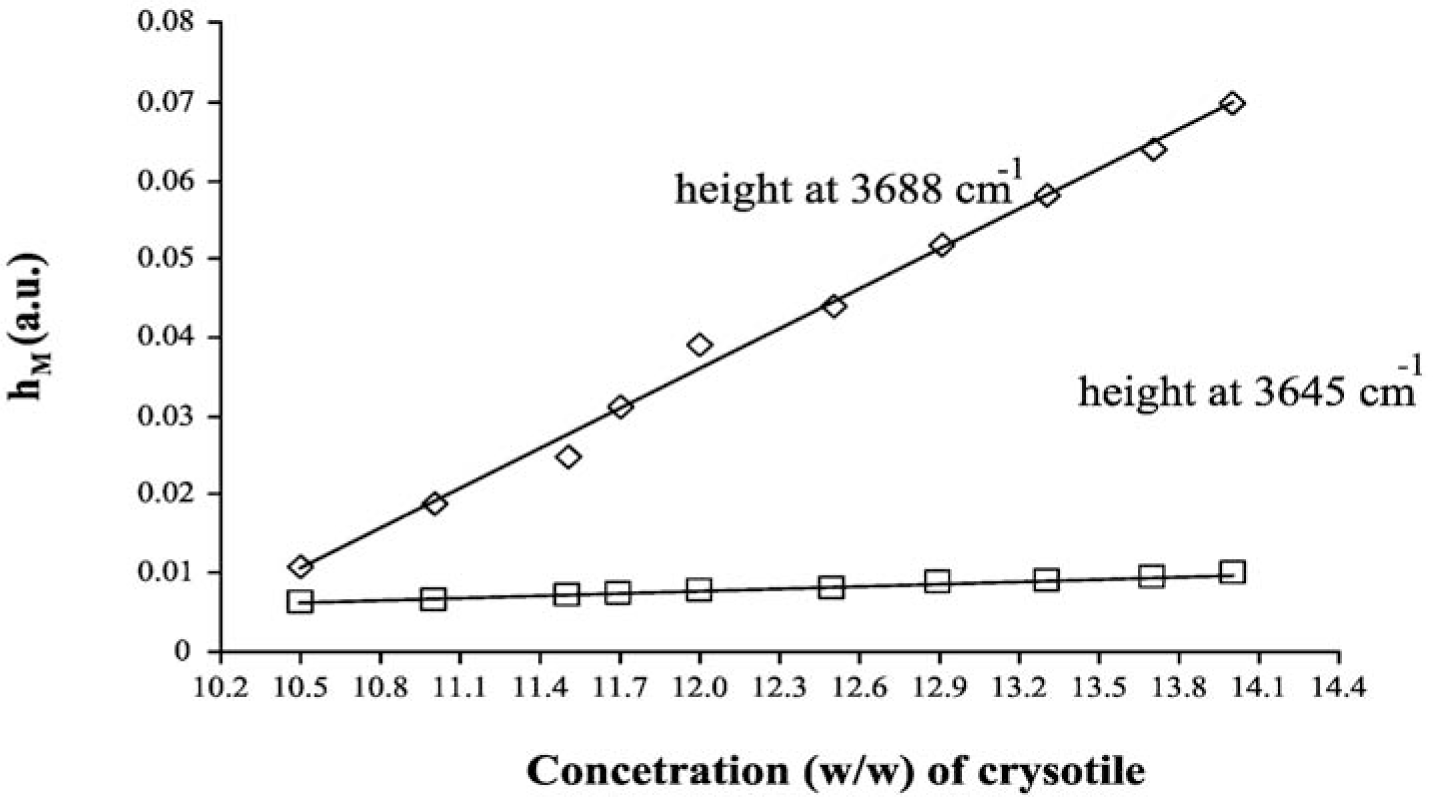
The LCM curves, calculated for both analytical peaks of chrysotile, are shown in Figure 4, while the curve parameters (slope, intercept and their errors) are summarized in Table 5. One basic assumption for the analytical method proposed is that the relationship between hM and Cx should be linear. From the plot reported in Figure 4, it was experimentally verified that in the concentration range explored, the dependence of hM on Cx is actually linear: the linear regression coefficient of both curves reported in Figure 4 is greater than 0.99. The linearity assumption is not true in general, and the relationship should be verified case by case. It is better to prepare the calibration curves in those intervals of concentration where the linearity is experimentally measured.
As in the case of MoA, we can quantify the asbestos content in the ACM sample by using the curve parameters of both peaks at 3688 cm−1 and 3645 cm−1, by using the formulas reported in the Theory section, we obtained 11.13% ± 0.02% and 11.30% ± 0.07%, respectively. These numbers show that also, in the case of LCM, the DRIFT spectroscopy is precise and accurate.
As the first conclusion, we can state that from the quantification point of view, the three analytical procedures are equivalent, since in all the experiments that were realized, it was found that the chrysotile content was the same within the experimental errors. For all three methods, the sample preparation and data acquisition procedure are important in order to maximize accuracy and precision. While MoA and LCM require peak height calculation, which means the individuation of peaks and baseline correction, PLS is completely automated, i.e., the software analyzes the spectrum and makes all the calculations. Nevertheless, we should emphasize that the chemometric method is simple, fast and equivalent to MoA and LCM in terms of the results, only when the correlation matrix has a few components; but in the case of many components, the chemometric method implies too much complex calculations, requiring a long time.
The need of a critical comparison between different FTIR methodologies, highlighting the pros and cons of each one, arises form a lack of technical prescription in Italian regulation: while X-ray diffraction and optical, as well as electronic, microscopy are well described, FTIR is allowed, but not standardized. We believe that in the near future, there will be a strong need of fast, accurate and precise quantitative methods for monitoring ACM and also asbestos containing wastes or contaminated soils; in Italy there are 10 Superfund, i.e., especially contaminated locations, and more than 34,000 sites mapped and inserted in a specific database, where asbestos is still in place and needs some kind of remediation action.
In this framework, DRIFT spectroscopy represents a rapid-screening method for the quantification and classification of materials. The procedures tested in this work can be successfully applied to different bulk asbestos materials for the qualitative and quantitative determination of all types of asbestos.
4. Experimental Section
Asbestos containing materials (ACM), were supplied by “Ambiente s.r.l.” in the framework of a local research project “Progetto Rifiuti” (INAIL, Regional Direction for Campania) and came from the remediation of industrial building roofs. The ACM was classic cement reinforced by asbestos fibers; this kind of material has been deeply characterized by standard chemical and structural techniques (in our case, X-ray diffraction using a Philips PW3020 X’Pert Diffractometer under the following operating conditions: Bragg–Brentano configuration, Θ–2Θ; tension, 40 kV; current, 40 mA; anode, copper; scanning, step; step size, 0.01°; time per step, 1 s.; data not shown here); and the compositional information agrees with that supplied by the technical sheet of the manufacturer: chrysotile, calcium carbonate, calcium sulfate and alumina. In such materials, the asbestos content was always between 10% and 15%, weight by weight. ACM handling requires special health security procedures: ACMs were received sealed in double polyethylene bags; each bag was opened inside a laminar flow hood to prevent any fiber dispersion into the laboratory, according to the Italian Environment Ministry Decree 6 September 1994, and related acts. Researchers, during laboratory activity, wore protective disposable full-body overalls and the prescribed facial masks. ACM was gently dry-crushed in an agate mortar and then finely ground in a ring mill (FRITSCH, model Pulverisette 9, rotational speed 750/1000 rpm) enclosed in a vial. In all the above operations, the air was monitored by filtration through cellulose filters and fibers counted using phase contrast optical microscopy (PCOM). Fiber concentration, in all analyses, never exceeded the threshold limit (100 fibers/L).
Quantitative Analysis of Asbestos
An FTIR spectrometer Nicolet 6700 (Thermo Nicolet Corp., Madison, WI, USA) equipped with a diffuse reflectance accessory (DRIFT, Thermo Nicolet Corp., Madison, WI, USA) was used to obtain the FTIR spectra of the samples. Spectra were collected in the range 4000–400 cm−1 by 32 scans and at resolution of 4 cm−1. All spectra were analyzed by the software of the OMNIC operating system (Version 7.0 Thermo Nicolet, Thermo Nicolet Corp., Madison, WI, USA) and normalized against an air background. After every measurement, a new reference air background spectrum was taken.
(1) Regression with Method of Additions
Mixtures of ACM and known quantities of standard chrysotile (NIST standard SRM 1866b) were prepared by multiple additions in the range of 4%–42% weight by weight. Samples were mixed and homogenized in an agate mortar for a few minutes. The heights of the chrysotile characteristic peaks at 3688 cm−1 and 3645 cm−1 were registered for each addition, and the data were plotted for linear regression. An unknown asbestos concentration is obtained by the intersection of the best-fit line and the x-axis.
(2) Regression with PLS
The software, TQ Analyst, was used for PLS. This statistical analysis requires two elaboration steps: calibration and validation. In the calibration procedure, the software searches for a relation between the dependent variable, Y (peak height), and the independent variable, X (asbestos concentration), which can be generically written as: Y = f(X1, X2, X3, …, Xp). In practice, an algorithm, based on partial least squares equations, calculates the regression coefficients of the equation: Y = b0 + b1X1 + b2X2 + …. bpXp; which define the mathematical model of the system under investigation. The second step is a so-called “leave-one-out” cross-validation procedure that is used to verify the calibration model: the FTIR spectra of the standard sample, containing a known amount of asbestos, are elaborated by the TQ software and the results used to evaluate the goodness of the mathematical model. If the model produces positive results during the validation, it can be used to obtain the quantification of unknown samples. DRIFT spectra have been smoothed, and the wave number range has been set around the analytical peaks of chrysotile, in order to minimize the number of calculations in partial least squares. Smoothing is also mandatory, since ground noise can confuse the algorithm.
(3) Linear Calibration Curve Method
The Linear Calibration Curve Method (LCM) is commonly used in quantitative chemistry, and it has been adopted successfully for the determination of asbestos in bulk materials by means of XRD [47,48]. This analytical procedure can be also used in FTIR quantitative spectrometry: in this case, the calibration curves are obtained by plotting the height of the absorption peak as a function of asbestos concentration in different mixtures containing known quantities of standard asbestos (NIST SRM 1866b). Different aliquots of standard chrysotile in the range of 10%–14% weight by weight has been mixed with asbestos-free commercial concrete. Samples were mixed and homogenized in an agate mortar for a few minutes. The heights of the chrysotile characteristic peaks at 3688 cm−1 and 3645 cm−1 were registered for each mixture and the data plotted against the chrysotile concentration for linear interpolation. The parameters, and their errors, of the best-fit linear curve can be used for the estimation of unknown samples.
5. Conclusions
In conclusion, the analytical procedures investigated for the quantitative determination of asbestos in bulk materials based on DRIFT spectroscopy are precise and accurate in the explored range of asbestos concentration, even if DRIFT does not allow for a very low (about 1% w/w) limit of detection. The data acquisition methodology and data analysis require attention for guaranteeing the quality of the outputs. DRIFT spectroscopy can be thus considered very appealing as an analytical technique for bulk determination. Considering the big number of asbestos remediation activities still at work and already previewed and programmed by the Italian Superfund Program (M.D. 468/01) and the Asbestos Mapping Act (M.D. 101/03), as well as the Italian National Asbestos Program for the next five years, which has been approved in May 2013, by the Italian Parliament, it is possible to appreciate the importance of FTIR analytical methodologies and their potentiality.
Acknowledgments
The authors thank INAIL, Regional Direction for Campania, for the economic and technical supports received.
Conflicts of Interest
The authors declare no conflict of interest.
References
- Yao, S.; DellaVentura, G.; Petibois, C. Analytical characterization of cell-asbestos fiber interactions in lung pathogenesis. Anal. Bioanaly. Chem 2010, 397, 2079–2089. [Google Scholar]
- Gunter, M.E.; Belluso, E.; Mottana, A. Amphiboles: Environmental and health concerns. Rev. Mineral. Geochem 2007, 67, 453–516. [Google Scholar]
- Paglietti, F.; Malinconico, S.; di Molfetta, V.; Bellagamba, S.; Damiani, F.; Gennari, F.; de Simone, P.; Sallusti, F.; Giangrasso, M. Asbestos risk: From raw material to waste management: The Italian experience. Crit. Rev. Environ. Sci. Technol 2012, 42, 1781–1861. [Google Scholar]
- Paglietti, F.; Malinconico, S.; di Molfetta, V.; Giangrasso, M. Guidelines for asbestos remediation at Italian superfund sites. J. Environ. Sci. Health C Environ. Carcinog. Ecotoxicol. Rev 2012, 30, 253–268. [Google Scholar]
- Colangelo, F.; Cioffi, R.; Lavorgna, M.; Verdolotti, L.; de Stefano, L. Treatment and Recycling of Asbestos-Cement Containing Waste. J. Hazard. Mater 2011, 195, 391–397. [Google Scholar]
- Colangelo, F.; Cioffi, R.; Montagnaro, F.; Santoro, L. Soluble salt removal from MSWI fly ash and its stabilization for safer disposal and recovery as road basement material. Waste Manag 2012, 32, 1179–1185. [Google Scholar]
- Cioffi, R.; Colangelo, F.; Montagnaro, F.; Santoro, L. Manufacture of artificial aggregate using MSWI bottom ash. Waste Manag 2011, 31, 281–288. [Google Scholar]
- Ferreira, L.; de Brito, J.; Saikia, N. Influence of curing conditions on the mechanical performance of concrete containing recycled plastic aggregate. Construct. Build. Mater 2012, 36, 196–204. [Google Scholar]
- Bignozzi, M.C.; Sandrolini, F. Tyre rubber waste recycling in self-compacting concrete. Cem. Concr. Res 2006, 36, 735–739. [Google Scholar]
- Chang, F.C.; Lee, M.Y.; Lo, S.L.; Lin, J.D. Artificial aggregate made from waste stone sludge and waste silt. J. Environ. Manag 2010, 91, 2289–2294. [Google Scholar]
- Holmes, E.P.; Wilson, J.; Schreier, H.; Lavkulich, L.M. Processes affecting surface and chemical properties of chrysotile: Implications for reclamation of asbestos in the natural environment. Can. J. Soil Sci 2012, 92, 229–242. [Google Scholar]
- Luoma, G.A.; Yee, L.K.; Rowland, R. Determination of microgram amounts of asbestos in mixtures by infrared spectrometry. Analy. Chem 1982, 54, 2140–2142. [Google Scholar]
- Marconi, A. Application of infrared spectroscopy in asbestos mineral analysis. Ann. Ist. Sup. Sanità (in Italian) 1983, 19, 629–638. [Google Scholar]
- Maciejewska, A. Application of infrared spectrometry (FT-IR) for mineral identification of asbestos in bulk samples. Medycyna Pracy 2012, 63, 181–189. [Google Scholar]
- Giacobbe, C.; Gualtieri, A.F.; Quartieri, S.; Rinaudo, C.; Allegrina, M.; Andreozzi, G.B. Spectroscopic study of the product of thermal transformation of Chrysotile-Asbestos Containing Materials (ACM). Eur. J. Mineral 2010, 22, 535–546. [Google Scholar]
- Onala, Y.; Yakıncıc, E.; Seçkinb, T.; Içduygub, M.G. Synthesis and characterization of asbestos-silane hybrid materials. Colloids Surf. A Physicochem. Eng. Asp 2005, 255, 27–32. [Google Scholar]
- Forestia, E.; Fornero, E.; Lescia, I.G.; Rinaudo, C.; Zuccheria, T.; Roveri, N. Asbestos health hazard: A spectroscopic study of synthetic geo-inspired Fe-doped Chrysotile. J. Hazard. Mater 2009, 167, 1070–1079. [Google Scholar]
- Perkins, R.L.; Harvey, B.W. Method for the Determination of Asbestos in Bulk Building Materials; EPA-600/R-93/116; Environmental Protection Agency: Washington, DC, USA, 1993. [Google Scholar]
- Yada, K. Study of microstructure of Chrysotile asbestos by high resolution electron microscopy. Acta Crystallogr. A 1971, 27, 659–664. [Google Scholar]
- De Stefano, L.; Cioffi, R.; Colangelo, F. Comparison between two FT-IR spectroscopy analytical procedures for micrograms determination of asbestos species in bulk materials. Am. J. Anal. Chem 2012, 3, 1–5. [Google Scholar]
- De Stefano, L.; Buccolieri, G.; de Luca, F.; Plescia, P. Milling effects upon quantitative determination of chrysotile asbestos by the RIR method. Powder Diffr 2000, 1, 26–29. [Google Scholar]
- Anbalagana, G.; Sivakumarb, G.; Prabakaranc, A.R.; Gunasekaranc, S. Spectroscopic characterization of natural Chrysotile. Vib. Spectrosc 2010, 52, 122–127. [Google Scholar]
- Sontevska, V.; Jovanovski, G.; Makreski, P. Minerals from macedonia. Part XIX. Vibrational spectroscopy as identification tool for some sheet silicate minerals. J. Mol. Struct 2007, 318, 834–836. [Google Scholar]
- Viti, C.; Mellini, M. Contrasting chemical compositions in associated lizardite and chrysotile in veins from Elba, Italy. Eur. J. Miner 1997, 9, 585–596. [Google Scholar]
- Zaharaki, D.; Komnitsas, K.; Perdikatsis, V. Use of analytical techniques for identification of inorganic polymer gel composition. J. Mater. Sci 2010, 45, 2715–2724. [Google Scholar]
- Kraineva, É.P.; Petrov, V.L.; Polupanova, T.I. Relation between mechanical properties and spectrum for Chrysotile asbestos. J. Appl. Spectrosc 1982, 37, 1157–1159. [Google Scholar]
- Lewis, I.R.; Chaffin, N.C.; Gunter, M.E.; Griffiths, P.R. Vibrational spectroscopic studies of asbestos and comparison of suitability for remote analysis. Spectrochim. Acta A 1996, 52, 315–328. [Google Scholar]
- Ristic, M.; Czako-Nagy, I.; Music, S.; Vertes, A. Spectroscopy characterization of chrysotile asbestos from different regions. J. Mol. Struct 2011, 993, 120–126. [Google Scholar]
- Hawthorne, F.C. Amphiboles: Crystal Chemistry, Occurrence, and Health Issues; Mineralogical Society of Amer: Roma, Italy, 2007. [Google Scholar]
- Ventura-Gayete, J.F.; de la Guardia, M.; Garrigues, S. Online sample treatment and FT-IR determination of doxylamine succinate in pharmaceuticals. Talanta 2006, 70, 1100–1106. [Google Scholar]
- Atti 9° Congresso Nazionale (in Italian), Available online: http://www.aidii.it/documenti.php?&page=1 (accessed on 14 January 2014).
- Atti 21° Congresso Nazionale (in Italian), Available online: http://www.aidii.it/documenti.php?&page=2 (accessed on 14 January 2014).
- TQ Analyst Pro Edition Software, Avaliable online: http://www.thermoscientific.com/en/product/tq-analyst-pro-edition-software.html (accessed on 14 January 2014).
- Colombani, C.; Croiseau, P.; Fritz, S.; Guillaume, F.; Legarra, A.; Ducrocq, V.; Robert-Granié, C. A comparison of partial least squares (PLS) and sparse PLS regressions in genomic selection in French dairy cattle. J. Dairy Sci 2012, 95, 2120–2131. [Google Scholar]
- Kim, K.; Lee, J.M.; Lee, I.B. A novel multivariate regression approach based on kernel partial least squares with orthogonal signal correction. Chemom. Intell. Lab. Syst 2005, 79, 22–30. [Google Scholar]
- Geladi, P.; Kowalski, B.R. Partial least squares regression: A tutorial. Anal. Chim. Acta 1986, 185, 1–17. [Google Scholar]
- Wold, S.; Sjostrom, M.; Eriksson, L. La basic tool of chemometrics. Chemom. Intell. Lab. Syst 2001, 58, 109–130. [Google Scholar]
- Wold, S.; Kettaneh-Wold, N.; Skagerberg, B. Nonlinear PLS modeling. Chemom. Intell. Lab. Syst 1989, 7(1), 53–65. [Google Scholar]
- Frank, I.E. A. A non-linear PLS model. Chemom. Intell. Lab. Syst 1990, 8, 109–119. [Google Scholar]
- Wold, S. Nonlinear partial least squares modeling: II. Spline inner relation. Chemom. Intell. Lab. Syst 1992, 14, 71–84. [Google Scholar]
- Kubelka, P.; Munk, F. Ein beitrag zur optik der farbanstriche (in German). Z. Tech. Phys 1931, 12, 593–601. [Google Scholar]
- Qin, S.J.; McAvoy, T.J. Nonlinear PLS modeling using neural networks. Comput. Chem. Eng 1992, 16, 379–391. [Google Scholar]
- Holcomb, T.R.; Morari, M. PLS/Neural networks. Comput. Chem. Eng 1992, 16, 393–411. [Google Scholar]
- Malthouse, E.C.; Tamhane, A.C.; Mah, R.S.H. Nonlinear partial least squares. Comput. Chem. Eng 1997, 21, 875–890. [Google Scholar]
- Horr, T.J.; Ralston, J.; Smart, R. St.C. Methods for quantitative diffuse reflectance FT-IR: Adsorption densities of alcohols on silica powders. Colloids Surf 1992, 64, 67–85. [Google Scholar]
- Harris, D.C. Quantitative Chemical Analysis; W. H. Freeman & Co: San Francisco, CA, USA, 2002. [Google Scholar]
- De Stefano, L.; Buccolieri, G.; de Luca, F. Analytical methods for quantitative asbestos determination by X-ray diffraction. Ann. Chim 1998, 88, 839–847. [Google Scholar]
- De Stefano, L.; Buccolieri, G. Accurate quantitative measurement of asbestos in XRPD analysis. Ann. Chim 2001, 91, 277–283. [Google Scholar]


| Type of asbestos | Analytical band (1) (cm−1) | Analytical band (2) (cm−1) | Analytical band (3) (cm−1) | Analytical band (4) (cm−1) |
|---|---|---|---|---|
| Chrysotile | 3697–3686–3650–3640 | 1078–1020–960 | 654–615–605–550–481–450–440–432 | 400–305 |
| Amosite | 3656–3640–3618 | 1128–1082–996–981 | 775–750–703–638–528–498–481–440 | 385 |
| Crocidolite | 3636–3620–3610 | 1143–1110–939–897 | 778–775–770–725–694–668–636–630–540–504–495–450 | 320 |
| Analytical band (cm−1) | h | B ± δB | A ± δA | R2 |
|---|---|---|---|---|
| 3688 | 0.021 | 0.00260 ± 6 × 10⁻⁵ | 0.0292 + 0.0015 | 0.9928 |
| 3645 | 0.006 | 4.76 × 10⁻⁴ ± 2 × 10⁻⁵ | 0.0056 + 0.0002 | 0.9919 |
| Index | Spectrum title | Usage | % Chrysotile | % ACM |
|---|---|---|---|---|
| 1 | STANDARD1 | CALIBRATION | 4.0 | 96.00 |
| 2 | STANDARD2 | VALIDATION | 6.00 | 94.00 |
| 3 | STANDARD3 | CALIBRATION | 10.00 | 90.00 |
| 4 | STANDARD4 | CALIBRATION | 11.00 | 89.00 |
| 5 | STANDARD5 | CALIBRATION | 12.00 | 88.00 |
| 6 | STANDARD6 | CALIBRATION | 18.00 | 82.00 |
| 7 | STANDARD7 | VALIDATION | 20.00 | 80.00 |
| 8 | STANDARD8 | CALIBRATION | 23.00 | 77.00 |
| 9 | STANDARD9 | CALIBRATION | 26.00 | 74.00 |
| 10 | STANDARD10 | CALIBRATION | 27.00 | 73.00 |
| 11 | STANDARD11 | CALIBRATION | 35.00 | 65.00 |
| 12 | STANDARD12 | CALIBRATION | 36.00 | 64.00 |
| 13 | STANDARD13 | CALIBRATION | 38.00 | 62.00 |
| 14 | STANDARD14 | CALIBRATION | 42.00 | 58.00 |
| Index | Component | Concentration | Unit | Uncertainty |
|---|---|---|---|---|
| 1 | Chrysotile | 11.06 | % | 9.461 |
| 2 | ACM | 88.94 | % | 9.461 |
| Analytical band (cm−1) | h | B ± δB | A ± δA | R2 |
|---|---|---|---|---|
| 3688 | 0.021 | 0.0169 ± 0.0004 | −0.167 ± 0.005 | 0.9945 |
| 3645 | 0.0069 | 0.0010 ± 0.0002 | −0.0438 ± 0.0002 | 0.9962 |
© 2014 by the authors; licensee MDPI, Basel, Switzerland This article is an open access article distributed under the terms and conditions of the Creative Commons Attribution license (http://creativecommons.org/licenses/by/3.0/).
Share and Cite
Accardo, G.; Cioffi, R.; Colangelo, F.; D'Angelo, R.; De Stefano, L.; Paglietti, F. Diffuse Reflectance Infrared Fourier Transform Spectroscopy for the Determination of Asbestos Species in Bulk Building Materials. Materials 2014, 7, 457-470. https://doi.org/10.3390/ma7010457
Accardo G, Cioffi R, Colangelo F, D'Angelo R, De Stefano L, Paglietti F. Diffuse Reflectance Infrared Fourier Transform Spectroscopy for the Determination of Asbestos Species in Bulk Building Materials. Materials. 2014; 7(1):457-470. https://doi.org/10.3390/ma7010457
Chicago/Turabian StyleAccardo, Grazia, Raffaeke Cioffi, Francesco Colangelo, Raffaele D'Angelo, Luca De Stefano, and Fderica Paglietti. 2014. "Diffuse Reflectance Infrared Fourier Transform Spectroscopy for the Determination of Asbestos Species in Bulk Building Materials" Materials 7, no. 1: 457-470. https://doi.org/10.3390/ma7010457