Article

A Geo-Clustering Approach for the Detection of Areas-of-Interest and Their Underlying Semantics †

by
Evaggelos Spyrou
1,2,*,
Michalis Korakakis
3,
Vasileios Charalampidis
2,
Apostolos Psallas
2 and
Phivos Mylonas
3
1
Institute of Informatics and Telecommunications, National Center for Scientific Research—“Demokritos”, 153 41 Athens, Greece
2
Department of Computer Engineering, Technological Educational Institute of Central Greece, 351 00 Lamia, Greece
3
Department of Informatics, Ionian University, 49 100 Corfu, Greece
*
Author to whom correspondence should be addressed.
This paper is an extended version of our paper published in Spyrou, E.; Psallas, A.; Charalampidis, V.; Mylonas, P. Discovering Areas of Interest using a Semantic Geo-Clustering Approach. In Proceedings of the Mining Humanistic Data Workshop (MHDW), located at the International Conference on Artificial Intelligence Applications and Innovations (AIAI), Thessaloniki, Greece, 16–18 September 2016.
Algorithms 2017, 10(1), 35; https://doi.org/10.3390/a10010035
Submission received: 20 December 2016 / Revised: 1 March 2017 / Accepted: 13 March 2017 / Published: 18 March 2017
(This article belongs to the Special Issue Humanistic Data Processing)

Abstract

:
Living in the “era of social networking”, we are experiencing a data revolution, generating an astonishing amount of digital information every single day. Due to this proliferation of data volume, there has been an explosion of new application domains for information mined from social networks. In this paper, we leverage this “socially-generated knowledge” (i.e., user-generated content derived from social networks) towards the detection of areas-of-interest within an urban region. These large and homogeneous areas contain multiple points-of-interest which are of special interest to particular groups of people (e.g., tourists and/or consumers). In order to identify them, we exploit two types of metadata, namely location-based information included within geo-tagged photos that we collect from Flickr, along with plain simple textual information from user-generated tags. We propose an algorithm that divides a predefined geographical area (i.e., the center of Athens, Greece) into “tile”-shaped sub-regions and based on an iterative merging procedure, it aims to detect larger, cohesive areas. We examine the performance of the algorithm both in a qualitative and quantitative manner. Our experiments demonstrate that the proposed geo-clustering algorithm is able to correctly detect regions that contain popular tourist attractions within them with very promising results.

1. Introduction

The emergence of social networks over the last decade has played an important role to the daily activities and habits of the majority of the world’s population, having especially a greater impact to the younger ages [1], being most familiarized with modern technologies. The latter, mainly with the arrival of the so-called “smartphones”, and secondary, with the continuous expansion of the coverage of broadband mobile networks and advances in WWW technologies, have dramatically changed the fundamental norms of social interaction. People are very eager to share their personal data, their generated multimedia content and also information about their “whereabouts”, i.e., the precise or vague location where they are at a given moment [2]. Often this location is a place they visit either to entertain themselves (e.g., a cinema or a park), to eat (e.g., a restaurant), to drink (e.g., a cafe or a bar) or in case of tourists to familiarize themselves with some of the major (or minor) landmarks of an area (e.g., monuments, archaeological sites, etc.). The users’ whereabouts are typically tied with their photos and/or videos, usually for sharing this content within their social circles or even just for personal archiving [3]. This multimedia content is often loosely annotated by a set of descriptive (at least to satisfy its author’s intentions) keywords, which are typically referred to as “tags”. A special tag category, extremely popular during the last few years, consists of the “geo-tags”, i.e., the geographical coordinates used to “tie” a given multimedia content item to a specific geographical location.
Due to the aforementioned observations, research interest has shifted to unprecedented domains, such as those related to the acquisition of information and analysis of the online “footsteps” that correspond to the actual presence of users in certain places, which is often referred to as “digital footprinting” [4,5]. The latter is often processed, in order to extract semi-automatic knowledge about the users’ whereabouts, interests or even to recommend them additional, semantically related information to cover their needs for tourism, entertainment, etc. Within this environment, users are acting as “social sensors”, although this is not their main intention. The uploaded user-generated digital content accompanied by useful metadata information, like tags and/or geo-tags, is considered to be the ideal source of information among others for the discovery of meaningful, popular trends with respect to users’ behavior. More specifically, location-based information mined from such geo-tagged images offers a great opportunity to analyze users’ preferences in their daily lives and complement the knowledge of their social activities through the utilization of associated tags.
One of the research areas that has been benefiting by this huge sensor network formed by hundreds of millions of people is the one of “vernacular” geography [6]. It is common sense that geography is a science that studies the earth and human interaction with it. (http://www.rgs.org/geographytoday/what+is+geography.html) The main aspect of geography is to define a set of boundaries that divide the earth into regions. The latter may be divided into three major categories: formal, functional and vernacular [7]. The first are typically administrative regions, i.e., spanning from municipalities and cities to countries and continents; their boundaries are formally and strictly defined. In some cases formal regions may be defined based on any feature, e.g., deserts or mountains. Functional regions are those that are formed by patterns of interaction among different locations. More specifically functional regions are typically organized around a certain point with which they may interact at any sense, e.g., small towns around a major city are together forming a metropolitan area, or several areas forming a power network. In general, one could simply describe a functional region as a set of regions acting as a cohesive unit.
On the other hand, the vernacular regions (sometimes referred to as “perceptual”) are neither formal nor functional and are often regarded as “naïve” geography [8]. Boundaries are not strict but vague. They rely either on the common sense, perception, feelings and attitudes of their residents (e.g., in urban areas) or of people familiar to the broader area (e.g., in rural areas). Each vernacular region exists due to emotional attachments of people (and especially its residents) to the specific place. A vernacular region is somehow similar to the notion of an “area-of-interest” (AOI). According to Hu et al. [9], an AOI is an “area within an urban environment which attracts people’s attention”. When the application domain is tourism, an AOI is generally considered to contain landmarks, museums, places of worship, art galleries, i.e., places that typically attract a tourist during her/his visit at an unknown city. These places are typically referred to as “places-of-interest” (POIs).
By contrast, the intuition of a local resident to the notion of an AOI may significantly differ. In that case AOIs may include retail stores, restaurants, bars, parks, i.e., POIs where she/he could spend her/his free time. Similarly to vernacular regions, AOIs in general are vague areas, with uncertain boundaries. We may also argue that a given area is considered to consist an AOI, based mainly on subjective criteria, that stem from people’s interests. Thus, these criteria may significantly differ due to age, nationality, culture etc. For these reasons it is quite difficult to create an “accurate” list of AOIs for a given city, while it may probably be impossible to define generally accepted boundaries, since they reflect a “sense of place”, rather than confining to strict administrative boundaries. Urban AOIs are able to reveal useful information that can be exploited by tasks such as city planning, transportation analysis and location-based social recommendations [9] and may also provide input to tasks such as further AOI analysis and understanding.
To the aforementioned goals, we first divide the given urban area into small square regions, which shall be referred to as “tiles”. From each tile we collect all geo-tagged photos from the popular Flickr (http://www.flickr.com) social network. We use the tags that have been manually added by the users within the process of sharing their photos to create a histogram description for each tile. We then propose a novel algorithm so as to merge similar (in terms of their tag-based description) tiles and extract a set of AOIs. From each, we process all contained tags and upon a “term frequency—inverse document frequency” (TF-IDF) approach, we extract what we consider to be the most descriptive ones, we try to propose the name of the AOI and moreover we calculate a set of heuristic-based metrics, so as to assess the quality of the geo-clustering results. We should emphasize herein that the presented work introduces the use of the underlying semantics in the process of geo-clustering, an attribute typically ignored by current state-of-the-art approaches. Thus, the latter are prone to provide insufficient interpretations. Moreover, our work relies only on user-generated metadata and is evaluated both qualitatively and quantitatively. A visual overview of the proposed approach is illustrated in Figure 1.
More specifically, the herein presented approach is based on a large Flickr dataset consisting of approx. 80 K geo-tagged images taken in the center of Athens, Greece. Since the boundaries of the vernacular regions are not strictly defined, we evaluate the produced results using a ground truth generated by local residents that reflects their perception of vernacular regions; in many AOI detection approaches, e.g., in [10], this approach is considered to be the most appropriate in order to define the corresponding boundaries.As we have already mentioned, the perception of AOIs between a tourist and a resident is significantly different. Thus, in the ground truth generation process, though participants were current or former residents, they were asked to identify the corresponding type of AOIs seen from a tourist’s perspective. We should clarify herein that for the sake of evaluation we use a set of touristic POIs from the socially generated database of OpenStreetMap. (https://www.openstreetmap.org/).
The rest of the paper is organized as follows: In the next Section 2 we present relevant research efforts that also exploit user-generated geodata and metadata from Flickr, focusing on those that aim to extract AOIs and representative tags from them. The proposed methodology is thoroughly presented in Section 3. More specifically, we present the proposed geo-clustering algorithm in Section 3.1. Then, in Section 3.2 we present the approach we follow in order to extract meaningful tags from each extracted AOI. In Section 4 we present in detail the dataset that has been used throughout all our experiments. We also include extensive qualitative and quantitative experimental results, along with a few examples so as to facilitate understanding of the geo-clustering process. Finally, discussion, conclusions and plans for future work are drawn within Section 5.

2. Related Work

As it has already been mentioned, the motivation of this work is to ultimately “discover” large and somehow “homogeneous” AOIs, by merging small geographic tiles, based on sets of tags that have been added spontaneously by Flickr users. We feel that this work is rather novel in its field, however there are a few research works wherein the goal is also to discover AOIs. In addition, since the previously mentioned AOIs are mainly constituted by tourist attractions (since we assume that the majority of tags has been harvested by touristic photos), our work is closely related to research activities aiming to provide recommendations of places and/or to detect trends using information directly from geo-tagged photos collected from Flickr. In this section we present state-of-the-art research activities covering the aforementioned areas. More specifically, in Section 2.1 and Section 2.2 we present works focusing on recommendations and AOI extraction, respectively. Moreover, in Section 2.3 we present selected works aiming to extract the semantics of places, by exploiting socially-generated metadata, which are closely related to the proposed approach.

2.1. Recommendations Using Socially-Generated Knowledge from Flickr

The tags that have been added by the users have been considered as valuable information for the extraction of the underlying semantics of a photo. When they are accompanied by geo-tags they may be efficiently used in several location-based recommendation algorithms. The work of Chen and Roy [11] focused on the detection of events using tags, date information and geo-tags. Their goal was to group photos based on the event they depict, in presence of noise, i.e., photos that do not depict any kind of event. To this goal, they extracted and analyzed temporal and locational distribution patterns of tags. In order to suppress noise, they chose to apply a wavelet transform, thus providing a multi-resolution analysis of the aforementioned tag distributions. Since periodic events are characterized by certain patterns in tag distributions, their approach produced significantly better results in this case. Discovering trends for tourist attractions was the goal of Van Canneyt et al. [12], whose recommendation system adopted a probabilistic approach, ranking places of interest according to their popularity and user-related temporal information. More specifically, they clustered geo-tags, in order to discover POIs. They tackled the recommendation problem as a ranking problem, i.e., they ranked POIs based on their popularity and the context in which users select POIs. They also experimented with the hour, day and month of the visits, and also with their combination. Their results indicated a small improvement to baselines techniques, suggesting that the semantics of POIs should be involved in the process. Kisilevich et al. [13] also aimed to identify events and ranked places of interest, without any prior knowledge. They also applied clustering, so as to discover the spatial aspects of POIs and then, for each cluster they used time-series analysis, to discover its temporal dynamics. Their findings indicate four main types of spatio-temporal clusters, namely stationary, reappearing, occasional and regular moving. A tourism recommendation system was also the work of Cao et al. [14]. They also applied a clustering algorithm and extracted a set of representative images and tags for each cluster. They used visual features on images and number of occurrences on tags. Their system responded with suggestions to users’ photo queries and was evaluated on a set of topics. Finally, Serdyukov et al. [15] proposed an algorithm that aimed to predict the location where a person’s photos were taken, thus provide recommendations concerning their geo-tagging, without relying on the use of geospatial metadata, but rather utilizing solely the textual tags that people use to describe a given location. To this goal, their approach estimated a language model, which relied on the analysis of the terms that have been used to describe photos that had been taken at this location.

2.2. AOI Extraction

During the last few years, many research efforts have focused towards the extraction of AOIs. Earlier approaches exploited available geolocation services and user-generated tags, while more recent ones have focused on the socially-generated geo-tagged metadata from popular social networking websites. Amongst the most characteristic approaches of the first category is the one of Twaroch et al. [16], who reviewed efforts towards the extraction of knowledge on vernacular places before the rising of geo-tagging. Current methods included mining the web, using geo-references from business directories, from social websites or from user created information sources. Then, based on those, they proposed a heuristic approach to find the extent of a currently developing area, relying mainly on knowledge deriving from sources from all the aforementioned categories. Grothe and Schaab [17] proposed an automated statistical method for the generation of footprints, i.e., spatial representations of places. Due to the limited amount of geo-tagged photos available, they also relied on user-generated, location-related metadata. They evaluated their approach on both precise (i.e., with well-defined boundaries) and imprecise regions with their results being satisfactory, according to an informal assessment produced by users. Liu et al. [18] exploited check-ins and geo-tagged photos in an effort to unveil people’s preferences in their daily lives, focusing on both travellers and local residents. They first extracted AOIs and then ranked them by using both transitions between places and relations of users to places. They demonstrated that information extracted from check-ins and geo-tagged photos are mutually complementary.
Keßler et al. [19] aimed to define boundaries for vernacular areas. To this goal, given the name of such an area as a query to three services, all geo-tagged resources that have been tagged with this name are returned. Based on their popularity, they create point clouds which are then clustered. They applied their method in a city area, a large-scale landmark and a set of routes towards a specific place. Sharifzadeh et al. [20] worked on the problem of learning thematic maps, i.e., maps that show the spatial distribution of a given feature. They worked using zip code data and applied well-known classification methods. Empirically, they assessed that even for this case where regions are relatively small, a small number of data per cluster is required. Spielman and Thil [21] proposed a spatial demographic approach using Self-Organizing Maps [22] for clustering. Their goal was to describe communities based on certain characteristics of their residents. They showed that these types of communities are not always continuous but may spread within the whole urban area.
On the other hand, Noulas et al. [23] used check-in data from Foursquare, (http://www.foursquare.com) collected from Twitter. (http://www.twitter.com) Their problem was twofold: to provide a means of similarity between two areas of the same city and also between different cities. In order to model activity patterns within a given city, they applied a clustering algorithm, on small square areas (tiles), using Foursquare categories as features. This way they were able to model areas based on the activities of people visiting them. Hollenstein and Purves [24] used data derived from Flickr and performed a study whose goals were to assess the reliability of user-generated tags, to describe city centers with these tags and to extract knowledge from them, so as to describe vernacular areas, in terms of their location. Hu et al. [9] aimed to extract and understand urban AOIs in terms of their spatial, temporal and thematic features. They used geo-tagged data derived from Flickr. In order to identify their boundaries, they used the chi-shape algorithm [25]. They presented an overall framework consisting of data, spatio-temporal and semantic layers. From raw data they first built AOI boundaries and then extract its semantics, aiming to provide an appropriate characterization. They used several heuristics within the process and showed that their approach may be applied in various cities with minor tuning. Similarly, Zhang et al. [26] aimed to characterize urban spaces and model them to neighborhoods. They proposed a novel algorithm which used Foursquare user checkins and semantic information so as to extract neighborhood boundaries and appropriately characterize them based on the venues they contain, the temporal distribution of checkins within them and the categories of visitors (i.e., tourists or local residents). They recommended the extracted neighborhoods to Twitter users. Likewise, Cranshaw et al. [27] also used Foursquare data, cross-checked with Twitter so as to extract their geo-location. They proposed a spectral clustering algorithm aiming to map a city’s neighborhoods and describe their dynamics based on the social flows of people which in the context of this work were referred to as “livehoods”. They identified three dispersion patterns between these livehoods and typical neighborhoods, namely areas in transition, different demographics within the same area and strong borders. Finally, Aadland et al. [28] proposed a fuzzy algorithm that aimed to delineate neighborhoods of urban areas, using volunteered geographic information gathered by collected and annotated POIs from volunteers carrying a GPS device. However, volunteers collected the dataset having in mind the fulfilment of the research goal which is opposed to spontaneously-generated datasets as e.g., in the context of a social network, which of course led to excellent results.

2.3. Extracting Places’ Semantics through Tag Exploitation

The extraction of semantics of places is another research area that has benefited from the aforementioned data revolution within several social networks. Large, raw geo-tagged datasets have been used towards the automatic extraction of the underlying semantics of AOIs. Rattenbury and Naaman [29] used data from Flickr and based on their distributions and by using several methods for the extraction of semantics, namely naïve scan, spatial scan, TagMaps TF-IDF and scale structure. They concluded that the hybrid ones, i.e., combinations of the aforementioned methods based on a weighting scheme, achieve the best results. Deng et al. [30] clustered geo-tagged photos and applied a co–occurrence analysis approach on the tags contained within the resulting geo-clusters, as an effort to conceptualize the places within each. Firan et al. [31] used an ontology and classifiers, in order to detect events. Using those events, they ended up classifying Flickr photos and showed that some event classes are relatively easy to learn. On the contrary others may require some kind of special attention or even some level of disambiguation. Baba et al. [32] focused on time and location concepts related to tags. They analyzed the distributions of annotated capturing times and corresponding locations of photos upon the determination whether a harvested tag refers to time or location. Their approach achieved comparable results to humans. Ahern et al. [33] analyzed tags that had been collected from geo-tagged photos of a specific area, and upon a TF-IDF-based approach, they extracted a set of the most representative ones. Although their approach focused mainly on the visualization and user interaction aspect, a qualitative evaluation indicated that even such a simplistic approach may indeed provide meaningful results. Finally, Chaundry and Mackaness [34] presented an approach for tag assignment to geographic areas, using a TF-IDF scheme and logistic regression, for various levels of detail.

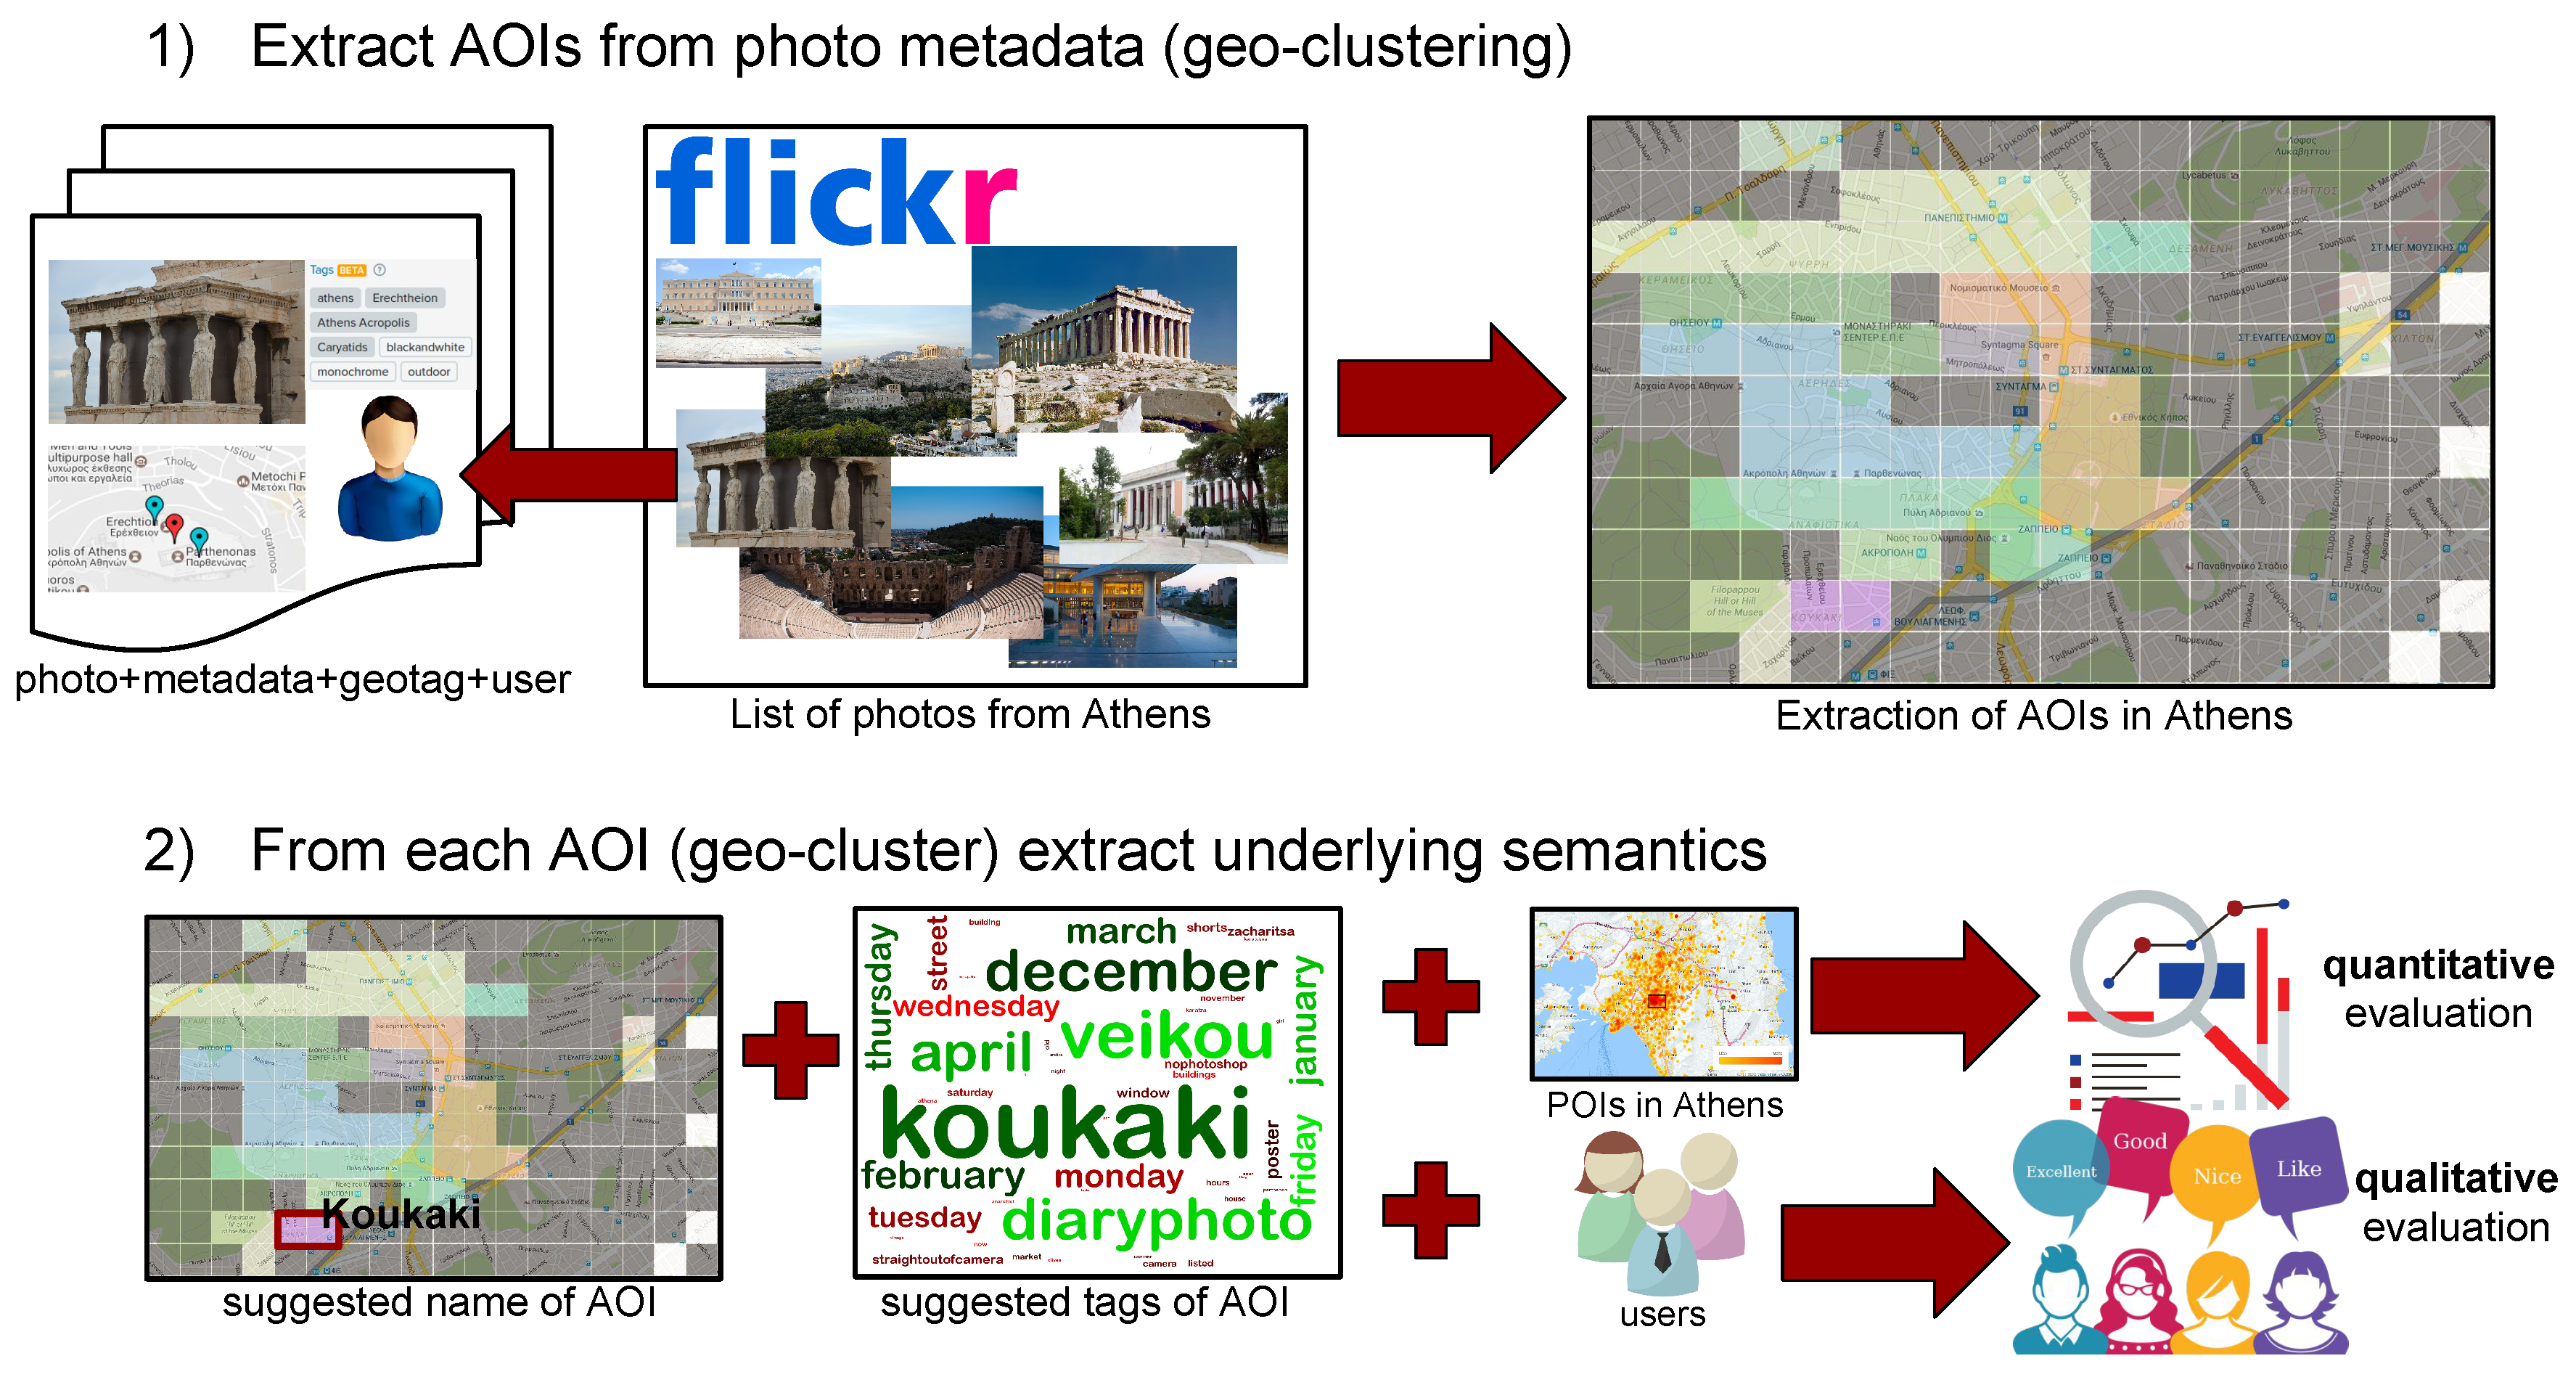
3. Proposed Methodology

In this section, we shall present in detail the proposed geo-clustering algorithm which extends previous work [35]. In brief, it aims to identify AOIs, based on user-generated metadata. To this goal, a pre-selected input region is first divided into square sub-regions, which will be referred to interchangeably as “tiles”. The size of tiles is fixed and selected to be relatively small, based on heuristic observations within the initial region. A discussion on this will follow, in Section 4. A graph-based representation is adopted, so as to model the connectivity of neighboring tiles, each described by a set of tags. Tiles are merged and upon an iterative process, a set of larger areas is determined within the initial region. Opposed to the majority of the state-of-the-art methods that have been presented in Section 2.2, our AOI extraction framework relies solely on user-generated metadata and attempts to improve related supervised clustering approaches, by adding the inherent semantics of user-tagged images, shared within a social network. Within the whole process we do not include any kind of knowledge. To facilitate the reader, symbols used throughout this paper and corresponding descriptions have been summarized in Table 1. Moreover, at the following we shall use the terms AOI, region and geo-cluster interchangeably.

3.1. Geo-Clustering Algorithm

The first level of the problem at hand is to extract a set of vernacular regions within an urban area, based on user-generated sets of tags. It may be formalized as follows: “Given an area, extract a set of homogeneous AOIs, in terms of the sets of tags that have been assigned by users at the process of tagging photos taken therein and shared within a social network”. In other words, at this level we do not use any other prior knowledge, except from the harvested tags of geo-tagged photos.

3.1.1. Notation and Definitions

Given an area, the first step is to divide it into sub-regions. To this goal, many approaches have been proposed in the literature, however it still remains an open challenge, since none could guarantee an optimal solution. When equality of tiles is necessary, overlapping regions may be used (e.g., as in our previous work [36]), or alternatively, simpler, square grid-based regions (e.g., as in [37]). Although overlapping regions have a few advantages, e.g., closely geo-tagged photos belong to the same geo-cluster, this would imply that overlapped tiles would share descriptions (tags). This is not a desired property in the context of this work. Thus, herein we adopt a simpler square grid-based approach, since we focus on the description and merging of sub-regions. We empirically set, each side of a tile to an fixed width, W R .
Now, let R denote a given region containing a set of photos P. Let also R i , j denote a given tile, containing a set of photos P i , j , thus R P i , j = P . Moreover, let T i , j denote a set of tags, containing all tags from photos in P i , j and a subset D i , j of T i , j , which constitutes the tag-based region description. In the aforementioned grid, i and j denote the corresponding line and column of the grid, where R i , j is placed.
Since we have adopted a square grid, the most intuitive approach to define the set of the initial neighboring tiles is to use 4-connectivity. This way, let N i , j { R i , j up , R i , j right , R i , j down , R i , j left } . Obviously:
  • R i , j up = R i 1 , j
  • R i , j right = R i , j + 1
  • R i , j down = R i + 1 , j
  • R i , j left = R i , j 1
Of course, when two tiles are merged, the set of neighbors of the resulting sub-region is the intersection of neighbors of the initial tiles.

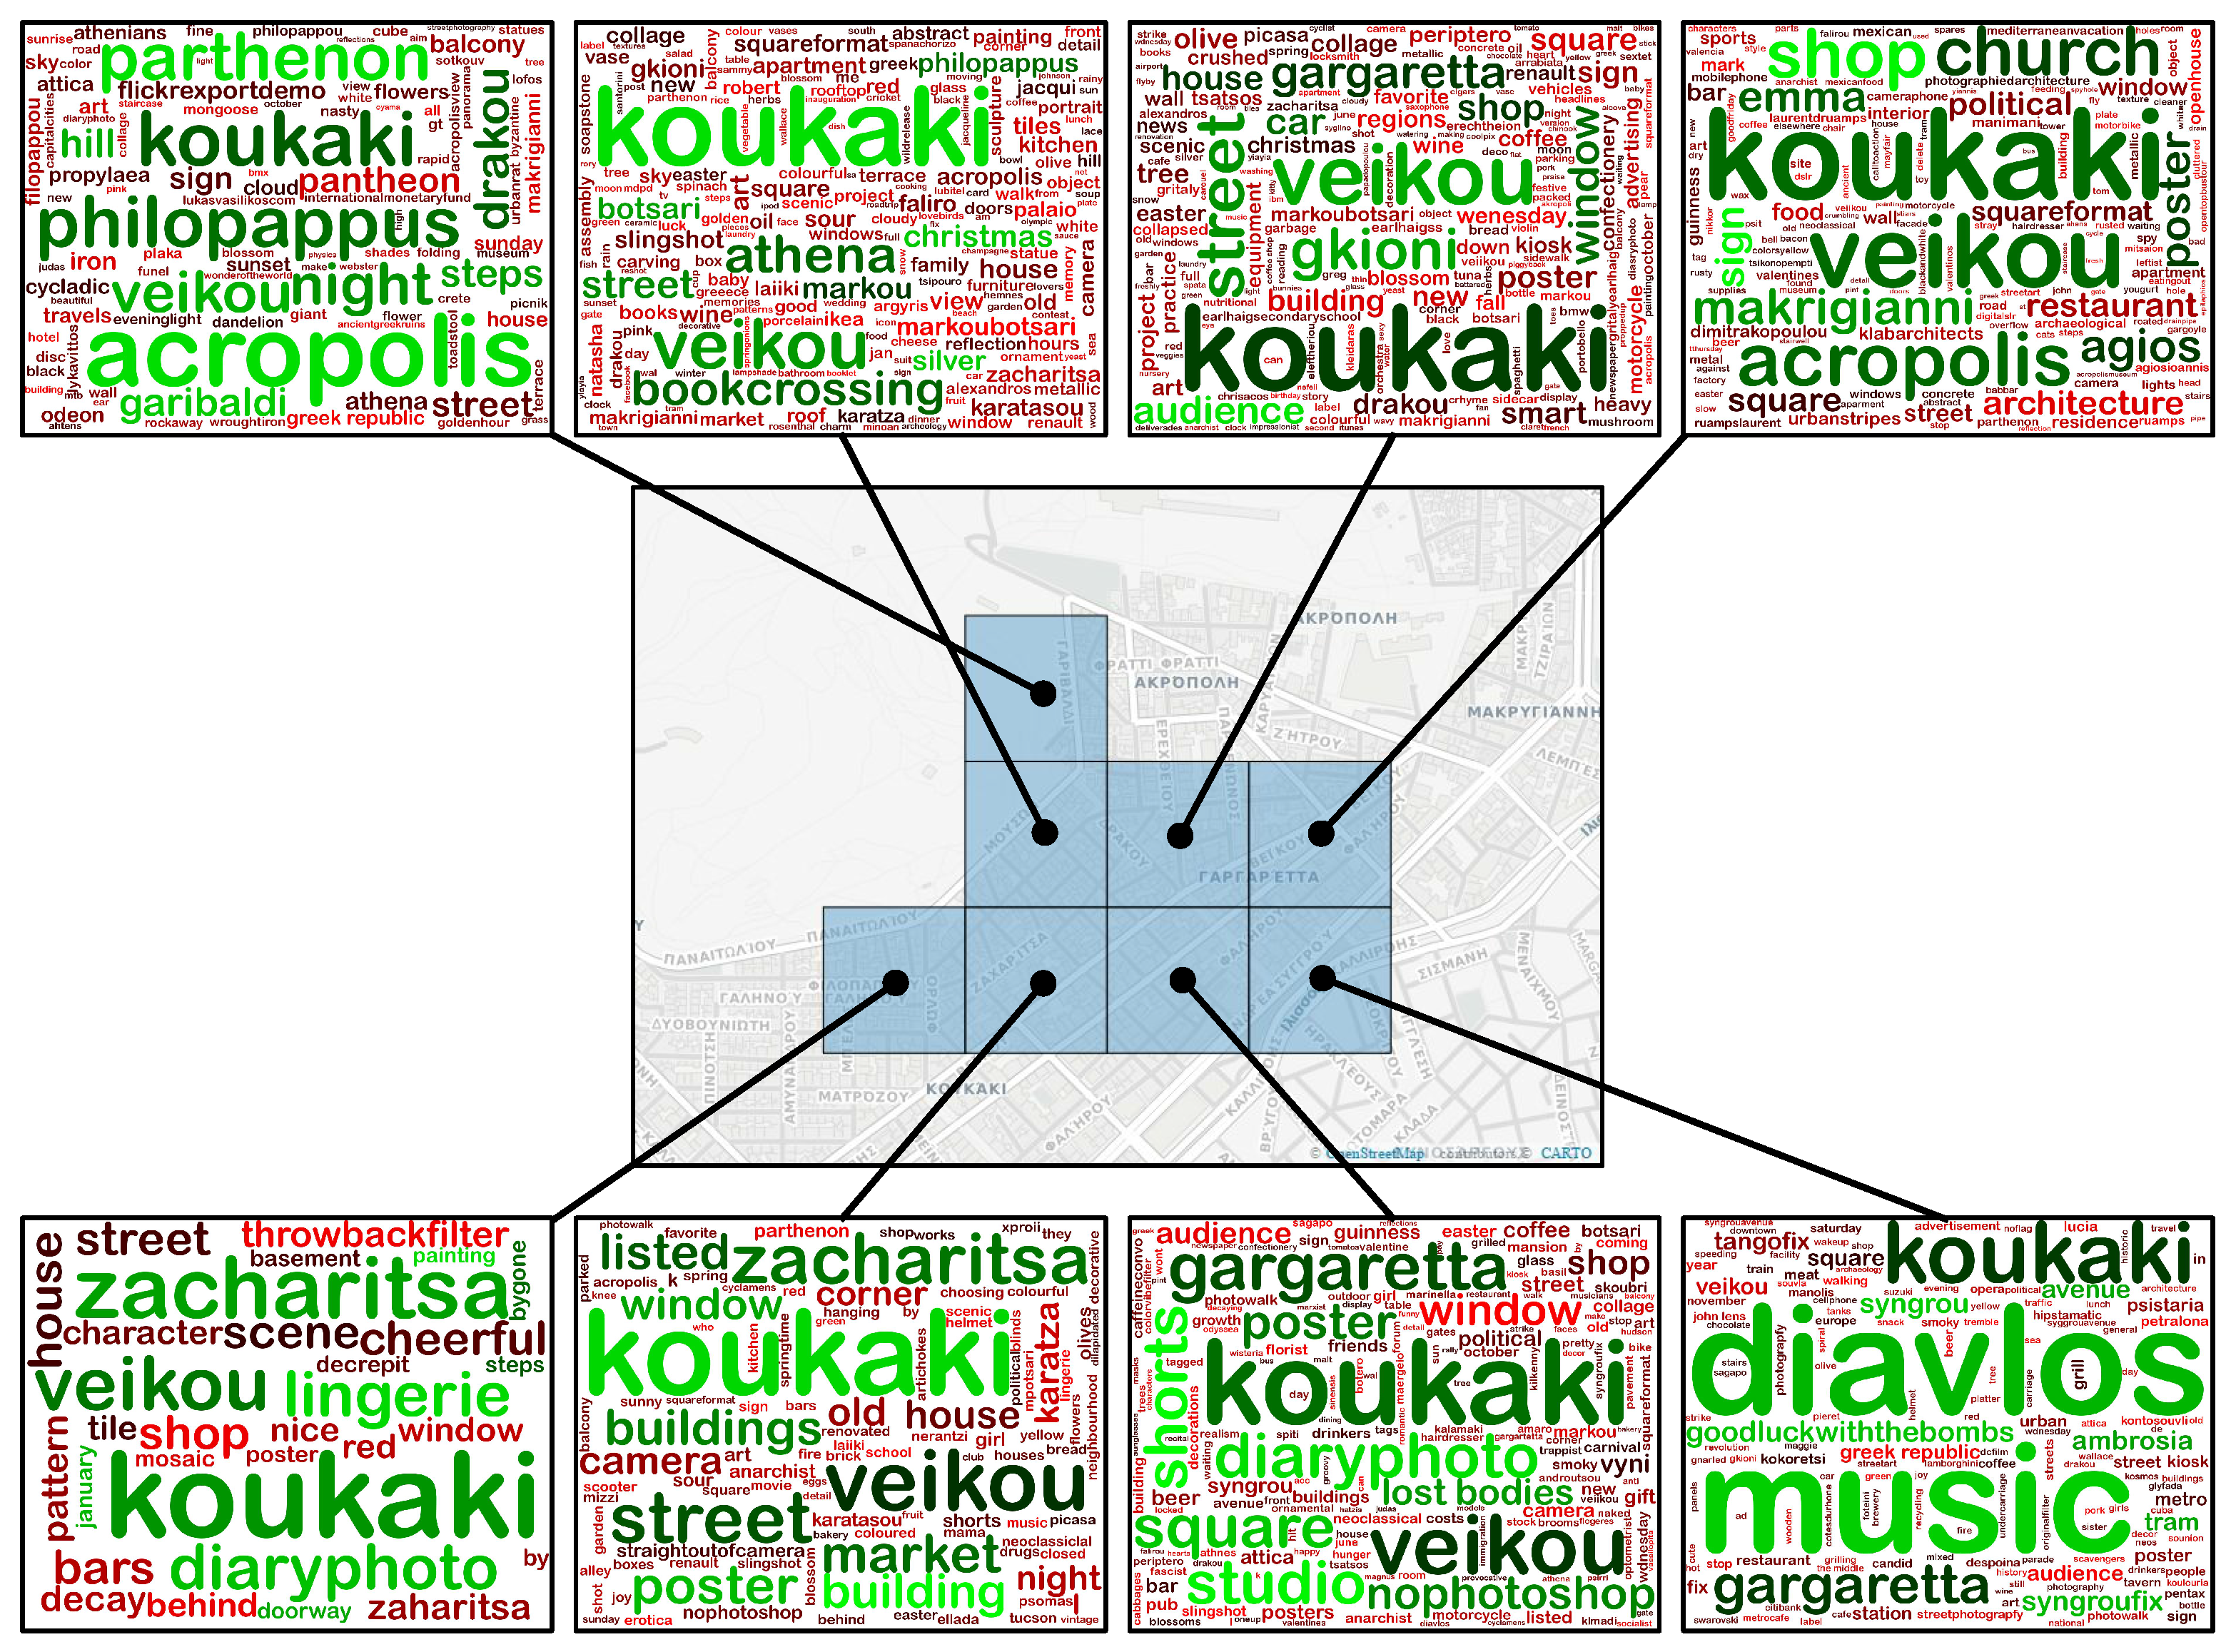
3.1.2. Region Description

For each tile, we exploit T i , j in order to create its semantic representation D i , j . We expect that among the user-generated tags, we shall encounter some that describe it by means of locality (e.g., Thiseio) or landmark(s) (e.g., Acropolis). Even though users tend to add “personal” tags (e.g., a name), we expect that a subset of the most “popular” tags (i.e., selected by the majority of users) will be able to describe a tile in a discriminable way. More specifically, for R i , j the region description D i , j L is the set of the L most “important” tags, where importance may be measured in three ways: (a) the number of users that have used a specific tag within the given region; (b) the occurrences of the tag within the given region and (c) the average percentage of a tag among those selected by the user for the given region. In Section 4, these cases will be referred to in short as (U), (T) and (TU), respectively.

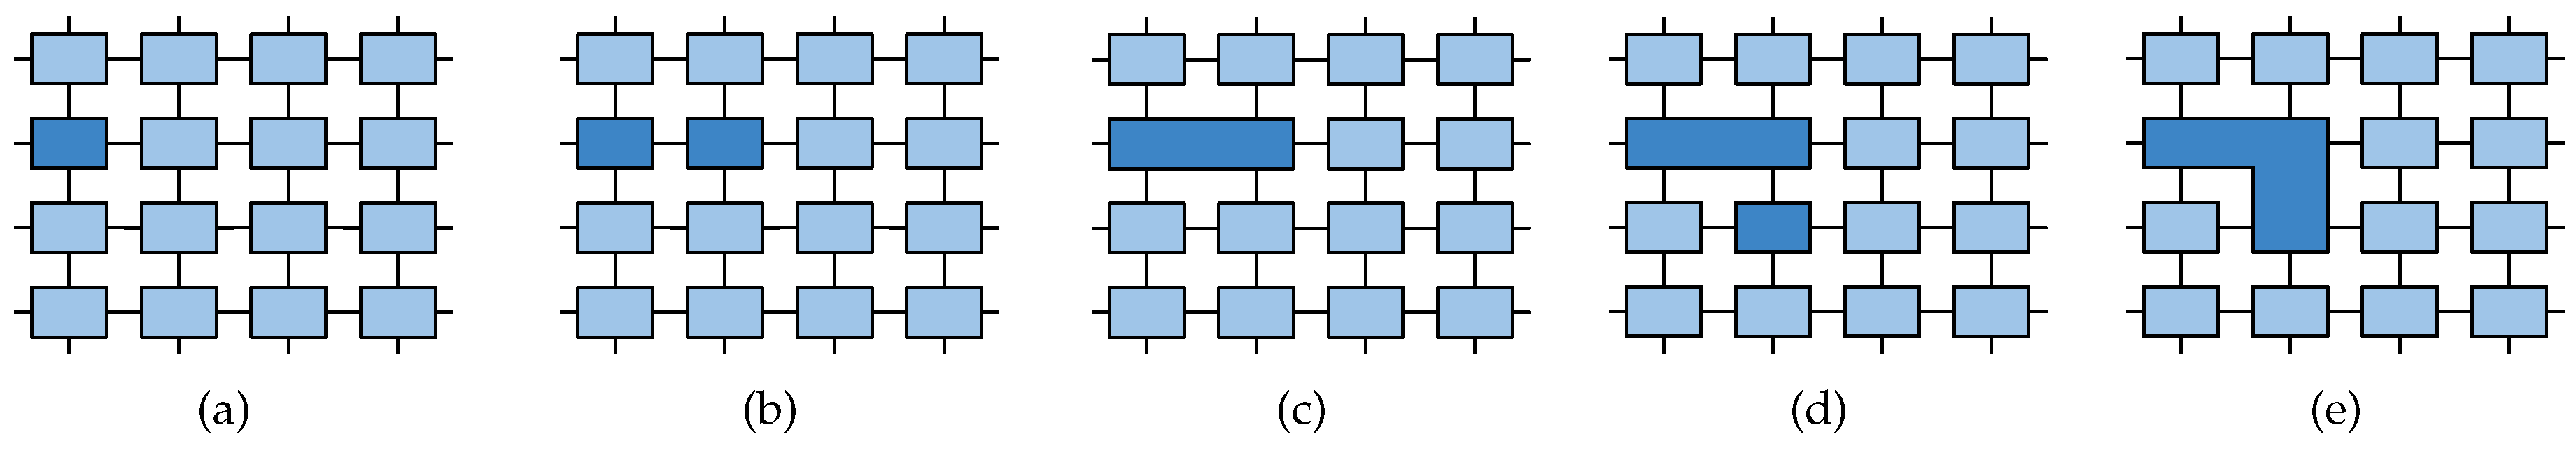
3.1.3. Region Merging

One of the challenges when comparing two sets is to select an appropriate distance/similarity measure. Herein we use the Jaccard (Tanimoto) distance [38], which consists a well-known measure for comparing the similarity and diversity of sample sets. The Jaccard similarity J ( A , B ) between two sets A , B is given by
J ( A , B ) = | A B | | A B | = | A B | | A | + | B | | A B | ,
where in our case A , B are the sets of tags that have been chosen to represent two tiles, e.g., using the methodology described in Section 3.2. Using the aforementioned notation, tiles R A , R B with descriptions D A , D B are merged when (a) they are neighbors and (b) J ( D A L , D B L ) > S , where S [ 0 , 1 ] is a user-defined similarity threshold.
The merging process begins from the tile R 1 , 1 , i.e., the one of the first row, first column and continues horizontally. The distance to all its neighbors is checked. It is merged with the tile whose similarity is the max among all those whose similarity is greater than S, if any. For a new tile, its description is calculated based on the union of the sets of tags and the process continues by checking the similarities to its neighbors. In case there does not exist a neighbor with similarity greater than S, the process continues with the next tile which has not been merged. A graphical example of the tile merging process is illustrated in Figure 2. The semantic geo-clustering process is presented in pseudocode in Algorithm 1, while we also present pseudocode for Jaccard similarity and the region merging process for the sake of clarity in Algorithms 2 and 3, respectively.
Algorithm 1: Semantic Geo-Clustering
Algorithms 10 00035 i001
Algorithm 2: Jaccard Similarity
Algorithms 10 00035 i002
Algorithm 3: Region Merging
Algorithms 10 00035 i003

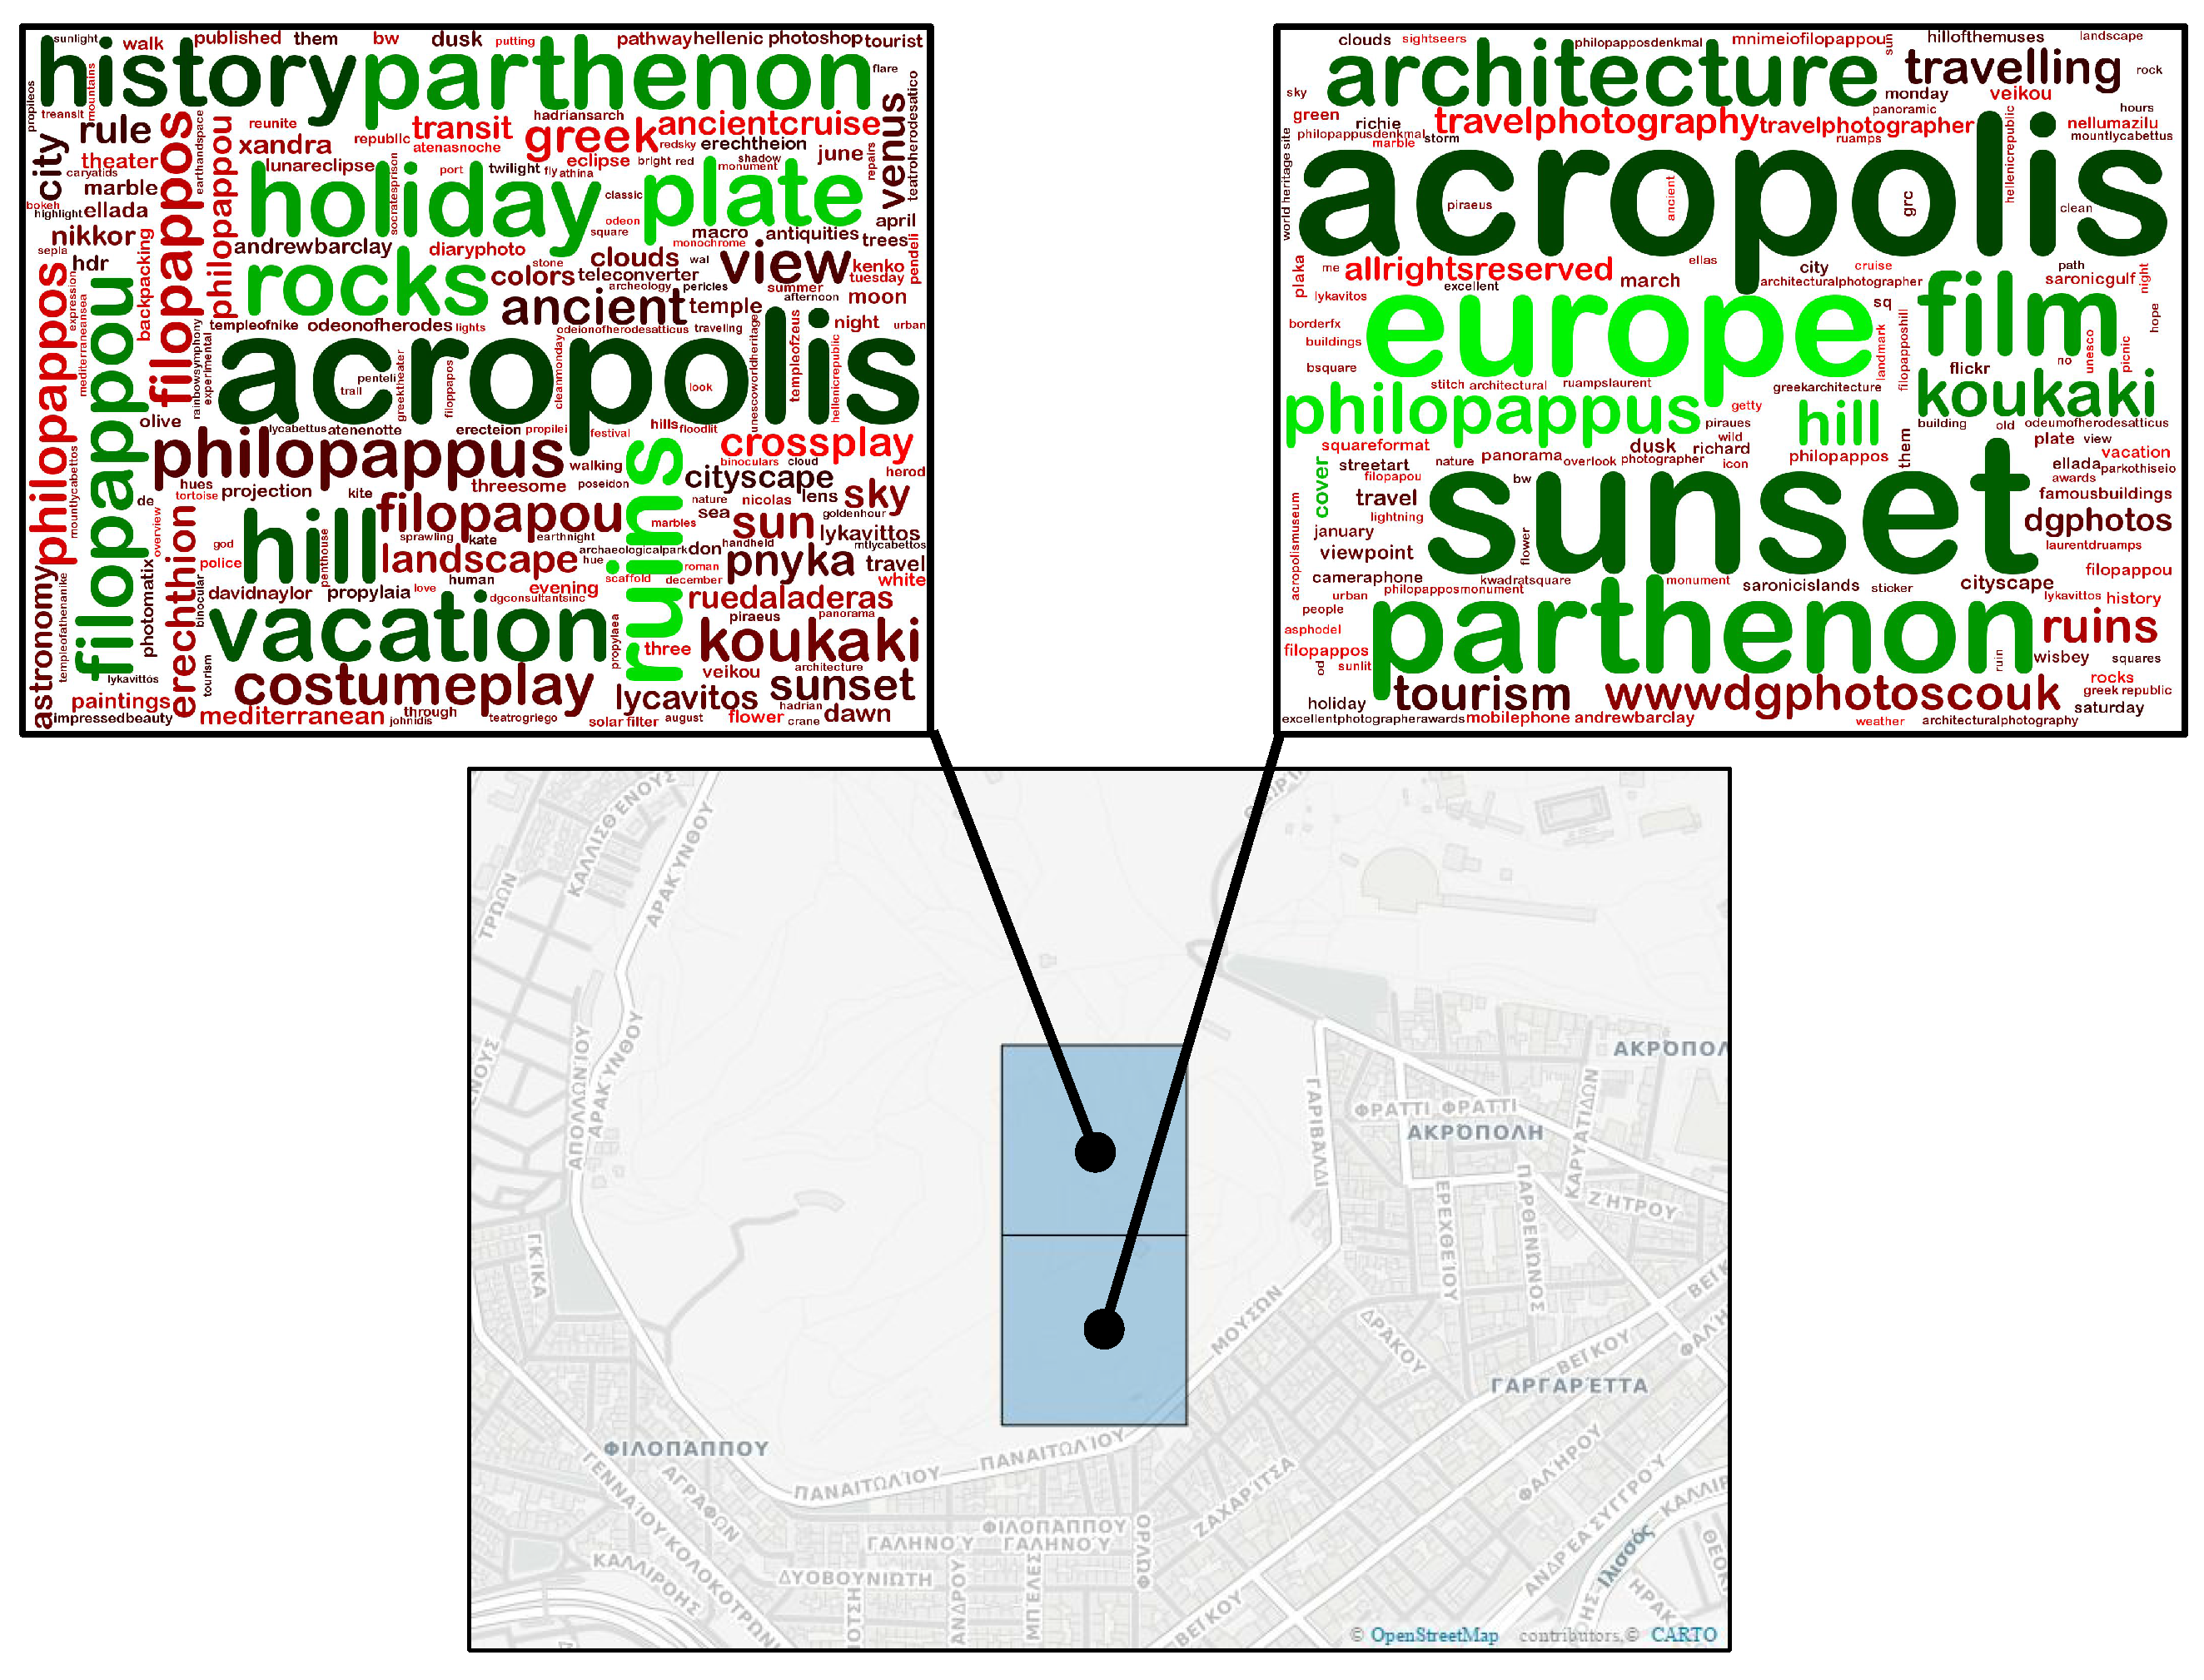
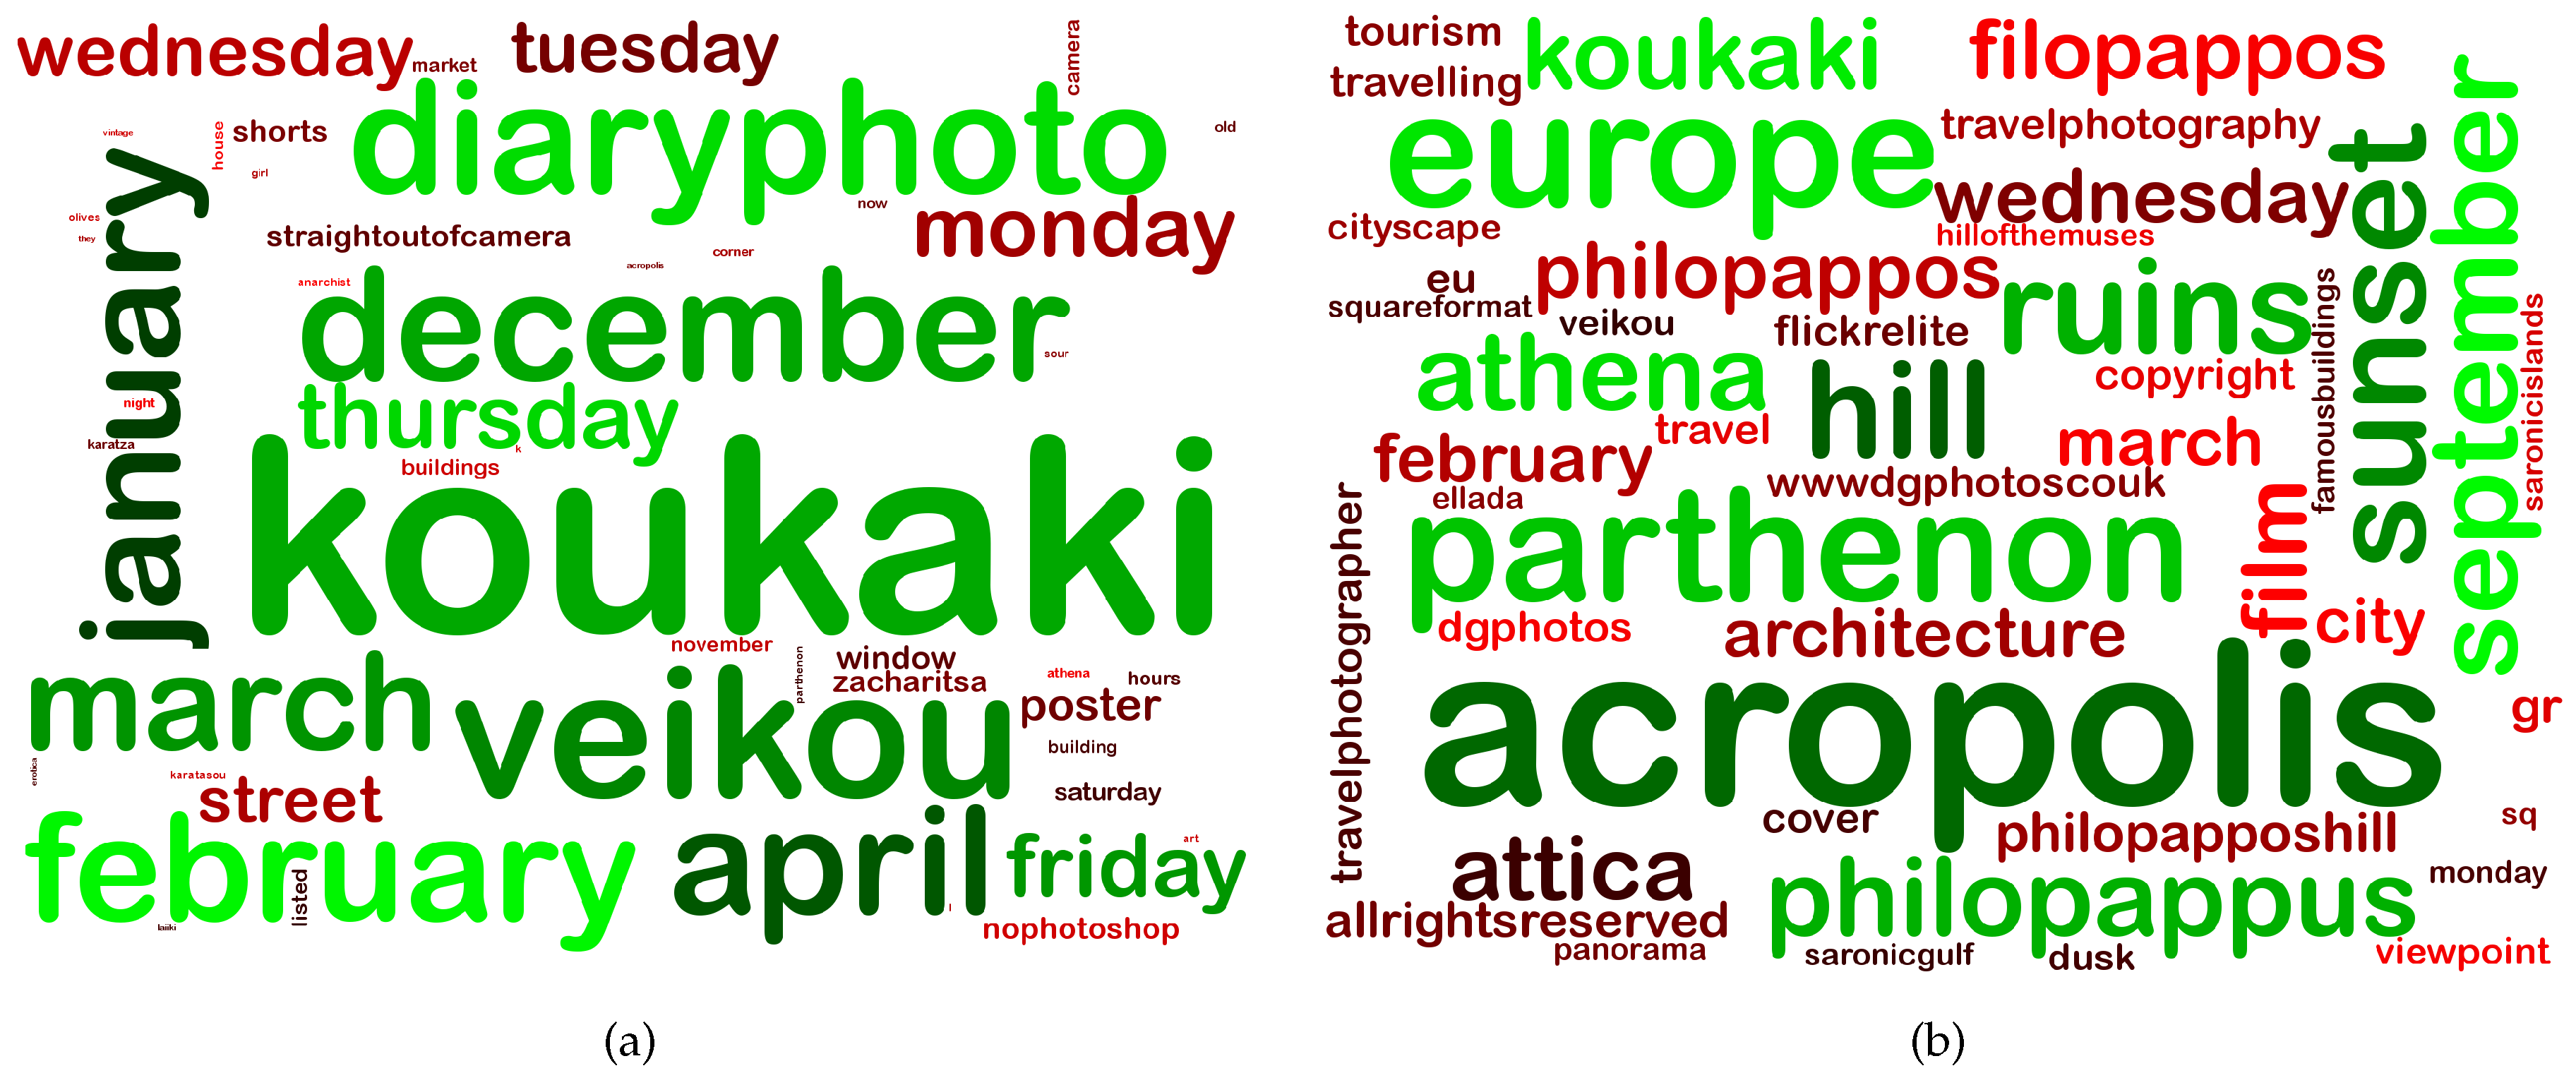
3.2. Ranking Geo-Cluster Tags

Since among the purposes of this work is one to attach a semantically meaningful label to each detected AOI, we opt for a well-known approach commonly encountered in relevant research works (e.g., [33,39,40,41,42]). A typical first step is to extract the most representative tags of an AOI. This is not a trivial task and is commonly tackled using several heuristic-based measures, such as the tag frequency, popularity within the users, or even visual features of their corresponding photos [43]. In this work, given the top-L tags of an AOI, that are extracted as mentioned in Section 3.1.2, in order to acquire the most representative one we choose to adopt a variation of the TF-IDF model as a tag-ranking metric. This particular weighting scheme acts as a statistical measure so as to ascertain the uniqueness of a word found in a document, by taking into consideration how often it appears both in the document itself and across the examined corpus. The TF-IDF metric is given by
tf - idf t , d = tf t , d × idf t ,
where tf t , d measures the frequency of a specific word within a document and idf t denotes its importance (i.e., the overall number of documents in the collection that contain it). The inverse document frequency acts essentially as a mechanism that limits the weight of non-informative words that occur frequently across the corpus and increases that of more unique and meaningful ones. In our case, the term frequency of a user-generated tag is determined by the number of photos associated with it inside a region.
Considering both the limited spatial boundaries of the examined area in the context of our experiments, along with the fact that it is rather usual for a city to contain a relative small number of AOIs, we calculate the inverse document frequency for a given tag x by dividing the total number of photos contained in the dataset by the number of those that include x, instead of relying solely on the fraction of regions where it appears. As a result, it is possible to limit the negative effect that the inverse document frequency has on a tag that can be spotted on multiple AOIs (e.g., Acropolis and Parthenon), yet still retain its usefulness for more generic and widespread tags. For the sake of clarity, we present pseudocode of the TF-IDF process in Algorithm 4, which works on a clustering C p and produces a set of ranked tags T ^ i , p for each geo-cluster within C p .
Algorithm 4: Ranking Geo-Cluster Tags
Algorithms 10 00035 i004

4. Experiments and Results
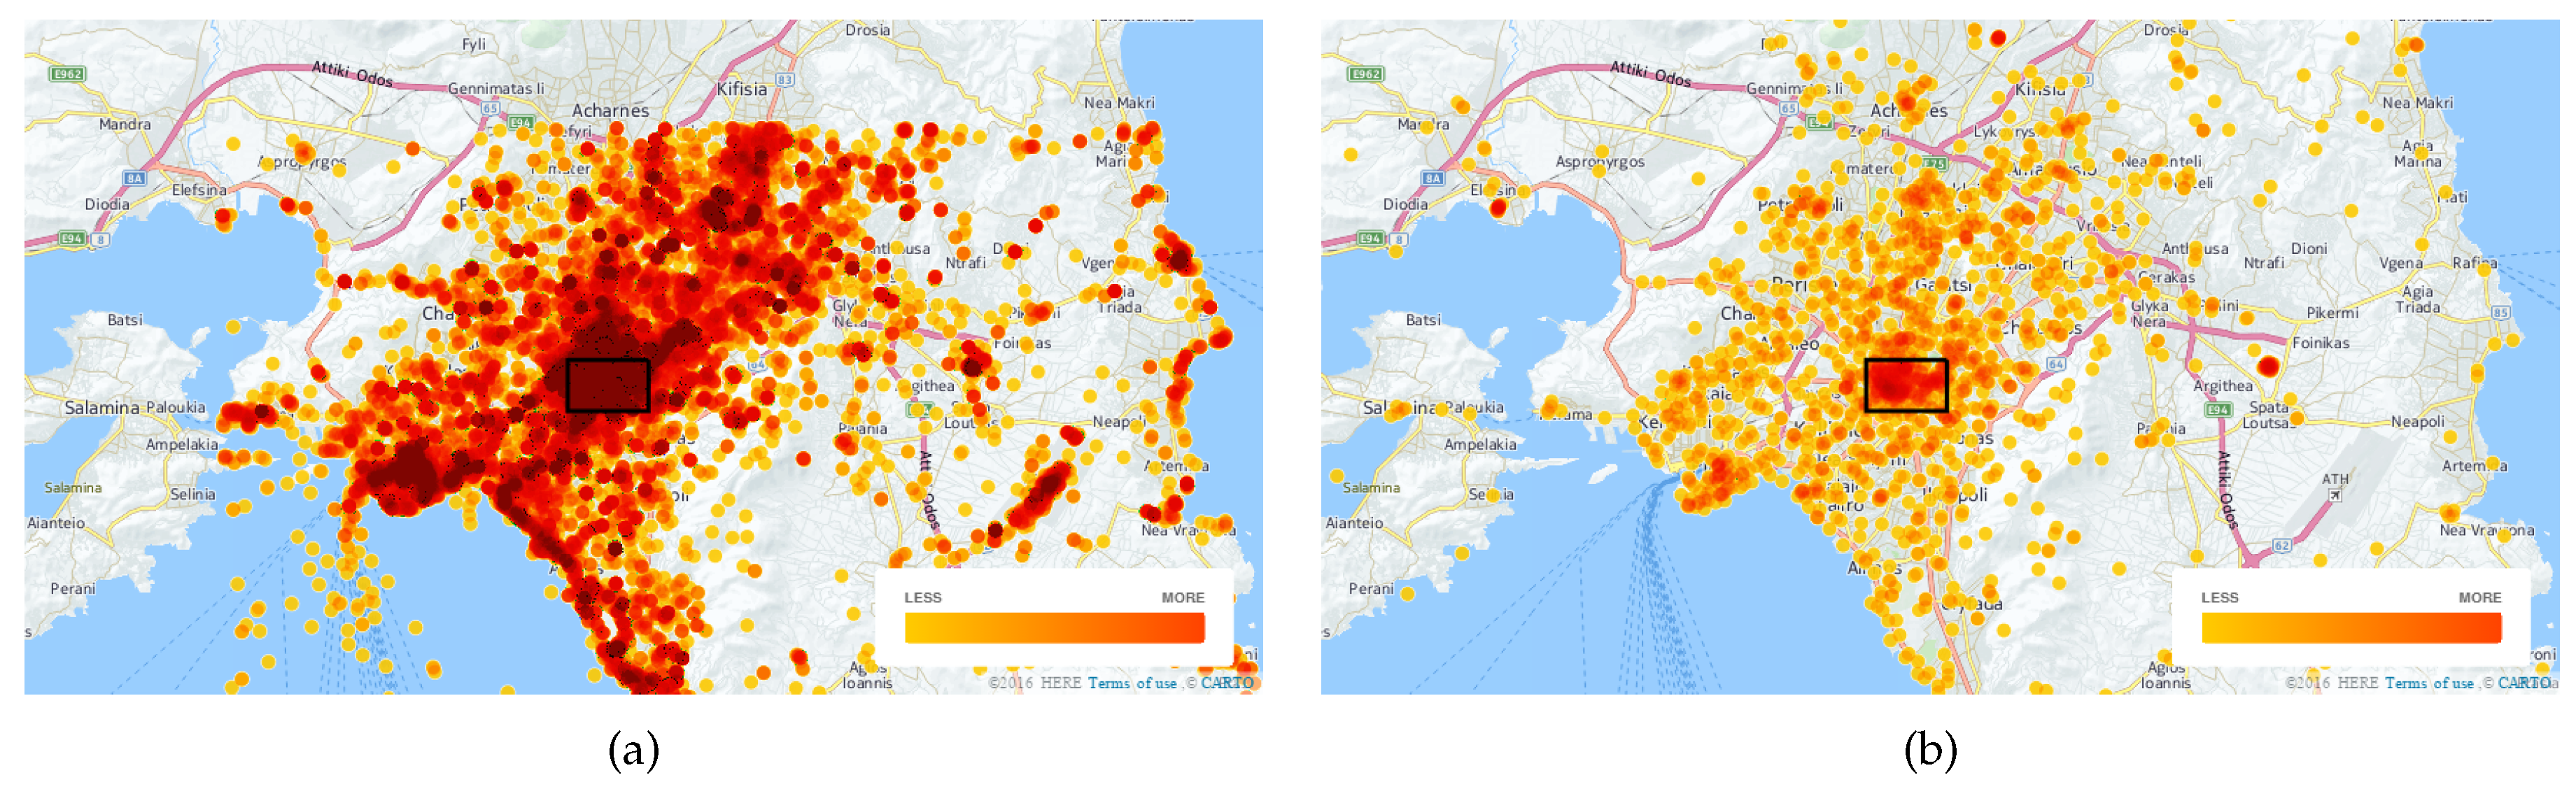
4.1. Data Set

For the experimental evaluation of our approach we used an urban image dataset which consists of a total of 79,465 photos collected from the center of the city of Athens, Greece. All these photos are geo-tagged, dated between January 2004–December 2015 and collected from Flickr using its public API. (https://www.flickr.com/services/api/) More specifically, we queried Flickr for a region covering what is in general considered to be the center of the Athens, (i.e., where the city’s main touristic attractions are located) and retrieved all geo-tagged photos. This rectangular area is equal to 7.7 km 2 . Its Northern-Western and Southern-Eastern points have coordinates ( 37.9836 , 23.7153 ) and ( 37.9643 , 23.7541 ) , respectively. This is illustrated in Figure 3 within a larger map of Athens. Furthermore, we used OpenStreetMap to recover tourist attractions for the broader region of Attica, Greece. In particular, the densities of the collected photos are illustrated in Figure 3a, while those of POIs are depicted in Figure 3b. Upon careful observation of both, one may easily agree that the selected area is both the most “photographed”, (density of photos is 10,887.8 photos/km 2 compared to 124.7 photos/km 2 for the broader area) while it also contains the highest density of POIs ( 46.2 POIs/km 2 compared to 2.2 POIs/km 2 for the broader area). Notably, it contains approx. 61% of photos, and approx. 35% of all POIs of possible tourist interest. However, approx. 96% of the most important POIs of Athens are included. We identify their importance by measuring the number of images in close proximity (taken within a radius of 100 m) to a particular POI.
The collected photos have been captured by 5038 users of various nationalities, thus they contain tags of different languages. Although the majority of these tags is in English, we used the Google Translate API, (https://cloud.google.com/translate/) in order to translate non-English tags (leaving English ones unchanged). This way, we tried to exploit tags which would otherwise act as “noise”, although noisy tags still remained. Additionally, we also created a manual stoplist, whose goal was to remove non-relevant (to our goals) tags. For example, many cameras and smartphones automatically add metadata information related to their brand and model. Also, camera settings at the time of taking the photo are also added as part of the metadata. Users often add tags such as Greece or Hellas or even Athens. Such tags are both popular and spread to the whole area. However, they do not provide any useful information, thus may disturb the whole process.

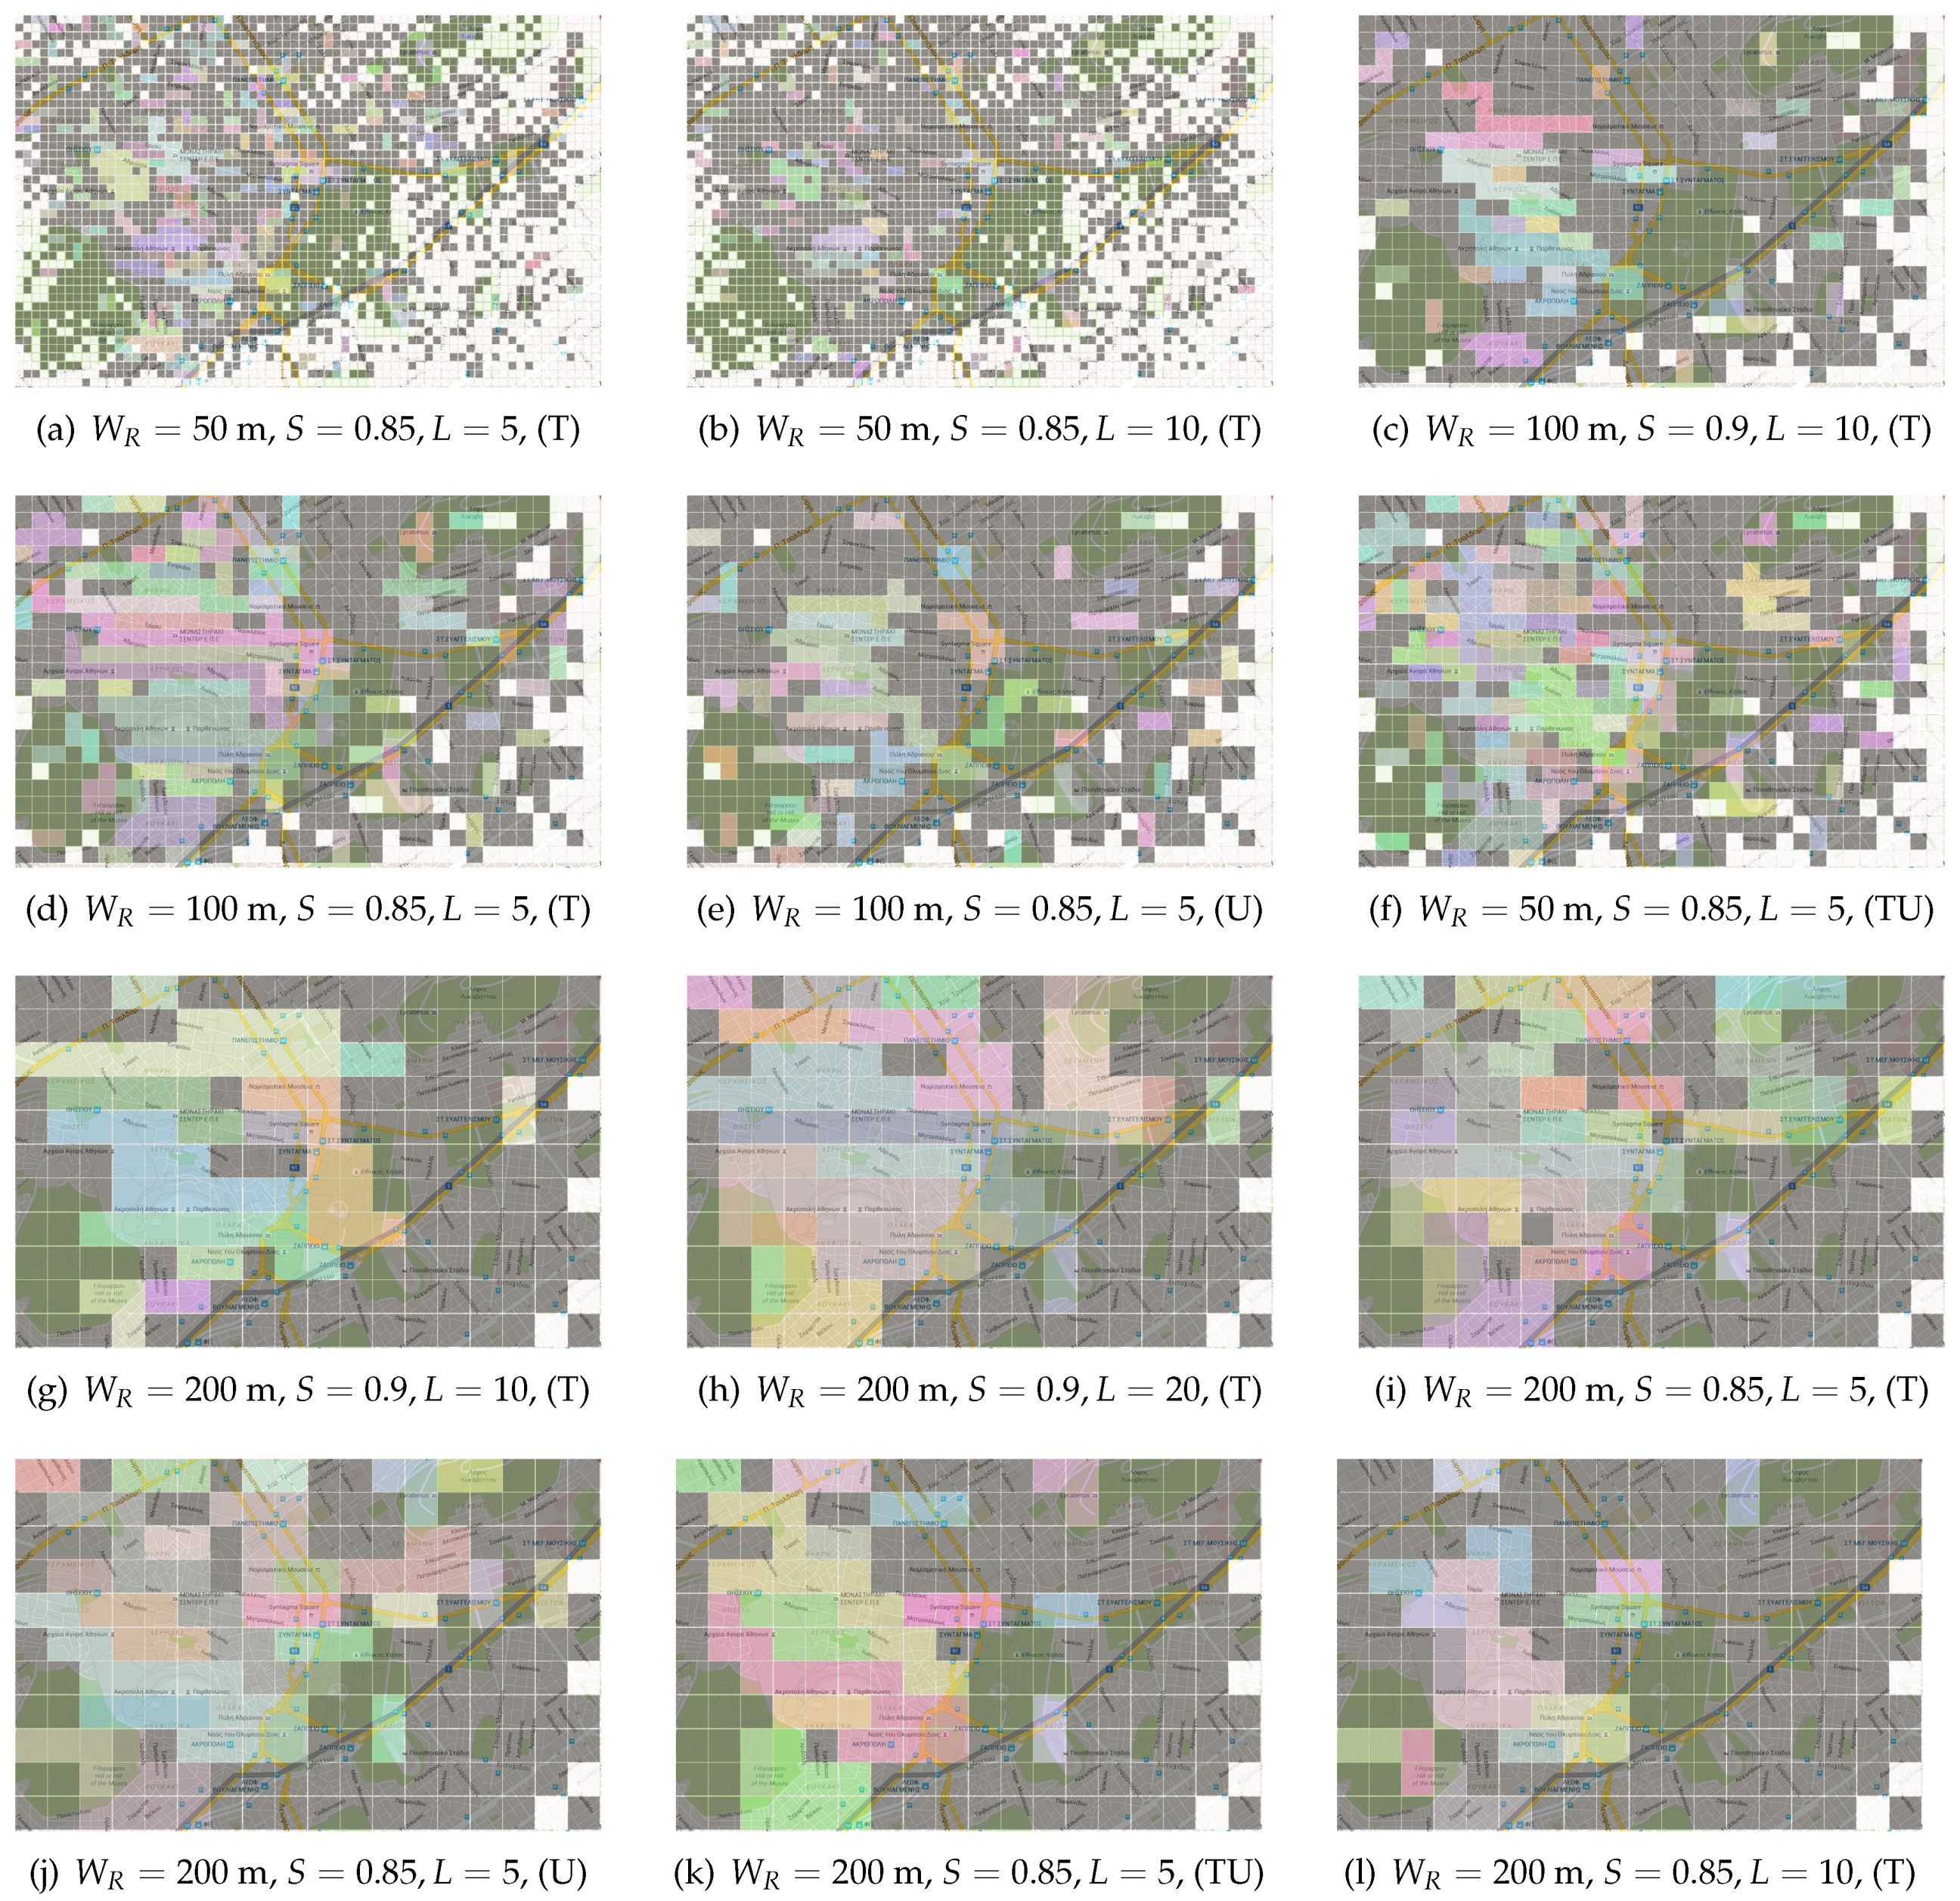
4.2. Experimental Evaluation

For the sake of the evaluation of the proposed algorithm, we choose to follow both a qualitative and a quantitative approach. The former aims to investigate whether real-life users are satisfied (a) with the regions (geo-clusters) extracted by the geo-clustering process and (b) with the proposed description (ideally name) of each.

4.2.1. Quantitative Results

In order to assess the quality of the produced geo-clusters, i.e., evaluate their size, popularity and number of touristic POIs that they contain, we perform a quantitative evaluation of the proposed geo-clustering algorithm using the following metrics, each evaluated on a set of extracted geo-clusters C p for a given run of the algorithm with p denoting the selected input parameters:
  • Avg. POIs per Geo-Cluster (APOIpGC) is the mean value of the number of POIs that are located within the n tiles that comprise a geo-cluster C i C p . This metric may be regarded as the “touristic value” of the geo-cluster and may be calculated as:
    A P O I p G C ( C p ) = 1 n j = 1 n | POI j | ,
    where POI j denotes the set of POIs for a given tile of C i , p and | | denotes set cardinality.
  • Avg. Visitors per Geo-Cluster (AVpGC) is the average number of visitors for a geo-cluster C i , p and may be calculated as:
    A V p G C ( C p ) = 1 n j = 1 n | V i | ,
    where V i denotes the set of unique visitors, for a given tile of C i , p .
  • Avg. Photos per Geo-Cluster (APpGC) is the mean value of the number of geo-tagged photos within a geo-cluster and may be calculated as
    A P p G C ( C p ) = 1 n j = 1 n | P i | ,
    where P i denotes the set of geo-tagged photos, for a given tile of C i , p .
  • Avg. Geo-Cluster Size (AGCS) is the average area of a geo-cluster, in Km 2 :
    A G C S ( C p ) = 1 n i = 1 n area ( C i , p ) ,
    where C i , p denotes a given geo-cluster and n is the number of produced geo-clusters.
  • Avg. Tiles per Geo-Cluster (ATpGC). The mean value of the number of tiles that form a geo-cluster.
    A T p G C ( C p ) = 1 n i = 1 n | T i | ,
    where T j denotes a the set of tiles that comprise a given geo-cluster C i , p and n is the number of produced geo-clusters.
In total, we performed 36 experiments, however we opted to present a subset of them, so as to facilitate both the reader and the qualitative evaluation process, presented in Section 4.2.2 and ruled out those that produced either a large number of relatively small AOIs (e.g., consisting of 1–2 tiles) or a small number of relatively large AOIs (e.g., less than 5 AOIs in total). The selected cases along with the results of the proposed algorithm are summarized in Figure 4. Results using the aforementioned metrics are summarized in Table 2. By careful observation of this table, we may come to the following conclusions: Lower tile sizes (i.e., W R = 50 , 100 m) in general lead to more smaller clusters with smaller number of contained POIs, visitors and consequently photos. On the contrary, by increasing tile size (i.e., setting W R = 200 m), allows clusters to become more cohesive. As it will be presented in next Section 4.2.2, this is a feature appreciated by real-life users.

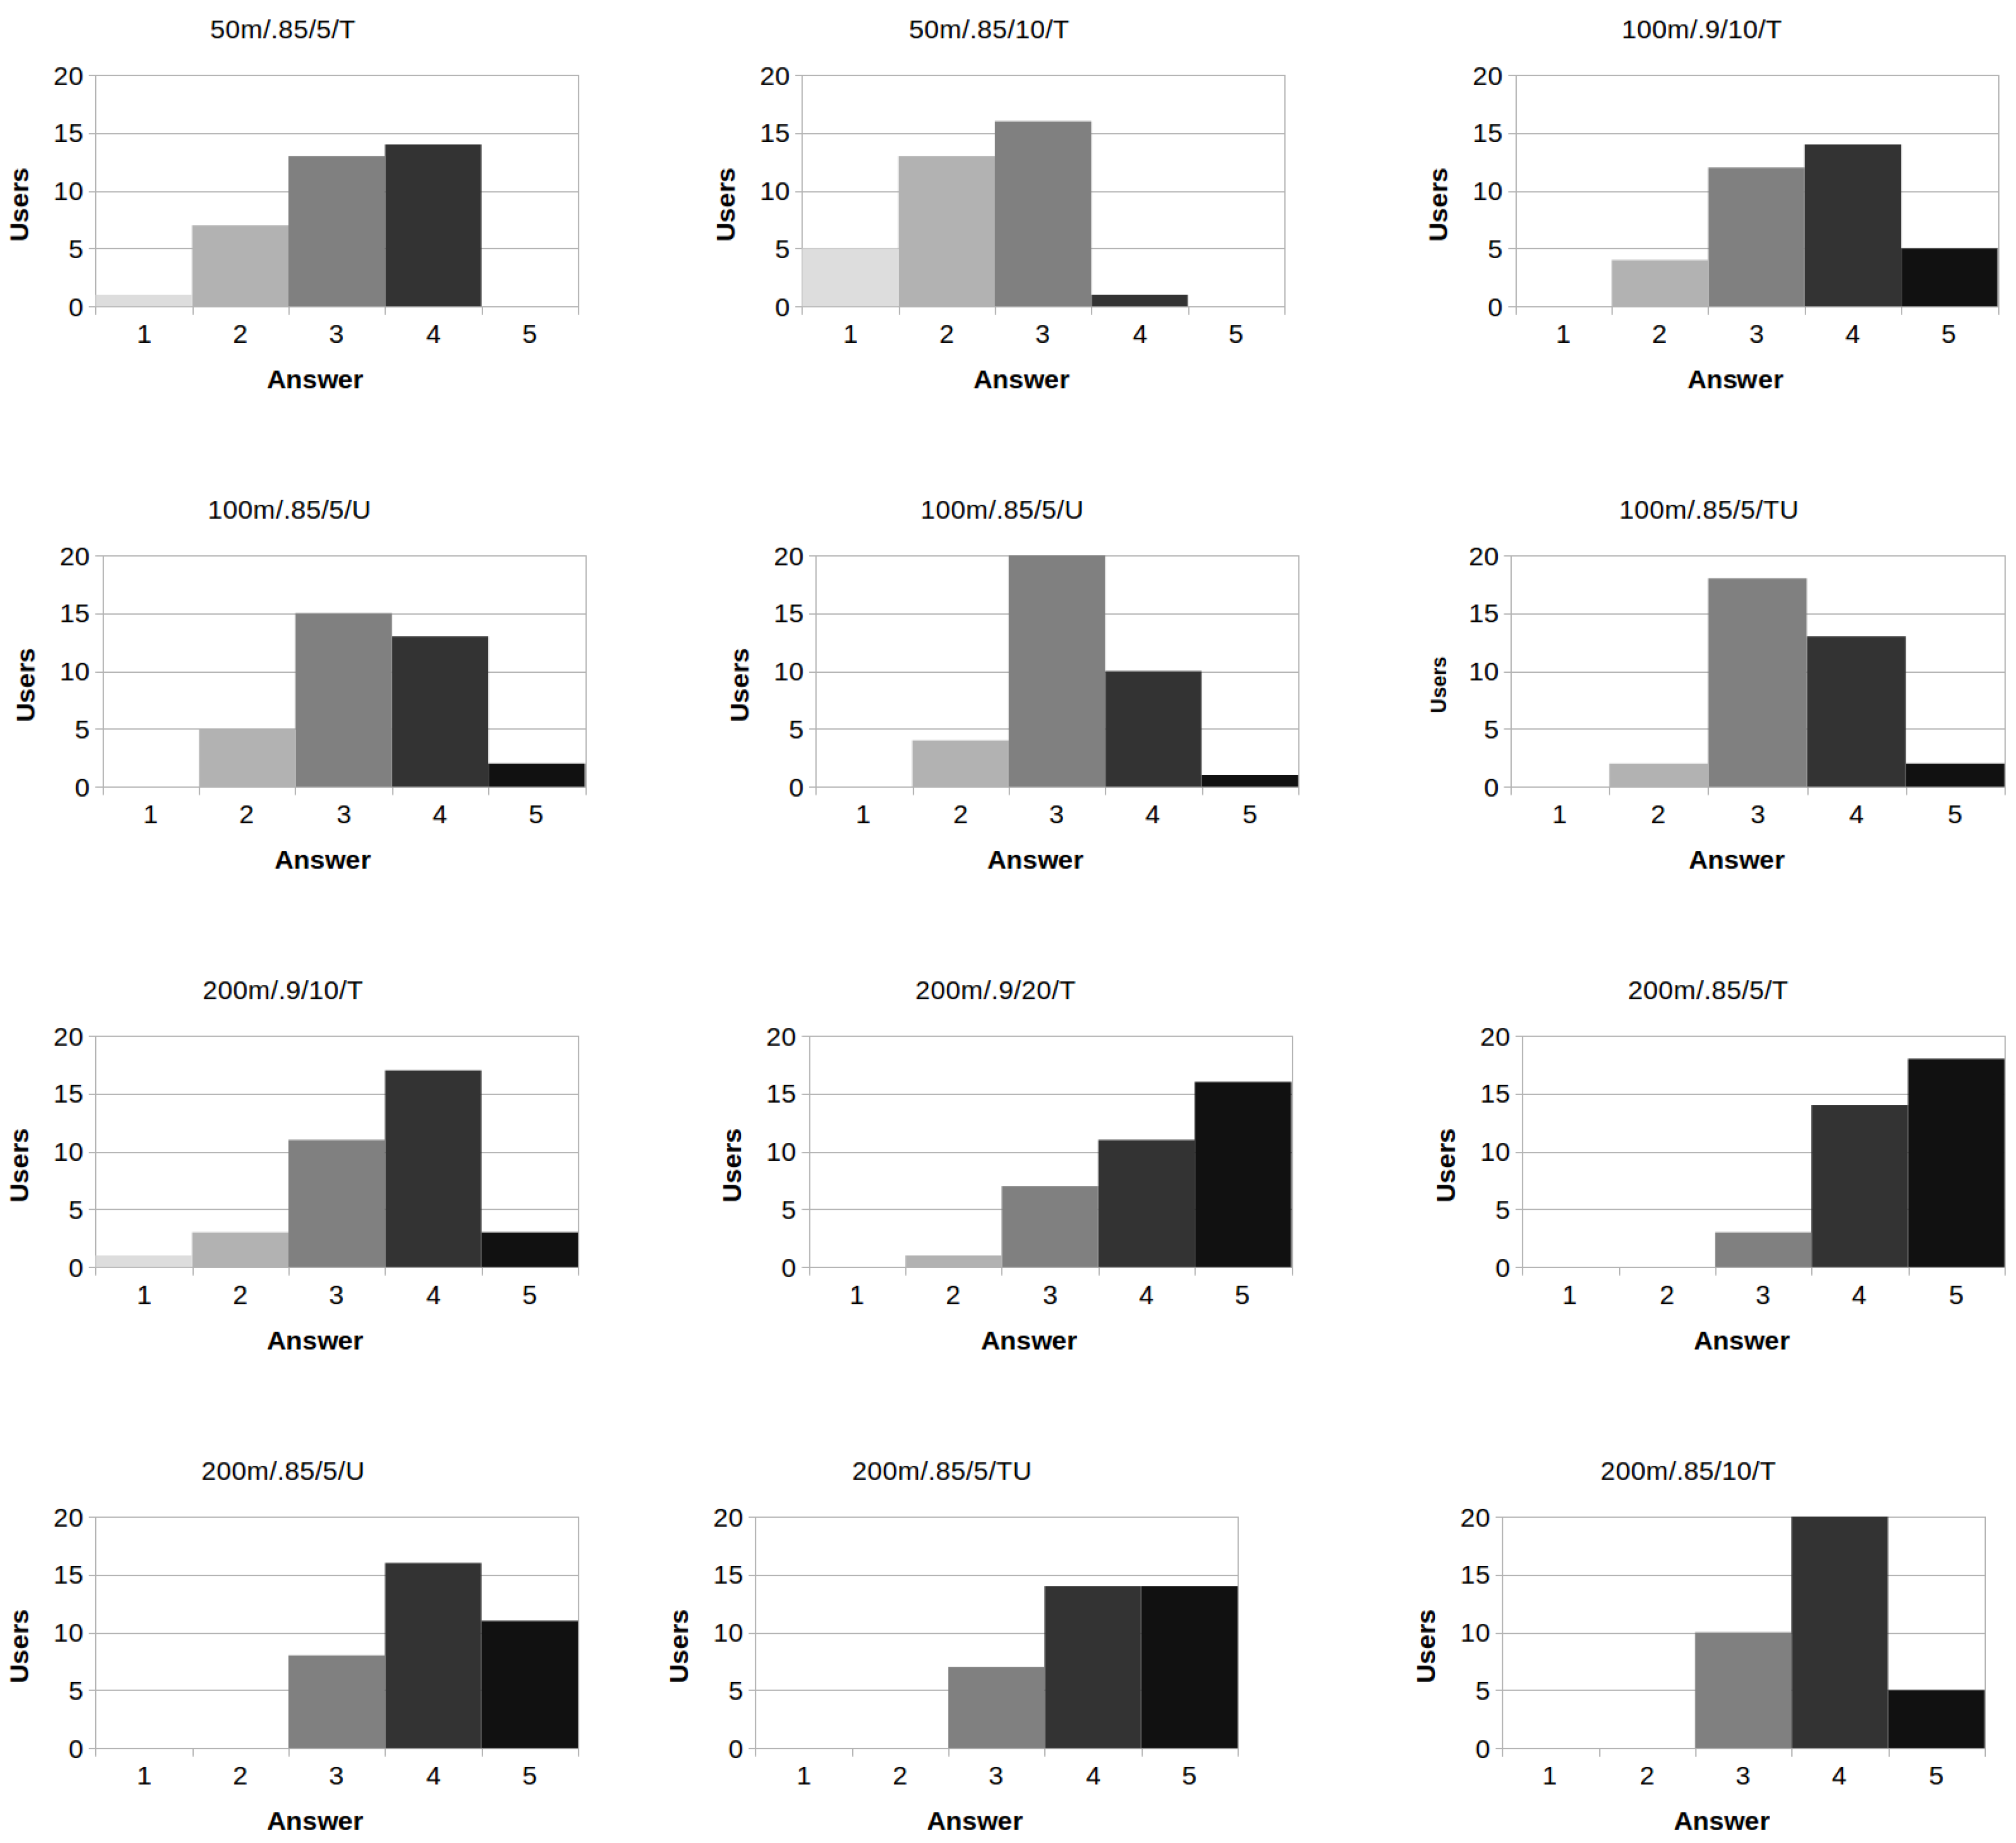
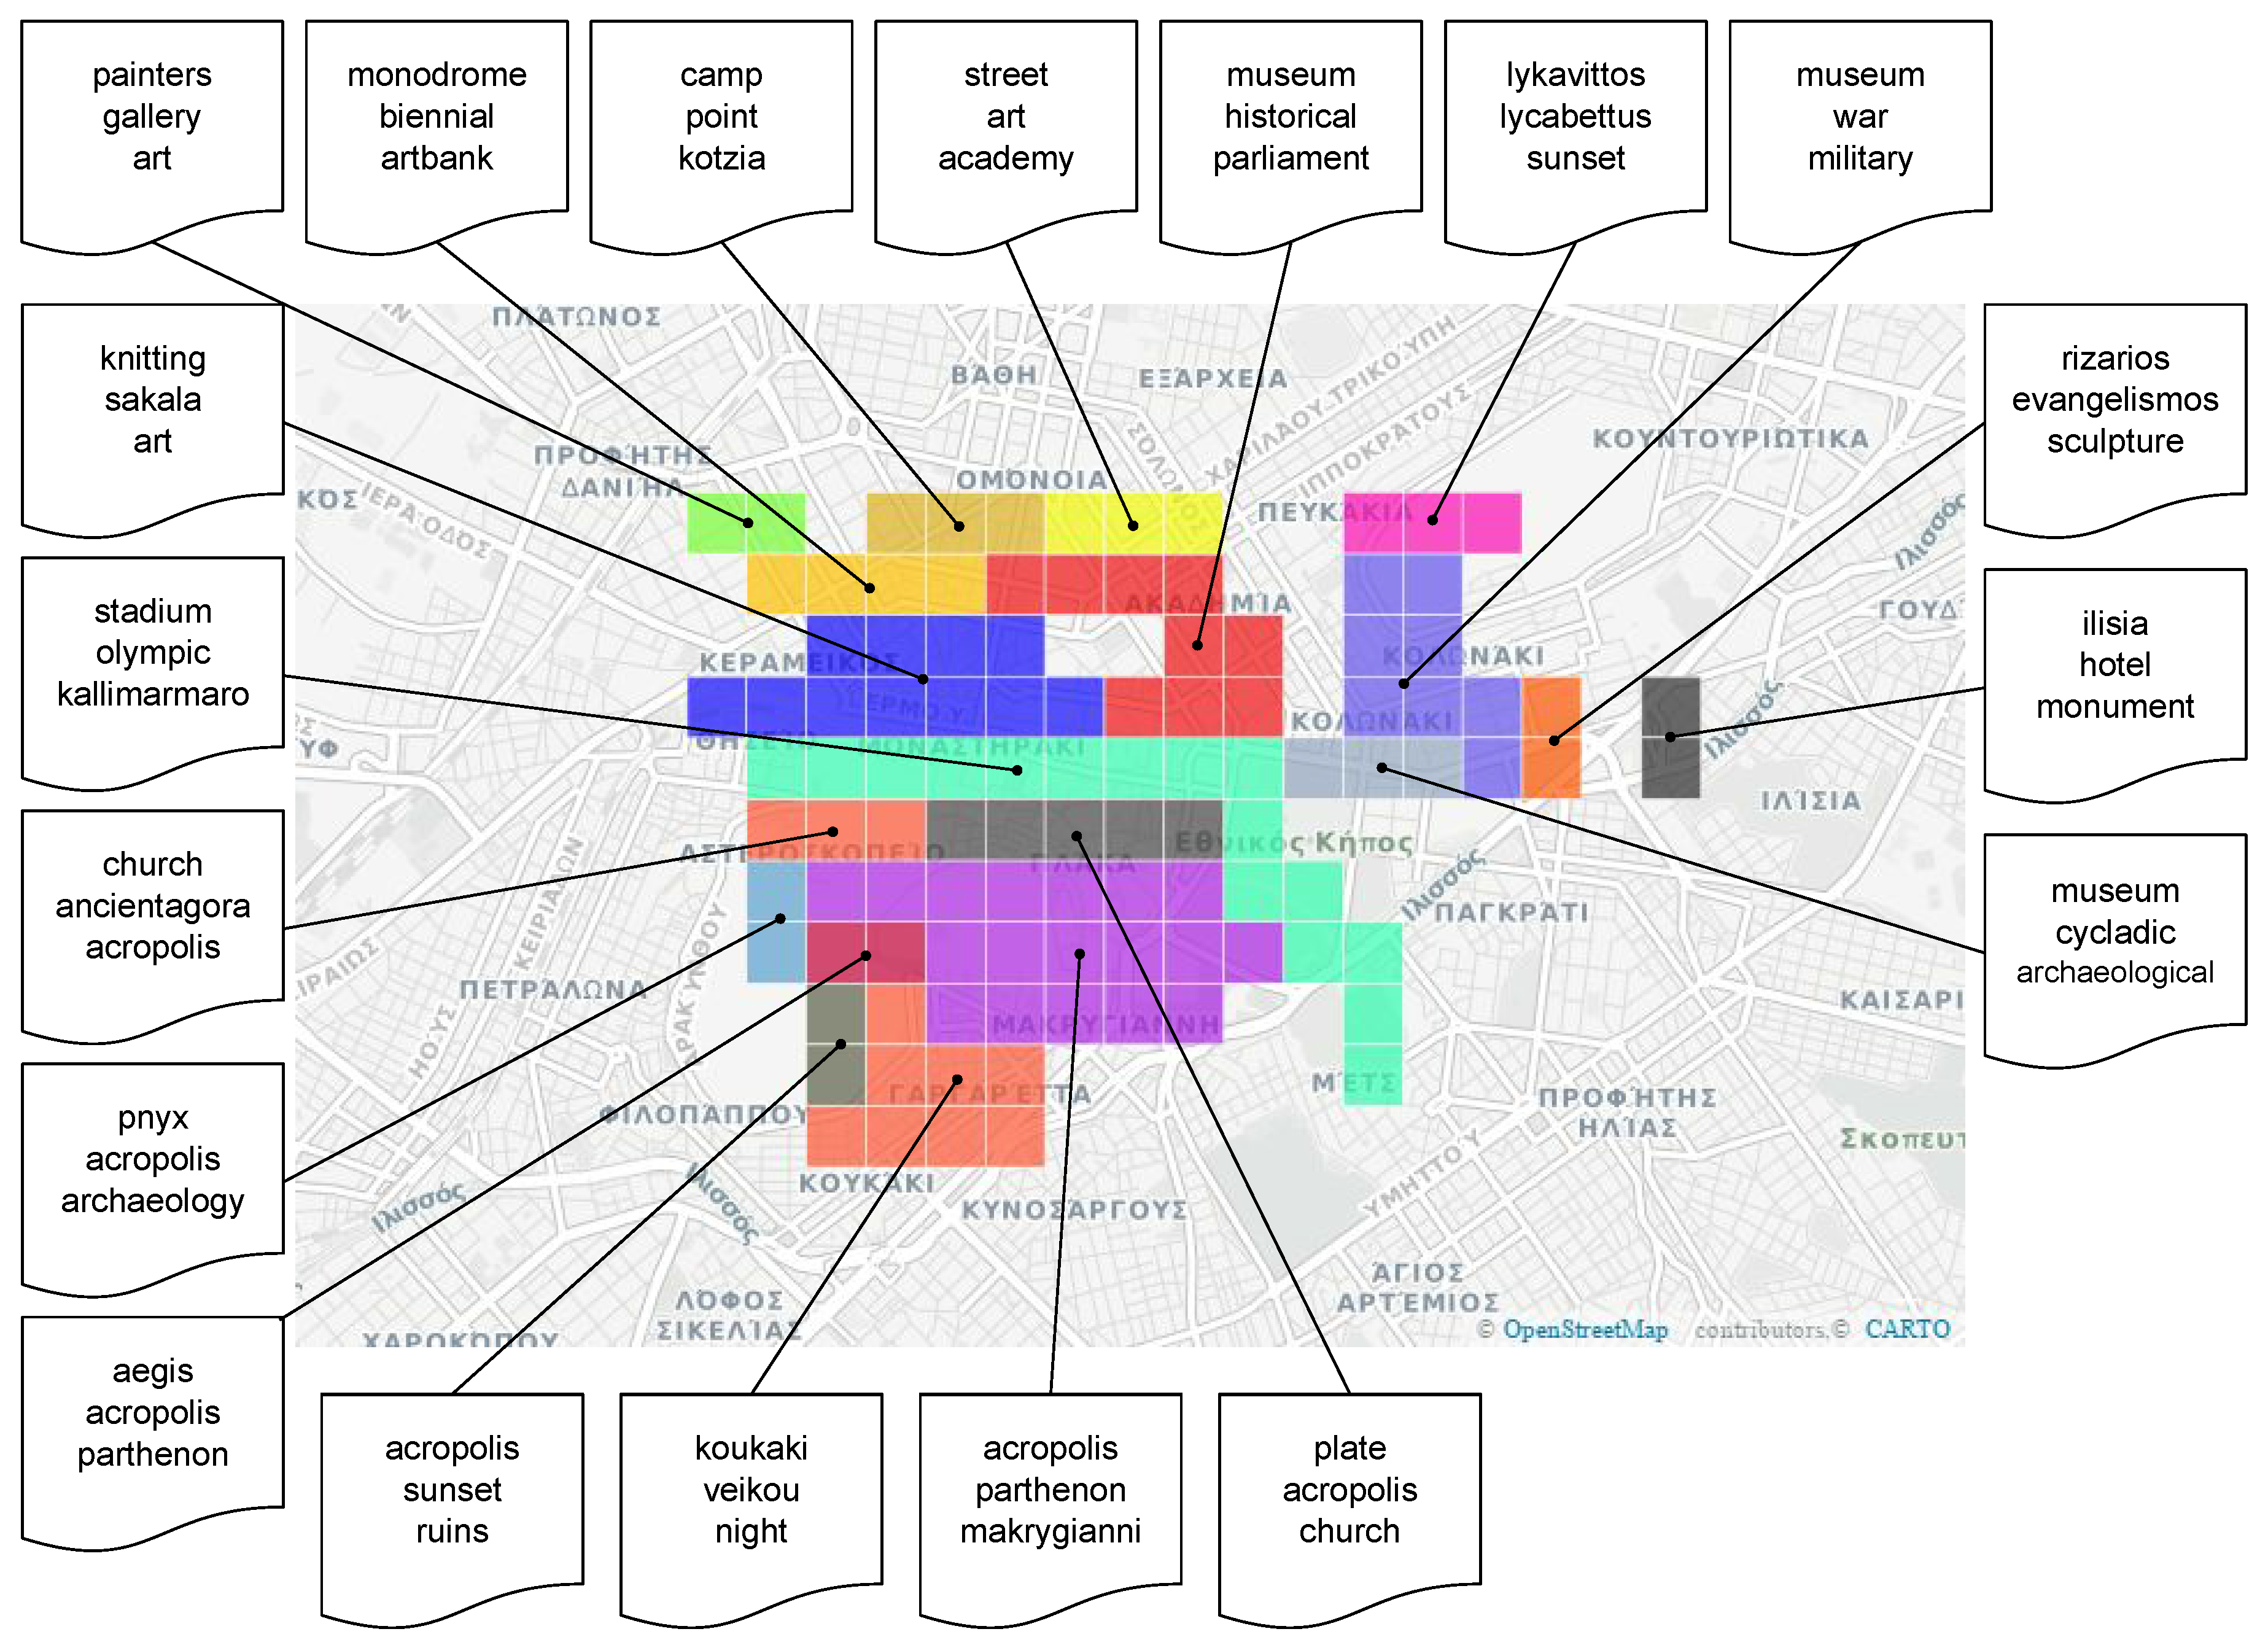
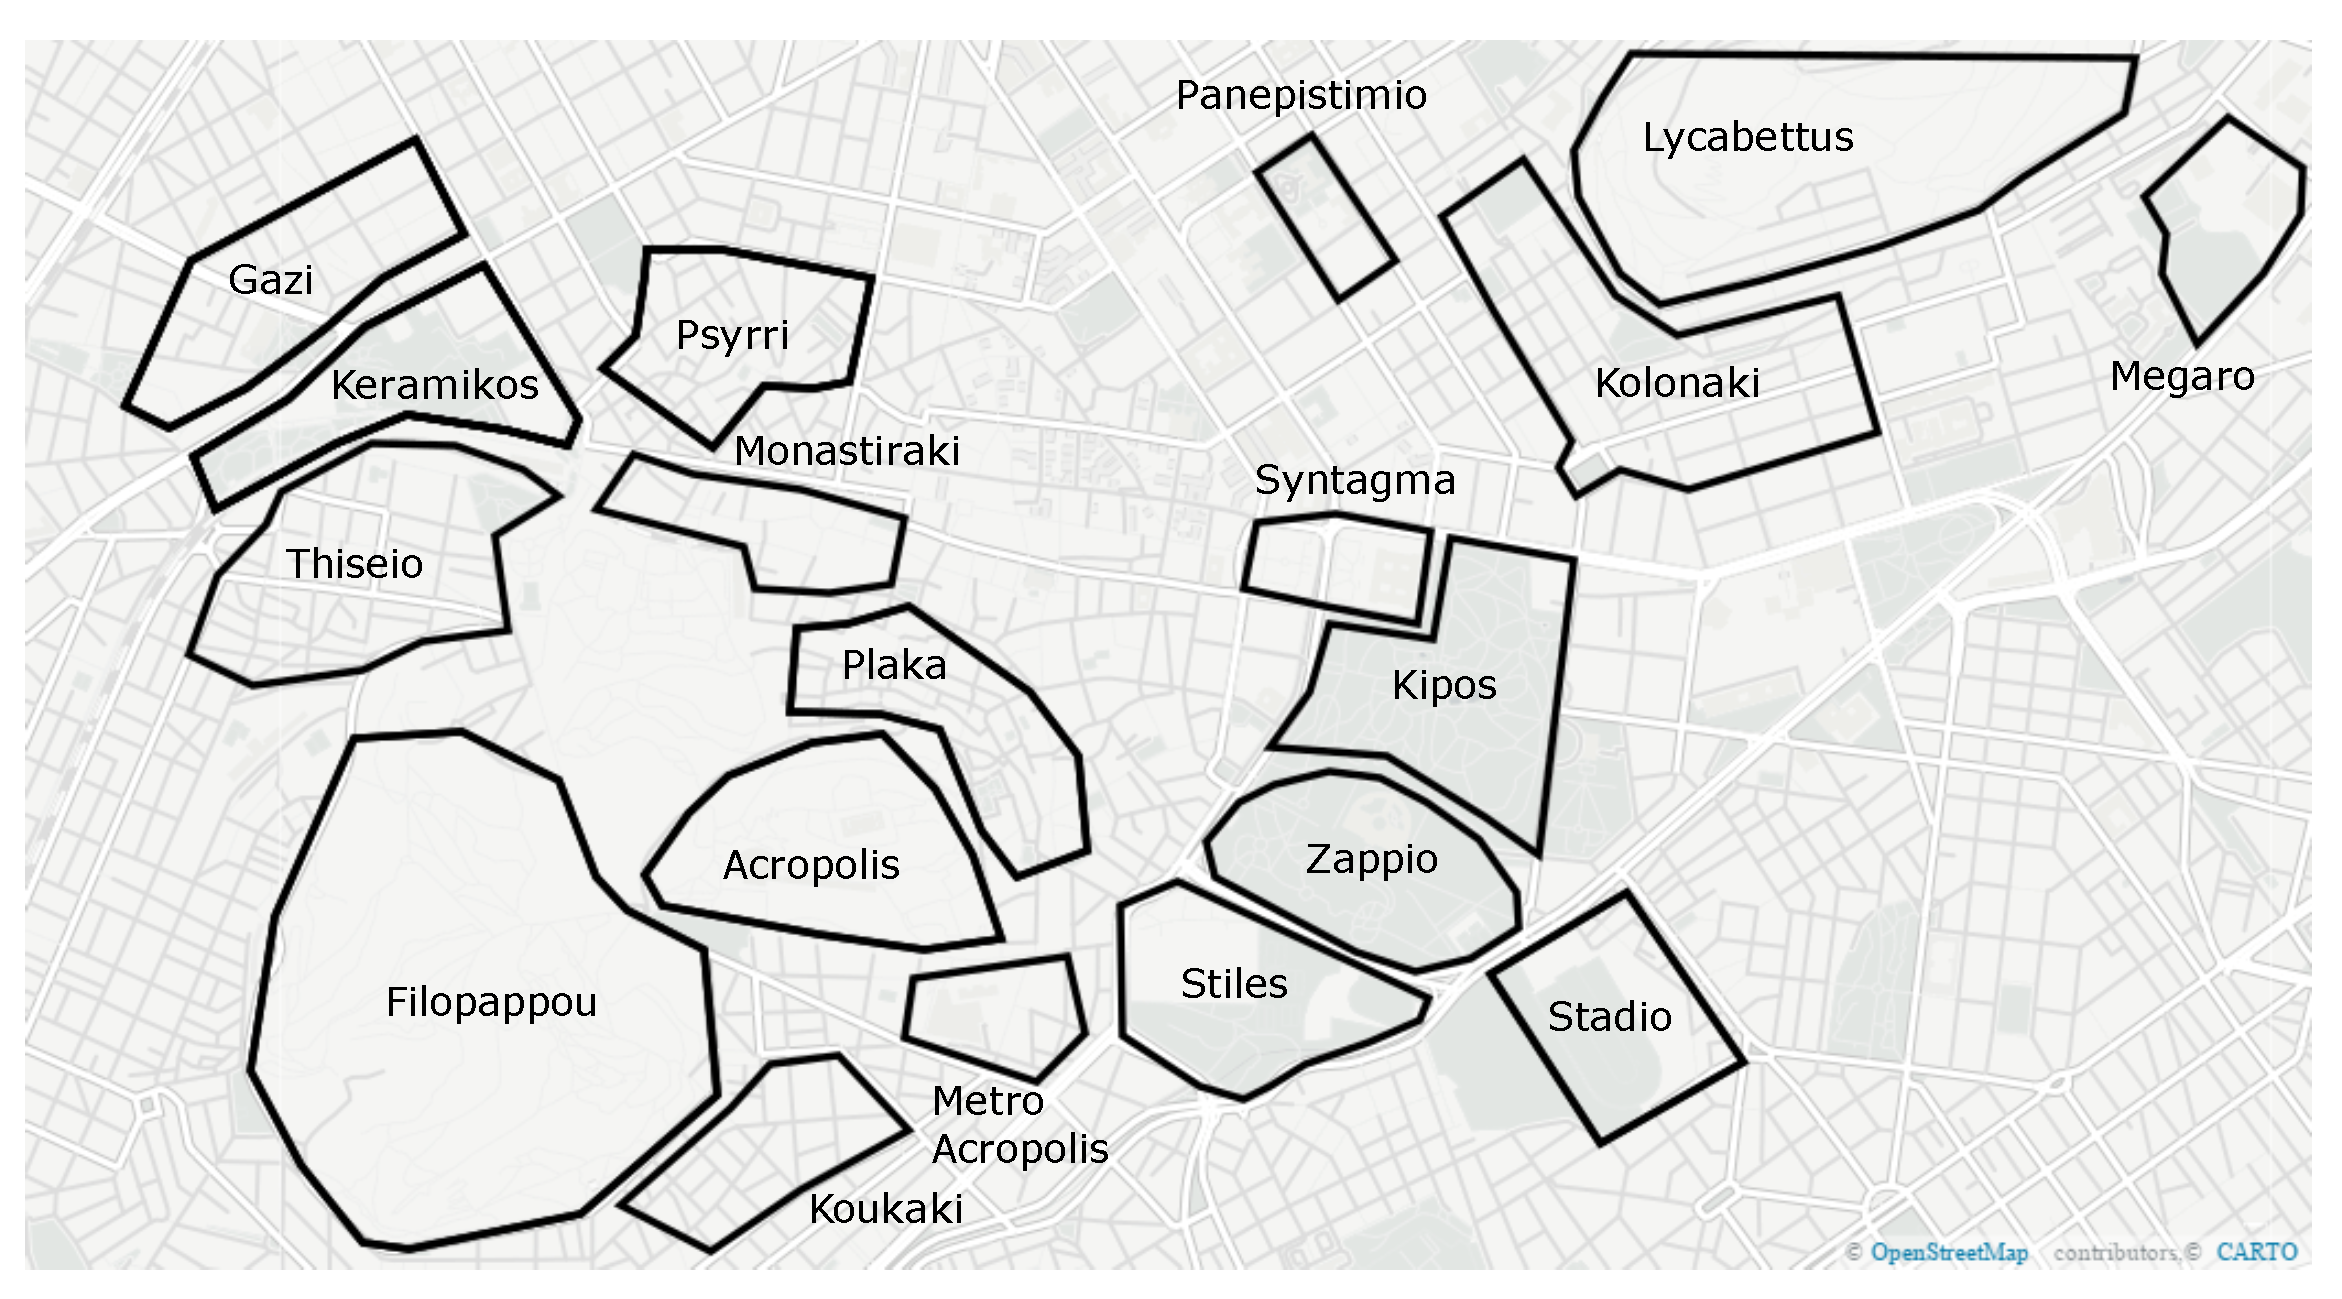
4.2.2. Qualitative Results

For a qualitative evaluation of the proposed algorithm we chose to focus on user satisfaction. Since the goal is to extract vernacular AOIs, without any prior knowledge, we feel that an appropriate way of evaluation is to assess local residents’ satisfaction. We should emphasize that in general, evaluation of tasks aiming at users’ satisfaction is known to be a difficult and expensive task, which may involve empirical issues in the process [44]. Having said that, for the sake of evaluating our algorithm, we have conducted a user-centered evaluation by involving 45 real-life users from three (3) academic institutions. More specifically, we involved 25 students from the Technological Educational Institute of Central Greece, Lamia, Greece, 10 students from the Ionian University, Corfu, Greece and 10 students from the National Technical University of Athens, Athens, Greece. These users were to a great extend familiar to Athens city center (all 45 of them are current local residents or Athens is their hometown, even though they currently reside in another city for studies).
From the set of performed experiments, we empirically selected cases where the algorithm produces geo-clusters which are intuitively “close” to those that consist the user-generated ground truth, which are summarized in Figure 4. This ground truth, illustrated in Figure 5 was empirically and collaboratively created by 10 of the aforementioned users, which did not participate in the actual evaluation. Thus, 35 users were shown the actual results of the algorithm, i.e., the extracted regions and were asked to empirically assess if they overlapped with a substantial amount of regions that are considered to be highly popular to tourists, depending on their personal satisfaction. Moreover, we asked all 45 participants to answer whether what they consider as name of the region was amongst the extracted tags for each, in order to assess the effectiveness of the tag-extraction method that we have presented in Section 3.2. More specifically, these two questions were asked as:
Q1.
Are you satisfied with the produced vernacular regions? (1: Very dissatisfied; 2: Somewhat dissatisfied; 3: Neither satisfied nor dissatisfied; 4: Somewhat satisfied; 5: Very satisfied)
Q2.
Is the name of the produced vernacular regions included within the top-3 extracted tags? (Yes/No)
As we may observe, Q1 is a Likert-type question [45]. Since we feel that users may not be divided into groups of age, since all of them are between 19–24 years old and a male-female split is not valid for the problem at hand, we opt not to perform any non-parametric test. Instead, we present some basic statistics to show central tendency (median and mode) and variability (inter-quartile ranges) [46] for each of the clustering that have been presented in Figure 4. Results are depicted in Table 3. Moreover, we illustrate bar charts for each clustering result in Figure 6, while results for Q2 are summarized in Table 4.
From all results, it is clear that users strongly preferred regions that resulted upon tile size W R = 200 m. Descriptive statistics of user evaluations, empirical observations on bar charts and also on the produced regions that were shown to the users vs. the ground truth, indicate that best results according to the users’ opinion were those of Figure 4h,i. Also, we could argue that among the three aforementioned heuristics that we applied in order to select the top tags, the occurrences of the tag within the given region denoted by (T) was the one that users favoured. Upon careful observation on the evaluation results and brief interviews with the users, we feel that generally the proposed approach succeeds to satisfy its goals both towards the extraction of vernacular regions and their underlying semantics.
Furthermore, in Figure 7 and Figure 8 we present two cases of the tags contained into each tile of two geo-clusters. The first corresponds to an area known as “Filopappou hill”, (https://en.wikipedia.org/wiki/Philopappos_Monument) which offers views of a large part of Athens and Attica in general, some ancient monuments (ruins) and provides excellent view to the Acropolis, preferred by tourists for taking photos. The latter, known as “Koukaki” (https://en.wikipedia.org/wiki/Koukaki) is a rather popular neighborhood mainly due to its proximity to the Acropolis, its excellent connection to all means of transportation along with its bars and restaurants. Moreover, in Figure 9 we illustrate the tag clouds that describe in total each of the aforementioned geo-clusters. It is clear that the most important tags (i.e., those depicted in red and in larger fonts) are rather useful for describing each area. Finally, in Figure 10 we illustrate the top-3 tags resulting upon the application of TF-IDF to the clustering depicted in Figure 4i. A reader which is familiar to the city of Athens, may easily perceive the usefulness of these tags both to describe the semantics of an area and to discover its name. The aforementioned qualitative evaluation was similarly performed.

5. Discussion and Conclusions

5.1. Discussion

In this paper we presented a novel geo-clustering algorithm which aims to solve the problem of AOI extraction of touristic interest from an urban area. Our approach works “in-the-wild”, i.e., it does not rely on any prior knowledge. Instead it is based on geo-tagged metadata. More specifically, the only available knowledge to be exploited was a set of geo-tagged photos collected from a well-known social photo sharing network, namely Flickr, along with their accompanying textual metadata. These photos had been taken mainly from tourists visiting the city of Athens, Greece. We demonstrated that the proposed algorithm is able to extract meaningful vernacular regions based on a user qualitative evaluation study. Also, it is able to successfully extract the underlying semantics of each vernacular region, upon processing the set of user-generated tags. Quantitative evaluation focusing on the quality of the extracted AOIs further confirmed the potential of the proposed approach.
However, the experimental results, though they are satisfactory, they are still far from being optimal, indicating the difficulty of the problem at hand, i.e., the extraction of vernacular regions in-the-wild. First of all, it is the nature of the problem that constitutes it as a challenging one. Since vernacular regions exist only in the perception, feelings and attitudes of their residents they form an expression of naïve geography. Thus, there does not exist any dataset which may constitute an appropriate ground truth, i.e., one without any ambiguity. Moreover, when the goal of research is to extract these regions in-the-wild, since no additional knowledge may be used, the only valid approach is to work with socially-generated geo-tagged metadata. This, however, becomes contradictory with the aforementioned definition of vernacular regions, since e.g., checkins or geo-tagged photos in the context of typical social networks and within areas of touristic interest originate by both tourists/visitors and local residents, while it is not feasible to separate them, accordingly. This means that the extracted social knowledge heavily includes the perception of non-residents, which of course may be significantly different in certain cases than the one of local residents, thus evaluation may encounter various difficulties and overall the problem is not well-posed.

5.2. Conclusions and Future Work

Concluding, we feel that this work leaves many open research issues towards improvements of the overall results, therefore we attempt to present those that we consider the most important. First of all, the tile size has been selected upon a combination of a heuristic approach and a trial-and-error process. Further research may focus towards the selection of optimal tile size for any given city. The algorithm’s robustness for the extraction of the top-k representative tags may further be investigated. Moreover, since this paper exploited the city of Athens as its use case, the proposed methodology should be investigated to additional cities with varying geospatial, cultural and economic characteristics. Also, the temporal dynamics and variations of tags should be investigated and more specifically assess how they affect the creation of a geo-cluster at various time intervals, periods or even seasons. Other remaining issues are the detection of popular POI categories within an AOI (i.e., geo-cluster feature extraction), the creation of personalized recommendations in accordance with a users’ previous travel history and her/his personal characteristics (e.g., age and/or gender) and the exploitation of location-based checkins by aggregating several social networks. Finally, as far as user evaluation is concerned, a more thorough one with a significantly larger and heterogeneous population could be able to reveal preferences of specific user groups and/or general tendencies within the city under investigation.

Author Contributions

E.S. and P.M. conceived the initial idea. E.S. and M.K. designed the experiments; E.S., M.K. and P.M. wrote the paper. V.C. and A.P. collected the data. V.C., A.P. and M.K. analyzed the data and performed the experiments.

Conflicts of Interest

The authors declare no conflict of interest.

Abbreviations

The following abbreviations are used in this manuscript:
AOIArea of Interest
APIApplication Programming Interface
GPSGlobal Positioning System
POIPlace of Interest
TF-IDFTerm Frequency—Inverse Document Frequency

References

  1. Lenhart, A. Teens, Social Media & Technology Overview 2015. Available online: http://www.pewinternet.org/2015/04/09/teens-social-media-technology-2015/ (accessed on 16 November 2016).
  2. Duggan, M. Photo and Video Sharing Grow Online. Available online: http://www.pewinternet.org/2013/10/28/photo-and-video-sharing-grow-online/ (accessed on 16 November 2016).
  3. Angus, E.; Thelwall, M. Motivations for image publishing and tagging on Flickr. In Proceedings of the International Conference on Electronic Publishing, Helsinki, Finland, 16–18 June 2010.
  4. Arase, Y.; Xie, X.; Hara, T.; Nishio, S. Mining people’s trips from large scale geo-tagged photos. In Proceedings of the ACM International Conference on Multimedia (MM), Firenze, Italy, 25–29 October 2010.
  5. Girardin, F.; Calabrese, F.; Dal Fiore, F.; Ratti, C.; Blat, J. Digital footprinting: Uncovering tourists with user-generated content. IEEE Pervasive Comput. 2008, 7, 36–43. [Google Scholar] [CrossRef]
  6. Waters, T.; Evans, A. Tools for web-based GIS mapping of a “fuzzy vernacular” geography. In Proceedings of the International Conference on GeoComputation, Southampton, UK, 8–10 September 2003.
  7. Montello, D.R. Regions in geography: Process and content. In Foundations of Geographic Information Science; CRC Press: Boca Raton, FL, USA, 2003; pp. 173–189. [Google Scholar]
  8. Egenhofer, M.J.; Mark, D.M. Naïve geography. In Proceedings of the International Conference on Spatial Information Theory, Ellicottville, NY, USA, 14–18 September 1995.
  9. Hu, Y.; Gao, S.; Janowicz, K.; Yu, B.; Li, W.; Prasad, S. Extracting and understanding urban areas of interest using geotagged photos. Comput. Environ. Urban Syst. 2015, 54, 240–254. [Google Scholar] [CrossRef]
  10. Jones, C.B.; Purves, R.S.; Clough, P.D.; Joho, H. Modelling vague places with knowledge from the Web. Int. J. Geogr. Inf. Sci. 2008, 22, 1045–1065. [Google Scholar] [CrossRef] [Green Version]
  11. Chen, L.; Roy, A. Event detection from flickr data through wavelet-based spatial analysis. In Proceedings of the ACM Conference on Information and Knowledge Management (CIKM), Hong Kong, China, 2–6 November 2009.
  12. Van Canneyt, S.; Schockaert, S.; Van Laere, O.; Bart Dhoedt, B. Time-dependent recommendation of tourist attractions using Flickr. In Proceedings of the 23rd Benelux Conference on Artificial Intelligence (BNAIC), Ghent, Belgium, 3–4 November 2011.
  13. Kisilevich, S.; Keim, D.; Andrienko, N.; Andrienko, G. Towards Acquisition of Semantics of Places and Events by Multi-perspective Analysis of Geotagged Photo Collections. In Geospatial Visualisation; Springer: Berlin, Germany, 2013; pp. 211–233. [Google Scholar]
  14. Cao, L.; Luo, J.; Gallagher, A.; Jin, X.; Han, J.; Huang, T.S. A worldwide tourism recommendation system based on geotagged web photos. In Proceedings of the IEEE International Conference on Acoustics, Speech and Signal Processing (ICASSP), Dallas, TX, USA, 15–19 March 2010.
  15. Serdyukov, P.; Murdock, V.; Van Zwol, R. Placing flickr photos on a map. In Proceedings of the 32nd International ACM SIGIR Conference on Research and Development in Information Retrieval, Boston, MA, USA, 19–23 July 2009.
  16. Twaroch, F.A.; Jones, C.B.; Abdelmoty, A.I. Acquisition of vernacular place names from web sources. In Weaving Services and People on the World Wide Web; Springer: Berlin/Heidelberg, Germany, 2009; pp. 195–214. [Google Scholar]
  17. Grothe, C.; Schaab, J. Automated footprint generation from geotags with kernel density estimation and support vector machines. Spat. Cogn. Comput. 2009, 9, 195–211. [Google Scholar] [CrossRef]
  18. Liu, J.; Huang, Z.; Chen, L.; Shen, H.T.; Yan, Z. Discovering areas of interest with geo-tagged images and check-ins. In Proceedings of the ACM International Conference on Multimedia (MM), Nara, Japan, 29 October–2 November 2012.
  19. Keßler, C.; Maue, P.; Heuer, J.T.; Bartoschek, T. Bottom-up gazetteers: Learning from the implicit semantics of geotags. In Proceedings of the International Conference on GeoSpatial Semantics, Mexico City, Mexico, 3–4 December 2009.
  20. Sharifzadeh, M.; Shahabi, C.; Knoblock, C.A. Learning approximate thematic maps from labeled geospatial data. In Next Generation Geospatial Information: From Digital Image Analysis to Spatiotemporal Databases; Taylor & Francis Group: London, UK, 2005; Volume 3, p. 129. [Google Scholar]
  21. Spielman, S.E.; Thill, J.C. Social area analysis, data mining, and GIS. Comput. Environ. Urban Syst. 2008, 32, 110–122. [Google Scholar] [CrossRef]
  22. Kohonen, T.; Somervuo, P. Self-organizing maps of symbol strings. Neurocomputing 1998, 21, 19–30. [Google Scholar] [CrossRef]
  23. Noulas, A.; Scellato, S.; Mascolo, C.; Pontil, M. Exploiting Semantic Annotations for Clustering Geographic Areas and Users in Location-based Social Networks. In Proceedings of the 2011 ICWSM Workshop, Social Mobile Web, Barcelona, Catalonia, Spain, 21 July 2011; Volume 11.
  24. Hollenstein, L.; Purves, R. Exploring place through user-generated content: Using Flickr tags to describe city cores. J. Spat. Inf. Sci. 2010, 21–48. [Google Scholar]
  25. Duckham, M.; Kulik, L.; Worboys, M.; Galton, A. Efficient generation of simple polygons for characterizing the shape of a set of points in the plane. Pattern Recognit. 2008, 41, 3224–3236. [Google Scholar] [CrossRef]
  26. Zhang, A.X.; Noulas, A.; Scellato, S.; Mascolo, C. Hoodsquare: Modeling and recommending neighborhoods in location-based social networks. In Proceedings of the International Conference on Social Computing (SocialCom), IEEE, Washington, DC, USA, 8–14 September 2013.
  27. Cranshaw, J.; Schwartz, R.; Hong, J.I.; Sadeh, N. The livehoods project: Utilizing social media to understand the dynamics of a city. In Proceedings of the International AAAI Conference on Weblogs and Social Media, Dublin, Ireland, 4–7 June 2012.
  28. Aadland, M.; Farah, C.; Magee, K. μ-shapes: Delineating Urban Neighborhoods using Volunteered Geographic Information. J. Spat. Inf. Sci. 2009. [Google Scholar] [CrossRef]
  29. Rattenbury, T.; Naaman, M. Methods for extracting place semantics from Flickr tags. In Proceedings of the ACM Transactions on the Web (TWEB); ACM: New York, NY, USA, 2009; Volume 3. [Google Scholar]
  30. Deng, D.P.; Chuang, T.R.; Lemmens, R. Conceptualization of place via spatial clustering and co-occurrence analysis. In Proceedings of the International Workshop on Location Based Social Networks, Seattle, WA, USA, 4–6 November 2009.
  31. Firan, C.S.; Georgescu, M.; Nejdl, W.; Paiu, R. Bringing order to your photos: event-driven classification of flickr images based on social knowledge. In Proceedings of the ACM International Conference on Information and Knowledge Management (CIKM), Toronto, ON, Canada, 26–30 October 2010.
  32. Baba, Y.; Ishikawa, F.; Honiden, S. Extracting Time and Location Concepts Related to Tags; Incentives for the Semantic Web (INSEMTIVE): Karlsruhe, Germany, 2008. [Google Scholar]
  33. Ahern, S.; Naaman, M.; Nair, R.; Yang, J.H.-I. World explorer: Visualizing aggregate data from unstructured text in geo-referenced collections. In Proceedings of the 7th ACM/IEEE-CS joint Conference on Digital libraries (JCDL), Vancouver, BC, Canada, 18–23 June 2007.
  34. Chaudhry, O.; Mackaness, W. Automated extraction and geographical structuring of Flickr tags. In Proceedings of the 4th International Conference on Advanced Geographic Information Systems, Applications, and Services (GEOProcessing), Valencia, Spain, 30 January–4 February 2012.
  35. Spyrou, E.; Psallas, A.; Charalampidis, V.; Mylonas, P. Discovering Areas of Interest using a Semantic Geo-Clustering Approach. In Proceedings of the Mining Humanistic Data Workshop (MHDW), located at the International Conference on Artificial Intelligence Applications and Innovations (AIAI), Thessaloniki, Greece, 16–18 September 2016.
  36. Spyrou, E.; Mylonas, Ph. Analyzing Flickr metadata to extract location-based information and semantically organize its photo content. Neurocomputing 2016, 172, 114–133. [Google Scholar] [CrossRef]
  37. Quack, T.; Leibe, B.; Van Gool, L. World-scale mining of objects and events from community photo collections. In Proceedings of the International Conference on Content-based Image and Video Retrieval (CIVR), Niagara Falls, ON, Canada, 7–9 July 2008.
  38. Duda, R.O.; Hart, P.E.; Stork, D.G. Pattern Classification, 2nd ed.; Wiley: Hoboken, NJ, USA, 2001. [Google Scholar]
  39. Dubinko, M.; Kumar, R.; Magnani, J.; Novak, J.; Raghavan, P.; Tomkins, A. Visualizing tags over time. In Proceedings of the 15th International Conference on World Wide Web (WWW), Edinburgh, Scotland, UK, 22–26 May 2006.
  40. Jaffe, A.; Naaman, M.; Tassa, T.; Davis, M. Generating summaries and visualization for large collections of geo-referenced photographs. In Proceedings of the the ACM International Workshop on Multimedia Information Retrieval (MIR), Santa Barbara, CA, USA, 26–27 October 2006.
  41. Kennedy, L.; Naaman, M.; Ahern, S.; Nair, R.; Rattenbury, T. How flickr helps us make sense of the world: context and content in community-contributed media collections. In Proceedings of the International Conference on Multimedia (MM), Augsburg, Germany, 23–28 September 2007.
  42. Mackaness, W.A.; Chaudhry, O. Assessing the veracity of methods for extracting place semantics from flickr tags. Trans. GIS 2013, 17, 544–562. [Google Scholar] [CrossRef] [Green Version]
  43. Sun, A.; Bhowmick, S.S. Image tag clarity: in search of visual-representative tags for social images. In Proceedings of the SIGMM Workshop on Social Media, Beijing, China, 19–24 October 2009.
  44. Liu, Y.; Bian, J.; Agichtein, E. Predicting information seeker satisfaction in community question answering. In Proceedings of the International ACM SIGIR Conference on Research and Development in Information Retrieval, Singapore, 20–24 July 2008.
  45. Likert, R. A Technique for the Measurement of Attitudes; Archives of Psychology; The Science Press: New York, NY, USA, 1932. [Google Scholar]
  46. Bertram, D. Likert Scales… Are the Meaning of Life. Available online: http://www.academia.edu/8160815/Likert_Scales_are_the_meaning_of_life (accessed on 16 March 2017).
Figure 1. A visual overview of the proposed approach.
Algorithms 10 00035 g001
Figure 2. Merging process of tiles: For a given tile (a), at a given step, one of its neighbors is considered as a candidate for merging (b). Their similarity is above the given threshold S, thus they are merged (c). At another step, one neighbor of the new tile is considered as a candidate for merging (d). Their similarity is above S, thus, they are merged (e).
Algorithms 10 00035 g002
Figure 3. Density-based visualizations regarding the distribution of geo-tagged photos (a) and POIs (b) in the broader region of Attica and the centre of Athens.
Algorithms 10 00035 g003
Figure 4. Geo-clusters produced within the selected urban area, i.e., the center of the city of Athens for several parameters of the proposed algorithm. Each geo-cluster has been randomly colored. Initial tile boundaries are overlaid. Tiles colored with white did not initially contain any photo, thus were excluded from the algorithm.
Algorithms 10 00035 g004
Figure 5. Empirically and collaboratively constructed ground truth of vernacular regions within the center of the city of Athens.
Algorithms 10 00035 g005
Figure 6. Bar charts for users’ answers on Q1, for the sets of regions that are illustrated in Figure 4.
Algorithms 10 00035 g006
Figure 7. Tag clouds extracted from merged tiles that correspond to the extracted area that has been characterized as Filopappou. Top-10 (most important) tags have been colored in shades of green, while less important ones in shades of red. The font size is proportional to tag frequency.
Algorithms 10 00035 g007
Figure 8. Tag clouds extracted from merged tiles that correspond to the extracted area that may has been characterized as Koukaki. Top-10 (most important) tags have been colored in shades of green, while less important ones in shades of red. The font size is proportional to tag frequency.
Algorithms 10 00035 g008
Figure 9. Tag clouds extracted from the vernacular regions of: (a) Filoppapou (see Figure 7) and (b) Koukaki (see Figure 8). To facilitate readability, only top-50 tags are displayed (top-10 in shades of green, remaining in shades of red). The font size is proportional to tag frequency.
Algorithms 10 00035 g009
Figure 10. Top-3 tags per geo-cluster resulting upon the application of the TF-IDF scheme described in Section 3.2, on the set of geo-clusters produced for W R = 200 m, S = 0 . 85 , L = 5 , (T).
Algorithms 10 00035 g010
Table 1. Symbols used throughout this paper and their description.
SymbolDefinition
RThe whole area which is given as input to the proposed algorithm
PThe set of photos that have been geo-tagged within R
i , j The i-th row and the j-th column of the square grid
R i , j A square tile upon the initial division of R
W R The size of each tile R i , j
P i , j The set of photos that have been geo-tagged within P i , j
T i , j The set of tags harvested from P i , j
N i , j The set of neighboring tiles of tile R i , j
R i , j pos A neighbor of R i , j . pos { up , down , left , right } denotes its position.
D i , j Semantic representation of tile R i , j
D i , j L Semantic representation of tile R i , j , using the L most popular tags
J ( A , B ) Jaccard distance between sets A and B
SSimilarity threshold for two sets to be merged
tf t , d The frequency of a specific word t within a document d
idf t The overall number of documents in a collection that contain word t
C p Set of geo-clusters resulted upon a run with p parameter set
C i , p The i-th geo-cluster of C p
P i , p Set of photos within the i-th geo-cluster of C p
T i , p Set of tags within the photos in i-th geo-cluster of C p
T ^ i , p Ranked set of tags within the photos in i-th geo-cluster of C p
T P Set of tags within P
t i , p A tag within T i , p
t P A tag within T P
Table 2. Quantitative Experimental Results assessing the quality of produced geo-clusters.
W R = 50 m W R = 100 m W R = 200 m
0.85/5
(T)
0.85/10
(T)
0.9/10
(T)
0.85/5
(T)
0.85/5
(U)
0.85/5
(TU)
0.9/10
(T)
0.9/20
(T)
0.85/5
(T)
0.85/5
(U)
0.85/5
(TU)
0.85/10
(T)
AVpGC70.1892.40255.05170.79210.57156.99661.4623.07538.89785.75387.61506.05
APpGC299.10374.221277.79922.451071.79606.954069.133801.53767.795422.671872.543065.5
ATpGC3.162.793.464.143.572.704.63.145.585.832.854.36
AGCS0.00790.00700.03460.04140.03570.02700.18400.12570.22320.23330.11390.1745
APOIpGC0.891.013.283.193.022.0813.879.6414.1618.927.4511.27
Table 3. Extracted statistics from users’ responses in Q1 of the qualitative user evaluation, for the results depicted in Figure 2. q i denotes the i-th inter-quartile range.
W R = 50 m W R = 100 m W R = 200 m
0.85/5
(T)
0.85/10
(T)
0.9/10
(T)
0.85/5
(T)
0.85/5
(U)
0.85/5
(TU)
0.9/10
(T)
0.9/20
(T)
0.85/5
(T)
0.85/5
(U)
0.85/5
(TU)
0.85/10
(T)
median324333445444
mode434333455444
q1323333344443
q2324333445444
q3434444455554
q4445555555555
Table 4. The percentage of users which felt that the name of the vernacular regions was successfully included within the top-3 extracted tags for the results depicted in Figure 4.
W R = 50 m W R = 100 m W R = 200 m
0.85/5
(T)
0.85/10
(T)
0.9/10
(T)
0.85/5
(T)
0.85/5
(U)
0.85/5
(TU)
0.9/10
(T)
0.9/20
(T)
0.85/5
(T)
0.85/5
(U)
0.85/5
(TU)
0.85/10
(T)
name
(%)
0.180.180.270.310.330.310.400.490.870.780.820.53

