1. Introduction
Suburban open spaces serve various purposes including as precious habitats for biodiversity in otherwise sterile urban environments [
1], and also as recreational activity areas for nearby urban residents who often lead stressful lives. Consequently, large numbers of people visit these spaces for a variety of purposes throughout the year [
2]. These diverse purposes and usages are arguably one of the specific characteristics of the suburban and urban open spaces [
3]. The trend indicates that demands for such open spaces in the neighborhood are increasing as people become more demanding for a natural experience when seeking refuge from urbanization.
The number of visitors is basic data used to manage parks and open spaces. The data of visitors serves as a basis for considering the management plans for operation, budget, facilities, and maintenance. Furthermore, it can be used as an indicator to identify the appropriate level of use by considering the ecological and social impacts from overuse or it can be objective data to evaluate social, economic, and political effectiveness [
4,
5]. By measuring and estimating visitors’ numbers and their use, it is possible to capture the current conditions and trends. In addition, such data are instrumental in forming current and future management strategies to maintain and enhance the quality of visitors’ experience, enhancing the satisfaction through proper management. Keeping a balance of conservation and usage is the key, leaving precious open spaces for future generations.
In recent years, user questionnaires and surveys have been conducted in most urban and public facilities. The data have been useful for management, operations, and construction of those facilities. For most national parks and national forests in Northern America and Europe, estimation of visitors’ numbers is applied and implemented in a systematic way [
6,
7]. However, there is a lack of scientific and foundational surveys in Japan [
8]. Research on the number of visitors to parks is under progress and there are attempts to measure and estimate the number of visitors. In a survey of the number of climbers in mountainous areas, investigations using infrared counter instruments were conducted and registers of numbers entering forests were analyzed, and an estimation to compare these results was attempted [
9,
10]. Aoki (1984) described the number of visitors per day for one year using the data of six paid parks in Tokyo [
8]. Most surveys are conducted in parks with fees in cities and/or natural parks located away from cities.
Prediction models have been developed in several recreation sites. Aoki (1984) indicated the effects of season, weather and day of the week in six paid gardens in a Tokyo metropolitan area [
8]. Dwyer (1988) showed the effects of season, day of the week and weather on visits to an urban forest in the Chicago area [
11]. Hadwen
et al. (2011) showed the effect of school holidays on the number of visitors along with climatic variables in some Australian protected areas [
12]. Ploner and Brandenburg (2003) used regression trees to analyze the effects of day of the week and weather on visitations in an Austrian national park [
13]. They compiled different factors affecting the various activities in the forest. However, it cannot be said that weather conditions are considered with seasonal and regional differences.
There is an increasing interest in nature-based tourism in snowy cold areas such as in northern Europe [
14]. Knowledge about the visiting patterns in winter is limited to a few studies [
15,
16]. It is easily understood that it is not proper to treat equally seasons with snow cover and seasons without it. The reason for this is that people in snowy cold areas react to snow differently than people in snow-free areas. For example, those in snowy cold areas enjoy typical winter activities such as skiing and ski walking. Thus factors determining visits to parks and/or their effects are different in seasons with snow cover and seasons without it.
The use patterns of visitors in an open space vary depending on its setting and climate. Hadwen
et al. (2011) showed the effect of climatic factors on seasonal patterns of visitors to protected areas [
12]. Arnberger (2006) pointed out the difference of temporal patterns of visitors between peri-urban and inner-urban forests [
17]. If there is some distance between the visitor’s destination and his or her departure site, it is likely that weather conditions at each site are not always similar. Because the weather and the weather forecast are reported by the unit of one city, it is difficult for suburban forest visitors to know the slight differences of the weather and the forecasts at destination sites. We assumed that decisions and behaviors of visitors to suburban forests might be different from those of visitors to urban parks due to the remoteness and the difference of weather. In this study, we examined the integrated effects of meteorological and social variables on the fluctuation of the number of visitors in a suburban park in a snowy cold region. Moreover, the weather conditions and weather forecast around the visitor’s dwelling areas were estimated to be influential factors in the discussion.
2. Methods
2.1. Research Site
The site used for research on the fluctuation of the number of visitors was Takino Suzuran Hillside National Government Park (hereinafter referred to as Takino Park). The park is located in a suburban area on the hill in Takino District, Minami Ward, Sapporo city, Japan. It is in a non-urbanized area around 18 km south of the central part of Sapporo, taking 40 minutes by car. Some parts of the area are abandoned farmland. The afforested area and grassland are surrounded by natural forests. Apart from Sapporo city, main cities in Central Hokkaido such as Otaru city, Ishikari city, Ebetsu city, Iwamizawa city, Kitahiroshima city, Eniwa city, Chitose city and Tomakomai city are located within a 50 kilometer radius of Takino Park. According to a utilization study based on a visitors survey in 2002, 82.9% of visitors were residents of Sapporo city, 11.4% from six cities near Sapporo city (
i.e., Ishikari, Ebetsu, Kitahiroshima, Eniwa, Chitose and Tomakomai), 1.8% from other cities in Hokkaido and 3.9% from outside Hokkaido [
18].
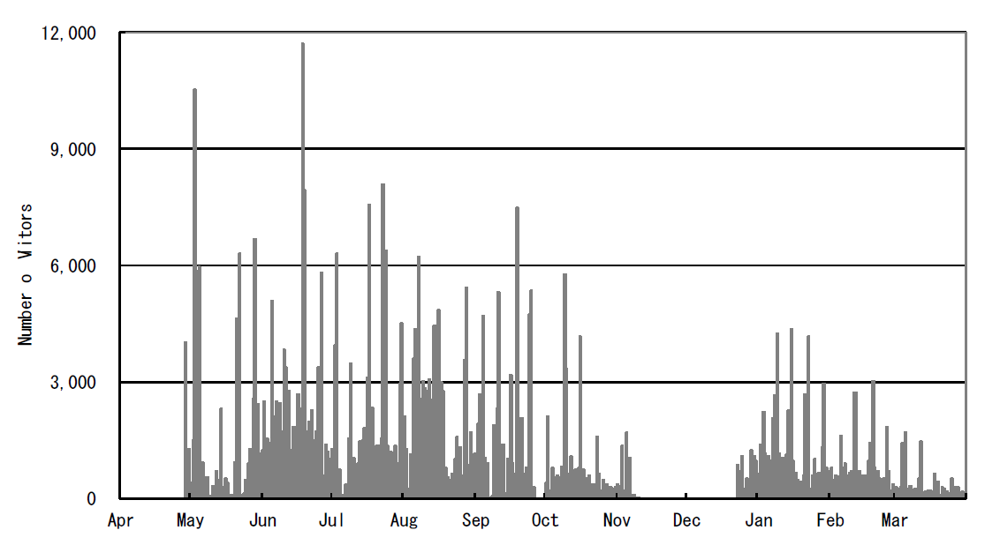
Various types of recreational facilities have been installed to attract visitors from all over. The year the park opened for the first time, it was closed in winter. However, the Hokkaido Development Agency facilitated improvement of parks for winter use in 1985 and the Takino Park started to operate in the winter season from January 1986. They installed facilities for winter sports such as snow shoeing, skiing and sleighing, taking full advantage of the park’s location, geography and scale. Today Takino Park operates in a two-season system composed of the green season and the snow season. The approximately 200-day green season starts in April (spring) just before the holidays (usually on 20 April) and ends at the beginning of November (autumn) when it starts to snow (usually on 10 November). The approximately 100-day snow season starts in late December when the land is covered with snow (usually on 23 December) and ends at the end at the fiscal year (usually on 31 March).
2.2. Data and Analysis
We used documents provided by the Parks and Recreational Foundation Takino Management Center, which contains daily administrative records and the number of visitors from 2002 to 2005. Records include “fiscal year”, “date”, “day of the week”, “holiday”, “season”, “the number of visitors”, “weather” and “temperature (recorded at the center of the park at 12 am)”. In terms of the number of visitors, we only included day visitors and excluded overnight visitors who stayed in a campsite or a hostel for students. The operations and records of the park administration are based on the fiscal year. Therefore, the analyses of the data in this article were done by the fiscal year (hereinafter referred to as FY, April to March). Weather conditions and operation periods varied slightly from year to year in Takino Park. In order to obtain reliable results from the analyses, a long-term analysis was conducted for four years, from FY 2002 to FY 2005. We analyzed details about the effect of the weather conditions at the departing place, the weather forecast and the school holidays only in FY 2005.
2.2.1. Long Term Analysis of Daily Fluctuation
Visitor statistics were analyzed from FY 2002 to FY 2005. We estimated fluctuating factors related to holidays and meteorological conditions referring to previous studies, and then conducted multiple regression analyses using stepwise selection of variables for each season. Variables are listed in Table 1. Dummy variable of “Saturday” and “Sunday and Holidays” were employed. As for meteorological variables, a dummy variable of “Rain in Takino”, “Snow in Takino” and a variable of “Temperature (°C)” (recorded at 12 am) were employed.
Table 1.
List of variables, average and days for each analysis.
Table 1.
List of variables, average and days for each analysis.
| Variables | in 2002–2005 | in 2002–2005 | in 2005 | in 2005 |
|---|
| Number of days for dummy variables, and the average of temperature, snowfall and depth of snow of the measured individual date. |
| Saturday | 116 | 56 | 28 | 14 |
| Sunday and Holidays | 152 | 77 | 37 | 19 |
| Rain in Takino | 225 | – | 46 | – |
| Snow in Takino | – | 163 | – | 39 |
| Temperature (°C) | 17.24 | −1.08 | 17.91 | −1.18 |
| School Vacation | – | – | 30 | 32 |
| No Rain but Forecasted | – | – | 20 | – |
| Rain in Sapporo | – | – | – | 5 |
| No Snowing but Forecasted | – | – | – | 31 |
| Amount of Snowfall (cm) | – | – | – | 4.97 |
| Depth of Snow (cm) | – | – | – | 62.10 |
| Total Days | 811 | 398 | 196 | 99 |
2.2.2. Daily Fluctuation in One Year
In FY 2005, there were 196 days in the green season and 99 days in the snow season. We conducted multiple regression analyses using stepwise selection of variables for each season. As for holiday related variables, such as in the case of the long-term analysis, dummy variables of “Saturday” and “Sunday and Holidays” were employed. As for weather related variables, dummy variables of “Rain in Takino”, “Snow in Takino” and “Temperature” were added. To analyze daily fluctuation in FY 2005, some variables, which seemed to be fluctuation factors, were added. A dummy variable of “School Vacation” was added, which meant long vacations in kindergartens, elementary and junior high schools (i.e., two week spring vacation from the end of March to the beginning of April, one month summer vacation from the end of July to mid-August and one month winter vacation from late December to mid-January). In order to consider the impact of the weather condition at departure site, dummy variables of “Rain in Sapporo”, “Snow in Sapporo”, and variables of “Amount of Snowfall (cm)” and “Depth of Snow (cm)” were introduced. The meteorological data were taken from the record of Meteorological Agency’s Sapporo observatory, which is located in the center of Sapporo city. In order to analyze the effect of weather forecast, dummy variables of “No Rain but Forecasted” (1 for days when it was forecasted to rain in Takino Park, but did not) and “No Snowing but Forecasted” (1 for days when it was forecasted to snow in Takino Park, but did not) were added. The weather forecast data were gained from the day-old evening papers of Hokkaido News Paper (Hokkaido Shimbun). When evening papers were not published, we checked the morning papers of the day or the previous day.
Variables, which cover less than 5% of surveyed days may destabilize the model. Snow related variables in the green season and rain related variables in the snow season were all removed in the analysis.
For the green season, variables of “Saturday”, “Sunday and Holidays”, “School Vacation”, “Rain in Takino”, “No Rain but Forecasted”, and “Temperature (°C)” were selected. For the snow season, variables of “Saturday”, “Sunday and Holidays”, “School Vacation”, “Snow in Takino”, “Rain in Sapporo”, “No Snowing but Forecasted”, “Temperature (°C)”, “Amount of Snowfall (cm)” and “Depth of Snow (cm)” were selected.
4. Conclusions
Suburban parks in northern cities attract visitors especially in summer and mid-winter. Around 500,000 visitors visit Takino Park every year. However the daily number of visitors varies considerably. To predict the fluctuation of the number of visitors in Takino Park, several factors were selected both from social conditions and from meteorological conditions in the multiple regression analyses using stepwise selection of variables. The results indicated that the effect of the same factors differed depending on season.
In Takino Park, the fluctuation factors of the number of visitors varied by season. For example, “Temperature” was a factor, which increased the number of visitors in the green season, while it had the opposite effect in the snow season. The higher temperatures could attract more visitors in spring and summer, but less in winter because the snow would melt, worsening the conditions for winter sports. The factors identified to be influential in summer were not completely the same as those in winter. Weather forecast affected the number of visitors in summer, while factors such as school vacation, rain at departure site and depth of snow were influential only in winter. Hadwen
et al. (2011) pointed out the effect of climatic factors on the seasonal patterns of visits, but did not find the driving factors in alpine and sub-alpine areas [
12]. Since there has been less research comparing visiting patterns in snowy regions and non-snowy regions, these differences of climatic effects are thought to be characteristic of fluctuations in numbers of visitors in parks and open spaces in snowy cold areas.
Similar to previous studies, this study shows that the number of visitors was larger on fine weekends and holidays. The influence of the day of the week, especially Sunday and holidays, was greater than that of weather conditions. The day of the week has been known as affective factor on the number of visitors in inner- and sub-urban open spaces [
8,
11,
14,
15], compared to remote protected areas [
12]. The reason why the temperature had a slight impact might stem from the fact that we analyzed the green season and the white season separately. Though it is better to visit parks on a relatively less crowded fine day, most people are not necessarily able to visit parks on such ideal days. This means there is a possibility of conflicts arising among visitors and congestion in suburban natural recreations sites on weekends compared to remote areas [
3]. Managers should know these fluctuations to predict the possibility of conflicts arising among visitors.
As expected, we found that the weather forecast and the weather at the departure site affected numbers. In the green season, when it was forecasted to rain on the previous day, the number of visitors decreased even if it turned out to be a fine day. Rain at the departure site affected the decision of the people thinking to visit the park in winter. Given that there is a distance between the park and visitors’ dwelling areas, the weather of the park is not always similar to that at dwelling areas. Besides, visitors become more concerned about the weather forecast when planning a visit. Visitors to suburban forests might have different decision-making factors and behaviors from visitors to urban forests. If people can get updated information on actual weather conditions at the park, they might choose the day as they desire. Providing updated information via websites or some social network systems would improve visitation patterns. There are not many parks and forests, which monitor visitations and utilize the results of visitor surveys for their management, especially in Japan. Although it is not clear how far updated information is now being utilized and what kind of effect it has on park management, such information could help managers to understand the uncertainty of visitor conflicts and congestions, and give visitors more freedom of choice for their decisions. Updated weather forecasts are already available for ski destinations, and these systems could be useful for suburban park visitors as well.
Because our analyses were limited only to one park, further researches in other parks and the comparison of results from different parks are necessary to further discuss the relevant characteristics of suburban open spaces and the seasonal differences. Our research was based on the actual visitation patterns. It did not follow the visitor’s decision-making processes. To consider the improvements and reinforcements for the provision of on-site information, it is necessary to research the information sources and the determining factors of visitors’ decisions.


